Embed Size (px)
Citation preview

Seventh International Conference on CFD in the Minerals and Process Industries CSIRO, Melbourne, Australia 9-11 December 2009
Copyright © 2009 CSIRO Australia 1
SIMULATION OF THE FILLING OF POLYETHYLENE- TEREPHTHALATE- BOTTLES (PET) WITH A VOLUMETRIC SWIRL CHAMBER VALVE (VODM 40355)
ON THE BASIS OF CALCULATION MODELS AND EXPERIMENTS
Karl HAIN1, Harald WELS2, Martin MUHR1
1 University of Applied Sciences, 94469 Deggendorf, GERMANY 2 KRONES AG, 93073 Neutraubling / Regensburg, GERMANY
ABSTRACT This article is about the conduction of practical experiments and an application of a CFD-modelling system in the process industry, in this specific case the beverage industry. Nowadays within the beverage industry PET bottles gain more and more market share and are widely used thus replacing bottles made of glass completely in some areas. The overall operation efficiency of bottling plants depends to a high degree on the product filling process. Therefore the research which was carried out comprises both the CFD-simulation and also the validation of results by realistic experimental data. Especially the simulation and validation of the product flow when PET-bottles are to be filled was performed, taking into consideration physical and mathematical aspects.
NOMENCLATURE PET Polyethylene-Terephthalate VODM Volumetric filling mode (Durchfluss-Messung) FVM Finite Volume Method ε turbulent dissipation
1. INTRODUCTION Within bottling plants the filling process of specific products into PET bottles is the key process within the whole process chain. Therefore the beverage industry faces a big challenge to optimize the filling of different beverages (e.g. mineral water, water containing CO2, juice, juice with pulp, soft-drinks, spirits, milk etc.) into bottles. To optimize the filling process and to gain knowledge about the influences of the various parameters involved, e.g. geometries of the bottles, product properties, product filling speed, rotation of bottling plant units etc., a systematic analysis is necessary. It is a fact that the filling results are quite variable, which means they differ from bottle to bottle. Therefore one needs to investigate why some of the bottles are filled differently compared to others when using the specific swirl valve VODM 40355 [1] which is used for filling carbonated drinks. The present investigation comprises practical experiments to record problems arising during the filling of PET-bottles, and the modelling and simulation of the filling process with FVM/CFD. By conducting practical experiments information about the precise failure influences are gained and the outcome of theoretical simulations can be proved. Afterwards, based on reliable simulation results, parameter changes, in order to optimize
the filling process, can be done more easily. Therefore, the aims of the present research are: Measuring of bottle contours and developing a 3D-
model. Conducting practical experiments considering the
variation of process parameters. Modelling valve and bottle geometry and afterwards
modelling of simulation cell grid. CFD-simulations considering the variation of geometric
properties of bottles, machine rotation and various product properties like surface tension, contact angle etc.
Recording failure reasons for filling and localisation of disturbance variables.
Validation and verification of results.
2. DESCRIPTION OF FILLING PROCESS AND PRACTICAL EXPERIMENTS The filling process is performed by a so-called volumetric filling mode whereby the volume of the fluid is measured by electronic flow measurements. The advantage is that the bottled volume is always reproducible and exactly the same. At the beginning of the filling process a specific gas (normally CO2) is pumped into the bottle to eliminate pre-existing oxygen and also to pressurize the bottle controllably (Fig. 1, left). The pressure is retained for a while and then the filling valve is activated in order to allow the filling medium to flow into the bottle via a swirl insert (Fig. 1, centred). The driving force for the flowing medium is the difference of height between bottle and a toroidal reservoir, from where the medium is channelled into the bottle. While filling, i.e. after approximately 0.2 seconds, the return gas pipe is opened by means of orifice plates allowing the control over the remaining bottle pressure. The process concludes with measures to reduce turbulences like adaptation / reduction of filling velocity and pressure [2].

Copyright © 2009 CSIRO Australia 2
Figure 1: Filling process and elements. A basic prerequisite for the whole process is to provide an appropriate spin flow of the medium [3]. The spin is a measure for a flowing medium to retain radial velocity and, therefore, analogous to an impetus prevailing at translational movements. Spin flow therefore is represented by a translational movement with additional radial component. This is in general realized by guide blades which induce a velocity component into a circumferential direction. The cause of flow acceleration in radial direction is a force effective at the circumferential blades and producing a momentum at the support. In this case a swirl insert is used within the valve to provide the spin flow of the medium (Fig. 1, right). To acquire knowledge about the filling process, the various failure influences and, for the purpose of validation and verification of simulation results, practical experiments were carried out. Fig. 2 shows the testing facility which allows the filling of various bottles. Actual inner bottle contours were scanned with a 3D coordinate measuring device. For taking pictures a high speed camera was used. An appropriate filling process is characterized by a medium running down along the inner bottle wall without any disturbances (Fig. 2, lower / left). The visual examination of a correct filling requires a lot of experience and in general it can be stated that the appearance of the fluid flow should be without any flow disruptions and hence be laminar and smooth. When filling a medium containing CO2 this is especially important because the amount of chemically bonded gas depends on the process parameters pressure, temperature and an appropriate fluid flow. If flow disruptions occur (see Fig. 2, lower / right) then gas bubbles emerge within the medium which in succession constitute as foam. This will eventually give rise to inefficient effects like frothover of bottles respectively the need to extend the phase for reducing turbulences of the medium.
Figure 2: Testing plant and filling examples.
3. SIMULATION OF FILLING PROCESS AND COMPARISON WITH EXPERIMENTS
3.1 Simulation Cell Grid / Net Generation In order to conduct computational fluid dynamic simulations it is necessary to generate the geometric models in an appropriate way from which a net of finite volumes can be derived. The appropriateness of the initial cell grid is a prerequisite for the quality of the results. Fig. 3 shows the final generated net for a specific part of the swirl chamber consisting of 1.4 million segments whereby additionally 700.000 cells are required for a PET-bottle. In this case the pre-processor GAMBIT [4] was used which allows the use of various basic volume elements as being tetrahedrons respectively hexahedrons. For the net generation hexahedrons were employed providing some advantages compared to applying tetrahedrons, i.e. a smaller number of required elements, a reduced relative cell distortion and a more continuous boundary area of relevant geometries. This affects especially the quality of calculation results because floating media respectively streamlines are generally not characterized by sharp-edged boundaries.

Copyright © 2009 CSIRO Australia 3
Figure 3: Net generation of inlet and bottle geometry.
The process of net generation had to take also into account the following measures: Specific areas of interest, for example those with
expected changes of pressure or velocity, require a more accurate net generation in order to gain correct results using as few cells as possible.
Some portions of geometry require adaptation, possibly decomposition or usage of element sizing-functions in order to realize the net generation.
Geometries of lower interest, i.e. dependent upon having more or less influence on the fluent, have to be omitted which affects calculation time positively.
Net generation results have to be checked by software tools to detect connectivity defects of portions of unlinked elements.
Net generation results have to be checked by software tools to detect the position of volume elements with an inappropriate relative distortion.
3.2 Simulation with Fluent The numerical calculation of fluid dynamic problems is based on continuum mechanic fundamentals like the mass conservation described by continuity equation, Navier-Stokes-equation, energy conservation and turbulence models of fluid dynamics [5]. Within technical fluidal applications the medium flow must be in general considered turbulent and not laminar, i.e. the Reynolds number reaches specific finite values. For a numeric calculation of non-laminar effects, turbulence models have to be employed. In this case the K-ε-model of the system FLUENT [4] was used, that is a two-equation model whereby the differential equation for the description of turbulence energy is enhanced by a second equation which describes the turbulence dissipation ε. To minimize additional calculation effort and probably convergence problems, boundary areas are neglected because only little turbulence effects occur there. The volume of fluid model (VOF) represents a numerical model for the calculation of multiphase fluid flows. This
allows the simulation of two immiscible fluids with different density properties. The VOF model therefore usually is used for the filling of bottles, movement of fluids containing bubbles, open jet nozzles etc. The density jump represents for example the boundary area between two fluids. To conduct a CFD-simulation several preparing measures and adjustments for computation have to be taken into account, that is: Check and scaling of the generated net. Possibly transfer of tetrahedron net into polyhedron
net in order to reduce number of cells. Specification of several phase specific fluid properties. Definition of initial boundary conditions like inlet
pressure distribution, mass flow rate, etc. Adjustments with respect to iteration of computation
like quantity and number of time increments in order to optimize convergence characteristics that are shown in scaled residuals.
Preparing of a journal file for interactions while computation is running, i.e. opening / closing of valves.
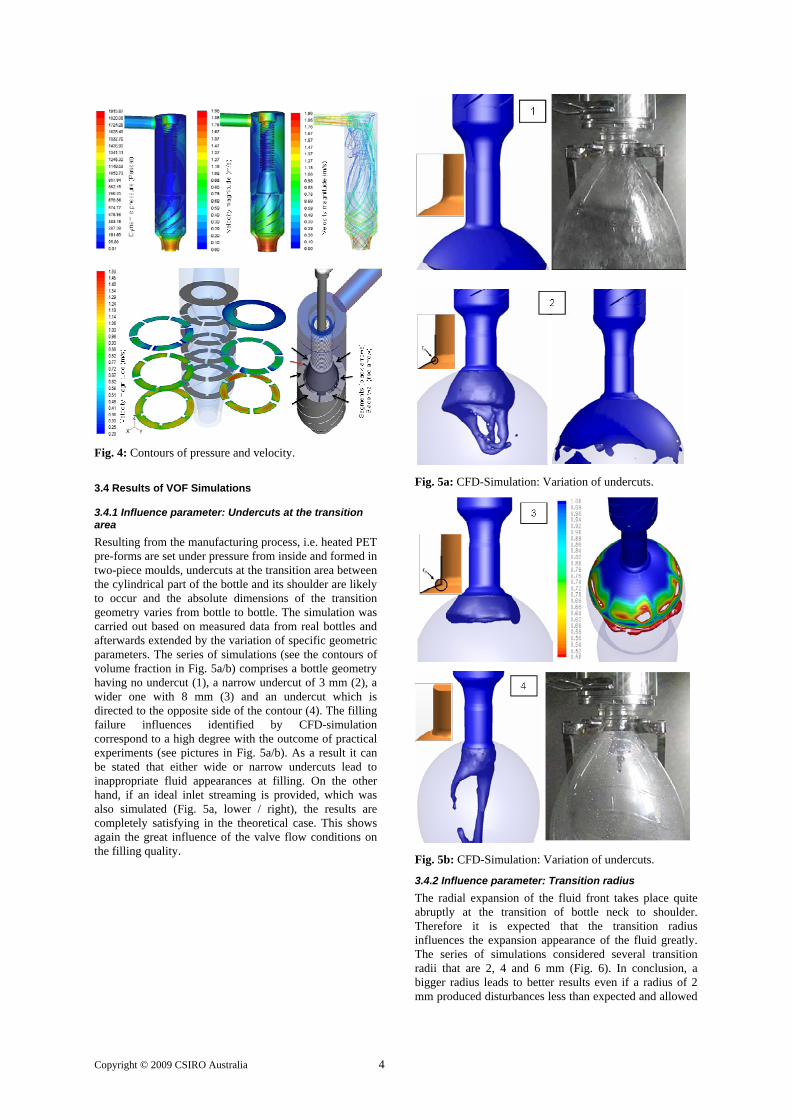
3.3 Results of Stationary Simulation At first the pure fluid streaming through the inlet pipe system, turn area, bellow and swirl insert valve is simulated in order to monitor the distribution of the dynamic pressure and velocity magnitude along the paths and cross sections. The boundary conditions were defined to be 1013 hPa (working pressure), 288 K (working temperature) and 1.22 m/s (inlet velocity). The simulation revealed that the pressure and velocity rates have significant differences along the inlet elements (Fig. 4, upper). Furthermore the contours of velocity magnitude within some specific cross sections of the swirl chamber valve were examined more detailed (Fig. 4, lower). Despite equally designed guide blades in this area the mass flow rates vary from 0.0403 kg/sec (135%) to 0.0299 kg/sec (100%). These differences will probably result in different radial velocities of the fluid streams after leaving the valve, mixing among each other and therefore have a large effect afterwards on the filling quality.
Copyright © 2009 CSIRO Australia 4
Fig. 4: Contours of pressure and velocity.
3.4 Results of VOF Simulations
3.4.1 Influence parameter: Undercuts at the transition area Resulting from the manufacturing process, i.e. heated PET pre-forms are set under pressure from inside and formed in two-piece moulds, undercuts at the transition area between the cylindrical part of the bottle and its shoulder are likely to occur and the absolute dimensions of the transition geometry varies from bottle to bottle. The simulation was carried out based on measured data from real bottles and afterwards extended by the variation of specific geometric parameters. The series of simulations (see the contours of volume fraction in Fig. 5a/b) comprises a bottle geometry having no undercut (1), a narrow undercut of 3 mm (2), a wider one with 8 mm (3) and an undercut which is directed to the opposite side of the contour (4). The filling failure influences identified by CFD-simulation correspond to a high degree with the outcome of practical experiments (see pictures in Fig. 5a/b). As a result it can be stated that either wide or narrow undercuts lead to inappropriate fluid appearances at filling. On the other hand, if an ideal inlet streaming is provided, which was also simulated (Fig. 5a, lower / right), the results are completely satisfying in the theoretical case. This shows again the great influence of the valve flow conditions on the filling quality.
Fig. 5a: CFD-Simulation: Variation of undercuts.
Fig. 5b: CFD-Simulation: Variation of undercuts.
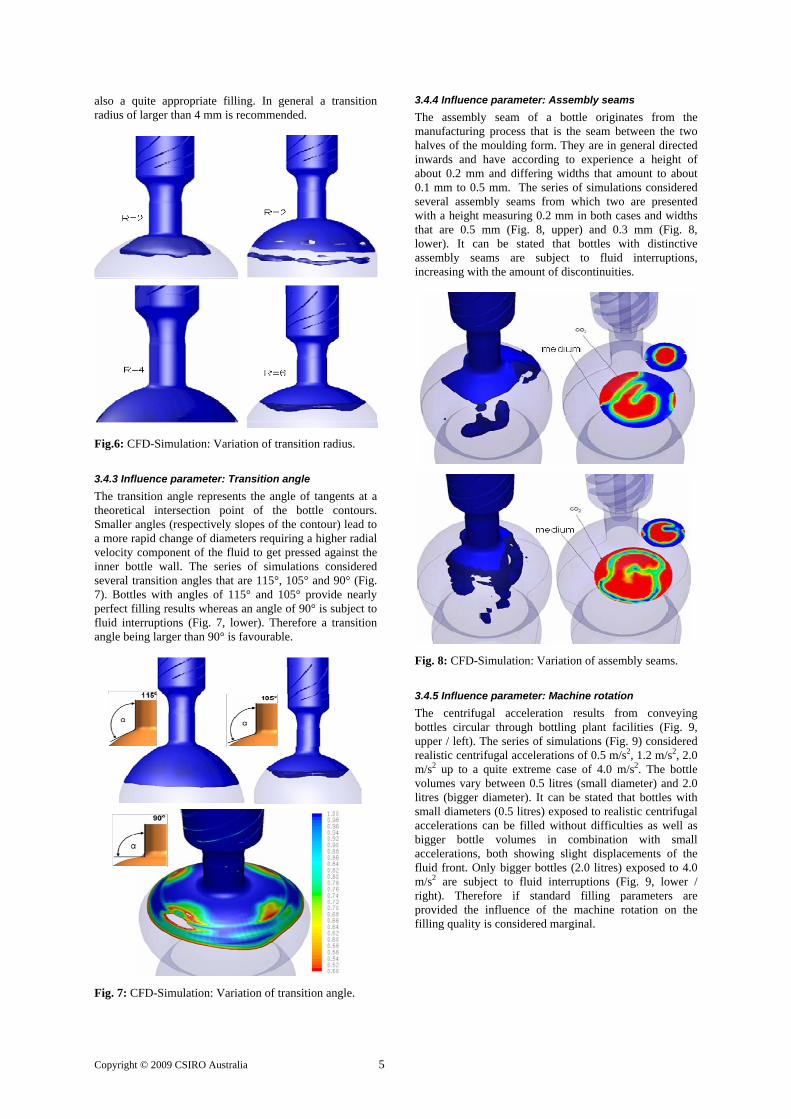
3.4.2 Influence parameter: Transition radius The radial expansion of the fluid front takes place quite abruptly at the transition of bottle neck to shoulder. Therefore it is expected that the transition radius influences the expansion appearance of the fluid greatly. The series of simulations considered several transition radii that are 2, 4 and 6 mm (Fig. 6). In conclusion, a bigger radius leads to better results even if a radius of 2 mm produced disturbances less than expected and allowed
Copyright © 2009 CSIRO Australia 5
also a quite appropriate filling. In general a transition radius of larger than 4 mm is recommended.
Fig.6: CFD-Simulation: Variation of transition radius.
3.4.3 Influence parameter: Transition angle The transition angle represents the angle of tangents at a theoretical intersection point of the bottle contours. Smaller angles (respectively slopes of the contour) lead to a more rapid change of diameters requiring a higher radial velocity component of the fluid to get pressed against the inner bottle wall. The series of simulations considered several transition angles that are 115°, 105° and 90° (Fig. 7). Bottles with angles of 115° and 105° provide nearly perfect filling results whereas an angle of 90° is subject to fluid interruptions (Fig. 7, lower). Therefore a transition angle being larger than 90° is favourable.
Fig. 7: CFD-Simulation: Variation of transition angle.
3.4.4 Influence parameter: Assembly seams The assembly seam of a bottle originates from the manufacturing process that is the seam between the two halves of the moulding form. They are in general directed inwards and have according to experience a height of about 0.2 mm and differing widths that amount to about 0.1 mm to 0.5 mm. The series of simulations considered several assembly seams from which two are presented with a height measuring 0.2 mm in both cases and widths that are 0.5 mm (Fig. 8, upper) and 0.3 mm (Fig. 8, lower). It can be stated that bottles with distinctive assembly seams are subject to fluid interruptions, increasing with the amount of discontinuities.
Fig. 8: CFD-Simulation: Variation of assembly seams.
3.4.5 Influence parameter: Machine rotation The centrifugal acceleration results from conveying bottles circular through bottling plant facilities (Fig. 9, upper / left). The series of simulations (Fig. 9) considered realistic centrifugal accelerations of 0.5 m/s2, 1.2 m/s2, 2.0 m/s2 up to a quite extreme case of 4.0 m/s2. The bottle volumes vary between 0.5 litres (small diameter) and 2.0 litres (bigger diameter). It can be stated that bottles with small diameters (0.5 litres) exposed to realistic centrifugal accelerations can be filled without difficulties as well as bigger bottle volumes in combination with small accelerations, both showing slight displacements of the fluid front. Only bigger bottles (2.0 litres) exposed to 4.0 m/s2 are subject to fluid interruptions (Fig. 9, lower / right). Therefore if standard filling parameters are provided the influence of the machine rotation on the filling quality is considered marginal.

Copyright © 2009 CSIRO Australia 6
Fig. 9: CFD-Simulation: Variation of machine acceleration and bottle volumes.
3.4.6 Influence parameter: Product properties A further influence parameter for filling quality is considered to be the surface tension of a fluid and contact angle [6, 7] between fluid and counterpart which could be PET material or glass. The surface tension, which was varied between 0.073 N/m (water), 0.050 N/m (milk) and 0.023 N/m (ethanol), exerts minor influences on the filling front of the fluid; only water tends to stay more continuous (Fig. 10a).
Fig. 10a: CFD-Simulation: Variation of fluid surface tension.
When bottles with a transition angle of 90° are filled, both water (0.073 N/m) and a theoretical fluid (0.0073 N/m) tend to exhibit volume fractions (Fig. 10b, upper). The influence of contact angle, amounting to 90° (water / PET) respectively 25° (water / glass), is depicted in Fig. 10b
(lower). It reveals that small contact angles lead to appropriate filling results even if unfavourable bottle transition angles (90°) are used.
Fig. 10b: CFD-Simulation: Variation of transition angle and contact angle.
3.4.7 Influence parameter: Fluid flow velocity Currently the filling plant allows the application of two filling velocities, that is “fast” and “slow”. A fast filling velocity leads to appropriate filling characteristics, however not at the beginning of the process when the front of the medium gets disturbed due to inertia of the medium. So a slow velocity is advisable at the beginning followed by a fast filling at a later stage. This process is not yet CFD-simulated but adequately controllable and verified by practical experiments.
4. CONCLUSION The aspired objectives of this research, i.e. to identify essential influence parameters and their importance when filling PET bottles within bottling plants, were achieved to a high degree. The CFD-simulation results are quite in accordance with practical experiments. It can be stated that the most influencing factors with respect to filling quality are of a geometric nature. Therefore, inappropriate geometries of the bottles should be avoided respectively specific parameters optimized. Nevertheless, there is room to optimize the whole process, for example to achieve uniformly distributed mass flow rates which in general has a positive effect. Also the influence of bottle deformation caused by the working pressure itself over the period of filling has to be investigated. A particular objective for the

Copyright © 2009 CSIRO Australia 7
future should be to capture the complete 3D geometry of the inner bottle wall, including design decoration, after manufacturing and simulate filling operations in advance.
ACKNOWLEDGEMENT The work described in this paper was supported by the company KRONES AG, Neutraubling, Germany.
REFERENCES [1] KRONES Media Suite, (2008), „Volumetric
VODM–PET-Abfüllphasen“,Krones AG, Böhmerwaldstr., 93073 Neutraubling, http://www.krones.com.
[2] BLUEML, S.; FISCHER, S., (2004), „Handbuch der Fülltechnik – Grundlagen und Praxis für das Abfüllen flüssiger Produkte“, Behr’s Verlag, ISBN 3-89947-089-3.
[3] BÖSWIRTH, L., (2007), „Technische Strömungs-lehre“, 7. Auflage, Vieweg-Verlag, ISBN 978-3-8348-0272-9.
[4] ANSYS Germany GmbH, FLUENT Germany GmbH; http://www.ansys.com, http://www.fluent.com.
[5] OERTEL, H.; LAURIEN, E., (2003), „Numerische Strömungsmechanik – Grundgleichungen – Lösungsme-thoden – Softwarebeispiele“, 2. Auflage, Vieweg Verlag, ISBN 3-528-03936-1.
[6] DALAL, EDDY N., (1987), „Calculation of Solid Surface Tensions“, Langmuir: American Chemical Society journal of surfaces and colloids, vol.3, pp.1009-1015.
[7] BOHL, W., (1991), „Technische Strömungslehre“, 9. Auflage, Vogel Verlag, ISBN 3-8023-0036-x.