Embed Size (px)
Citation preview
SIMULATION OF THE
FRACTIONAL FREQUENCY REUSE
TECHNIQUE
Student: Alexandru-George Plopeanu
Supervisor: Dr Khairi Hamdi
Date of submission: 30/04/2013
Submitted to the University of Manchester in partial fulfilment of the
requirements for the degree of BEng(Hons) Computer Systems Engineering
Project report for
Third Year Project
in the School of
Computer Science,
at the University of
Manchester

Abstract
This work examines the Fractional Frequency Reuse (FFR) technique used in 3GPP (3rd
Generation Partnership Project) Long Term Evolution (LTE) and Worldwide Interoperability
for Microwave Access (WiMAX) networks. Both LTE and WiMAX employ Orthogonal
Frequency Division Multiple Access (OFDMA) due to its success in handling Inter-Symbol
Interference (ISI) and flexibility in resource allocation. However, OFDMA based wireless
networks are affected by Co-Channel Interference (CCI) or Inter-Cell Interference (ICI) which
reduce the coverage and the data rates for users. FFR has been proposed as an Inter-Cell
interference Coordination (ICIC) technique. The principle behind it is that cells are
partitioned in two regions: centre and edge. In the centre area a reuse factor of one is
applied while in the edge area a higher reuse factor is considered. The technique is
evaluated through a series of simulations in which a series of parameters such as Signal to
Interference plus Noise Ratio (SINR), channel capacity, network throughput and user
satisfaction are calculated. The results of these simulations are compared with the results
obtained in a series of research papers in order to establish their accuracy. The simulations
that are carried focus on the downlink of the network. The project was developed in a team
as part of the Next Generation Mobile Networks theme.

Table of Contents
Abstract ................................................................................................................................................... 1
Acknowledgments ................................................................................................................................... 3
Chapter1. Introduction ............................................................................................................................ 4
Chapter 2. Theoretical aspects ................................................................................................................ 5
2.1 Motivations and Objectives ........................................................................................................... 5
2.2 Orthogonal Frequency Division Multiple Access (OFDMA) ........................................................... 5
2.3 Fractional Frequency Reuse technique ......................................................................................... 6
2.4 Performance analysis metrics ....................................................................................................... 8
2.4.1 Signal/Carrier to interference plus Noise Ratio (SINR/CINR) ................................................. 8
2.4.2 Channel capacity .................................................................................................................... 8
2.4.3 Throughput ............................................................................................................................. 9
2.4.4 User satisfaction ..................................................................................................................... 9
2.4.5 Outage probability .................................................................................................................. 9
2.4.6 Area spectral efficiency ........................................................................................................ 10
Chapter 3. Simulation Design ................................................................................................................ 10
3.1 System model .............................................................................................................................. 10
3.1.1 Interference model ............................................................................................................... 11
3.1.2 “Idealistic” FFR model .......................................................................................................... 14
3.1.3 “Realistic” FFR model ........................................................................................................... 16
3.2 Tools used .................................................................................................................................... 19
4. Results ............................................................................................................................................... 20
5. Conclusion, summary, future work ................................................................................................... 22
5.1 Conclusion ................................................................................................................................... 22
5.2 Summary...................................................................................................................................... 23
5.3 Future work ................................................................................................................................. 23
6. References ......................................................................................................................................... 26
Acknowledgments
First of all, I would like to thank my supervisor, Dr Khairi Hamdi for the full support he has
given me throughout this project period. I am grateful for the opportunity of having him as
my project supervisor. During this academic period, I have developed a lot of knowledge and
skills to which he contributed very much.
I would also like to thank my parents, Dorel and Georgeta for the unconditional love and
help they have given me throughout my life. Without their moral and financial support and
the education they provided me with, I would not have been able to be in the position of
writing this dissertation. Furthermore, special thanks to all my friends and relatives for their
support.
Last but not least, I would like to thank all the staff members at the University of
Manchester. During my three years of study, I have always received the best teaching,
personal and professional advice, and most of all, respect. The University of Manchester has
been an environment of which I was proud to be but also a place that made me feel wanted.

Chapter1. Introduction
The continuing development of technology has seen the immense growth of wireless
communications both in terms of technology and number of users. A statistic conducted by
the International Telecommunication Union (ITU) in 2011 has showed there were 6 billion
mobile subscriptions against a world population of 7 billion inhabitants [1]. System designers
are faced with the challenge of being able to provide increased data rates and reliable
coverage to this high number of users. This was the main goal of the recently released 4G
service. The initial specifications of 4G networks set the peak data rates at 1 Gbit/s for low
mobility users and 100 Mbit/s for high mobility users [2]. Two standards have been
developed: IEEE 802.16 Worldwide Interoperability for Microwave Access (WiMAX) [3] and
Third Generation Partnership Project Long Term Evolution (3GPP-LTE) [4]. Although, neither
of the two has yet managed to reach the data rate specifications set by ITU they have been
acknowledged as 4G providers [5]. Both services are based on Orthogonal Frequency
Division Multiplexing Access (OFDMA) technology. One of reasons why OFDMA was chosen
is that it offers a series of advantages such as its ability to reduce intersymbol interference
[6]. Furthermore, because the subcarriers are orthogonal inter-carrier interference can also
be avoided. Despite this, OFDMA is still affected by interference, co-channel interference
(CCI) or inter-cell interference being one example. The users most affected by this type of
interference are the ones situated at the edge of the cell. The WiMAX and 3GPP-LTE
standards consider three approaches to mitigate CCI: inter-cell interference randomization,
inter-cell interference cancellation and inter-cell interference coordination. [1][2] The main
idea of Inter-cell interference coordination (ICIC) techniques is to distribute the resources of
the network in a coordinated manner. This is done by applying certain restrictions to what
frequency resources can be available to the user at a point in time. The resources are
allocated by a reuse factor. By using a high reuse factor neighbouring cells receive different
sets of frequencies. Although the CCI is reduced, the frequency resources available are
limited so a middle solution has been discussed. Fractional frequency reuse (FFR) has been
proposed in both WiMAX and 3GPP-LTE standards [7][8] as an upgrade to the full cell reuse
factor. With FFR the bandwidth is divided in two parts each being allocated to one of the two
regions the cell is split into: an inner region with a reuse factor of 1 where the bandwidth can
be universally reused by all neighbouring cells and an outer region where the resources are
assigned using a higher reuse factor and cannot be reused by neighbouring cells.
In this study, the performance of the FFR technique is evaluated in the downlink of a
proposed cellular network model through a series of Monte Carlo Simulations. The main
objective of these simulations is to identify the optimal trade-off between the available
bandwidth and the level of CCI that needs to be limited. This is done by determining the best
reuse factor for each user. The areas of the inner and outer regions of the cell are evaluated
being a key in establishing the reuse factor.
This dissertation has been structured in five chapters. The first chapter is the introduction to
the project, Chapter 2 gives a theoretical description of the FFR technique and also the
performance analysis metrics that have been calculated. The next chapter, Chapter 3, gives
details of the system model that was used for the simulations as well as how the simulations
were developed. After this, in Chapter 4 the results that were obtained are presented and
interpreted. Finally, the dissertation ends with a summary of the whole project and a
discussion on future developments.
Chapter 2. Theoretical aspects
2.1 Motivations and Objectives
Mobile communications have come a long way in the past decades in terms of quality and
efficiency. If 1G networks were able to transmit voice messages with a speed of just 9.6 Kb/s,
gave a poor sound quality, were energy consuming and vulnerable to eavesdropping, 4G
networks will be to reach speeds of 1 Gb/s and provide support for a series of multimedia
applications such as live TV streaming. Furthermore, with the release of 4G, we will witness
the full use of packet switching in mobile networks which will bring an end to the circuit
switching technology deemed as inefficient. Both 3GPP and IEEE are working in developing
this service under International Mobile Communications – advanced (IMT-advanced)
standards. A version of the service has been released in a series of countries under the LTE
or WiMAX name.
The main goal in designing mobile networks has remained the same throughout time:
finding the most efficient way to use the limited radio spectrum available. In order for this to
be achieved, advanced algorithms and methods have to be developed. The focus of this
chapter is not to present the specific algorithms and methods for optimising the spectral
efficiency but to give an insight into the fundamental notions of one of the issues wireless
networks face, in particular OFDMA-based wireless networks and how this can be dealt with.
2.2 Orthogonal Frequency Division Multiple Access (OFDMA)
OFDMA is a modulation and multiple access technique used in next generation wireless 4G
networks, WiMAX and LTE. It is an upgrade of the Orthogonal Frequency Division
Multiplexing (OFDM) modulation technique. Like OFDM, OFDMA also separates the signal
into multiple orthogonal subcarriers. The subcarrier frequencies are chosen so that the
subcarriers are considered orthogonal. This eliminates the crosstalk effect between sub-
channels and removes the need for inter-carrier guard bands which offers wide radio
channels. The upgrade brought by OFDMA is that it can allocate a subset of subcarriers to
individual users and allows multiple access to be achieved. The frequency subcarriers are
separated into different subchannels which are assigned to multiple users for a period of
time. Bandwidth is efficiently used because of this. The principle of multiple access is similar
to the one employed by Code Division Multiple access (CDMA) where users experience
different data rates based on a code spreading factor. Furthermore, OFDMA can be
considered a combination between Time Division Multiple Access (TDMA) and Frequency
Division Multiple Access (FDMA) where users are allocated subcarriers (FDMA) in certain
time slots. The fact that multiple access is supported in both the time domain and the
frequency domain gives OFDMA a huge advantage over other modulation techniques.
Another advantage of OFDMA is that also like OFDM, it reduces intersymbol interference by
transmitting the orthogonal subchannels at a lower symbol rate.
However, OFDMA has some disadvantages. One of these disadvantages is the CCI. In order
for OFDMA to combat CCI, dynamic channel allocation has to be used with advanced
coordination algorithms for interfering cells. A study of CCI mitigation is the objective of this
dissertation and it is described in the next pages. Another disadvantage is the high peak to
average power ratio (PAPR) OFDMA can have. The PAPR is a measure that is equal to the
peak amplitude of the waveform squared divided by the root mean square (RMS) value
squared. Intercarrier interference and an increased Bit Error Rate (BER) appear as a result of
this. Also, OFDMA has a high sensitivity to frequency offsets as this affects the orthogonality
between the carriers.
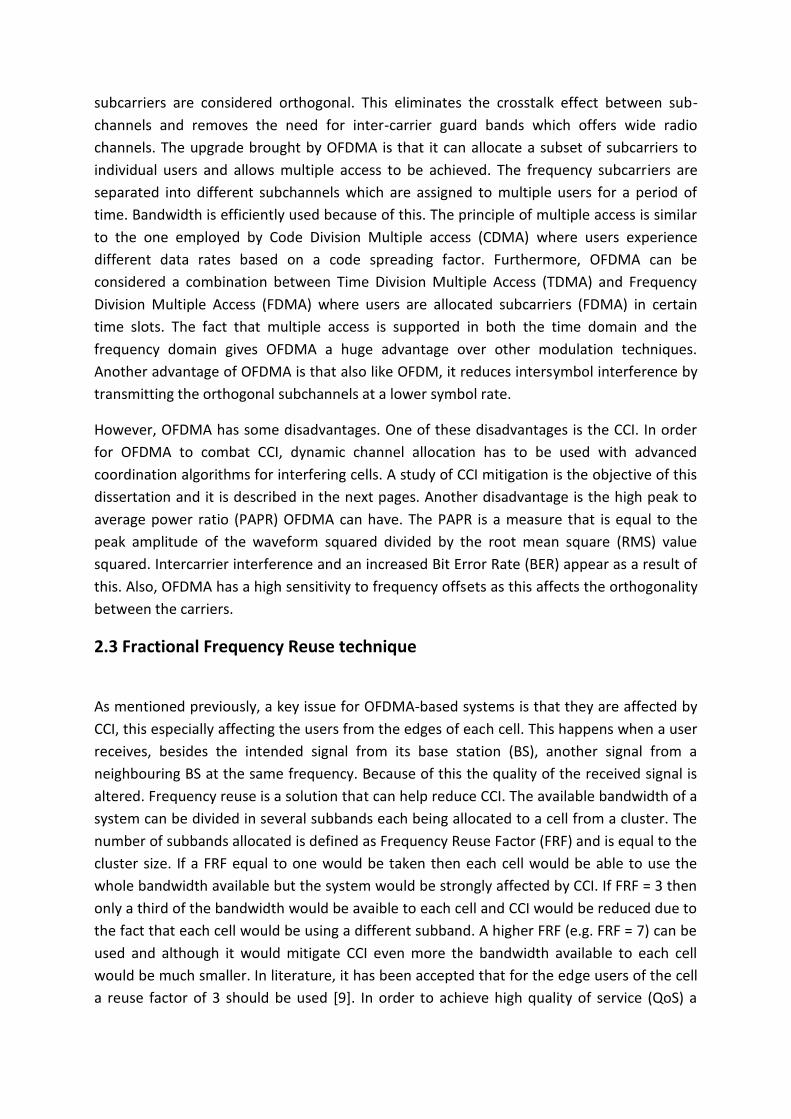
2.3 Fractional Frequency Reuse technique
As mentioned previously, a key issue for OFDMA-based systems is that they are affected by
CCI, this especially affecting the users from the edges of each cell. This happens when a user
receives, besides the intended signal from its base station (BS), another signal from a
neighbouring BS at the same frequency. Because of this the quality of the received signal is
altered. Frequency reuse is a solution that can help reduce CCI. The available bandwidth of a
system can be divided in several subbands each being allocated to a cell from a cluster. The
number of subbands allocated is defined as Frequency Reuse Factor (FRF) and is equal to the
cluster size. If a FRF equal to one would be taken then each cell would be able to use the
whole bandwidth available but the system would be strongly affected by CCI. If FRF = 3 then
only a third of the bandwidth would be avaible to each cell and CCI would be reduced due to
the fact that each cell would be using a different subband. A higher FRF (e.g. FRF = 7) can be
used and although it would mitigate CCI even more the bandwidth available to each cell
would be much smaller. In literature, it has been accepted that for the edge users of the cell
a reuse factor of 3 should be used [9]. In order to achieve high quality of service (QoS) a

tradeoff must be found between spectral efficiency and CCI coordination. FFR was
developed as a combination of the two FRFs: FRF = 1 which offers universal frequency reuse
and FRF = 3 which offers low CCI. The principle of the technique is to divide the cell in two
concetric regions: an inner region where the entire available bandwidth can be used (FRF =
1) and an outer region where the users can have only a third of the available bandwidth due
to them having a risk of exposure to CCI. However, that amount of bandwidth would be
guaranteed. FFR has been initially proposed in Global System for Mobile Communications
(GSM) networks [10] and has been adopted by both WiMAX and 3GPP-LTE standards [7][8].
The figures below represent: a) cellular system with universal reuse (FRF = 1); b) cellular
system with FRF = 3; c) cellular system that uses FFR;
a) FRF = 1 b) FRF = 3
c) FFR

2.4 Performance analysis metrics
2.4.1 Signal/Carrier to interference plus Noise Ratio (SINR/CINR)
SINR is used to measure the quality of the wireless network. It is defined as the ratio
between the power of the received signal and the sum of the noise power and the total
interference power:
∑
y – user
x – serving BS
Z – set of interfering base stations
Px – power transmitted by the BS
hxy – exponentially distributed fast fading power
Gxy – pathloss between user and base station
σ – noise power
If the system is interference limited then the noise power is ignored and Signal to
Interference Ratio (SIR) is calculated instead of the SINR. The mos dominant type of noise is
thermal noise that appears due to the electronic equipment. High values of SINR indicate a
system with low interference.
2.4.2 Channel capacity
A key aspect in determining the performance of the wireless is the capacity of the network,
the maximum data rate at which information can be sent over a channel. The capacity for
each is user is defined as [11]:
(
)
Δf - bandwidth allocated to each user; subband divided by the number of users
– constant for the target Bit Error Rate (BER)
;
The value taken for the BER in this simulation is 10-6.

2.4.3 Throughput
Throughput is defined as the average rate of successful information delivered over a
channel. The equation for throughput is [11]:
∑
βx,n – subcarrier n allocated to user x; βx,n = 1 if allocation is made otherwise it is equal to 0.
2.4.4 User satisfaction
User satisfaction (US) is another metric that helps evaluate the performance of the network.
It helps evaluate the user’s throughput compared to the maximum throughput in the area.
US is equal to the sum of the throughputs for all users divided by the product of the
maximum user’s throughput multiplied by the number of users [12].
∑
X – number of users
If US is closer to 1 then all the users in the area will have their throughputs almost equal.
However, if US is closer to 0 then there is a big variation in the throughput values.
2.4.5 Outage probability
Outage probability helps us measure the level of QoS in 4G networks. It is the probability of
a user’s SINR to drop under a defined threshold T:
The inverse of outage probability is the coverage probability which is the probability that a
user’s SINR will be greated than the threshold value given:
2.4.6 Area spectral efficiency
Area spectral efficiency is a measure of the number of users that can be allocated frequency
resources in a certain geographical area. It is the sum of the maximum average data rates
per unit bandwidth per unit area supported by a cell’s base station [13]:
∑
( )
D – reuse distance, distance between two base stations using the same set of frequencies
Chapter 3. Simulation Design
In order to assess the FFR technique a series of simulations are carried out. These
simulations need to take place in a certain environment. Because it is impossible to perform
them in real world conditions due to cost and complexity, for example radio propagation, a
theoretical system model is used. This model is an abstract representation of the real world
which contains only the required real world aspects. It is based on a series of assumptions
and algorithms. Due to the complexity of the calculations, computer software is used to
determine the key metrics. This chapter describes the system model, the simulations and the
tools that have been used.
3.1 System model
When considering an area full of mobile users, one of the most important details that has to
be taken into consideration is the position of the user. In reality, users can be, potentially,
located anywhere. Because of this, in order to achieve accurate results in the simulations
performed, every possible position of the user has to be taken into account. Monte Carlo
methods have been chosen for this project as they can deal with systems with multiple
degrees of freedom. They use repeated experiments with random numbers to solve
complicated integrals. In the simulations proposed, each user’s position is generated
through a probability density function (PDF).This is a function that shows the likelihood of a
variable having a certain value from a given interval. The probability of this happening is
given by an integral of the variable’s probability density over the interval. The Monte Carlo
method is then used to sample the PDF using random numbers generated by a computer
software. The main advantage of using Monte Carlo methods is that it gives a lot of

flexibility. Several assumptions can be made and changed on the same model which allows a
wider range of results to be determined.
The concept of cellular networks is to split the surface of the land in regular geometric
shapes such as hexagons, circles or squares. Although, the hexagonal grid model is mostly
used in research studies, in these simulations the cells have been considered to be circular
for analytical convenience and computational simplicity. However, in practice, cells have
irregular forms because of terrain and artificial structures.
In this project, an initial interference model was developed and then enhanced to help
calculate several variables for the FFR technique.
3.1.1 Interference model
The interference model was the foundation of the project. Before the analysis of the FFR
technique could be carried out, a study of the effect of CCI on mobile users had to be
performed. This was done by developing a system in which a mobile user would deliberately
be affected by CCI. In this system a user was generated in a cell and six interfering users
were generated in six other cells. The user could be generated anywhere across the cell
using a distance formula that uses random generated numbers. The users are independent
and uniformly distributed. The system produced was based on the one described by
Mohamed-Slim Alouini and Andrea Goldsmith in "Area Spectral Efficiency of Cellular Mobile
Radio Systems” [13]. Also, a series of assumptions were initially made. Every cell was
considered to have a circular shape and the same radius R, so all were equal in size. Base
stations were assumed to be located in the middle of each cell. The transmission powers of
all BSs were taken to be equal. Because of this, power did not play a role in calculating the
SINR. No noise, fading, shadowing were considered for the interference model. The pathloss
factor, Gxy was considered to be the distance between the user and the base station to the
negative power of a path loss exponent. This helps establish the loss of power of a signal
travelling through the atmosphere. The pathloss exponent can take a value of 2 for free
space propagation where the signal strength is not affected by any obstacles than the air and
4 for urban and suburban areas. For indoor areas, the exponent is even higher. For the
purposes of this project, the values taken for it are 2 and 4.
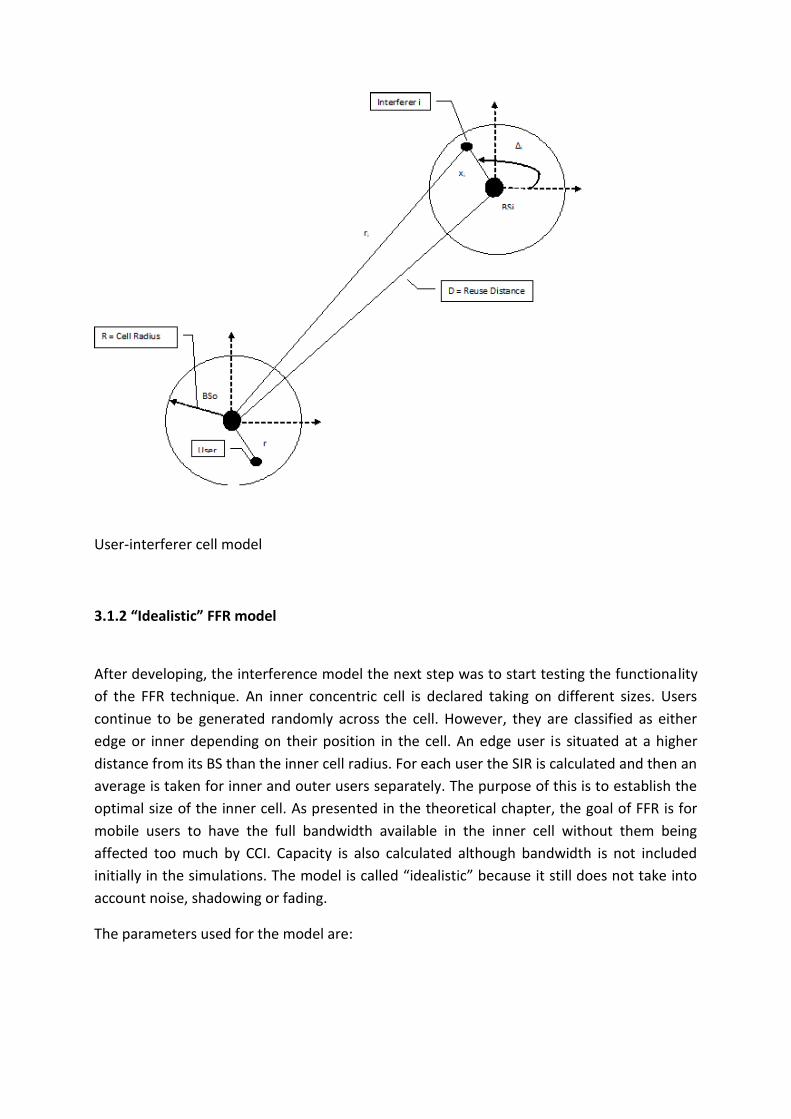
The user’s postion in the cell is defined by using PDF. The PDF of the user’s polar
coordinates(r, ϴ) in relation to its BS are:
R0 – the minimum distance the mobile user can be from the BS

The mobile user and the interferers are generated using the following algorithm:
i) The position of the user is randomly generated
a) A pseudorandom number u is generated. u is uniformly distributed in [0,1].
b) By applying the percentile transformation method [14] on the pr(r) PDF the user's
position is determined:
√
ii) The interferers are randomly generated using both the PDF equations described above
a) ui and vi pseudorandom and pseudoindependent numbers are generated. They
are uniformly distributed in [0,1].
b) The polar coordinates for the interferers are:
√
c) The distance of each interferer from its BS is:
√
iii) Calculate the SIR using the following formula:
∑
α – pathloss exponent
iv) Calculate the ASE with the formula below:
Ru – reuse distance
v) Repeat the process the process 10000 times in order to achieve accurate results.
The interference model parameters are:
Name of the parameter Value
Radius of cell (R) 200 m
Minimum distance (R0) 20 m
Pathloss exponent (α) 2, 4
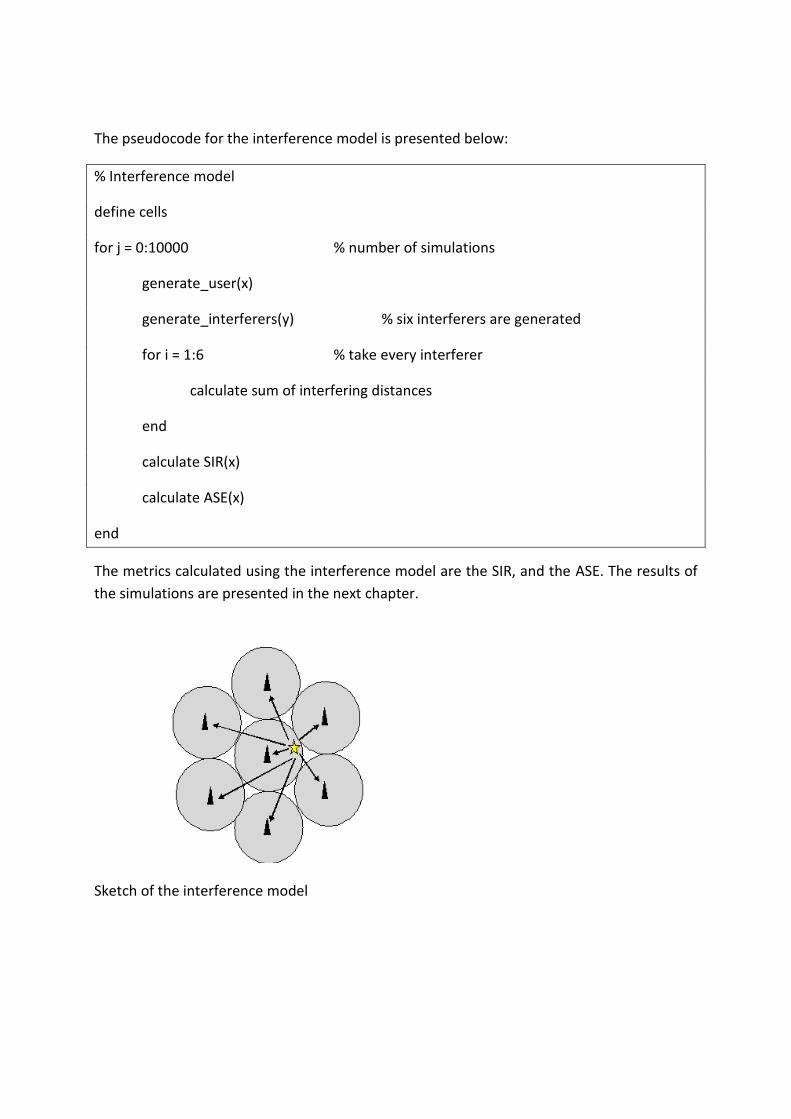
The pseudocode for the interference model is presented below:
% Interference model
define cells
for j = 0:10000 % number of simulations
generate_user(x)
generate_interferers(y) % six interferers are generated
for i = 1:6 % take every interferer
calculate sum of interfering distances
end
calculate SIR(x)
calculate ASE(x)
end
The metrics calculated using the interference model are the SIR, and the ASE. The results of
the simulations are presented in the next chapter.
Sketch of the interference model
User-interferer cell model
3.1.2 “Idealistic” FFR model
After developing, the interference model the next step was to start testing the functionality
of the FFR technique. An inner concentric cell is declared taking on different sizes. Users
continue to be generated randomly across the cell. However, they are classified as either
edge or inner depending on their position in the cell. An edge user is situated at a higher
distance from its BS than the inner cell radius. For each user the SIR is calculated and then an
average is taken for inner and outer users separately. The purpose of this is to establish the
optimal size of the inner cell. As presented in the theoretical chapter, the goal of FFR is for
mobile users to have the full bandwidth available in the inner cell without them being
affected too much by CCI. Capacity is also calculated although bandwidth is not included
initially in the simulations. The model is called “idealistic” because it still does not take into
account noise, shadowing or fading.
The parameters used for the model are:
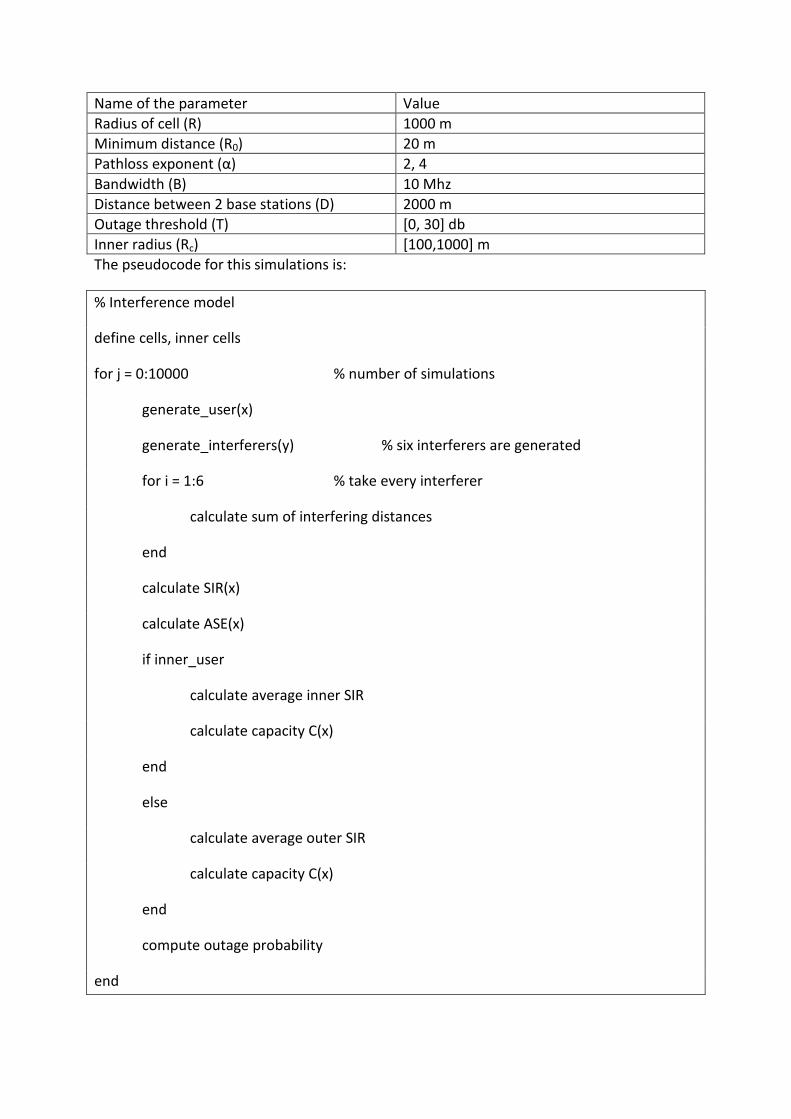
Name of the parameter Value
Radius of cell (R) 1000 m
Minimum distance (R0) 20 m
Pathloss exponent (α) 2, 4
Bandwidth (B) 10 Mhz
Distance between 2 base stations (D) 2000 m
Outage threshold (T) [0, 30] db
Inner radius (Rc) [100,1000] m
The pseudocode for this simulations is:
% Interference model
define cells, inner cells
for j = 0:10000 % number of simulations
generate_user(x)
generate_interferers(y) % six interferers are generated
for i = 1:6 % take every interferer
calculate sum of interfering distances
end
calculate SIR(x)
calculate ASE(x)
if inner_user
calculate average inner SIR
calculate capacity C(x)
end
else
calculate average outer SIR
calculate capacity C(x)
end
compute outage probability
end
The metrics calculated are: CIR, capacity and outage probability.
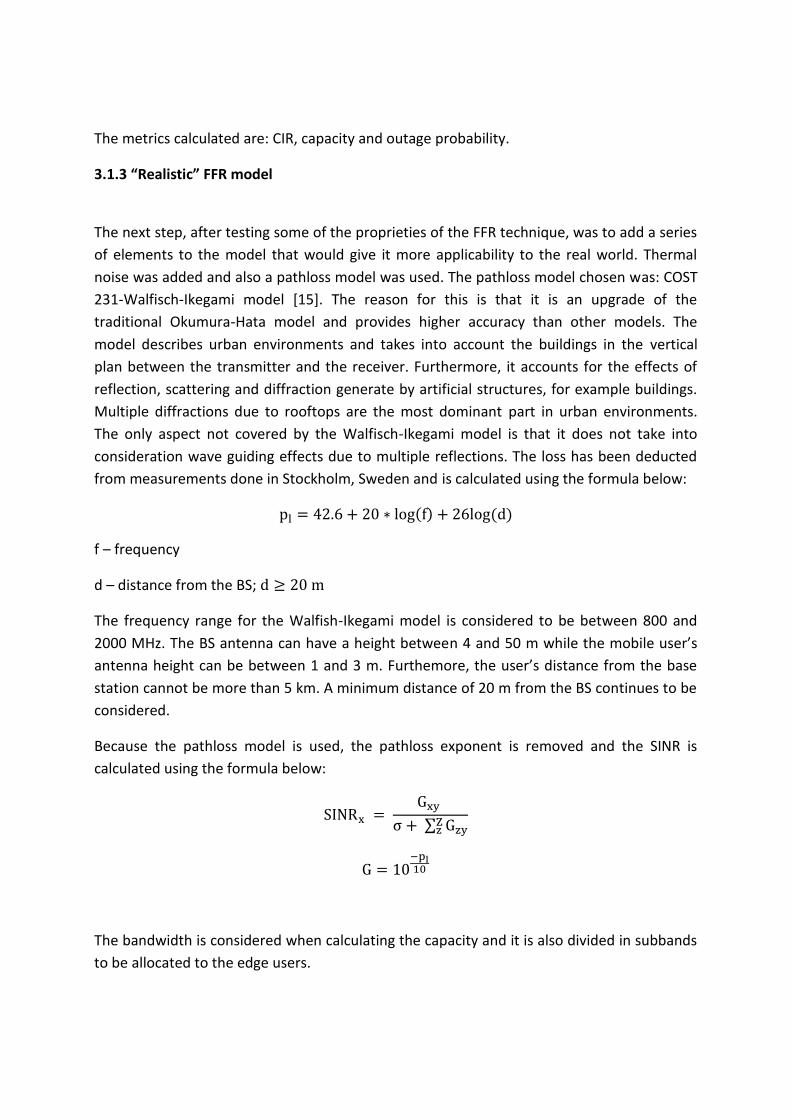
3.1.3 “Realistic” FFR model
The next step, after testing some of the proprieties of the FFR technique, was to add a series
of elements to the model that would give it more applicability to the real world. Thermal
noise was added and also a pathloss model was used. The pathloss model chosen was: COST
231-Walfisch-Ikegami model [15]. The reason for this is that it is an upgrade of the
traditional Okumura-Hata model and provides higher accuracy than other models. The
model describes urban environments and takes into account the buildings in the vertical
plan between the transmitter and the receiver. Furthermore, it accounts for the effects of
reflection, scattering and diffraction generate by artificial structures, for example buildings.
Multiple diffractions due to rooftops are the most dominant part in urban environments.
The only aspect not covered by the Walfisch-Ikegami model is that it does not take into
consideration wave guiding effects due to multiple reflections. The loss has been deducted
from measurements done in Stockholm, Sweden and is calculated using the formula below:
f – frequency
d – distance from the BS;
The frequency range for the Walfish-Ikegami model is considered to be between 800 and
2000 MHz. The BS antenna can have a height between 4 and 50 m while the mobile user’s
antenna height can be between 1 and 3 m. Furthemore, the user’s distance from the base
station cannot be more than 5 km. A minimum distance of 20 m from the BS continues to be
considered.
Because the pathloss model is used, the pathloss exponent is removed and the SINR is
calculated using the formula below:
∑
The bandwidth is considered when calculating the capacity and it is also divided in subbands
to be allocated to the edge users.

List of used parameters:
Name of the parameter Value
Radius of cell (R) 1000 m
Minimum distance (R0) 20 m
Bandwidth (B) 10 Mhz
Subcarriers’bandwidth 375 KHz
Distance between 2 base stations (D) 2000 m
Outage threshold (T) [0, 30] db
Inner radius (Rc) [100,1000] m
Thermal noise density (N0) -174 dBm/Hz
Path loss model (Pl) Cost 231 Walfisch-Ikegami (dB)

Pseudocode version for the “realistic” FFR model is shown below:
% Interference model
define cells, inner cells
for j = 0:10000 % number of simulations
generate_user(x)
generate_interferers(y) % six interferers are generated
for i = 1:6 % take every interferer
calculate sum of interfering distances
end
calculate SIR(x)
calculate ASE(x)
if inner_user
calculate average inner SIR
calculate capacity C(x)
calculate throughput T(x)
calculate user_satisfaction US
end
else
calculate average outer SIR
calculate capacity C(x)
calculate throughput T(x)
calculate user_satisfaction US
end
compute outage probability
end

The metrics calculated are: CINR, capacity, throughput, user satisfaction and area spectral
efficiency.
Graphic representation of simulated model
3.2 Tools used
Although the interference model was developed theoretically, computer software had to be
used to calculate certain key metrics. When deciding what software to be chosen, the main
requirement was that it would be capable of calculating complicated equations in a very
short time period. Due to its fast computational speed, large library of mathematical
functions and user friendly interface, the software used for this project was Matlab.
Matlab (matrix laboratory) was developed by MathWorks and is used for complex matrix
calculations, algorithm design, creation of user interfaces and plotting of functions and data.
It is used for a wide range of applications such as signal processing and communications,
control systems, computational finance and computational biology in both industry and
academia.
Microsoft Excel was also used for generating a series of graphs.
Description of the working environment
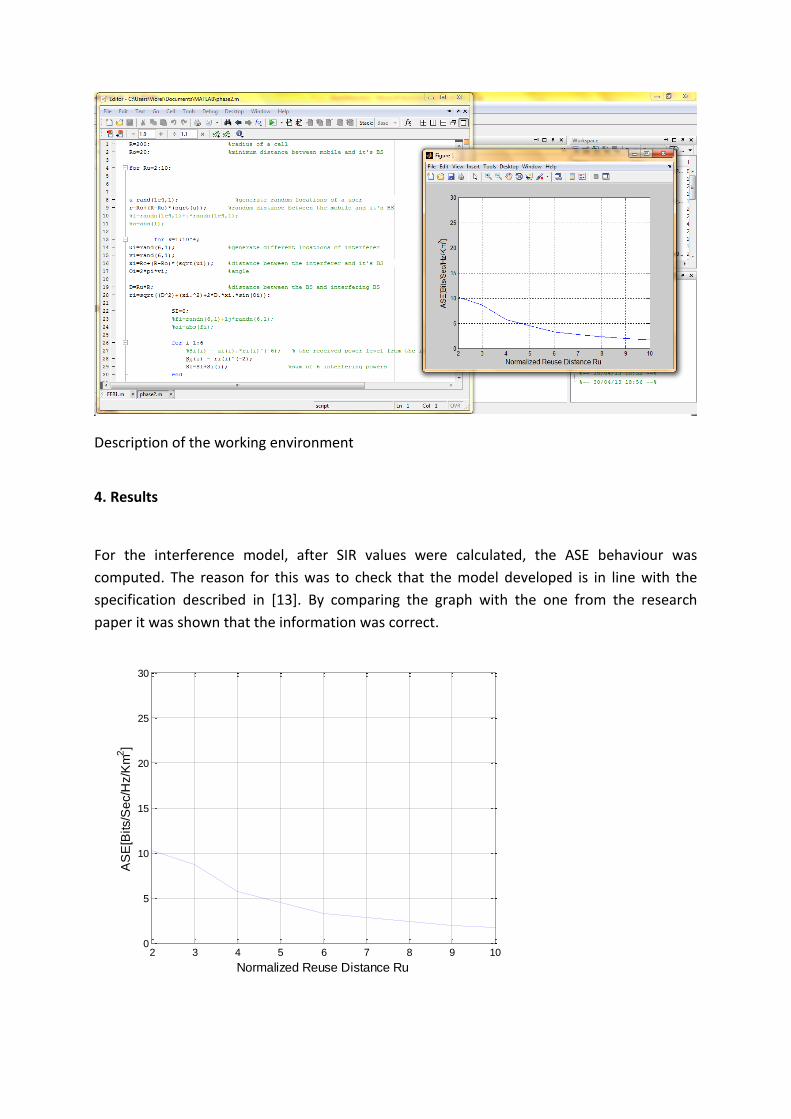
4. Results
For the interference model, after SIR values were calculated, the ASE behaviour was
computed. The reason for this was to check that the model developed is in line with the
specification described in [13]. By comparing the graph with the one from the research
paper it was shown that the information was correct.
2 3 4 5 6 7 8 9 100
5
10
15
20
25
30
Normalized Reuse Distance Ru
AS
E[B
its/S
ec/H
z/K
m2]
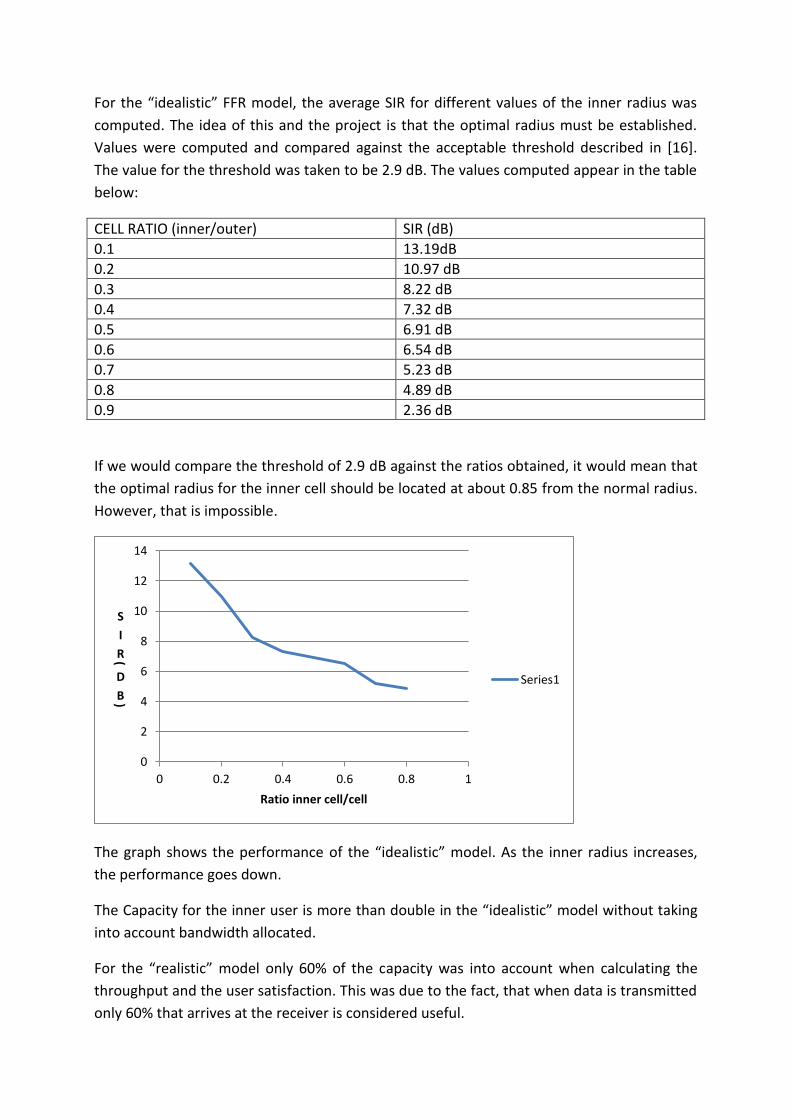
For the “idealistic” FFR model, the average SIR for different values of the inner radius was
computed. The idea of this and the project is that the optimal radius must be established.
Values were computed and compared against the acceptable threshold described in [16].
The value for the threshold was taken to be 2.9 dB. The values computed appear in the table
below:
CELL RATIO (inner/outer) SIR (dB)
0.1 13.19dB
0.2 10.97 dB
0.3 8.22 dB
0.4 7.32 dB
0.5 6.91 dB
0.6 6.54 dB
0.7 5.23 dB
0.8 4.89 dB
0.9 2.36 dB
If we would compare the threshold of 2.9 dB against the ratios obtained, it would mean that
the optimal radius for the inner cell should be located at about 0.85 from the normal radius.
However, that is impossible.
The graph shows the performance of the “idealistic” model. As the inner radius increases,
the performance goes down.
The Capacity for the inner user is more than double in the “idealistic” model without taking
into account bandwidth allocated.
For the “realistic” model only 60% of the capacity was into account when calculating the
throughput and the user satisfaction. This was due to the fact, that when data is transmitted
only 60% that arrives at the receiver is considered useful.
0
2
4
6
8
10
12
14
0 0.2 0.4 0.6 0.8 1
S
I
R(D
B)
Ratio inner cell/cell
Series1

Values are compiled again for the realistic version. Furthermore, bandwidth has to bee
considered and is split in subbands.
CELL RATIO (inner/outer) SIR (dB)
0.1 18.36dB
0.2 15.66 dB
0.3 11.72 dB
0.4 7.32 dB
0.5 4.21 dB
0.6 3.35 dB
0.7 2.86 dB
0.8 2.14 dB
0.9 1.83 dB
The optimal radius is found to be at about 0.65 -0.7 from the cell radius. This is close to the
value that we wanted to determine.
5. Conclusion, summary, future work
5.1 Conclusion
The simulations performed proved the use of the fractional frequency reuse technique. The
results presented in Chapter 4 showed the importance of understanding the surrounding
environment. Furthermore, it gave an explanation why designing better mobile networks
can take such a long period. Two approaches are taken when analysing the FFR technique: a
distance based approach and SINR approach. Although, initial results are not quite as
accurate as the ones compared in several research papers, by adding elements such as
0
2
4
6
8
10
12
14
16
18
20
0 0.2 0.4 0.6 0.8 1
Series1
pathloss and noise it can be observed that they are getting closer to the actual values. More
reliable results could be obtained by adding further elements such fading.
5.2 Summary
This dissertation has presented research made on the Fractional Frequency Reuse technique
in cellular networks. Both modelling and analysis was performed on the technique in order
to test its functionality. The dissertation started with a general overview of cellular
networks. This contained an insight into the next generation mobile networks. The main
features of the recently released 4G services, WiMAX and LTE were presented. The project
concentrates on the physical layer of the downlink of the mobile network and gives a
description of the OFDMA modulation technology which was adopted by both WiMAX and
LTE standards in their downlink. Despite its advantages, OFDMA has a major disadvantage:
finding complex algorithms to cope with CCI. One of the methods proposed to mitigate CCI,
called FFR is the object of this dissertation. FFR is considered to be an optimization
technique for wireless mobile networks. After an in-depth theoretical description of the
technique, a description of the system model used is made. An initial “idealistic” model was
developed which was then enhanced with a series of “realistic” elements. The results of the
simulations were presented in Chapter 4. The main goal was to determine what bandwidth
had to be allocated to random generated users and how would this affect their service.
5.3 Future work
First of all, the system model, the simulation code and the knowledge developed could be
combined to develop an educational tool that could be used by students for understanding
the issues communication engineers face when designing mobile networks. Also, because
FFR is a feature of LTE and WiMAX networks, it could be included in the study curriculum for
undergraduates. The tool could prove useful in teaching, especially in laboratory sessions.
The Matlab code would need to be improved in order to function as an application where
users would just need to select own values for the key parameters (cell size, bandwidth,
height of antennas) run the simulations and interpret the results. This would provide them
with an understanding of how each parameter influences the mobile network.
The system model would also require further enhancing to be able to provide even more
reliable results for research. A series of elements are still considered to be added. One of this
is the inclusion of fading and shadowing. Fading represents the fast changes in the
amplitude, phase or multipath delay of a radio signal over a short timespan or distance. It
appears due to interference between two wave components of the signal called multipath
waves arriving at slightly different times. Shadowing appears when the signal is obstructed
by a natural or artificial obstacle situated between the transmitter and the receiver. Fading
could be generated using random exponential numbers or distributions such as the Rayleigh

distribution or the Riccian distribution which would also offer more accurate results.
Shadowing is also known as slow fading. Furthermore, changes in the cell shape and size are
likely to influence some of the results obtained. The cells in the simulations performed were
considered circular for analytical convenience. However, using circular cells leaves certain
spaces called coverage holes in the cellular system. Coverage holes are area where mobile
users cannot receive any signals from their BS. Another notion that could be included in the
simulations is the use of sectoring. In order to employ this technique, multiple directional
antennas must be used in a cell. By applying multiple directional antennas, each sector
would be able to use more of the bandwidth available at certain times.
A theoretical model that combines the hexagonal and the sectoring technique was designed
based on the one described in “Performance Analysis of Fractional Frequency Reuse for
Multi-Cell WiMAX Networks Based on Site-Specific Propagation Modeling” [16]. The inner
region is considered to be circular with a radius of Rin while the radius of the hexagonal cell is
equal to
√ .
A fractional frequency reuse factor (FFRF) is declared as:
s – number of sectors (1 or 3)
η – ratio of the inner cell/total cell
The inner radius is defined as:
√√
If the user’s distance is larger than Rin then he qualifies as an edge user. Otherwise, he is an
inner user. The model was developed only theoretically and not implemented in code and
simulated.

Sectoring model
Irregular cell size would also, be something to be researched. It is known that despite the cell
shapes being defined as regular in theoretical models that in reality, they have irregular form
and overlap. An algorithm for interference handling based on the interference behaviour in
these types of cells should be considered. Another upgrade would see the random
generation of multiple users in a cell.
The project was developed in a team as part of the Next Generation Mobile Communication
Networks theme. The main idea of the theme was that several optimisation techniques for
mobile networks would be developed individually. However, there were certain aspects that
were treated as part of a group. The interference model was initially developed within the
group and then adapted to own project specifications. Also, weekly meetings took place
where the progress made was presented. Furthermore, by attending these weekly meetings
some connections between the projects were established. One of the projects involved the
Soft Frequency Reuse (SFR) technique. The technique splits the bandwidth for outer cell
users exactly like FFR but the difference is that SFR allows inner users to share the same
subbands as the users from neighbouring cells. Because of this the transmission power for
the inner region is smaller than the transmission power for edge users. A control power
factor is used. The performances of both FFR and SFR techniques could be evaluated to see
what advantages and disadvantages both have. Another project developed in the group was
about cell overlapping. As mentioned earlier, cells are not completely separated from each
other and in the case of circular cells it is often that they overlap. The issue that arises is how
to consider the users in the overlapping regions. For FFR, the outer cell region is split into 3
orthogonal regions. We continue to have inner and outer users and the initial FFR principle
still applies. However, the subcarriers of the inner and outer group are overlapped
completely so both inner users and outer users can use the subcarriers allocated to the cell.
The last project was related to Heterogeneous networks. For the FFR simulations, the
cellular model proposed used a macrocell based homogenous network architecture. For this
type of networks the base stations of the network have the almost the same transmission
power levels, modulation schemes and antenna patterns across all cells. In reality, this is not
the case and a system such as this one is likely to suffer from limited coverage and capacity
for cell edge users. Because of this, next generation mobile networks need to adopt a more
flexible organization to benefit both user and service operators. Picocells and femtocells are
used in HetNets for indoor and cell edge areas. By studying FFR in a heterogeneous network
(HetNet) more accurate results would be determined. Because of the different deadline
dates between the School of Computer Science and the School of Electrical and Electronic
Engineering discussions about the projects could not be made before the submission of the
dissertation. However, this is to be addressed until the end of the academic year.
6. References
[1] ITU-R, [Online]. Available: http://www.itu.int/dms_pub/itu-r/opb/rep/R-REP-M.2134-
2008-PDF-E.pdf. [Accessed 19 April 2013].
[2] ITU, [Online]. Available:
http://www.itu.int/net/pressoffice/press_releases/2010/48.aspx#.UXE2LLVhV2B. [Accessed
19 April 2013].
[3] ITU, "The World in 2011 - ICT Facts and Figures," [Online]. Available:
http://www.itu.int/ITU-D/ict/facts/2011/material/ICTFactsFigures2011.pdf. [Accessed 18
April 2013].
[4] 3rd Generation Partnership Project Technical Specification Group Radio Access Network,
"Physical layer aspects for evolved Universal Terrestrial Radio Access (UTRA)," 3GPP TR
25.814 V7.1.0, 2006.
[5] IEEE, "Part 16: Air interface for fixed and mobile," IEEE Standard for Local and
Metropolitan Area Networks, 2006.
[6] M. Bohge, J. Gross, M. Meyer, A. Wolisz, "Dynamic Resource Allocation in OFDM Systems:
An Overview of Cross-Layer Optimization Principles and Techniques," IEEE Network, pp. 53-

59, 2007.
[7] WiMAX Forum, "Mobile WiMAX. Part I: A technical overview and performance
evaluation.," 2006.
[8] 3GPP TSG RAN WG1#42 R1-050764, "Inter-cell Interference Handling for E-UTRA," no.
Ericsson, 2005.
[9] M. Assaad, "Optimal Fractional Frequency Reuse (FFR) in Multicellular OFDMA System,"
IEEE Vechicular Technology Conference, pp. 1-5, 2008.
[10] K. Begain, G. I. Rózsa, A. Pfening, M. Telek , "Performance analysis of GSM networks
with intelligent underlay-overlay," in Proceedings of the 7th International Symposium on
Computers and Communications (ISCC 2002), Taormina, 2002.
[11] H. Lei, L. Zhang, X. Zhang, D. Yang, "A Novel Multi-Cell Ofdma System Structure Using
Fractional Frequency Reuse," in Proceedings of the 18th Annual IEEE International
Symposium on Personal, Indoor and Mobile Radio Communications (PIMRC'07), Athens,
2007.
[12] G Bilios , C. Bouras, V. Kokkinos, A. Papazois, G Tseliou , "Optimization of Fractional
Frequency Reuse in Long Term Evolution Networks," in IEEE Wireless Communications and
Networking Conference: Mobile and Wireless Networks, 2012.
[13] M.S. Alouini, A.J. Goldsmith, "Area Spectral Efficiency of Cellular Mobile Radiu Systems,"
IEEE Transactions on Vehicular Technology, 1999.
[14] A. Papoulis, Probability, Random Variables, and Stochastic Processes, New York:
McGraw-Hill, 1991, p. 226.
[15] COST 231, Digital mobile radio towards future generation systems, Final Report,
European Commission, Brussels, Belgium: COST Telecom Secretariat, 1999.
[16] I.N. Stiakogiannakis, G.E. Athanasiadou, G.V. Tsoulos, DI Kaklamani, "Performance
Analysis of Fractional Frequency Reuse for Multi-Cell WiMAX Networks Based on Site-
Specific Propagation Modeling," IEEE Antennas and Propagation Magazine, vol. 54, no. 1, pp.
214-225, 2012.