Embed Size (px)
Citation preview
Simulation of the Infrared Spectra of Amorphous Silicon Alloys
B. W. CLARE, P. J. JENNINGS,* J. C. L. CORNISH, G. T. HEFTER, andD. J. SANTJOJO School of Mathematical and Physical Sciences, Murdoch University, Murdoch W A 61 50, Australia
Received 20 December 1994; accepted 15 May 1995
ABSTRACT
The infrared absorption spectra of hydrogenated amorphous silicon alloys have been simulated using MOPAC. The calculated spectra compare well with those obtained experimentally. Simulation studies have also been carried out on the effect of contamination of hydrogenated amorphous silicon by common atmospheric contaminants: oxygen and nitrogen. These studies provide a basis for the study of diffusion and reconstruction of amorphous silicon alloys during annealing and photodegradation. This article indicates that infrared spectroscopy, combined with molecular modeling, could be used to study the molecular mechanisms associated with the photodegradation of amorphous silicon alloys. 0 1996 by John Wiley & Sons, Inc.
Introduction
morphous silicon is a new material with po- A tential application for optoelectronic devices, including solar cells. Although it shows great promise, its full potential has not been achieved because of instability problems, such as phc- todegradation (the Staebler-Wronski effect). Many attempts have been made to overcome these prob- lems, but the basic mechanisms which produce them are still not understood. A substantial effort is now underway in many laboratories to use physical and chemical techniques to study degra- dation processes in amorphous silicon alloys.'
* Author to whom all correspondence should be addressed.
Journal of Computational Chemistry, Vol. 17, No. 3, 306-312 (1996) 0 1996 by John Wiley & Sons, Inc.
Infrared spectroscopy is a powerful tool for structural analysis of molecules and solids, and it has been applied extensively to amorphous silicon to identify structural arrangements in the lattice. There is some dispute about whether it can be used to detect degradation effects, but we have shown recently that if a high angle of incidence is used, then changes in the infrared spectra, associ- ated with photodegradation, can be detected.2 This has enabled us to study structural changes associ- ated with the Staebler-Wronski effect in amor- phous hydrogenated silicon (a-Si:H).
Infrared spectroscopy is also an essential tool for studying the incorporation of impurities into a-Si:H and the effects of light soaking and anneal- ing on the distribution of impurities. Such studies
CCC 01 92-8651 1 96 1030306-07
AMORPHOUS SILICON ALLOYS
are important for optimizing the design of opto- electronic devices based on amorphous silicon.
The aim of this article is to demonstrate how quantum chemical simulations of the infrared spectra of amorphous silicon alloys can be used to study the effects of photodegradation and anneal- ing on this material. We will show how relatively simple cluster model calculations can predict real- istic infrared spectra and how changes in these spectra can be related to structural rearrangements within the material.
Methods
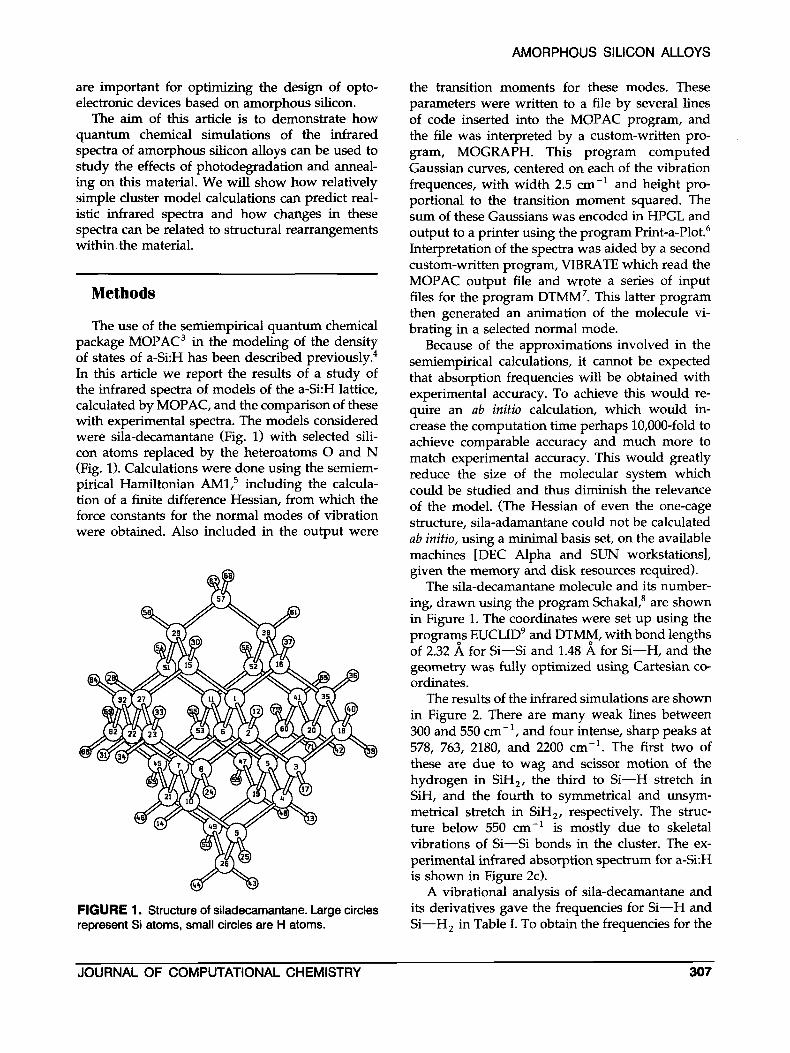
The use of the semiempirical quantum chemical package MOPAC3 in the modeling of the density of states of a-Si:H has been described previously! In this article we report the results of a study of the infrared spectra of models of the a-Si:H lattice, calculated by MOPAC, and the comparison of these with experimental spectra. The models considered were sila-decamantane (Fig. 1) with selected sili- con atoms replaced by the heteroatoms 0 and N (Fig. 1). Calculations were done using the semiem- pirical Hamiltonian AM17 including the calcula- tion of a finite difference Hessian, from which the force constants for the normal modes of vibration were obtained. Also included in the output were
FIGURE 1. Structure of siladecamantane. Large circles represent Si atoms, small circles are H atoms.
the transition moments for these modes. These parameters were written to a file by several lines of code inserted into the MOPAC program, and the file was interpreted by a custom-written pro- gram, MOGRAPH. This program computed Gaussian curves, centered on each of the vibration frequences, with width 2.5 cm-' and height pro- portional to the transition moment squared. The sum of these Gaussians was encoded in HPGL and output to a printer using the program Print-a-Plot.6 Interpretation of the spectra was aided by a second custom-written program, VIBRATE which read the MOPAC output file and wrote a series of input files for the program DTMM7. This latter program then generated an animation of the molecule vi- brating in a selected normal mode.
Because of the approximations involved in the semiempirical calculations, it cannot be expected that absorption frequencies will be obtained with experimental accuracy. To achieve this would re- quire an ab initio calculation, which would in- crease the computation time perhaps 10,000-fold to achieve comparable accuracy and much more to match experimental accuracy. This would greatly reduce the size of the molecular system which could be studied and thus diminish the relevance of the model. (The Hessian of even the one-cage structure, sila-adamantane could not be calculated ab initio, using a minimal basis set, on the available machines [DEC Alpha and SUN workstations], given the memory and disk resources required).
The sila-decamantane molecule and its number- ing, drawn using the program Schakal; are shown in Figure 1. The coordinates were set up using the programs EUCLID9 and DTMM, with bond lengths of 2.32 A for Si-Si and 1.48 A for Si-H, and the geometry was fully optimized using Cartesian co- ordinates.
The results of the infrared simulations are shown in Figure 2. There are many weak lines between 300 and 550 cm-', and four intense, sharp peaks at 578, 763, 2180, and 2200 cm-'. The first two of these are due to wag and scissor motion of the hydrogen in SiH,, the third to Si-H stretch in SiH, and the fourth to symmetrical and unsym- metrical stretch in SiH,, respectively. The struc- ture below 550 cm-' is mostly due to skeletal vibrations of Si-Si bonds in the cluster. The ex- perimental infrared absorption spectrum for a-Si:H is shown in Figure 2c).
A vibrational analysis of sila-decamantane and its derivatives gave the frequencies for Si-H and Si-H, in Table I. To obtain the frequencies for the
JOURNAL OF COMPUTATIONAL CHEMISTRY 307

CLARE ET AL.
A
8 e D 'B
-
C
2000 I500 1000 500
cm ' FIGURE 2. (a) Simulated IR absorption spectrum for siladecamantane. (b) Simulated IR absorption spectrum for superpolymantane. (c) Measured IR absorption spectrum for a sample of hydrogenated amorphous silicon.
SiH, moiety, the hydrogens at positions 24 and 25 were replaced with SiH 3.
To study the effects of nitrogen impurities in the material, a single silicon atom, Si(21), was replaced with N and one hydrogen (46) was re- moved. This molecule contained hydrogens (50 and 63) bound to silicon atoms, which were in turn bound to nitrogen. To simulate the vibrations of clusters having no such hydrogen atoms, the vi- brations of the corresponding compound with hy- drogen atoms 50 and 63 replaced by SiH, were also calculated. The frequencies obtained are shown in Figure 3a, and the atoms involved in each such vibrational mode and the nature of the vibration are reported in Table I. To study the modes of vibration of a substance with hydrogen bound directly to the nitrogen atom, the silicon atom 26 of sila-decamantane was replaced with nitrogen, and hydrogen 44 was deleted. A cluster with two such hydrogen atoms was obtained by replacing hydrogen 31 of sila-decamantane with NH,.
A similar study was carried out with an oxy- gen-substituted cluster. Silicon 62 was replaced with oxygen, and hydrogens 68 and 69 were deleted. A force calculation on this molecule gave the vibrational modes for a compound with hydro-
gen bound to silicon atoms adjoining the 0, and a similar calculation on the molecule with hydro- gens 63 and 64 replaced with SiH, gave those for a cluster with no such hydrogen atom. The frequen- cies obtained are shown in Figure 3b, and their assignments are presented in Table I.
Analysis
The experimental spectra for a-Si:H were mea- sured on a Fourier transform infrared spectrometer (FTIR). The measurements were made in both the transmission and reflection mode. The results pre- sented in Figure 2c are from the reflection mea- surements with the radiation striking the surface at lo" from the surface plane. The amorphous silicon was deposited on stainless steel for the measurements.
The experimental spectrum in Figure 2c resem- bles the simulated spectrum for sila-decamantane, with two strong absorption peaks at - 2100 cm-' and 600 cm-l. According to Table I, these are due to the Si-H stretch and to the Si-H, wag and Si -H bend, respectively. Each of these peaks con- tains several components, as detailed in Table I. They are associated with different chemical envi- ronments. Below 600 cm-', there are many peaks associated with more complex, long-range oscilla- tions of the lattice.
The simulations also show a double peak struc- ture around 800 cm-', which is probably due to the Si-H, scissor motion (this occurs at around 950 cm-' in SiH,). This peak is also evident in the experimental data, although it seems to lie close to the features at 900 cm-', which are often at- tributed to nitrogen contamination. This feature is expected to be weak in the experimental spectra due to the relatively small number of SiH, groups present in real samples of a-Si:H. The sila-de- camantane model (Fig. 1) contains a relatively large number of SiH, groups on the surface.
The double-peaked structure near 2200 cm-' is present in both the experimental and theoretical results. The two-peak structure also occurs in SiH,, where it is due to symmetric and antisymmetric stretching of the Si-H bonds. The higher energy component is clearly dependent on the SiH, group, and a lineshape analysis of this peak could be a useful indicator of bonding in the a-Si:H.
To assess the sensitivity of the spectra to the model, we performed a simulation for a large cluster of Si atoms called superpolymantane. This
308 VOL. 17, NO. 3

AMORPHOUS SILICON ALLOYS
TABLE 1. Computed Frequencies of the Major Features in the IR Spectrum of Amorphous Silicon Alloys.
Cluster Group Strength Type Frequency (crn - ')
Siladecarnantane SiH, SiH, SiH SiH, SiH, SiH
S
S
vs S
S
W
Unsyrn. stretch Sym. stretch Stretch Scissor wag Bend
2208 2202 21 82 763 578 540
Siladecarnantane, H replaced with SiH, SiH,
SiH, SiH, Sih,
Stretch Scissor Umbrella Rock
2226 -30 789,800,802
707,716 414
W
W
S
W
Siladecarnantane, one SiH replaced with SiNH, Stretch
Scissor Stretch wag Rock
3520,3578 1715 970 91 1 652
S W
vs W
S
Siladecarnantane, one SiH replaced with N, one H on each of two adjacent Si
Si - NSi, Si - N - Si H - SiNSi - H skeletal
Stretch Unsyrn. stretch Bend Syrn. stretch
1 049 979 688 599
vs vs rn rn
Siladecarnantane, one SiH replaced with N, two H on adjacent Si replaced with SiH,. No H on Si bonded to N.
Stretch Scissor Scissor Syrn. stretch
999 825 798 634
Si,N SiH, SiH, Si,N
vs W W
S
Siladecarnantane, Si H , replaced with 0, no H on adjacent Si
Siladecamantane, SiH, replaced with 0, H on adjacent Si
SiOSi SiH,
Unsyrn. stretch Scissor
944 797
S
W
SiOSi HSiOSiH
Unsyrn. stretch Syrn. bend
vs S
969 71 8
w = weak, m = medium, s = strong, vs = vety strong
contains 84 Si atoms in a tetrahedral array with the dangling bonds occupied by H atoms (64 H atoms). The infrared absorption spectrum of superpoly- mantane is presented in Figure 2b. Note the simi- larity of the structure above 600 cm-' (Fig. 2a) and differences below 600 cm-'. There are also some differences in the structure of the two main peaks due to different relative abundances of the differ- ent types of Si-H groups in the two model struc- tures. This illustrates how reconstruction of the material due to annealing or photodegradation could produce observable changes in the profiles of these major peaks. These changes could be used to study reconstruction processes.
Another difference between some experimental spectra and the simulated spectra is the presence of additional peaks at - 1300 and - 900 cm-' in the former. These peaks are apparently due to slight contamination of the samples by oxygen and nitrogen when they are removed from the vacuum deposition system and transported to the FTIR system. We have tested this hypothesis by deliber- ately exposing a sample to oxygen and nitrogen during deposition; the resulting spectrum is shown in Figure 3c." This clearly shows large peaks at - 1300 and 900 cm-'. We have also simulated the infrared spectra of sila-decamantane with one of the silicon atoms replaced by nitrogen and oxygen
309 JOURNAL OF COMPUTATIONAL CHEMISTRY

CLARE ET AL.
A
8
8 4 9E2
C
2000 IS00 I000 500
I cm
FIGURE 3. (a) Simulated IR absorption spectrum for the amorphous silicon alloy containing hydrogen and nitrogen a-Si:H, N. (b) Simulated IR absorption spectrum for the amorphous silicon alloy containing hydrogen and oxygen a-Si:H,O. (c) Measured IR absorption spectrum for a sample of hydrogenated amorphous silicon deliberately contaminated with nitrogen and oxygen.
atoms, respectively. These results are presented in Figure 3a, b, and the new spectral lines are listed in Table I.
From Table I it is clear that the double-peak feature around 950 cm-' is due to oxygen contam- ination of the amorphous silicon, as shown in Figure 3b. The features around 1300 cm-' appear to be due to nitrogen contamination, as shown in Figure 3a. A comparison of Figures 2 and 3 shows that contamination by the common residual gases 0, and N, also changes the shape of the major Si -H peaks at - 2200 and - 800 cm-'.
Studies of the peak structures of contaminated samples during annealing and light soaking have also been carried out, and these will be used to study the migration of impurities in the a-Si:H lattice.
Amorphous silicon alloys are known to be un- stable under illumination. In particular, a-Si:H un- dergoes a structural transformation, which reduces its efficiency as a photovoltaic material. This trans- formation is thought to involve the breaking of Si -H bonds by photodissociation followed by the redistribution of the H atoms within the material. We have examined some processes of this kind
using the AM1 model, and the results are pre- sented in Figure 4.
Figure 4b shows that SiH, groups have an im- portant influence on the infrared spectra. When the SiH, groups are removed from the decamantane model, the SiH, bending mode at - 800 cm-' disappears and the higher-energy component of the Si-H stretching mode at - 2200 cm-' moves to lower energy. Such changes should be readily visible in experimental spectra as a narrowing of the - 2200 cm-' peak.
Figure 4c shows that if eight H atoms are re- moved from Si-H bonds on the surface of deca- mantane, there is a slight upward shift in the two main peaks near - 2200 cm-' and a small new peak appears at higher energy. Thus bond break- ing on the surface of a-Si:H appears to cause an upward shift in the Si-H stretching band near - 2200 cm-', and a new shoulder may appear on the high-energy side of the peak.
Figure 4d illustrates the effect of creating four dangling bonds in the bulk of the material by removing an Si atom. Following optimization, this produces a broadening of the peak near 2200 cm-'
A
0
e 5: 9
C
D 2000 I so0 1000 SO0
c m '
FIGURE 4. Studies of the effects of reconstruction of a-Si:H alloys. (a) Simulated IR absorption spectrum for sila-decamantane. (b) Simulated IR absorption spectrum for sila-decamantane with all hydrogen atoms removed from SiH, groups. (c) Simulated IR absorption spectrum for sila-decamantane with eight H atoms removed from Si:H groups. (d) Simulated IR absorption spectrum for sila-decamanatane with an internal silicon atom (6) removed.
31 0 VOL. 17, NO. 3

AMORPHOUS SILICON ALLOYS
with a new shoulder on the lower-energy side. This would appear as a broadening and slight downward shift in the peak.
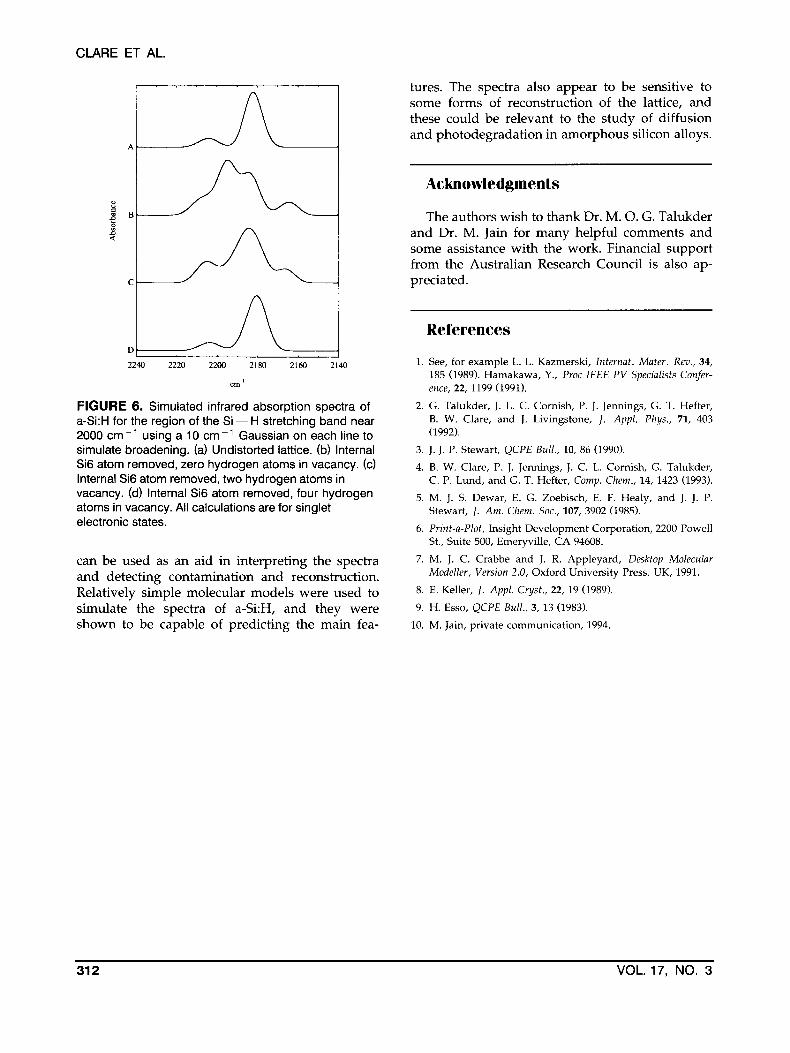
We have detected changes in the structure of the experimental Si-H stretch peak at N 2200 cm-' as a result of light soaking, as shown in Figure 5. These include a broadening of the peak and the development of a new feature on the low-energy side of the main peak, similar to the results in Figure 4d. This new feature is due to distortion in the a-Si:H lattice arising from the removal of a Si atom from the bulk. This produces weaker bonds with smaller force constants in the vicinity of the distortion and thus a lowenergy shoulder on the main peak near 2200 cm-'.
Figure 6 shows the simulated infrared spectra for three models of the internal silicon atom va- cancy in sila-decamantane. The vacancy may have some or all of its dangling bonds attached to
6
4
2
- 0 i 5 Y
4 6
4
2
0
hydrogen atoms, as explained in the caption for Figure 6. It is clear that the model of Figure 6c provides a good explanation of the observed be- havior in Figure 5b after light soaking.
The results in Figures 4, 5, and 6 illustrate how simulations with Ah41 can be used to study the effects of photodegradation on amorphous silicon alloys. There are clear differences in the effects of different structural arrangements on the Si-H stretching modes near 2200 cm-'. These can be detected experimentally, and they can be modeled in this way to determine what structural changes have occurred in the a-Si:H films.
Conclusions
These studies have shown how simulations of the infrared spectra of amorphous silicon alloys
2000 I000
2000 1500 1000
wave number (QI-')
500
FIGURE 5. Effects of light soaking on the measured infrared spectra of hydrogenated amorphous silicon. (a) As deposited intrinsic a-Si:H. (b) After 168 hours of light soaking. Insets show the fine structure of the Si - H stretching peak near ZOO0 cm-'.
JOURNAL OF COMPUTATIONAL CHEMISTRY 31 1
CLARE ET AL.
A
8 B E g
C
D 2240 2220 2200 2180 2160 2140
cm I
FIGURE 6. Simulated infrared absorption spectra of a-Si:H for the region of the Si - H stretching band near 2000 cm-’ using a 10 cm-’ Gaussian on each line to simulate broadening. (a) Undistorted lattice. (b) Internal Si6 atom removed, zero hydrogen atoms in vacancy. (c) Internal Si6 atom removed, two hydrogen atoms in vacancy. (d) Internal Si6 atom removed, four hydrogen atoms in vacancy. All calculations are for singlet electronic states.
can be used as an aid in interpreting the spectra and detecting contamination and reconstruction. Relatively simple molecular models were used to simulate the spectra of a-Si:H, and they were shown to be capable of predicting the main fea-
tures. The spectra also appear to be sensitive to some forms of reconstruction of the lattice, and these could be relevant to the study of diffusion and photodegradation in amorphous silicon alloys.
Acknowledgments
The authors wish to thank Dr. M. 0. G. Talukder and Dr. M. Jain for many helpful comments and some assistance with the work. Financial support from the Australian Research Council is also ap- preciated.
References
1. See, for example L. L. Kazmerski, Internat. Mater. Rev., 34, 185 (1989). Hamakawa, Y., Proc I€€€ PV Specialists Confer- ence, 22, 1199 (1991).
2. G. Talukder, J. L. C. Cornish, P. J. Jennings, G. T. Hefter, B. W. Clare, and J. Livingstone, J . Appl. Phys., 71, 403 (1992).
3. J. J. P. Stewart, QCPE Bull., 10, 86 (1990).
4. B. W. Clare, P. J. Jennings, J. C. L. Cornish, G. Talukder, C. P. Lund, and G. T. Hefter, Comp. Chem., 14, 1423 (1993).
5. M. J. S. Dewar, E. G. Zoebisch, E. F. Healy, and J. J. P. Stewart, J . Am. Chem. Soc., 107, 3902 (1985).
6. Print-a-Plot, Insight Development Corporation, 2200 Powell St., Suite 500, Emeryville, CA 94608.
7. M. J. C. Crabbe and J. R. Appleyard, Desktop Molecular Modeller, Version 2.0, Oxford University Press, UK, 1991.
8. E. Keller, J . Appl. Cryst., 22, 19 (1989).
9. H. Esso, QCPE Bull., 3, 13 (1983).
10. M. Jain, private communication, 1994.
31 2 VOL. 17, NO. 3