Embed Size (px)
Citation preview

energies
Article
Simulation Study on the Effect of FracturingTechnology on the Production Efficiency of NaturalGas Hydrate
Chen Chen 1,2, Lin Yang 1,2,*, Rui Jia 1,2,*, Youhong Sun 1,2, Wei Guo 1,2, Yong Chen 1,2 andXitong Li 1,2
1 Engineering College, Jilin University, Changchun 130026, China; [email protected] (C.C.);[email protected] (Y.S.); [email protected] (W.G.); [email protected] (Y.C.);[email protected] (X.L.)
2 Key Laboratory of Drilling and Exploitation Technology in Complex Conditions, Ministry of Land andResources, Changchun 130026, China
* Correspondence: [email protected] (L.Y.); [email protected] (R.J.); Tel.: +86-0431-88502678 (L.Y.);+86-0431-88502678 (R.J.)
Received: 14 July 2017; Accepted: 16 August 2017; Published: 21 August 2017
Abstract: Natural gas hydrate (NGH) concentrations hold large reserves of relatively pureunconventional natural gases, consisting mainly of methane. Depressurization is emerging asthe optimum conversion technology for converting NGH in its reservoir to its constituent water andnatural gas. NGH concentrations commonly have a pore fill of over 80%, which means that NGH is alow-permeability reservoir, as NGH has displaced water in terms of porosity. Fracturing technology(fracking) is a technology employed for increasing permeability-dependent production, and hasbeen proven in conventional and tight oil and gas reservoirs. In this work, we carried out numericalsimulations to investigate the effects on depressurization efficiency of a variably-fractured NGHreservoir, to make a first order assessment of fracking efficiency. We performed calculations for thevariations in original NGH saturation, pressure distribution, CH4 gas production rate, and cumulativeproduction under different fracturing conditions. Our results show that the rate of the pressure dropwithin the NGH-saturated host strata increases with increased fracturing. The CH4 gas productionrate and cumulative production are greatly improved with fracturing. Crack quantity and spacing pervolume have a significant effect on the improvement of NGH conversion efficiencies. Possibly mostimportant, we identified an optimum fracking value beyond which further fracking is not required.
Keywords: natural gas hydrate; fracturing technology; numerical simulation; production efficiency
1. Introduction
Natural gas hydrates (NGH) are white, solid, crystalline compounds, composed of lighthydrocarbons, CO2, H2S, and water, under certain temperature and pressure conditions. Among them,methane hydrate is the most widely-distributed in nature [1–5]. Marine gas hydrate is mainlydeveloped in hydrate stability zones (HSZ) below a 500-m water depth in the open ocean, wheretemperatures and pressures are suitable for its spontaneous formation. About 90% of the world’soceans present temperature and pressure conditions that are suitable for the formation of HSZ, whichprovide a good environmental basis for NGH development [6,7]. When there is enough methane, andwater enters the pores of undercompacted seabed sediments, it is possible to form NGH [7].
NGH has a low environmental risk, and exhibits the efficient sequestration of natural gasfrom both biogenic and thermogenic sources. Very clean natural gas can be produced from NGHconcentrations, especially from sandy turbidites, from which it is already known in the industry how
Energies 2017, 10, 1241; doi:10.3390/en10081241 www.mdpi.com/journal/energies

Energies 2017, 10, 1241 2 of 16
to produce conventional hydrocarbons. It is estimated that reserves are approximately 2 × 10¹⁶ m3,equivalent to double the world's proven, conventional, total carbon. World estimates for gas from NGHreserves of NGH in sands are >40,000 Tcf (1 Tcf = 1 × 1013 ft3 = 283.17 × 10⁹ m3) [8–13]. NGH shouldbe converted in situ to its constituent gas and water. A number of conversion methods exist, but earlyproduction testing and modeling indicate that depressurization will be the ideal method to use [14–18].
In 2007, samples from the SH2, SH3, and SH7 sites were successfully drilled from the Shenhu areain the northern South China Sea (Figure 1) [19–21]. Taking the SH7 site as an example, the hydratelayers were 18–34 m thick, and the sediment porosity, permeability, and NGH pore fill were 33–48%,7.5 × 10−14 m2, and 20–44%, respectively [19,21].
Energies 2017, 10, 1241 2 of 16
to produce conventional hydrocarbons. It is estimated that reserves are approximately 2 × 10¹⁶ m3, equivalent to double the world's proven, conventional, total carbon. World estimates for gas from NGH reserves of NGH in sands are >40,000 Tcf (1 Tcf = 1 × 1013 ft3 = 283.17 × 10⁹ m3) [8–13]. NGH should be converted in situ to its constituent gas and water. A number of conversion methods exist, but early production testing and modeling indicate that depressurization will be the ideal method to use [14–18].
In 2007, samples from the SH2, SH3, and SH7 sites were successfully drilled from the Shenhu area in the northern South China Sea (Figure 1) [19–21]. Taking the SH7 site as an example, the hydrate layers were 18–34 m thick, and the sediment porosity, permeability, and NGH pore fill were 33–48%, 7.5 × 10⁻¹⁴ m2, and 20–44%, respectively [19,21].
Figure 1. Location of the research area and drilling sites in the Shenhu area, north slope of the South China Sea.
In 2013, a large number of gas hydrate samples were obtained from the northeastern continental slope of the South China Sea. The NGH host sediments in this area comprised sandy layers of turbidite sediments. Natural gas hydrate saturation of porosity ranged from 45% to 100%; the amount of gas seemed to be very large. The NGH was massive, layered, tumor-like veins, dispersed in all combinations of silty clay and clastic limestone [22]. In 2013, Nippon and Mie Prefecture NGH were produced using depressurization. The trial production achieved good results [23–26]; however, commercial exploitation lacks depth of study [23,26]. In recent years, TOUGH+HYDRATE v1.0 models have been widely used in gas hydrate simulations. Taking the Shenhu area, South China Sea, as an example, Li [19] used this model to evaluate gas production potential by depressurization and thermal stimulation from the SH7 site. Hu [27] and Jin [28] used this model to analyze sensitive parameters (porosity, permeability, NGH pore fill, bottom-hole pressure, and thermal stimulation intensity) via depressurization and thermal stimulation from the SH2 site. Su [29] used this model to evaluate the effects of thermal stimulations on gas production from the SH2 site. Zhang [30] used this model to preliminarily estimate gas production potential by depressurization and thermal stimulation from the SH2 site. The results showed that cumulative CH4 volume in the Shenhu area was not large, and NGH exploitation was seriously inhibited, mainly because of the low porosity and poor permeability.
The primary repository of NGH is in sandy and silty marine turbidites. Clay and clastic limestone and secondary permeability related to structure also host NGH in some areas of the South China Sea, but their viability as producible gas resources is unlikely in their natural state. The NGH-
Figure 1. Location of the research area and drilling sites in the Shenhu area, north slope of theSouth China Sea.
In 2013, a large number of gas hydrate samples were obtained from the northeastern continentalslope of the South China Sea. The NGH host sediments in this area comprised sandy layers of turbiditesediments. Natural gas hydrate saturation of porosity ranged from 45% to 100%; the amount ofgas seemed to be very large. The NGH was massive, layered, tumor-like veins, dispersed in allcombinations of silty clay and clastic limestone [22]. In 2013, Nippon and Mie Prefecture NGHwere produced using depressurization. The trial production achieved good results [23–26]; however,commercial exploitation lacks depth of study [23,26]. In recent years, TOUGH+HYDRATE v1.0 modelshave been widely used in gas hydrate simulations. Taking the Shenhu area, South China Sea, as anexample, Li [19] used this model to evaluate gas production potential by depressurization and thermalstimulation from the SH7 site. Hu [27] and Jin [28] used this model to analyze sensitive parameters(porosity, permeability, NGH pore fill, bottom-hole pressure, and thermal stimulation intensity) viadepressurization and thermal stimulation from the SH2 site. Su [29] used this model to evaluate theeffects of thermal stimulations on gas production from the SH2 site. Zhang [30] used this model topreliminarily estimate gas production potential by depressurization and thermal stimulation from theSH2 site. The results showed that cumulative CH4 volume in the Shenhu area was not large, and NGHexploitation was seriously inhibited, mainly because of the low porosity and poor permeability.
The primary repository of NGH is in sandy and silty marine turbidites. Clay and clastic limestoneand secondary permeability related to structure also host NGH in some areas of the South China Sea,but their viability as producible gas resources is unlikely in their natural state. The NGH-enriched

Energies 2017, 10, 1241 3 of 16
stratum encountered in the well, which we model in this paper, has a low porosity and poorpermeability, which hinder the transfer of heat and pressure between the production wells andthe stratum, and reduces the production efficiency of the decomposition of gas and the continuousdissociation of NGH. The problem of how to efficiently and economically exploit natural gas hydratein low-permeability marine sediment reservoirs is an important issue. Being able to produce NGHfrom marine sediments, in which the grain size distribution hosting NGH is less producible thanwell-sorted sand, will greatly enlarge the potential use of NGH as a gas resource.
In 1947, the world's first successful fracturing well was built in the state of Kansas, the UnitedStates [31,32]. Since the 1970s, the technology has expanded to include low-permeability oil and gasshale, as well as tight sand reservoirs [33]. Multi-stage fracturing was perfected and has been usedto produce gas and oil from shale reservoirs since about 2003 in the United States [34]. Fracturingtechnology can be divided into vertical and horizontal fracturing (Figure 2), according to the differentcharacteristics of the formations [35].
Energies 2017, 10, 1241 3 of 16
enriched stratum encountered in the well, which we model in this paper, has a low porosity and poor permeability, which hinder the transfer of heat and pressure between the production wells and the stratum, and reduces the production efficiency of the decomposition of gas and the continuous dissociation of NGH. The problem of how to efficiently and economically exploit natural gas hydrate in low-permeability marine sediment reservoirs is an important issue. Being able to produce NGH from marine sediments, in which the grain size distribution hosting NGH is less producible than well-sorted sand, will greatly enlarge the potential use of NGH as a gas resource.
In 1947, the world's first successful fracturing well was built in the state of Kansas, the United States [31,32]. Since the 1970s, the technology has expanded to include low-permeability oil and gas shale, as well as tight sand reservoirs [33]. Multi-stage fracturing was perfected and has been used to produce gas and oil from shale reservoirs since about 2003 in the United States [34]. Fracturing technology can be divided into vertical and horizontal fracturing (Figure 2), according to the different characteristics of the formations [35].
Figure 2. Vertical versus horizontal fracture stimulation.
Increasing the permeability of the hydrate layer can improve heat and mass transfer efficiency, increase the gas migration channels in the hydrate layer, accelerate the hydrate dissociation and discharge, and increase the gas production rate and the cumulative production of CH4 [4,13,28,30,36].
The application of fracturing technology to the exploitation of gas hydrate can effectively increase reservoir permeability and enhance the efficiency of gas hydrate production. The combination of fracturing technology and existing methods to exploit natural gas hydrates would solve some of the problems of existing methods [17,27,37,38]. Fracturing technology is the primary mechanical solution for increasing porosity, interconnecting artificial cracks and natural cracks, and forming a mutual interconnected crack network in NGH concentrations, in order to enhance the conductivity of NGH concentrations. Depressurization and fracturing combine to exploit NGH [27,37,38], which increases the rate of the pressure drop within the NGH-saturated host strata and promotes NGH decomposition in cracked areas, in addition to being conducive to the discharge of methane. Thermal stimulation and fracturing combine to exploit NGH [27,37], as hot fluid enters NGH concentrations through the crack network and directly heats NGH to increase the mining radius and reduce heat loss. For CO2 replacement [17], CO2 enters NGH concentrations through the crack networks. The large contact area between CO2 and NGH increases replacement efficiency by CO2.
Of course, fracturing is also inadequate in NGH exploitation. The fracturing effect is not easy to control, sometimes resulting in a failure in fracturing. In addition, there is a certain risk that fracturing can cause formation instability [39,40].
Oceanic NGH mining may exacerbate global greenhouse effects and worsen the marine ecological environment, resulting in a series of environmental effects, and also probably lead to submarine landslides, seabed collapse, and other geological disasters [39,40]. There is a certain
Figure 2. Vertical versus horizontal fracture stimulation.
Increasing the permeability of the hydrate layer can improve heat and mass transfer efficiency,increase the gas migration channels in the hydrate layer, accelerate the hydrate dissociation anddischarge, and increase the gas production rate and the cumulative production of CH4 [4,13,28,30,36].
The application of fracturing technology to the exploitation of gas hydrate can effectively increasereservoir permeability and enhance the efficiency of gas hydrate production. The combination offracturing technology and existing methods to exploit natural gas hydrates would solve some of theproblems of existing methods [17,27,37,38]. Fracturing technology is the primary mechanical solutionfor increasing porosity, interconnecting artificial cracks and natural cracks, and forming a mutualinterconnected crack network in NGH concentrations, in order to enhance the conductivity of NGHconcentrations. Depressurization and fracturing combine to exploit NGH [27,37,38], which increasesthe rate of the pressure drop within the NGH-saturated host strata and promotes NGH decompositionin cracked areas, in addition to being conducive to the discharge of methane. Thermal stimulationand fracturing combine to exploit NGH [27,37], as hot fluid enters NGH concentrations through thecrack network and directly heats NGH to increase the mining radius and reduce heat loss. For CO2
replacement [17], CO2 enters NGH concentrations through the crack networks. The large contact areabetween CO2 and NGH increases replacement efficiency by CO2.
Of course, fracturing is also inadequate in NGH exploitation. The fracturing effect is not easy tocontrol, sometimes resulting in a failure in fracturing. In addition, there is a certain risk that fracturingcan cause formation instability [39,40].

Energies 2017, 10, 1241 4 of 16
Oceanic NGH mining may exacerbate global greenhouse effects and worsen the marine ecologicalenvironment, resulting in a series of environmental effects, and also probably lead to submarinelandslides, seabed collapse, and other geological disasters [39,40]. There is a certain amount of risk inthe application of fracturing technology to oceanic NGH mining, as it will further reduce the stabilityof submarine formations. Taking the trial production in China and Japan as an example [23,25], inorder to avoid risks and ensure safety, researchers monitored seabed deformation, reservoir stability,and in situ methane leakage during the trial production. The results proved that in situ monitoring isan effective way to reduce the risks of NGH mining. Similarly, if a reasonable implementation andmonitoring plan is adopted, the risk of fracturing oceanic NGH can be reduced.
In this paper, TOUGH+HYDRATE numerical simulation software was used to simulate andcompare NGH reservoirs before and after fracturing. The influence of the fracturing parameters ongas hydrate production efficiency was studied.
2. Simulation Preparation
2.1. Numerical Model and Simulation Parameters
2.1.1. Numerical Simulation Code
The simulator model used in this work was TOUGH+HYDRATE v1.0 by Moridis from theLawrence Berkeley National Laboratory (Berkeley, CA, USA). The model can simulate the formationand decomposition of natural gas hydrate, phase equilibrium, seepage, and heat and mass transferprocesses under complex conditions and non-isothermal conditions. In addition, the model cansimulate production from natural CH4-hydrate deposits in the subsurface (i.e., in permafrostand deep ocean sediments) as well as laboratory experiments of hydrate dissociation/formationin porous/fractured media [41]. TOUGH+HYDRATE v1.0 can also simulate the formation anddecomposition of gas hydrate under equilibrium and kinetics. The model includes four phases(liquid, gas, hydrate, and ice), and four components (water, methane, hydrate, and water-solubleinhibitors, such as salt, alcohol, etc.). By constructing fractured-porous media, the gas hydrate underdifferent geological conditions in permafrost regions and from deep-sea reservoirs can be simulatedusing the methods of depressurization, heating injection, and injection inhibition. TOUGH+HYDRATEv1.0 is a numerical simulator developed by Moridis at the Lawrence Berkeley National Laboratory,USA. It is the first member of TOUGH+, and the successor to TOUGH2.
2.1.2. System Parameters and Initialization of the Model
The geologic system used in this study was according to the SH7 site in the Shenhu area, SouthChina Sea. The hydrate samples from the SH7 site were almost pure methane hydrate (99.2%) in NGHconcentrations [19,21]. Therefore, only methane hydrate was simulated. The system parameters andthe initial conditions of the simulation are shown in Table 1. The main parameters in the simulationwere derived from previous literature on gas hydrate reservoirs in the region [19,21,27].
The water depth of the simulated gas hydrate reservoir was 1108 m, and the hydrate-bearinglayer (HBL) was located in the area of 155–177 m below the seabed, with a thickness of 22 m. The gashydrate reserve temperature was T0 = 14.15 ◦C, the pressure was P0 = 13.83 MPa, the saturation wasSH = 44%, the porosity was 38%, and the permeability was 7.5 × 10⁻¹⁴ m2 (75 mD).

Energies 2017, 10, 1241 5 of 16
Table 1. Production trial properties.
Parameter Value
Initial pressure P0 (at base of HBL) 13.83 MPaInitial temperature T0 (at base of HBL) 14.15 ◦C
Depth of seafloor 1108 mThermal gradient 0.0433 ◦C/mHBL thickness ZH 22 mDepth of HBL H1 155–177 m
Initial saturation in the HBL SH = 0.44; SA = 0.56Gas composition 100% CH4
Porosity Φ 0.38Water salinity (mass fraction) Xs 0.0305
Intrinsic permeability kx = ky = kz 7.5 × 10⁻¹⁴ m2
Permeability of fracture fracturing 5.2 × 10⁻¹³ m2
Grain density $R 2600 kg/m3
Dry thermal conductivity Kdry 1.0 W/(kg·◦C)Wet thermal conductivity Kwet 3.1 W/(kg·◦C)
Production pressure ∆P 5 MPa
Composite thermal conductivity model Kθ = Kdry +(√
SA +√
SH)(
Kwet −Kdry
)+ αSIKI
Capillary pressure model Pcap = −P01
[(S∗)−1/λ − 1
]1−λ
S∗ = (SA − SirA)/(SmxA − SirA).
SirA 0.29λ 0.45
P01 105 Pa
Relative permeability model
KrA = (S∗)n
KrG = (SG∗)nG
SA∗ = (SA − SirA)/(1− SirA)
SG∗ = (SG − SirG)/(1− SirG)
EPM #2 model
N 3.572nG 3.572SirA 0.30SirG 0.05
2.2. Design of the Production Well and Fracturing Crack
2.2.1. Production Well Design
In this paper, gas-hydrate reservoirs were exploited using a vertical well, and we investigatedthe depressurization efficiency effects of a variably-fractured NGH reservoir to make a first orderassessment of fracking efficiency. The simulation system was cylindrical. As shown in Figure 3, theproduction well was designed according to Su [29] and Li [42]. The well was located at the centerof the cylindrical simulation system, with a well radius of rw = 0.1 m. The production interval waslocated in the middle of gas hydrate reservoir, at a height of 6 m. The production interval was set inthe middle of the hydrate layer; because of pores and cracks in the upper and lower layers, natural gasis likely to overflow from the cover layer. The upper and lower hydrate layers temporarily seal andreduce the escape of natural gas through the caprock to a certain extent.

Energies 2017, 10, 1241 6 of 16Energies 2017, 10, 1241 6 of 16
Figure 3. Production well design and schematic of the marine hydrate deposit at the SH7 site.
2.2.2. Fracturing Crack Design
The formation of NGH in host sediment pore space results in a higher bulk modulus and increased mechanical strength. In an ideal case, where a hydrate deposit had a sufficient brittle response to hydraulic fracturing, our model would provide a base case with which actual testing can be compared in order to assess the likelihood of artificial fracturing of inducing additional permeability in semi-consolidated marine sediments, which, without NGH, would be expected to respond in a more mechanically-ductile manner.
This paper addresses vertical well fracturing cracks. When fracturing a target formation, the key parameters of cracks are not only affected by the stress distribution of the formation, but are also closely related to the physical and mechanical properties of the rock and jet parameters [43]. Therefore, in this paper, a reasonable simplification of crack fracturing was performed:
1. To consider the influence of the main fracture, secondary cracks after fracturing were ignored; 2. Cracks only formed in the horizontal direction; 3. There was only water in the cracks, without hydrate or broken rock particles.
As shown in Figure 4, the crack length was Lf = 40 m. The cracks were divided into spacing categories, Δl = 1 m, 2 m, 3 m, and 5 m, and crack height, h = 10 mm, respectively, for one, three, and five cracks.
Figure 3. Production well design and schematic of the marine hydrate deposit at the SH7 site.
2.2.2. Fracturing Crack Design
The formation of NGH in host sediment pore space results in a higher bulk modulus and increasedmechanical strength. In an ideal case, where a hydrate deposit had a sufficient brittle responseto hydraulic fracturing, our model would provide a base case with which actual testing can becompared in order to assess the likelihood of artificial fracturing of inducing additional permeability insemi-consolidated marine sediments, which, without NGH, would be expected to respond in a moremechanically-ductile manner.
This paper addresses vertical well fracturing cracks. When fracturing a target formation, thekey parameters of cracks are not only affected by the stress distribution of the formation, but are alsoclosely related to the physical and mechanical properties of the rock and jet parameters [43]. Therefore,in this paper, a reasonable simplification of crack fracturing was performed:
1. To consider the influence of the main fracture, secondary cracks after fracturing were ignored;2. Cracks only formed in the horizontal direction;3. There was only water in the cracks, without hydrate or broken rock particles.
As shown in Figure 4, the crack length was Lf = 40 m. The cracks were divided into spacingcategories, ∆l = 1 m, 2 m, 3 m, and 5 m, and crack height, h = 10 mm, respectively, for one, three, andfive cracks.

Energies 2017, 10, 1241 7 of 16Energies 2017, 10, 1241 7 of 16
Figure 4. Fracturing cracks diagram.
The permeability of the porous medium varied according to the porosity. The porosity and permeability have the following relationships [44–46]: = ∅ = ∅∅ (1)
= ∅ = ∅ − ∅∅ − ∅ (2)
where k0 is the formation permeability, k is the formation permeability after the porosity change, ∅ is the formation porosity,∅ is the porosity of the formation after the change, and ∅ is a non-zero critical porosity. In Equation (1), n is 2 or 3; in Equation (2), n is 10 or more. After calculations, the permeability of the cracks was 5.2 × 10⁻¹³ m2 when h = 10 mm. Table 2 shows the cracks parameters.
Table 2. Parameters of cracks and original formations.
Parameter Value of Cracks Value of Original FormationCrack quantity 1, 3, 5 0 Crack spacing 1 m, 2 m, 3 m, 5 m 0
Crack permeability 5.2 × 10⁻¹³ m2 (10 mm) 7.5 × 10⁻¹⁴ m2
3. Simulation Results and Discussion
As shown in Table 2, we carried out numerical simulations using two group parameters to analyze the effects on the depressurization efficiency of crack quantity and other parameters. A crack quantity of 0 referred to the hydrate layer before fracturing. When the crack quantity was equal to 1, there was one crack in the hydrate layer. When the crack quantity was equal to 3, there were three cracks in the hydrate layers. When the crack quantity was 1, the crack was located in the center of the production interval. When the crack quantities were 3 and 5, the middle crack was located in the center of the production interval. The distributions of the remaining cracks are shown in Table 3.
Figure 4. Fracturing cracks diagram.
The permeability of the porous medium varied according to the porosity. The porosity andpermeability have the following relationships [44–46]:
kk0
= F∅S =
(∅∅0
)n(1)
kk0
= F∅S =
(∅−∅c
∅0 −∅c
)n(2)
where k0 is the formation permeability, k is the formation permeability after the porosity change, ∅0
is the formation porosity, ∅ is the porosity of the formation after the change, and ∅c is a non-zerocritical porosity. In Equation (1), n is 2 or 3; in Equation (2), n is 10 or more. After calculations, thepermeability of the cracks was 5.2 × 10⁻¹³ m2 when h = 10 mm. Table 2 shows the cracks parameters.
Table 2. Parameters of cracks and original formations.
Parameter Value of Cracks Value of Original Formation
Crack quantity 1, 3, 5 0Crack spacing 1 m, 2 m, 3 m, 5 m 0
Crack permeability 5.2 × 10⁻¹³ m2 (10 mm) 7.5 × 10⁻¹⁴ m2
3. Simulation Results and Discussion
As shown in Table 2, we carried out numerical simulations using two group parameters to analyzethe effects on the depressurization efficiency of crack quantity and other parameters. A crack quantityof 0 referred to the hydrate layer before fracturing. When the crack quantity was equal to 1, there wasone crack in the hydrate layer. When the crack quantity was equal to 3, there were three cracks in thehydrate layers. When the crack quantity was 1, the crack was located in the center of the productioninterval. When the crack quantities were 3 and 5, the middle crack was located in the center of theproduction interval. The distributions of the remaining cracks are shown in Table 3.
Energies 2017, 10, 1241 8 of 16
Table 3. Simulation number and crack variable settings.
Group Simulation Number Crack Quantity Crack Height/mm Crack Spacing/m
1
1-1 0 0 01-2 1 10 01-3 3 10 21-4 5 10 1
2
2-1 3 10 12-2 3 10 22-3 3 10 32-4 3 10 5
3.1. Effect of Crack Quantity on the Efficiency of Natural Gas Hydrate Exploited by Depressurization
To study the effect of crack quantity on depressurization efficiency, four kinds of crackparameters were used in the first group. The spatial distributions of SH, P, and CH4 gas productionrates and cumulative volumes of the natural gas hydrate layer were compared under differentfracturing conditions.
3.1.1. Spatial Distributions of SH
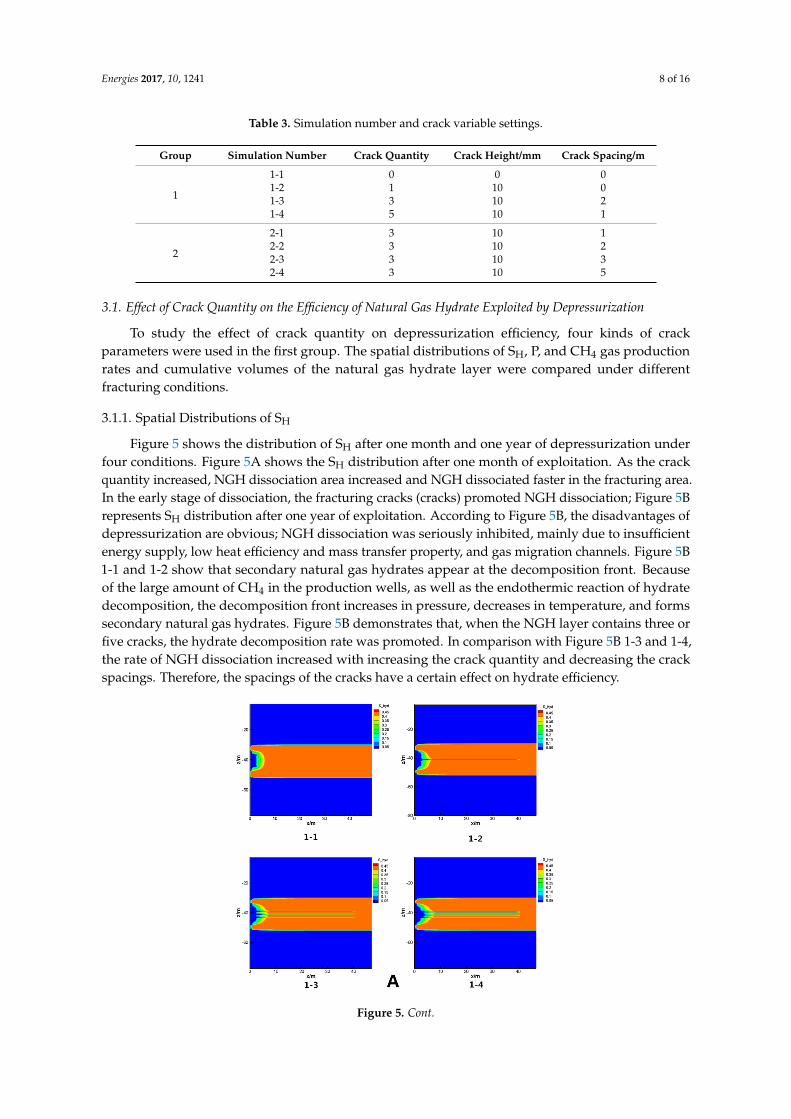
Figure 5 shows the distribution of SH after one month and one year of depressurization underfour conditions. Figure 5A shows the SH distribution after one month of exploitation. As the crackquantity increased, NGH dissociation area increased and NGH dissociated faster in the fracturing area.In the early stage of dissociation, the fracturing cracks (cracks) promoted NGH dissociation; Figure 5Brepresents SH distribution after one year of exploitation. According to Figure 5B, the disadvantages ofdepressurization are obvious; NGH dissociation was seriously inhibited, mainly due to insufficientenergy supply, low heat efficiency and mass transfer property, and gas migration channels. Figure 5B1-1 and 1-2 show that secondary natural gas hydrates appear at the decomposition front. Becauseof the large amount of CH4 in the production wells, as well as the endothermic reaction of hydratedecomposition, the decomposition front increases in pressure, decreases in temperature, and formssecondary natural gas hydrates. Figure 5B demonstrates that, when the NGH layer contains three orfive cracks, the hydrate decomposition rate was promoted. In comparison with Figure 5B 1-3 and 1-4,the rate of NGH dissociation increased with increasing the crack quantity and decreasing the crackspacings. Therefore, the spacings of the cracks have a certain effect on hydrate efficiency.
Energies 2017, 10, 1241 8 of 16
Table 3. Simulation number and crack variable settings.
Group Simulation Number Crack Quantity Crack Height/mm Crack Spacing/m
1
1-1 0 0 0 1-2 1 10 0 1-3 3 10 2 1-4 5 10 1
2
2-1 3 10 1 2-2 3 10 2 2-3 3 10 3 2-4 3 10 5
3.1. Effect of Crack Quantity on the Efficiency of Natural Gas Hydrate Exploited by Depressurization
To study the effect of crack quantity on depressurization efficiency, four kinds of crack parameters were used in the first group. The spatial distributions of SH, P, and CH4 gas production rates and cumulative volumes of the natural gas hydrate layer were compared under different fracturing conditions.
3.1.1. Spatial Distributions of SH
Figure 5 shows the distribution of SH after one month and one year of depressurization under four conditions. Figure 5A shows the SH distribution after one month of exploitation. As the crack quantity increased, NGH dissociation area increased and NGH dissociated faster in the fracturing area. In the early stage of dissociation, the fracturing cracks (cracks) promoted NGH dissociation; Figure 5B represents SH distribution after one year of exploitation. According to Figure 5B, the disadvantages of depressurization are obvious; NGH dissociation was seriously inhibited, mainly due to insufficient energy supply, low heat efficiency and mass transfer property, and gas migration channels. Figure 5B 1-1 and 1-2 show that secondary natural gas hydrates appear at the decomposition front. Because of the large amount of CH4 in the production wells, as well as the endothermic reaction of hydrate decomposition, the decomposition front increases in pressure, decreases in temperature, and forms secondary natural gas hydrates. Figure 5B demonstrates that, when the NGH layer contains three or five cracks, the hydrate decomposition rate was promoted. In comparison with Figure 5B 1-3 and 1-4, the rate of NGH dissociation increased with increasing the crack quantity and decreasing the crack spacings. Therefore, the spacings of the cracks have a certain effect on hydrate efficiency.
Figure 5. Cont.

Energies 2017, 10, 1241 9 of 16Energies 2017, 10, 1241 9 of 16
Figure 5. (A) Hydrate distribution at one month; (B) Hydrate distribution at one year.
3.1.2. Spatial Distributions of P
Figure 6 shows the distribution of P after one month and one year by depressurization under four conditions. When the temperature was 14 °C, the equilibrium pressure of methane hydrate was approximately 11 MPa [47]. When the pressure was lower than the equilibrium pressure, the hydrate began to decompose. Figure 6A shows that the rate of the pressure drop within the NGH-saturated host strata increased upon increasing the fracturing cracks in the initial stage. Figure 6B shows that the rate of the pressure drop within the NGH-saturated host strata decreased gradually. Moreover, the rate of the pressure drop within the NGH-saturated host strata, with fracturing cracks, was higher than the original NGH strata. Comparing the radius of the pressure drop under the four conditions, the rate of the pressure drop and the CH4 collection within the NGH-saturated host strata increased with fracturing cracks, and the cracks avoided the formation of secondary hydrates at the decomposition front. In the undecomposed region of natural gas hydrate, the transfer rate of the pressure drop first increased in the presence of fracturing cracks, and then decreased with increasing crack quantities.
Figure 6. (A) Pressure distribution at one month; (B) Hydrate distribution at one year.
Figure 5. (A) Hydrate distribution at one month; (B) Hydrate distribution at one year.
3.1.2. Spatial Distributions of P
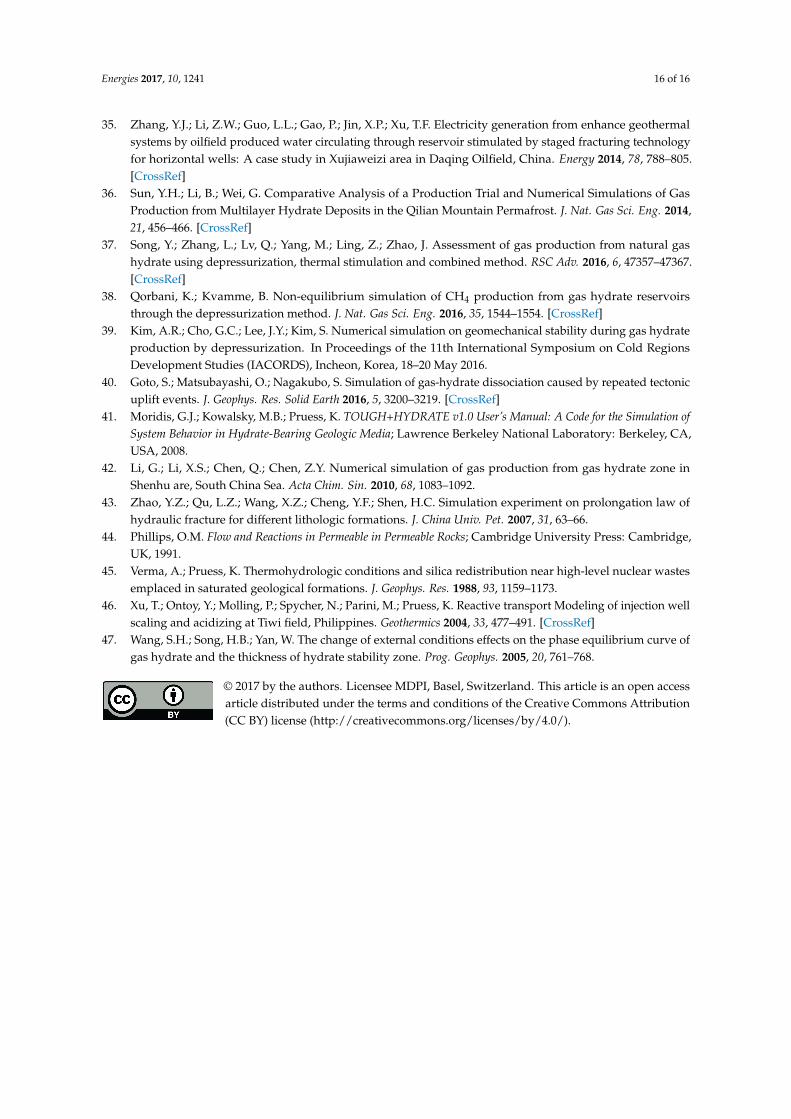
Figure 6 shows the distribution of P after one month and one year by depressurization underfour conditions. When the temperature was 14 ◦C, the equilibrium pressure of methane hydrate wasapproximately 11 MPa [47]. When the pressure was lower than the equilibrium pressure, the hydratebegan to decompose. Figure 6A shows that the rate of the pressure drop within the NGH-saturatedhost strata increased upon increasing the fracturing cracks in the initial stage. Figure 6B shows that therate of the pressure drop within the NGH-saturated host strata decreased gradually. Moreover, the rateof the pressure drop within the NGH-saturated host strata, with fracturing cracks, was higher thanthe original NGH strata. Comparing the radius of the pressure drop under the four conditions, therate of the pressure drop and the CH4 collection within the NGH-saturated host strata increased withfracturing cracks, and the cracks avoided the formation of secondary hydrates at the decompositionfront. In the undecomposed region of natural gas hydrate, the transfer rate of the pressure drop firstincreased in the presence of fracturing cracks, and then decreased with increasing crack quantities.
Energies 2017, 10, 1241 9 of 16
Figure 5. (A) Hydrate distribution at one month; (B) Hydrate distribution at one year.
3.1.2. Spatial Distributions of P
Figure 6 shows the distribution of P after one month and one year by depressurization under four conditions. When the temperature was 14 °C, the equilibrium pressure of methane hydrate was approximately 11 MPa [47]. When the pressure was lower than the equilibrium pressure, the hydrate began to decompose. Figure 6A shows that the rate of the pressure drop within the NGH-saturated host strata increased upon increasing the fracturing cracks in the initial stage. Figure 6B shows that the rate of the pressure drop within the NGH-saturated host strata decreased gradually. Moreover, the rate of the pressure drop within the NGH-saturated host strata, with fracturing cracks, was higher than the original NGH strata. Comparing the radius of the pressure drop under the four conditions, the rate of the pressure drop and the CH4 collection within the NGH-saturated host strata increased with fracturing cracks, and the cracks avoided the formation of secondary hydrates at the decomposition front. In the undecomposed region of natural gas hydrate, the transfer rate of the pressure drop first increased in the presence of fracturing cracks, and then decreased with increasing crack quantities.
Figure 6. (A) Pressure distribution at one month; (B) Hydrate distribution at one year. Figure 6. (A) Pressure distribution at one month; (B) Hydrate distribution at one year.

Energies 2017, 10, 1241 10 of 16
3.1.3. Production Rate and Cumulative Volume of CH4
Figure 7 shows the CH4 production rate and the cumulative volume curve after one year ofdepressurization under the four conditions. The CH4 production rate first increased and then decreased,reaching its maximum in 40 days. At that time, the CH4 gas production rates of 1-3 and 1-4 weresignificantly greater than that of 1-1. This is because, in the initial stage of hydrate dissolution, theporosity and permeability of the NGH-saturated host strata with fracturing cracks was higher than thatof the original NGH strata, so the NGH could be decomposed faster. Thus, CH4 was rapidly discharged.
Energies 2017, 10, 1241 10 of 16
3.1.3. Production Rate and Cumulative Volume of CH4
Figure 7 shows the CH4 production rate and the cumulative volume curve after one year of depressurization under the four conditions. The CH4 production rate first increased and then decreased, reaching its maximum in 40 days. At that time, the CH4 gas production rates of 1-3 and 1-4 were significantly greater than that of 1-1. This is because, in the initial stage of hydrate dissolution, the porosity and permeability of the NGH-saturated host strata with fracturing cracks was higher than that of the original NGH strata, so the NGH could be decomposed faster. Thus, CH4 was rapidly discharged.
Figure 7. Production rate and cumulative volume of CH4.
In the early stages of exploitation, the CH4 gas production rate of 1-2 was higher than that of 1-1. NGH dissociation was faster from a single fracture, and the CH4 migration rate was small. At this time, one crack did not promote hydrate decomposition. Comparing the CH4 gas production rates of 1-3, 1-4, and 1-1 showed that the rate of CH4 production increased with increasing crack quantities. As the crack quantities increased, the porosity and permeability of the fractured area increased, which enlarged the diameter of the gas migration channels for CH4 migration into the production wells, and promoted NGH decomposition. However, compared with the CH4 production rates of 1-3 and 1-4, a crack quantity of greater than three weakened the hydrate dissociation efficiency rate.
As exploitation progressed (after 190 days), the 1-2 fracturing effect became apparent and the CH4 gas production rate increased and exceeded that of 1-1. This finding was observed because fracturing can promote a pressure drop in the internal hydrate layer and promote the decomposition of the hydrate as exploitation progressed. At the same time, one crack can effectively transport the decomposed CH4 into the production well because of the lower rate of natural gas hydrate dissociation, thereby reducing the pressure of the decomposition front and increasing the CH4 production rate. After 300 days, the CH4 production rate tended to stabilize, and the effects on the depressurization efficiency of the fractured NGH reservoir was obvious. At the same time, the CH4 production rates increased by 10.48%, 19.85%, and 25.62%, respectively, and the cumulative volume of CH4 increased by 0.67%, 19.07%, and 25.87%, respectively, in comparison with 1-2, 1-3, 1-4, and 1-1. Increasing the number of cracks greatly improved the natural gas hydrate decomposition efficiency by depressurization. Comparing the three quantities of cracks, the 1-3 CH4 production rate increased by 8.51%, and the cumulative volume of CH4 increased by 18.27% over 1-2. When comparing 1-4 with 1-3, the CH4 production rate increased by 4.81% and the cumulative volume of CH4 increased by 5.71%. Overall, as the number of fractured cracks increased from one to three to five, the efficiency of NGH dissociation first increased and then decreased.
Figure 7. Production rate and cumulative volume of CH4.
In the early stages of exploitation, the CH4 gas production rate of 1-2 was higher than that of 1-1.NGH dissociation was faster from a single fracture, and the CH4 migration rate was small. At thistime, one crack did not promote hydrate decomposition. Comparing the CH4 gas production rates of1-3, 1-4, and 1-1 showed that the rate of CH4 production increased with increasing crack quantities.As the crack quantities increased, the porosity and permeability of the fractured area increased, whichenlarged the diameter of the gas migration channels for CH4 migration into the production wells, andpromoted NGH decomposition. However, compared with the CH4 production rates of 1-3 and 1-4, acrack quantity of greater than three weakened the hydrate dissociation efficiency rate.
As exploitation progressed (after 190 days), the 1-2 fracturing effect became apparent and the CH4
gas production rate increased and exceeded that of 1-1. This finding was observed because fracturingcan promote a pressure drop in the internal hydrate layer and promote the decomposition of the hydrateas exploitation progressed. At the same time, one crack can effectively transport the decomposed CH4
into the production well because of the lower rate of natural gas hydrate dissociation, thereby reducingthe pressure of the decomposition front and increasing the CH4 production rate. After 300 days,the CH4 production rate tended to stabilize, and the effects on the depressurization efficiency of thefractured NGH reservoir was obvious. At the same time, the CH4 production rates increased by10.48%, 19.85%, and 25.62%, respectively, and the cumulative volume of CH4 increased by 0.67%,19.07%, and 25.87%, respectively, in comparison with 1-2, 1-3, 1-4, and 1-1. Increasing the numberof cracks greatly improved the natural gas hydrate decomposition efficiency by depressurization.Comparing the three quantities of cracks, the 1-3 CH4 production rate increased by 8.51%, and thecumulative volume of CH4 increased by 18.27% over 1-2. When comparing 1-4 with 1-3, the CH4
production rate increased by 4.81% and the cumulative volume of CH4 increased by 5.71%. Overall, asthe number of fractured cracks increased from one to three to five, the efficiency of NGH dissociationfirst increased and then decreased.

Energies 2017, 10, 1241 11 of 16
3.2. Effect of Crack Spacing on the Efficiency of Natural Gas Hydrate Exploited by Depressurization
From the distribution of SH in Figure 5, the cracks promoted NGH dissociation bydepressurization, and the dissociation rates varied according to the crack spacing conditions. Therefore,when the crack spacing was the appropriate value, the rate of NGH dissociation was the highest inthat fracturing region.
3.2.1. CH4 Production Rate and Cumulative Volume
Figure 8 shows the CH4 production rate and cumulative volume after five years ofdepressurization exploitation under four crack spacing conditions. The CH4 production rate didnot have a large disparity at the initial stage of exploitation, and CH4 gas production rates graduallydecreased with the progression of exploitation. The CH4 production rate of the hydrate layer, ∆l =3m, was considerably greater than those of the other three conditions at the same time. By observingthe cumulative volume curve of CH4, under the conditions of ∆l = 1 m, ∆l = 2 m, and ∆l = 5 m, thecumulative volume of CH4 was similar. However, the cumulative volume of CH4 was higher underthe condition of ∆l = 3 m, and the cumulative volume of CH4 was increased by 21.14%, 26.19%, and17.78% for the conditions of ∆l = 1 m, ∆l = 2 m and ∆l = 5 m, respectively. Comparing ∆l = 3 m andthe original NGH layer in Figure 7, the cumulative volume of CH4 increased by 43.49% in one year.The results show that the fracturing effect has the most obvious influence on the NGH production andthe production efficiency is the highest when the crack spacing is ∆l = 3 m. To determine why theCH4 production rates and cumulative volumes were considerably greater than those of the other threeconditions, the SH distributions of these four conditions were analyzed.
Energies 2017, 10, 1241 11 of 16
3.2. Effect of Crack Spacing on the Efficiency of Natural Gas Hydrate Exploited by Depressurization
From the distribution of SH in Figure 5, the cracks promoted NGH dissociation by depressurization, and the dissociation rates varied according to the crack spacing conditions. Therefore, when the crack spacing was the appropriate value, the rate of NGH dissociation was the highest in that fracturing region.
3.2.1. CH4 Production Rate and Cumulative Volume
Figure 8 shows the CH4 production rate and cumulative volume after five years of depressurization exploitation under four crack spacing conditions. The CH4 production rate did not have a large disparity at the initial stage of exploitation, and CH4 gas production rates gradually decreased with the progression of exploitation. The CH4 production rate of the hydrate layer, Δl =3 m, was considerably greater than those of the other three conditions at the same time. By observing the cumulative volume curve of CH4, under the conditions of Δl = 1 m, Δl = 2 m, and Δl = 5 m, the cumulative volume of CH4 was similar. However, the cumulative volume of CH4 was higher under the condition of Δl = 3 m, and the cumulative volume of CH4 was increased by 21.14%, 26.19%, and 17.78% for the conditions of Δl = 1 m, Δl = 2 m and Δl = 5 m, respectively. Comparing Δl = 3 m and the original NGH layer in Figure 7, the cumulative volume of CH4 increased by 43.49% in one year. The results show that the fracturing effect has the most obvious influence on the NGH production and the production efficiency is the highest when the crack spacing is Δl = 3 m. To determine why the CH4 production rates and cumulative volumes were considerably greater than those of the other three conditions, the SH distributions of these four conditions were analyzed.
Figure 8. The production rate and the cumulative volume curve of CH4 in the gas hydrate layer with three cracks under different crack spacings (Δl = 1 m, 2 m, 3 m, 5 m) were exploited by 5 MPa in five years.
3.2.2. Spatial Distribution of SH
Figure 9 shows the distribution of SH after one year and five years of depressurization under four crack spacing conditions. One year after the exploitation, the smaller crack spacing of 2-1 led to the complete dissociation of NGH around the crack areas; NGH dissociation in a non-fracturing area was slower. With 2-2, we can see that the crack spacing was moderate and NGH around the fracturing area dissociated faster. The distances among the three cracks in 2-4 were larger, and the upper and lower cracks were closer to the upper and lower boundaries of the NGH layer, which promoted the dissociation of the upper and lower NGH. Because of the large distance between adjacent cracks, the NGH dissociation between cracks had no obvious effect. In 2-3, the NGH dissociation among the
Figure 8. The production rate and the cumulative volume curve of CH4 in the gas hydrate layer withthree cracks under different crack spacings (∆l = 1 m, 2 m, 3 m, 5 m) were exploited by 5 MPa infive years.
3.2.2. Spatial Distribution of SH
Figure 9 shows the distribution of SH after one year and five years of depressurization under fourcrack spacing conditions. One year after the exploitation, the smaller crack spacing of 2-1 led to thecomplete dissociation of NGH around the crack areas; NGH dissociation in a non-fracturing area wasslower. With 2-2, we can see that the crack spacing was moderate and NGH around the fracturingarea dissociated faster. The distances among the three cracks in 2-4 were larger, and the upper andlower cracks were closer to the upper and lower boundaries of the NGH layer, which promoted thedissociation of the upper and lower NGH. Because of the large distance between adjacent cracks, the

Energies 2017, 10, 1241 12 of 16
NGH dissociation between cracks had no obvious effect. In 2-3, the NGH dissociation among thecracks was promoted by the interactions between two adjacent cracks. Since the upper and lowercracks in 2-3 are closer to the upper and lower boundaries of the hydrate layer than those in 2-2, thecracks in this area appear larger and their role in NGH decomposition is more obvious. It can be seenfrom Figure 9B that, after five years of exploitation, the cracks in 2-1 and 2-2 are more concentrated, andthe rate of NGH dissociation is greater in the fracturing area. NGH in the fracturing area was limitedby the heat compensation mechanism; the temperature of the cracking area gradually reduced andformed secondary hydrates, which inhibited NGH dissociation to a certain extent. When ∆l = 3 m, thethree cracks were distributed in the upper, middle, and lower regions of the NGH layer, respectively.The cracks not only promoted NGH dissociation around fracturing regions, but also promoted thedissociation of the upper and lower NGH layers. The NGH dissociation range could increase andthe concentration of the NGH dissociation region could be avoided, which would prevent a localtemperature decrease and a pressure increase, which reduces the inhibition of the hydrate dissociationvia the thermal compensation mechanism. Meanwhile, the cracks in 2-4 were far apart and the NGHdissociation rate was small. This also revealed that the CH4 production rate and cumulative volumewere much higher than those of the other three cases, where the crack spacing was ∆l = 3 m.
Energies 2017, 10, 1241 12 of 16
cracks was promoted by the interactions between two adjacent cracks. Since the upper and lower cracks in 2-3 are closer to the upper and lower boundaries of the hydrate layer than those in 2-2, the cracks in this area appear larger and their role in NGH decomposition is more obvious. It can be seen from Figure 9B that, after five years of exploitation, the cracks in 2-1 and 2-2 are more concentrated, and the rate of NGH dissociation is greater in the fracturing area. NGH in the fracturing area was limited by the heat compensation mechanism; the temperature of the cracking area gradually reduced and formed secondary hydrates, which inhibited NGH dissociation to a certain extent. When Δl = 3 m, the three cracks were distributed in the upper, middle, and lower regions of the NGH layer, respectively. The cracks not only promoted NGH dissociation around fracturing regions, but also promoted the dissociation of the upper and lower NGH layers. The NGH dissociation range could increase and the concentration of the NGH dissociation region could be avoided, which would prevent a local temperature decrease and a pressure increase, which reduces the inhibition of the hydrate dissociation via the thermal compensation mechanism. Meanwhile, the cracks in 2-4 were far apart and the NGH dissociation rate was small. This also revealed that the CH4 production rate and cumulative volume were much higher than those of the other three cases, where the crack spacing was Δl = 3 m.
Figure 9. The hydrate distribution in the gas hydrate layer with three cracks under different crack spacings (Δl = 1 m, 2 m, 3 m, 5 m) exploited by 5 MPa. (A) Hydrate distribution at one year; (B) Hydrate distribution at five years.
Figure 9. The hydrate distribution in the gas hydrate layer with three cracks under different crackspacings (∆l = 1 m, 2 m, 3 m, 5 m) exploited by 5 MPa. (A) Hydrate distribution at one year; (B) Hydratedistribution at five years.

Energies 2017, 10, 1241 13 of 16
4. Conclusions
In this paper, an NGH reservoir was simulated using TOUGH+HYDRATE v1.0 via thedepressurization method, and the effects on production efficiency of a variably-fractured NGHreservoir were compared. Analyses on the change in distribution of SH, P, as well as the CH4 productionrate and the cumulative volume under different crack quantities, crack heights, and crack spacings areas follows:
1. The exploitation of a fractured NGH reservoir using the depressurization method increasedthe transfer rate of the pressure drop to the interior NGH layer, and adjacent cracks promotedhydrate decomposition.
2. The exploitation of a fractured NGH reservoir using the depressurization method increased CH4
production rates by a maximum of 25.62%, and CH4 production rates increased with increasingcrack quantity, although the growth range was reduced.
3. The exploitation of NGH reservoirs with different crack spacings (∆l = 1 m, 2 m, 3 m and 5 m)using the depressurization method initially increased, and then decreased the CH4 productionrate and cumulative volume, which indicated that ∆l = 3 m was the most favorable crack spacingfor NGH exploitation, and the cumulative volume of CH4 increased by 43.49%.
In addition, the increase in productivity in points 2 and 3 was suggested by the numericalsimulation, but has not been validated in the field.
In conclusion, the fracturing effect can effectively improve the exploitation efficiency of naturalgas hydrate reservoirs. When the crack quantity was three and the crack spacing was ∆l = 3 m, thenatural gas hydrate exploitation efficiency was the most obvious.
Acknowledgments: This study has been supported by National Natural Science Foundation of China(Grant No.41672361, Grant No. 41502343 and Grant No. 51474112).
Author Contributions: Lin Yang analyzed the data and wrote the manuscript. Lin Yang, Yong Chen and Xitong Liperformed the simulations. Rui Jia, Lin Yang and Chen Chen conceived the original ideas. All authors discussedthe results and commented on the manuscript. Chen Chen, Youhong Sun and Wei Guo directed the overall project.
Conflicts of Interest: The authors declare no conflicts of interest.
Notation
z position of HBL below ocean surface (m)ZH HBL thickness (m)H1 Depth of HBL below seafloor (m)H2 Depth of seafloor (m)G Thermal gradient below seafloor (◦C/m)P0 Initial pressure (at base of HBL) (MPa)∆P Production pressure (MPa)Pcap Capillary pressure (MPa)P01 Atmosphere pressure (Pa)T0 Initial temperature (at base of HBL) (◦C)kx, ky, kz Intrinsic permeability (m2)kc Permeability of fracturing cracks (h2 = 10 mm) (m2)krA Aqueous relative permeability (m2)krG Gas relative permeability (m2)Kdry Dry thermal conductivity (W/(kg·◦C))Kwet Wet thermal conductivity (W/(kg·◦C))KΘ Thermal conductivity (W/(kg·◦C))Φ Porosity$R Grain density (kg/m3)SH Saturation of natural gas hydrateSA Saturation of aqueous

Energies 2017, 10, 1241 14 of 16
r Radius (m)Xs Salinityλ Van Genuchten exponent—Table 1h Crack height (mm)Lf Crack length (m)∆l Crack spacing (m)
Subscripts and Superscripts
A Aqueous phaseB Base of HBLcap CapillaryG Gas phaseHBL Hydrate-bear layerirA Irreducible aqueous phaseirG Irreducible gasn Permeability reduction exponent—Table 1nG Gas permeability reduction exponent—Table 1OB OverburdenUB Underburden
References
1. Sloan, E.D.; Koh, C.A. Clathrate Hydrates of Natural Gases, 3rd ed.; CRC Press: Boca Raton, FL, USA, 2008.2. Sun, Y.H.; Jia, R.; Guo, W.; Zhang, Y.Q.; Zhu, Y.H.; Li, B.; Li, K. Design and experiment study of the steam
mining system for natural gas hydrates. Energy Fuels 2012, 26, 7280–7287. [CrossRef]3. Su, Z.; Cao, Y.C.; Yang, R.; Zhang, K.N.; Wu, N.Y. Feasibility of gas production from hydrate reservoir
considering heat conduction: Taking Shenhu area in the South China Sea as an example. Geoscience 2011, 25,608–616.
4. Qorbani, K.; Kvamme, B.; Kuznetsova, T. Using a reactive transport simulator to simulate CH4 productionfrom bear island basin in the Barents Sea utilizing the depressurization method. Energies 2017, 10, 187.[CrossRef]
5. Katagiri, J.; Yoneda, J.; Tenma, N. Multiobjective optimization of the partical aspect ratio for gravel pack in amethane-hydrate reservoir using pore scale simulation. J. Nat. Gas Sci. Eng. 2016, 35, 920–927. [CrossRef]
6. Max, M.D.; Johnson, A.H. Exploration and Production of Oceanic Natural Gas Hydrate: Critical Factors forCommercialization; Springer International Publishing AG: Basel, Switzerland, 2016; p. 405.
7. Sun, X.J.; Chen, Y.F.; Li, L.D.; Cui, Q.; Li, Q.P. Triaxial compression test on synthetic core sample withsimulated hydrate-bearing sediments. Pet. Drill. Tech. 2012, 40, 52–57.
8. Max, M.D.; Johnson, A.H. Diagenetic methane hydrate formation in permafrost: A new gas play?In Proceedings of the OTC Arctic Technology Conference, Houston, TX, USA, 7–9 February 2011.
9. Johnson, A.H. Gas Hydrate In: GEA, 2011: The Global Energy Assessment. IIASA, Laxenburg; Austria andCambridge University Press: Cambridge, UK; New York, NY, USA, 2012; pp. 35–43.
10. Mas, M.D.; Johnson, A.H. Could gas hydrate in fine-grained sediments be a precursor for some shale gasdeposits? Pet. Geosci. 2012, 18, 231–238.
11. Max, M.D.; Johnson, A.H. Methane Hydrate/Clathrate Conversion. In Clean Hydrocarbon Fuel ConversionTechnology; Khan, M.R., Ed.; Woodhead Publishing Series in Energy No. 19; Woodhead Publishing Ltd.:Cambridge, UK, 2011; pp. 413–434. ISBN 1 84569 727 8.
12. Liang, Y.P.; Li, X.S.; Li, B. Assessment of Gas Production Potential from Hydrate Reservoir in Qilian MountainPermafrost Using Five-Spot Horizontal Well System. Energies 2015, 8, 10796–10817. [CrossRef]
13. Ruan, X.; Li, X.S.; Xu, C.G. Numerical investigation of the production behavior of methane hydrate underdepressurization conditions combined with well-wall heating. Energies 2017, 10, 161. [CrossRef]
14. Wood, D.A. Gas hydrate research advances steadily on multiple fronts: A collection of published research(2009–2015). J. Nat. Gas Sci. Eng. 2015, 24, A1–A8. [CrossRef]

Energies 2017, 10, 1241 15 of 16
15. Wang, B.; Huo, P.; Luo, T.; Fan, Z.; Liu, F.L.; Xiao, B.; Yang, M.J.; Zhao, J.F.; Song, Y.C. Analysis of the PhysicalProperties of Hydrate Sediments Recovered from the Pearl River Mouth Basin in the South China Sea:Preliminary Investigation for Gas Hydrate Exploitation. Energies 2017, 10, 531. [CrossRef]
16. Zhao, J.; Zhang, L.; Chen, X.; Zhang, Y.; Liu, Y.; Song, Y. Combined replacement and depressurizationmethane hydrate recovery method. Energy Explor. Exploit. 2016, 34, 129–139. [CrossRef]
17. Birkedal, K.A.; Hauge, L.P.; Graue, A.; Ersland, G. Transport Mechanisms for CO2-CH4 Exchange and SafeCO2 Storage in Hydrate-Bearing Sandstone. Energies 2015, 8, 4073–4095. [CrossRef]
18. Voronov, V.P.; Gorodetskii, E.E.; Muratov, A.R. Study of methane replacement in hydrates by carbon dioxidein a cyclic process. J. Nat. Gas Sci. Eng. 2014, 21, 1107–1112. [CrossRef]
19. Li, G.; Li, X.S.; Zhang, K.N.; Li, B.; Zhang, Y. Effects of impermeable boundaries on gas production fromhydrate accumulations in the Shenhu area of the south China sea. Energies 2013, 6, 4078–4096. [CrossRef]
20. Sun, Z.X.; Xin, Y.; Sun, Q.; Ma, R.L.; Zhang, J.G.; Lv, S.H.; Cai, M.Y.; Wang, H.X. Numerical simulation of thedepressurization process of a natural gas hydrate reservoir: An attempt at optimization of field operationalfactors with multiple wells in a real 3D geological model. Energies 2016, 9, 714. [CrossRef]
21. Li, G.; Moridis, G.J.; Zhang, K.; Li, X.S. Evaluation of gas production potential from marine gas hydratedeposits in Shenhu area of South China Sea. Energy Fuels 2010, 24, 6018–6033. [CrossRef]
22. Liang, J.Q.; Wang, H.B.; Su, X.; Fu, S.Y.; Wang, L.F.; Guo, Y.Q.; Chen, F.; Shang, J.J. Natural gas hydrateformation conditions and the associated controlling factors in the northern slope of the South China Sea.Nat. Gas Ind. 2014, 34, 128–135.
23. Yamamoto, K. Methane hydrate offshore production test in the eastern Nankai trough; a milestone on thepath to real energy resource. In Proceedings of the 8th International Conference on Gas Hydrates (ICGH8),Beijing, China, 28 July–1 August 2014.
24. Kida, M.; Suzuki, K.; Kawamura, T.; Oyama, H.; Nagao, J. Characteristics of natural gas hydrates occurringin pore-spaces of marine sediments collected from the Eastern Nankai trough, off Japan. Energy Fuels 2009,23, 5580–5586.
25. Kanno, T.; Takekoshi, M.; Wang, X.; Chee, S.; Fukuhara, M.; Osawa, O.; Yamamoto, K.; Fujii, T.; Takayama, T.;Suzuki, K. Temperature measurement of gas hydrate dissociation during the world-first offshore productiontest. In Proceedings of the Offshore Technology Conference, Houston, TX, USA, 5–8 May 2014.
26. Yamamoto, K. Overview and introduction: Pressure core-sampling and analyses in the 2012–2013 MH21offshore test of gas production from methane hydrates in the eastern Nankai Trough. Mar. Pet. Geol. 2015,66, 296–309. [CrossRef]
27. Hu, L.T.; Zhang, K.N.; Gao, T. Numerical studies of gas hydrate production from gas hydrate zong usingheat injection and depressurization in Shenhu area, the South China Sea. Geoscience 2011, 25, 675–682.
28. Jin, G.R.; Xu, T.F.; Liu, X.; Xin, X. Optimization of gas production from hydrate deposit using jointdepressurization and thermal stimulation. J. Central South Univ. (Sci. Technol.) 2015, 46, 1534–1543.
29. Su, Z.; Li, H.; Wu, N.Y.; Yang, S.X. Effect of thermal stimulation on gas production from hydrate deposits inShenhu area of the South China Sea. Earth Sci. 2013, 56, 601–610. [CrossRef]
30. Zhang, K.N.; Moridis, G.J.; Wu, N.Y.; Li, X.; Reagan, M.T. Evaluation of alternative horizontal well designsfor gas production from hydrate deposits in the Shenhu Area, South China Sea. In Proceedings of theInternational Oil and Gas Conference and Exhibition in China, Beijing, China, 8–10 June 2010.
31. Wu, Q.; Xu, Y.; Liu, Y.Z.; Ding, Y.H.; Wang, X.Q.; Wang, T.F. The current situation of stimulated reservoirvolume for shale in U.S. and its inspiration to China. Oil Drill. Product. Technol. 2011, 33, 1–7.
32. Lancaster, D.E.; Holditch, S.A.; Mcketta, S.F.; Hill, R.E.; Guidry, F.K.; Jochen, J.E. Resercoir evaluation,completion techniques, and recent reesuls from Barnett shale development in the fort worth basin.In Proceedings of the SPE Annual Technical Conference and Exhibition, Washington, DC, USA,4–7 October 1992.
33. Li, Y.; Cao, G. Development technology for low-permeability sandstone reservoirs in Shengli Oil field.Pet. Explor. Dev. 2005, 32, 123–126.
34. Wu, Q.; Xu, Y.; Wang, T.F.; Wang, X.Q. The revolution of reservoir stimulation: An introduction of volumefracturing. Nat. Gas Ind. 2011, 31, 7–12.
Energies 2017, 10, 1241 16 of 16
35. Zhang, Y.J.; Li, Z.W.; Guo, L.L.; Gao, P.; Jin, X.P.; Xu, T.F. Electricity generation from enhance geothermalsystems by oilfield produced water circulating through reservoir stimulated by staged fracturing technologyfor horizontal wells: A case study in Xujiaweizi area in Daqing Oilfield, China. Energy 2014, 78, 788–805.[CrossRef]
36. Sun, Y.H.; Li, B.; Wei, G. Comparative Analysis of a Production Trial and Numerical Simulations of GasProduction from Multilayer Hydrate Deposits in the Qilian Mountain Permafrost. J. Nat. Gas Sci. Eng. 2014,21, 456–466. [CrossRef]
37. Song, Y.; Zhang, L.; Lv, Q.; Yang, M.; Ling, Z.; Zhao, J. Assessment of gas production from natural gashydrate using depressurization, thermal stimulation and combined method. RSC Adv. 2016, 6, 47357–47367.[CrossRef]
38. Qorbani, K.; Kvamme, B. Non-equilibrium simulation of CH4 production from gas hydrate reservoirsthrough the depressurization method. J. Nat. Gas Sci. Eng. 2016, 35, 1544–1554. [CrossRef]
39. Kim, A.R.; Cho, G.C.; Lee, J.Y.; Kim, S. Numerical simulation on geomechanical stability during gas hydrateproduction by depressurization. In Proceedings of the 11th International Symposium on Cold RegionsDevelopment Studies (IACORDS), Incheon, Korea, 18–20 May 2016.
40. Goto, S.; Matsubayashi, O.; Nagakubo, S. Simulation of gas-hydrate dissociation caused by repeated tectonicuplift events. J. Geophys. Res. Solid Earth 2016, 5, 3200–3219. [CrossRef]
41. Moridis, G.J.; Kowalsky, M.B.; Pruess, K. TOUGH+HYDRATE v1.0 User’s Manual: A Code for the Simulation ofSystem Behavior in Hydrate-Bearing Geologic Media; Lawrence Berkeley National Laboratory: Berkeley, CA,USA, 2008.
42. Li, G.; Li, X.S.; Chen, Q.; Chen, Z.Y. Numerical simulation of gas production from gas hydrate zone inShenhu are, South China Sea. Acta Chim. Sin. 2010, 68, 1083–1092.
43. Zhao, Y.Z.; Qu, L.Z.; Wang, X.Z.; Cheng, Y.F.; Shen, H.C. Simulation experiment on prolongation law ofhydraulic fracture for different lithologic formations. J. China Univ. Pet. 2007, 31, 63–66.
44. Phillips, O.M. Flow and Reactions in Permeable in Permeable Rocks; Cambridge University Press: Cambridge,UK, 1991.
45. Verma, A.; Pruess, K. Thermohydrologic conditions and silica redistribution near high-level nuclear wastesemplaced in saturated geological formations. J. Geophys. Res. 1988, 93, 1159–1173.
46. Xu, T.; Ontoy, Y.; Molling, P.; Spycher, N.; Parini, M.; Pruess, K. Reactive transport Modeling of injection wellscaling and acidizing at Tiwi field, Philippines. Geothermics 2004, 33, 477–491. [CrossRef]
47. Wang, S.H.; Song, H.B.; Yan, W. The change of external conditions effects on the phase equilibrium curve ofgas hydrate and the thickness of hydrate stability zone. Prog. Geophys. 2005, 20, 761–768.
© 2017 by the authors. Licensee MDPI, Basel, Switzerland. This article is an open accessarticle distributed under the terms and conditions of the Creative Commons Attribution(CC BY) license (http://creativecommons.org/licenses/by/4.0/).


![BASIN-SCALE ASSESSMENT OFGAS HYDRATE DISSOCIATION IN ... › icgh7 › papers › icgh2011Final00759.pdf · of water clathrate crystals[1]. Natural gas hydrate deposits occur in geologic](https://img.pdfslide.net/doc/110x75/5f10cdf47e708231d44ae5ec/basin-scale-assessment-ofgas-hydrate-dissociation-in-a-icgh7-a-papers-a.jpg)

![Exploring methane-hydrate formation and dissociation in ...archimer.ifremer.fr/doc/00245/35580/34209.pdf · hydrate research, Sun et al. [36] highlighted the difficulties of investigating](https://img.pdfslide.net/doc/110x75/5aad7cd37f8b9a8d678e3cd7/exploring-methane-hydrate-formation-and-dissociation-in-research-sun-et-al.jpg)


![Hydrate thermal dissociation behavior and dissociation enthalpies in methane … · mole basis, methane hydrate consists of 85.69(± 0.14)% water and 14.31(± 0.14)% methane [2]](https://img.pdfslide.net/doc/110x75/5fbd4df89eb682309316b186/hydrate-thermal-dissociation-behavior-and-dissociation-enthalpies-in-methane-mole.jpg)
![Effect of Perforation Interval Design on Gas Production from ......2020/04/09 · endothermic reaction [7], and reservoir deformation [8]. At present, in situ dissociation of hydrate](https://img.pdfslide.net/doc/110x75/60fda6849c7c993e3d0eae6c/effect-of-perforation-interval-design-on-gas-production-from-20200409.jpg)