Embed Size (px)
Citation preview
arX
iv:1
202.
5005
v2 [
cond
-mat
.mtr
l-sc
i] 1
2 Ju
n 20
12
Structure identification methods for atomistic
simulations of crystalline materials
Alexander Stukowski
Lawrence Livermore National Laboratory, Livermore, CA 94550, USA
E-mail: [email protected]
Abstract. We discuss existing and new computational analysis techniques toclassify local atomic arrangements in large-scale atomistic computer simulationsof crystalline solids. This article includes a performance comparison oftypical analysis algorithms such as Common Neighbor Analysis, Centrosymmetry
Analysis, Bond Angle Analysis, Bond Order Analysis, and Voronoi Analysis.In addition we propose a simple extension to the Common Neighbor Analysis
method that makes it suitable for multi-phase systems. Finally, we introduce anew structure identification algorithm, the Neighbor Distance Analysis, that isdesigned to identify atomic structure units in grain boundaries.
This paper has been published in Modelling and Simulation in Materials Science and
Engineering 20 (2012), 045021.

1 INTRODUCTION
1. Introduction
Atomistic simulation methods such as molecular dynamics (MD), molecular statics,and Monte Carlo schemes are routinely used to study crystalline materials at theatomic scale. In many cases crystal defects play a critical role in materials behavior,and their identification in the simulation data is essential for the understanding ofmaterials properties. Classical atomistic simulation models, however, do not keeptrack of crystal defects explicitly. These models are governed by a Hamiltonian orother rules which determine the trajectories of individual particles. Therefore, crystaldefects and defect-free crystal regions must be recovered from the generated particle-position datasets in a post-processing step to enable the interpretation of simulationresults.
For this purpose, many computational analysis methods have been developed inthe past. Their task is to assign a structural type to each atom or particle based onan analysis of its local environment. Most such methods attempt to match a localstructure to an idealized one (such as fcc or bcc), and measure how closely they fit.This information can then be used to color particles for visualization purposes or toquantify the occurrence of different crystalline phases and defects in a simulation.Another important application is filtering the simulation data on the fly to reduce itto a manageable amount, e.g. by storing only particles with an atypical environment.
Our goal is to give an overview of current computational analysis techniques,as they are offered by many visualization tools and simulation codes, and as theyare employed in many recent simulation studies described in the literature. Inparticular we will review the most commonly used structure characterization methodsfor molecular dynamics simulations of crystalline solids:
• (a) energy filtering,
• (b) centrosymmetry parameter analysis (CSP) [1],
• (c) bond order analysis [2],
• (d) common neighbor analysis (CNA) [3],
• (e) bond angle analysis (BAA) [4], and
• (f) Voronoi analysis.
In addition to describing the respective strengths and weaknesses of these methods,we introduce two new identification schemes:
• (g) adaptive common neighbor analysis (a-CNA) and
• (h) neighbor distance analysis (NDA).
The adaptive CNA is a simple extension of the common neighbor analysis methodto improve the characterization of multi-phase systems. The computationally moreexpensive NDA is targeted at the classification of complex structural environments asthey occur inside crystal defects such as grain boundaries.
As part of this paper we have implemented all discussed algorithms forbenchmarking purposes. We provide the source code of this analysis tool athttp://asa.ovito.org/ as a reference, to facilitate the use of the described techniques,and to foster their advancement by the research community.
2
2 EXISTING ANALYSIS METHODS
2. Existing analysis methods
Here, we focus on analysis techniques for simulation studies of crystalline solidsonly. A broader overview of structural characterization methods and shape matchingalgorithms for general particle systems has recently been given by Keys et al. [5].
2.1. General considerations
One can name several features that an ideal structure characterization techniqueshould provide:
• Accuracy - The method should be able to correctly distinguish several structuralenvironments solely based on the local arrangement of atoms and independent ofthe crystal orientation (rotational and translational invariance).
• Robustness - The algorithm should assign a local structure to most particles inthe system and avoid errors arising from small displacements of particles fromtheir equilibrium or symmetry positions.
• Computational efficiency - Since the local structure characterization needs to beperformed for every particle in a system, and possibly at high frequency as partof an on-the-fly analysis, the computational cost is an important factor.
• Simplicity - Because wide-spread use of a method requires an algorithm that iseasy to implement and understand.
• Universality - Ideally, the set of reference structures recognized by the method isnot hard-coded into the algorithm and can be easily extended by the user.
Note that the first two requirements are in conflict with each other: A low sensitivityto atomic displacements usually comes at the price of a reduced capability of theidentification method to distinguish similar structures. Some of the methods discussedhere allow the user to explicitly control this tradeoff between accuracy and robustness.In general one wants to avoid any wrong classifications, i.e. false positives as well asfalse negatives, in the structure recognition process.
The techniques discussed in this paper can be divided into two sets. Methods(a)-(c) quantify the similarity of a given atomic arrangement to a particular referencestructure. A positive match is detected by comparing the computed similarity measureto a threshold chosen by the user. A high threshold increases the robustness (and thechance of false positives) while a low threshold increases the sensitivity (and the chanceof false negatives). The aim of the second group of methods is to distinguish betweenseveral reference structures and to uniquely assign a type to each particle in the system(with the possibility of assigning no type at all if the local atomic arrangement deviatestoo much from all of the reference structures). These structure identification methodsare usually based on a discrete signature that is calculated from the particle positions,and which identifies the arrangement unambiguously.
2.2. Energy filtering
The potential energy of an atom can be used as a simple indicator to decide whetherit forms a perfect lattice with its neighbors. Given that atoms which are part of acrystal defect are usually higher in energy than the perfect lattice (the ground state),one can detect defective atoms by using a simple threshold criterion: Atoms having
3

2.3 Centrosymmetry parameter 2 EXISTING ANALYSIS METHODS
a potential energy above the threshold are considered defect atoms, while low-energyatoms are classified as regular crystalline atoms.
Several shortcomings of this method have contributed to the fact that it is rarelyused nowadays. The atomic energy levels of perfect lattice atoms and metastabledefects can easily overlap due to degeneracies, elastic strain energy, or thermal energy.Then the discrimination between the different structural states becomes impossible.Moreover, the potential energy of individual atoms is specific to the employedinteraction model, and, for quantum mechanical descriptions and some interatomicpotentials, is not defined at all. This is why one prefers purely structural analysismethods, which characterize the spatial arrangement of atoms without reference tothe interatomic interaction laws.
2.3. Centrosymmetry parameter
The centrosymmetry property of some lattices (e.g. fcc and bcc) can be used todistinguish them from other structures such as crystal defects where the local bondsymmetry is broken. Kelchner et al. [1] have developed a metric, the so-calledcentrosymmetry parameter (CSP), that quantifies the local loss of centrosymmetryat an atomic site, which is characteristic for most crystal defects. The CSP of anatom having N nearest neighbors is defined as
CSP =
N/2∑
i=1
∣∣ri + ri+N/2
∣∣2
(1)
where ri and ri+N/2 are vectors from the central atom to a pair of opposite neighbors.Practical ways of finding these pairs are described in [6] and in the accompanyingdocumentation of the visualization program AtomEye [7] and the molecular dynamicscode LAMMPS [8]. The latter uses the following scheme: There are N(N − 1)/2possible neighbor pairs (i, j) that can contribute to above formula. The sum of two
bond vectors, |ri + rj |2, is computed for each, and only the N/2 smallest are actuallyused to compute the CSP. For centrosymmetric lattice sites, they will be pairs ofneighbor atoms in symmetrically opposite positions with respect to the central atom;hence the i + N/2 notation in formula 1. The CSP is close to zero for regular sitesof a centrosymmetric crystal and becomes non-zero for defect atoms. The number ofnearest neighbors taken into account is N = 12 for fcc and N = 8 for bcc.
The main advantage of the CSP is that it is only marginally affected by elasticdistortions of the crystal. In particular, any affine deformation of the lattice does notchange its degree of centrosymmetry at all. The CSP is, however, sensitive to randomthermal displacements of atoms. Being only a scalar measure, the CSP’s capabilityof discriminating between different defect types is rather weak. The noise inducedby thermal displacements and inhomogeneous elastic strain may well dominate anycharacteristic differences between defect structures. Most notably, the method canonly be applied to the class of centrosymmetric lattices (which does not include hcp,for example), and it provides no means of distinguishing multiple centrosymmetriccrystal phases.
The user needs to choose a proper threshold to distinguish defect atoms fromperfect lattice atoms. At elevated temperatures the distribution of CSP values in aperfect crystal becomes broader, and may begin to overlap with the characteristicrange of crystal defects. To show this, we have measured the CSP distributions in a
4
2.4 Bond order analysis 2 EXISTING ANALYSIS METHODS
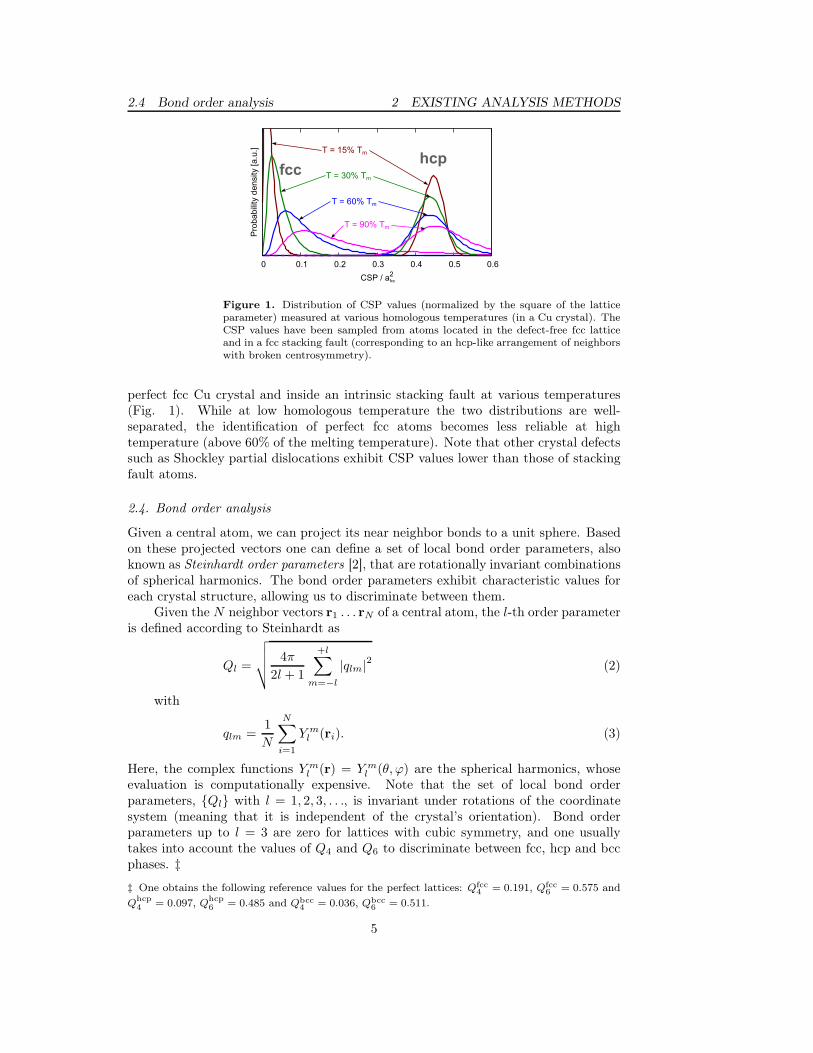
Figure 1. Distribution of CSP values (normalized by the square of the latticeparameter) measured at various homologous temperatures (in a Cu crystal). TheCSP values have been sampled from atoms located in the defect-free fcc latticeand in a fcc stacking fault (corresponding to an hcp-like arrangement of neighborswith broken centrosymmetry).
perfect fcc Cu crystal and inside an intrinsic stacking fault at various temperatures(Fig. 1). While at low homologous temperature the two distributions are well-separated, the identification of perfect fcc atoms becomes less reliable at hightemperature (above 60% of the melting temperature). Note that other crystal defectssuch as Shockley partial dislocations exhibit CSP values lower than those of stackingfault atoms.
2.4. Bond order analysis
Given a central atom, we can project its near neighbor bonds to a unit sphere. Basedon these projected vectors one can define a set of local bond order parameters, alsoknown as Steinhardt order parameters [2], that are rotationally invariant combinationsof spherical harmonics. The bond order parameters exhibit characteristic values foreach crystal structure, allowing us to discriminate between them.
Given the N neighbor vectors r1 . . . rN of a central atom, the l-th order parameteris defined according to Steinhardt as
Ql =
√√√√
4π
2l + 1
+l∑
m=−l
|qlm|2 (2)
with
qlm =1
N
N∑
i=1
Y ml (ri). (3)
Here, the complex functions Y ml (r) = Y m
l (θ, ϕ) are the spherical harmonics, whoseevaluation is computationally expensive. Note that the set of local bond orderparameters, {Ql} with l = 1, 2, 3, . . ., is invariant under rotations of the coordinatesystem (meaning that it is independent of the crystal’s orientation). Bond orderparameters up to l = 3 are zero for lattices with cubic symmetry, and one usuallytakes into account the values of Q4 and Q6 to discriminate between fcc, hcp and bccphases. ‡‡ One obtains the following reference values for the perfect lattices: Qfcc
4= 0.191, Qfcc
6= 0.575 and
Qhcp4
= 0.097, Qhcp6
= 0.485 and Qbcc4
= 0.036, Qbcc6
= 0.511.
5
2.5 Common neighbor analysis 2 EXISTING ANALYSIS METHODS
The parameter set (Q4, Q6) can be used to measure the structural order of aparticle system when averaged over all atoms. Hence, bond order parameters areoften used in computational studies of crystallization to determine the fractions ofcrystalline and liquid phases. Crystal deformation and thermal fluctuations, however,smear out the order parameter distributions [9]. Thus, to assign a particular structuretype to a particle, one needs to define non-overlapping regions in the Q4-Q6 parameterplane [10] for all crystal phases considered. The choice of these regions is arbitrary,and, to our knowledge, no generally accepted scheme for the classification of bondorder parameters exists so far.
2.5. Common neighbor analysis
Structure analysis methods that employ more complex, high-dimensional signaturesto characterize arrangements of atoms are usually better in discriminating betweenseveral structures. A popular method of this type is the common neighbor analysis(CNA) [3, 11]. Unlike the CSP and the local bond order parameters, the CNA doesnot directly take into account the spatial vectors pointing from the central atom to itsneighbor. Instead, a characteristic signature is computed from the topology of bondsthat connect the surrounding neighbor atoms.
Usually, two atoms are said to be (near-)neighbors, or bonded, if they are withina specified cutoff distance rcut of each other. For densely packed structures (fcc andhcp) the cutoff distance is set to be halfway between the first and second neighborshell, giving for fcc
rfcc
cut =1
2
(√
1/2 + 1)
afcc ≃ 0.854 afcc, (4)
where afcc is the lattice constant of the crystal structure. For the bcc lattice, twoneighbor shells need to be taken into account, and atoms are considered to be bondedwith their first- and second-nearest neighbors:
rbcc
cut =1
2
(
1 +√2)
abcc ≃ 1.207 abcc. (5)
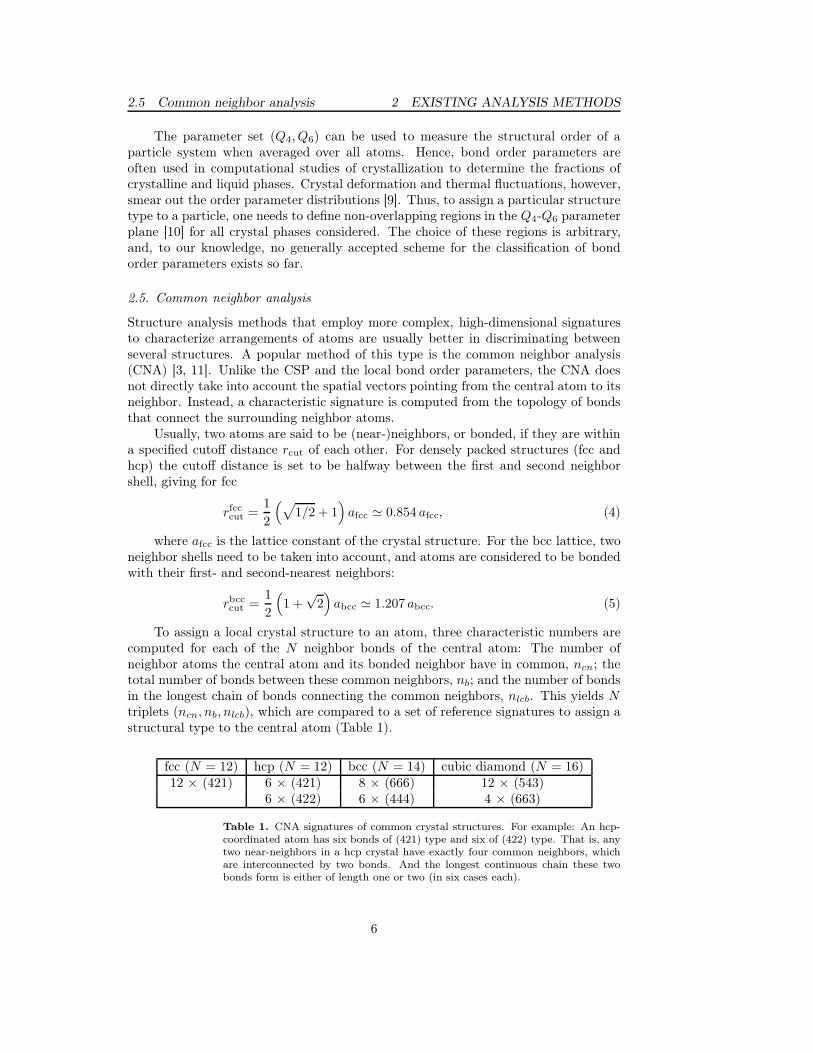
To assign a local crystal structure to an atom, three characteristic numbers arecomputed for each of the N neighbor bonds of the central atom: The number ofneighbor atoms the central atom and its bonded neighbor have in common, ncn; thetotal number of bonds between these common neighbors, nb; and the number of bondsin the longest chain of bonds connecting the common neighbors, nlcb. This yields Ntriplets (ncn, nb, nlcb), which are compared to a set of reference signatures to assign astructural type to the central atom (Table 1).
fcc (N = 12) hcp (N = 12) bcc (N = 14) cubic diamond (N = 16)12 × (421) 6 × (421) 8 × (666) 12 × (543)
6 × (422) 6 × (444) 4 × (663)
Table 1. CNA signatures of common crystal structures. For example: An hcp-coordinated atom has six bonds of (421) type and six of (422) type. That is, anytwo near-neighbors in a hcp crystal have exactly four common neighbors, whichare interconnected by two bonds. And the longest continuous chain these twobonds form is either of length one or two (in six cases each).
6
2.6 Bond angle analysis 2 EXISTING ANALYSIS METHODS
The common neighborhood parameter [12] should be mentioned as an alternativeanalysis method, which was proposed by Tsuzuki et al. to combine the strengthsof both the CNA and CSP methods. The CNA has also been extended to binaryatomic systems by taking the chemical species of common neighbors into account asan additional criterion [13]. This extension enables the identification of simple binarystructures such as L10, L12 etc.
2.6. Bond angle analysis
The bond angle analysis has been developed by Ackland and Jones [4] to distinguishfcc, hcp and bcc coordination structures. From the N bond vectors of the central atom,an eight-bin histogram of the N(N − 1)/2 bond angle cosines, cos θijk, is computedfirst. Here, θijk denotes the angle formed by the central atom i, and two of itsneighbors, j and k. The obtained histogram is then further evaluated using a setof heuristic decision rules to determine the most likely structure type. These ruleshave been optimized by the authors such that a robust discrimination of the mostimportant crystal structures is archived. The number of neighbors used to calculatethe bond angle distribution is determined adaptively by employing a cutoff radius thatis proportional to the average distance of the six nearest neighbors.
2.7. Voronoi analysis
The Voronoi decomposition [14] can serve as a geometric method to determine thenear neighbors of a particle (i.e. its coordination number) by considering the facesof the Voronoi polyhedron enclosing the particle. Furthermore, the geometric shapeof the Voronoi polyhedron reflects the characteristic arrangement of near neighbors.For this reason the Voronoi decomposition has been employed in simulation studies ofliquids and glasses to analyze various properties of their atomic structure [15, 16].
To effectively characterize the arrangement of near neighbors, the computedVoronoi polyhedron for a particle is translated into a compact signature by countingthe number of polygonal facets having three, four, five and six vertices/edges. Thisyields a vector of four integers, (n3, n4, n5, n6), that identifies the structural type. Forinstance the Voronoi polyhedron of an fcc lattice atom is equivalent to the fcc Wigner-Seitz cell and comprises 12 facets with four vertices each. Thus the correspondingsignature for fcc is (0,12,0,0). The polyhedron of a bcc atom has facets with four andsix vertices, and the corresponding signature is (0,6,0,8).
Even though the Voronoi method has been used numerous times for the analysisof particle systems without long-range order such as liquids and glasses, it has rarelybeen applied to simulations of crystalline materials. One reason is that singularVoronoi vertices, which are adjacent to more than three facets, and which occur inthe Voronoi decomposition of some highly symmetric crystalline packings such asfcc and hcp, will dissociate into multiple vertices as soon as the atomic coordinatesare only slightly perturbed. This dramatically changes the Voronoi polyhedra andthe computed signatures [17], making the identification of such crystal structuresnontrivial.
In our implementation we use the following approach to mitigate the problemof singularities in the Voronoi decomposition of fcc crystals: First, the conventionalVoronoi polyhedra are constructed (using the Voro++ code library [18]). Whencounting the number of edges of a Voronoi facet, we skip edges which are shorter than
7
3 NEW ANALYSIS METHODS
a certain threshold. Thus, a singular vertex, which may have dissociated into multiplevertices due to perturbations, will still be counted as one. Small facets with less thanthree edges above the threshold are completely ignored. The edge threshold is set to30% of the polyhedron’s maximum radius.
It should be pointed out that the described sensitivity of the Voronoi method toperturbations of the atomic coordinates, in addition to the high computational costof the Voronoi polyhedron construction, render its application to crystalline systemsrather unattractive. Remarkably, the Voronoi method, in its simplest form describedhere, is not capable of discriminating hcp-coordinated atoms from fcc atoms becausethe corresponding Voronoi polyhedra have a (0,12,0,0) signature in both cases.
3. New analysis methods
We now describe two new methods, which can provide superior analysis results forsome applications. The adaptive common neighbor analysis is a simple extension ofthe standard CNA method, which adds some convenience on the user’s side and theability to analyze multi-phase systems. The neighbor distance analysis (NDA), incontrast, is a completely new algorithm that employs a more complex signature toidentify a wider range of atomic arrangements.
3.1. Adaptive common neighbor analysis
The common neighbor analysis method described in section 2.5 is one of the mostfrequently used structure identification methods for atomistic simulation studies of fcc,hcp, and bcc crystal plasticity. It provides efficient and unambiguous classification oflocal atomic arrangements, making it possible to effectively distinguish crystal defectsfrom undisturbed lattice atoms. The only parameter required is the cutoff radius,which determines the maximum separation of near-neighbors, and which must bechosen according to the crystal phase under consideration (cf. Eqs. 4 and 5).
In the case of multi-phase systems, however, the choice of the cutoff parameter isno longer well-defined. In many cases, for instance a fcc-bcc bicrystal simulation, onecannot specify a global cutoff radius that fits all phases equally well. We thereforepropose to pick the cutoff radius individually for each atom and in dependence of thereference structure we want to compare it to. We implement this approach, which werefer to as adaptive common neighbor analysis (a-CNA), as follows.
Given a central atom to be analyzed, we first generate the list of Nmax nearest
neighbors and sort it by distance. Nmax is the maximum required number of neighborsfor all considered reference structures, e.g. Nmax = 16 for the set of structures listedin Table 1. One can generate such a nearest neighbor list either by means of a k-dtree data structure [19] and a recursive k-th nearest neighbor query algorithm [20], orby sorting a pre-existing neighbor list that has already been generated on the basis ofan excessively large cutoff radius (for instance, to compute the interatomic forces in amolecular dynamics simulation).
To test whether the local coordination structure matches an fcc crystal, we takeonly the first Nfcc = 12 entries from the sorted neighbor list. The average distanceof these 12 nearest neighbors provides a local length scale, analogous to the approachused in the bond angle analysis. That is, we can define a local cutoff radius, whichis specific to the current atom and used for matching with the fcc reference structure
8
3.1 Adaptive common neighbor analysis 3 NEW ANALYSIS METHODS
only:
rlocal
cut (fcc) =1 +
√2
2·∑12
j=1 |rj |12
. (6)
The local cutoff is subsequently used to determine the “bonding” between the 12nearest neighbors and to compute the CNA signature as usual. If the signature doesnot conform to fcc, the algorithm proceeds with testing against the next candidatestructure. For the bcc structure, for instance, the 14 nearest neighbors must be takeninto account and a local cutoff is computed as
rlocal
cut(bcc) =
1 +√2
2
[
2√3·∑8
j=1 |rj |8
+
∑14j=9 |rj |6
]
. (7)
Here, the local length scale is determined from the eight nearest neighbors in thesorted neighbor list (forming the first shell) and the successive six neighbors (formingthe second shell). Their average distances are weighted accordingly to yield the localcutoff radius that lies halfway between the second and third bcc coordination shell.
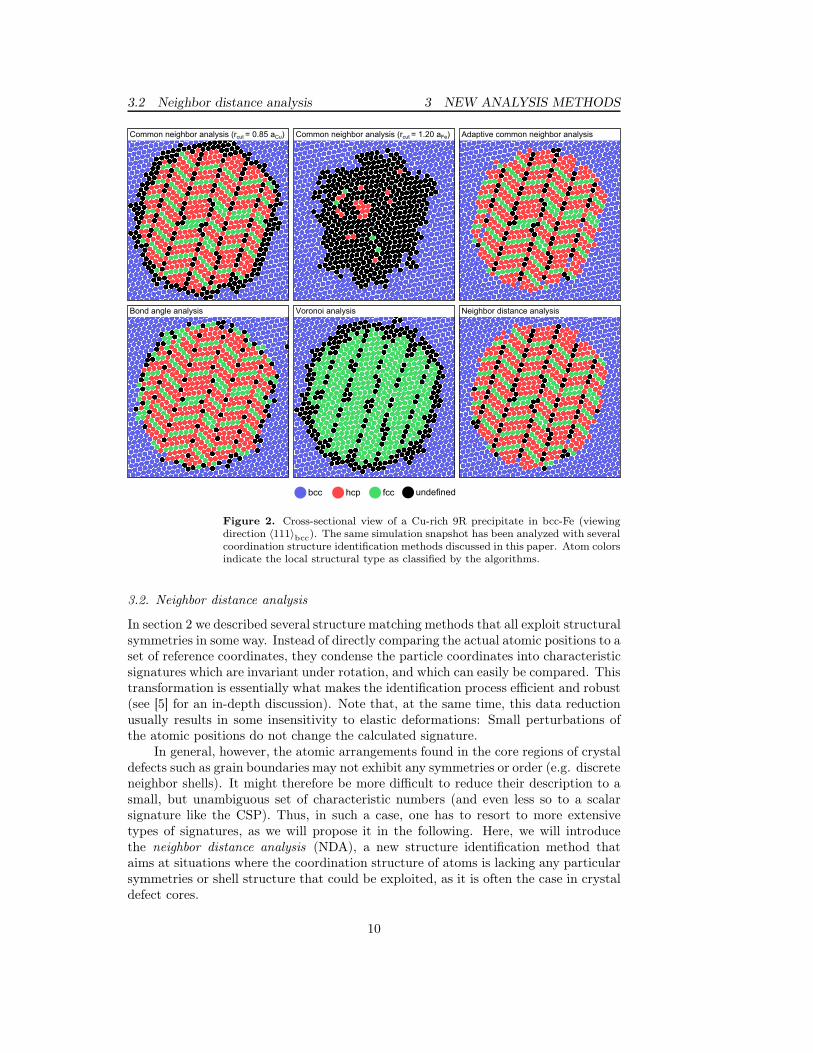
The computational cost of the adaptive CNA increases with the number ofreference structures to be tested. In practice, however, the analysis is only 25%more expensive than the standard CNA when identifying fcc, hcp, and bcc atoms.This cost is in most cases offset by the convenience of a parameterless method (nocutoff radius) and the superior analysis results provided. To demonstrate the strengthof the adaptive CNA we have applied it to a simulation of the Fe-Cu multi-phasealloy. In the simulation study, a combination of Monte Carlo sampling (variance-constrained semi-grandcanonical ensemble [21]) and conventional MD time integrationwas used to determine the equilibrium structure of Cu-rich precipitates in a Fe-richbcc matrix. The equilibrium distribution of Cu atoms at a prescribed temperatureis found via Monte Carlo transmutation steps, while alternating MD steps allow thepositional degrees of freedom to relax simultaneously. This enables structural phasetransformations to occur in the simulation. Starting off from a random distributionof Cu atoms in the bcc-Fe matrix, the Cu atoms precipitate to form a sphericalparticle. At certain conditions, the crystal structure of the cluster changes from bccto a multiply-twinned 9R structure (herringbone structure) [22] as shown in figure 2.The system has been quenched to zero temperature to remove thermal displacementsprior to the structure analysis.
The results of the conventional common neighbor analysis strongly depend on thecutoff parameter used. A cutoff that is suitable for identifying the 9R phase is givenby Eq. 4 and the lattice constant of fcc-Cu, while for the identification of the bcc-Fephase one would apply formula 5. Varying the cutoff between these limiting caseslets the observed bcc-9R interface slide and makes the precipitate appear smaller orlarger. In all cases, the CNA will be unable to assign a structural type to the atomsright at the interface since their coordination does not match to either of the referencestructures. The adaptive CNA overcomes this problem by computing a cutoff radiusfor each atom and taking into account the local dilatation. Virtually every atom inthe bcc-9R interface is identified as crystalline by the a-CNA, giving even slightlybetter analysis results than the bond angle analysis, which was specifically designedfor applications like this.
9
3.2 Neighbor distance analysis 3 NEW ANALYSIS METHODS
Figure 2. Cross-sectional view of a Cu-rich 9R precipitate in bcc-Fe (viewingdirection 〈111〉bcc). The same simulation snapshot has been analyzed with severalcoordination structure identification methods discussed in this paper. Atom colorsindicate the local structural type as classified by the algorithms.
3.2. Neighbor distance analysis
In section 2 we described several structure matching methods that all exploit structuralsymmetries in some way. Instead of directly comparing the actual atomic positions to aset of reference coordinates, they condense the particle coordinates into characteristicsignatures which are invariant under rotation, and which can easily be compared. Thistransformation is essentially what makes the identification process efficient and robust(see [5] for an in-depth discussion). Note that, at the same time, this data reductionusually results in some insensitivity to elastic deformations: Small perturbations ofthe atomic positions do not change the calculated signature.
In general, however, the atomic arrangements found in the core regions of crystaldefects such as grain boundaries may not exhibit any symmetries or order (e.g. discreteneighbor shells). It might therefore be more difficult to reduce their description to asmall, but unambiguous set of characteristic numbers (and even less so to a scalarsignature like the CSP). Thus, in such a case, one has to resort to more extensivetypes of signatures, as we will propose it in the following. Here, we will introducethe neighbor distance analysis (NDA), a new structure identification method thataims at situations where the coordination structure of atoms is lacking any particularsymmetries or shell structure that could be exploited, as it is often the case in crystaldefect cores.
10

3.2 Neighbor distance analysis 3 NEW ANALYSIS METHODS
Let us assume that a reference coordination structure (which we want tosearch for in the simulation data) is specified in terms of the list of bond vectors(R1, . . . ,RN) connecting the central atom with its N nearest neighbors (with N beinga freely selectable parameter). The coordination pattern for fcc lattice atoms, forinstance, would consist of N = 12 neighbors, with the reference vectors (R1, . . . ,RN)comprising the 1/2 〈110〉 vector family. We assume that this list of vectors is orderedaccording to their distance from the central atom such that R1 ≤ . . . ≤ RN .
Given an atom to be analyzed and to be tested against the reference patterndescribed above, we first determine its N nearest neighbor vectors, (r1, . . . , rN ), andsort them according to their magnitude (such that r1 ≤ . . . ≤ rN ). Obviously, thisis not sufficient to associate the actual neighbor bonds with their counterparts in thereference pattern: The bond lengths may be perturbed by thermal displacements, andthe ordering can be non-unique if neighbors are arranged on shells. Despite that, wemay compute a local hydrostatic scale factor, λ, from the two sorted bond lists:
λ =1
N
N∑
i=1
(Ri/ri) . (8)
This scale factor relates the lattice constant of the reference structure (which isarbitrary, and may be chosen to be unity) to that of the actual crystal, which dependson factors such hydrostatic stress, temperature, and chemical composition.
The one-to-one mapping between the reference vectors (R1, . . . ,RN ) and theactual neighbor vectors (r1, . . . , rN ), as we still need to determine it, can be expressedin terms of a permutation σ = (rσ(1), . . . , rσ(N)) of the original neighbor list. Notethat multiple equivalent permutations may exist due to symmetries of the coordinationstructure.
How is the permutation mapping σ determined? For this we define a new type ofsignature that is based on the linear distance dij = |ri − rj | between two neighbors iand j of the central atom, which is invariant under rotation. Hence, we give thisapproach the name neighbor distance analysis (NDA). We need to consider thatparticle positions may be displaced due to thermal vibrations or elastic distortionsof the crystal. Let the maximum allowed deviation of an atom from its equilibriumposition be given by a user-definable parameter δmax. Then the test structure(r1, . . . , rN ) matches the reference pattern if at least one mapping σ exists such thatthe condition
|Ri −Rj| − δmax︸ ︷︷ ︸
dmin
ij
≤ λ∣∣rσ(i) − rσ(j)
∣∣
︸ ︷︷ ︸
dij
≤ |Ri −Rj |+ δmax︸ ︷︷ ︸
dmax
ij
(9)
is fulfilled for all N(N − 1)/2 neighbor pairs. That is, all rescaled distances must liein the corresponding intervals of the reference structure. This condition is illustratedin figure 3(a).
To find a valid permutation map σ that fulfills condition 9 (or to confirm the non-existence), up to N ! possible permutations of the neighbors must tested (figure 3(b)).To avoid a fully exhaustive search, the search space can, however, be considerablyreduced by pruning the combinatorial search tree and employing a backtrackingalgorithm [23]. As an additional optimization step prior to the full combinatorialsearch we perform an early rejection test on the entire coordination structure bysorting both the list of pair-wise distances, {dij}, and the list of distance ranges,{[dminij , dmax
ij
]}, in ascending order (figure 3(c)). If any of the distances falls outside
11

3.2 Neighbor distance analysis 3 NEW ANALYSIS METHODS
(a)
(b) (c)
Figure 3. (a) Schematic picture of a low-symmetry coordination structure.Dashed circles indicate the maximum distance a neighbor may deviate fromits equilibrium position. This yields six min-max constraints on the mutualdistances between the four neighbors in the example. (b) For a positive match, apermutation of the neighbors must exist such that the actual distances fall intothe intervals of the reference pattern. (c) By sorting the neighbor distances andthe reference intervals, a quick rejection test can be performed without knowledgeof the actual neighbor-to-reference mapping.
the corresponding admissible range, no valid permutation map can exist and the teststructure does not match the reference pattern.
The user needs to specify two control parameters for each NDA reference pattern:The number of nearest neighbors to be taken into account (N) and the maximumadmissible displacement (δmax). N must be at least three, should include completeshells, and, apart from that, be as small as possible for best efficiency.
The maximum admissible displacement δmax determines the tolerance of theidentification process. In general one wants to use a large δmax to make therecognition of structures robust at high temperatures or in the presence of strongelastic distortions. On the other hand, an excessively large δmax parameter may leadto false positives when testing against multiple, only slightly different coordinationpatterns.
Note that we proposed the NDA primarily for identifying defective coordinationstructures that cannot be handled well with existing methods. In simple cases (suchas perfect fcc, hcp, or bcc lattices), the conventional techniques such as the CNAare the more economic choice. One important advantage of the NDA, however, is
12
3.2 Neighbor distance analysis 3 NEW ANALYSIS METHODS
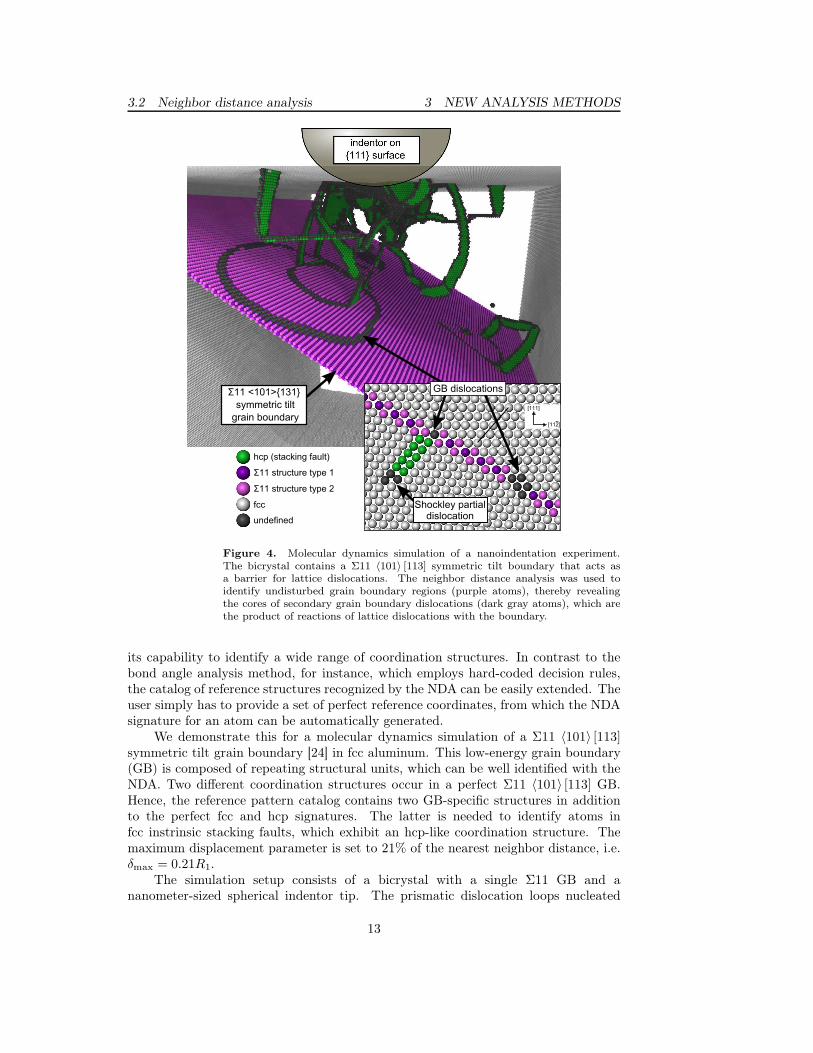
Figure 4. Molecular dynamics simulation of a nanoindentation experiment.The bicrystal contains a Σ11 〈101〉 [113] symmetric tilt boundary that acts asa barrier for lattice dislocations. The neighbor distance analysis was used toidentify undisturbed grain boundary regions (purple atoms), thereby revealingthe cores of secondary grain boundary dislocations (dark gray atoms), which arethe product of reactions of lattice dislocations with the boundary.
its capability to identify a wide range of coordination structures. In contrast to thebond angle analysis method, for instance, which employs hard-coded decision rules,the catalog of reference structures recognized by the NDA can be easily extended. Theuser simply has to provide a set of perfect reference coordinates, from which the NDAsignature for an atom can be automatically generated.
We demonstrate this for a molecular dynamics simulation of a Σ11 〈101〉 [113]symmetric tilt grain boundary [24] in fcc aluminum. This low-energy grain boundary(GB) is composed of repeating structural units, which can be well identified with theNDA. Two different coordination structures occur in a perfect Σ11 〈101〉 [113] GB.Hence, the reference pattern catalog contains two GB-specific structures in additionto the perfect fcc and hcp signatures. The latter is needed to identify atoms infcc instrinsic stacking faults, which exhibit an hcp-like coordination structure. Themaximum displacement parameter is set to 21% of the nearest neighbor distance, i.e.δmax = 0.21R1.
The simulation setup consists of a bicrystal with a single Σ11 GB and ananometer-sized spherical indentor tip. The prismatic dislocation loops nucleated
13

4 COMPARISON
Dimensionality Computationalof signature cost factor
Atomic energy 1 -Centrosymmetry parameter 1 1Common neighbor analysis 3N 3Adaptive common neighbor analysis 3N 4Bond angle analysis 8 4Bond order analysis 2 100Voronoi analysis 4 50Neighbor distance analysis N(N − 1)/2 20
Table 2. Comparison of structure identification methods discussed in this article.The signature dimensionality is the number of components of the vector thatidentifies a particular coordination structure, and which is used for matchingwithin the given analysis framework. N denotes the number of near neighbors ofa central particle. The cost factors are expressed relative to the computational costof calculating the centrosymmetry parameter and do not include time spent ongenerating neighbor lists. Note that timings are approximate, depend on the inputdataset, and are based on our own, optimized implementations of the algorithms,which we provide for reference.
beneath the indentor interact with the GB (absorption, transmission, and re-emission).Figure 4 shows the NDA analysis results visualized with OVITO [25]. In the largepicture, fcc atoms have been removed to reveal all crystal defects. One can observe GBdislocation loops gliding in the Σ11 boundary. The inset shows a cross-section of thesymmetric tilt GB with two secondary GB dislocations. Grain boundary dislocationsare clearly visible because the characteristic structure of the GB is disturbed insidetheir cores (dark gray atoms).
4. Comparison
The various structure identification methods discussed in this article employ differenttypes of descriptors or signatures to identify atomic coordination structures. Ingeneral, the classification of a structure is not based on the particle coordinatesthemselves but rather on a derived descriptor. The size of this signature differs foreach analysis method as shown in Table 2. While the centrosymmetry parameteris a scalar quantity, the neighbor distance analysis method takes into account allpair-wise distances between the N neighbor atoms. In general, the capability of acharacterization method to discriminate between a wide range of structures requiresa signature with a sufficient number of degrees of freedom.
We have implemented all analysis algorithms discussed in this article within asingle computer code framework to facilitate the comparison between them. The codeis made available for download at the website http://asa.ovito.org/. This may beuseful for researchers that wish to further explore comparisons between the methodsor for someone trying to understand the details of the implementations. To measureand compare their computational costs we applied all discussed methods to the Fe-Cudataset shown in figure 2. For those analysis algorithms that assign a structural typeto each atom, we have included fcc, hcp, and bcc as possible candidates. Calculatingthe centrosymmetry parameter is the least expensive analysis, and we have taken itas reference for our timings. Accordingly, the computation time per atom of the other
14
5 OUTLOOK
methods (Table 2) is expressed in terms of multiples of this reference time.
5. Outlook
Note that the list of methods discussed here is not exhaustive. Indeed, there existmany more methods, with new ones still appearing, such that a truly exhaustivestudy is beyond our finite capabilities. The aim of the present work was to focus onoften-cited techniques that are routinely used in current simulation studies.
Filtering methods such as the CNA or the CSP are efficient and convenienttechniques that serve well in the visualization and interpretation of datasets obtainedfrom molecular dynamics simulations of simple systems with fcc, hcp, or bcc structure.All available structure identification methods have several limitations in commonthough, which should be addressed by future work. By taking into account onlynear neighbors of a central atom, the described methods are effectively limited tosimple lattices with a monatomic basis, where the characterization of the short-rangestructure around individual atoms is sufficient. For identification of complex latticeswith multiple atoms per primitive cell (such as 9R) one needs to take into accountthe medium-range order of atoms. The same applies to the automated identificationof structured crystal defects such as coherent grain boundaries with large Σ, whosecharacteristic structural units may comprise many atoms with each having a differentlocal environment.
Furthermore, the sensitivity of structure recognition methods to perturbationsof the particle positions is a problem that hampers the analysis of systems at hightemperature or under large deformation. While the effect of thermal displacementscan, in many cases, be effectively mitigated by the use of time-averaged particlepositions or by quenching the system using a steepest-descent technique, non-uniformlattice strains can easily interfere with the identification of coordination structures.The reason is that most structure signatures used to identify atomic arrangements areinvariant only under rotation but not under arbitrary affine deformations.
So far, the structure characterization techniqes described in this article areprimarily used to filter simulation datasets to reveal crystal defects for visualizationpurposes. In addition, they are employed to estimate crystal defect densitiesin MD simulations (e.g. fcc stackings faults and twin boundaries [26], ordislocations [27]). More recently, however, they have become integral parts of severalsophisticated analysis and simulation methods. Examples for such applications arethe characterization of dislocation lines via an automated Burgers circuit analysis [28],the mapping of a crystal to a stress-free configuration to separate elastic from plasticdeformation [29], and the automated construction of a catalog of structural motivesfor the efficient discovery of transition events in self-learning kinetic Monte Carlosimulations [30]. Such applications usually require more than simple classificationof local atomic arrangements. For instance, to determine the local crystallographicdirections in a crystal [31], it is necessary to map all neighbors of the central particle tothe reference pattern in a one-to-one fashion (as it is already performed by the neighbordistance analysis described in section 3.2), and to determine the list of all equivalentneighbor permutations, which correspond to the elements of the point symmetry groupof the structure at hand.
15

REFERENCES REFERENCES
Acknowledgments
The author thanks Paul Erhart and Tomas Oppelstrup for helpful discussions. Thiswork was performed under the auspices of the U.S. Department of Energy by LawrenceLivermore National Laboratory under Contract DE-AC52-07NA27344.
References
[1] C. L. Kelchner, S. J. Plimpton, and J. C. Hamilton. Dislocationnucleation and defect structure during surface indentation. Phys.
Rev. B, 58(17):11085, 1998.
[2] P. J. Steinhardt, D. R. Nelson, and M. Ronchetti. Bond-orientationalorder in liquids and glasses. Phys. Rev. B, 28:784–805, Jul 1983.
[3] J. D. Honeycutt and H. C. Andersen. Molecular dynamics study ofmelting and freezing of small Lennard-Jones clusters. J. Phys.
Chem., 91(19):4950–4963, 1987.
[4] G. J. Ackland and A. P. Jones. Applications of local crystalstructure measures in experiment and simulation. Phys. Rev. B,73(5):054104, 2006.
[5] A. S. Keys, C. R. Iacovella, and S. C. Glotzer. Characterizingcomplex particle morphologies through shape matching: Descriptors,applications, and algorithms. J. Comp. Phys., 230(17):6438–6463,2011.
[6] V. V. Bulatov and W. Cai. Computer Simulations of Dislocations.Oxford University Press, 2006.
[7] J. Li. AtomEye: an efficient atomistic configuration viewer. Model.
Simul. Mater. Sci. Eng., 11(2):173–177, 2003.http://mt.seas.upenn.edu/Archive/Graphics/A/.
[8] S. Plimpton. Fast parallel algorithms for short-range moleculardynamics. J. Comp. Phys., 117(1):1, 1995. Software available athttp://lammps.sandia.gov/.
[9] W. Lechner and C. Dellago. Accurate determination of crystalstructures based on averaged local bond order parameters. The
Journal of Chemical Physics, 129(11):114707, 2008.
[10] C. Desgranges and J. Delhommelle. Crystallization mechanisms forsupercooled liquid Xe at high pressure and temperature: HybridMonte Carlo molecular simulations. Phys. Rev. B, 77:054201, Feb2008.
[11] D. Faken and H. Jonsson. Systematic analysis of local atomicstructure combined with 3d computer graphics. Comput. Mater.
Sci., 2(2):279–286, 1994.
[12] H. Tsuzuki, P. S. Branicio, and J. P. Rino. Structuralcharacterization of deformed crystals by analysis of common atomicneighborhood. Comput. Phys. Commun., 177(6):518–523, 2007.
16
REFERENCES REFERENCES
[13] N. Lümmen and T. Kraska. Common neighbour analysis for binaryatomic systems. Modelling Simul. Mater. Sci. Eng., 15(3):319–334,2007.
[14] G. Z. Voronoi. J. Reine Angew. Math., 134:199, 1908.
[15] J. L. Finney. Random packings and structure of simple liquids. 1.geometry of random close packing. Proceedings of the Royal Society
of London A., 319:479, 1970.
[16] A. Okabe, B. Boots, K. Sugihara, and S. N. Chiu. Spatial
Tessellations: Concepts and Applications of Voronoi Diagrams.John Wiley, Chichester, 2nd edition, 2000.
[17] C. S. Hsu and A. Rahman. Interaction potentials and their effect oncrystal nucleation and symmetry. The Journal of Chemical Physics,71(12):4974–4986, 1979.
[18] C. H. Rycroft. VORO++: A three-dimensional Voronoi cell libraryin C++. Chaos: An Interdisciplinary Journal of Nonlinear Science,19(4):041111, 2009.
[19] J. L. Bentley. Multidimensional binary search trees used forassociative searching. Commun. ACM, 18:509–517, 1975.
[20] J. H. Friedman, J. L. Bentley, and R. A. Finkel. An algorithm forfinding best matches in logarithmic expected time. ACM Trans.
Math. Softw., 3:209–226, 1977.
[21] B. Sadigh, P. Erhart, A. Stukowski, A. Caro, E. Martinez, andL. Zepeda-Ruiz. Scalable parallel Monte Carlo algorithm foratomistic simulations of precipitation in alloys. Phys. Rev. B,85:184203, 2012.
[22] F. Ernst, M. W. Finnis, D. Hofmann, T. Muschik, U. Schönberger,U. Wolf, and M. Methfessel. Theoretical prediction and directobservation of the 9R structure in Ag. Phys. Rev. Lett.,69(4):620–623, 1992.
[23] D. E. Knuth. The Art of Computer Programming, volume 4A:Combinatorial Algorithms. Upper Saddle River, Addison-WesleyProfessional, 2011.
[24] M. de Koning, R.J Kurtz, V.V. Bulatov, C.H. Henager, R.G.Hoagland, W. Cai, and M. Nomura. Modeling of dislocation–grainboundary interactions in FCC metals. Journal of Nuclear Materials,323:281–289, 2003.
[25] A. Stukowski. Visualization and analysis of atomistic simulation datawith OVITO – the Open Visualization Tool. Modelling Simul. Mater.
Sci. Eng., 18:015012, 2010. Software available at http://ovito.org/.
[26] A. Stukowski, K. Albe, and D. Farkas. Nanotwinned fcc metals:strengthening versus softening mechanisms. Phys. Rev. B,82:224103, 2010.
[27] F. Sansoz. Atomistic processes controlling flow stress scaling duringcompression of nanoscale face-centered-cubic crystals. Acta
Materialia, 59(9):3364 – 3372, 2011.
17

REFERENCES REFERENCES
[28] A. Stukowski and K. Albe. Extracting dislocations andnon-dislocation crystal defects from atomistic simulation data.Modelling Simul. Mater. Sci. Eng., 18(8):085001, 2010.
[29] A. Stukowski and A. Arsenlis. On the elastic-plastic decompositionof crystal deformation at the atomic scale. Modelling Simul. Mater.
Sci. Eng., 20:035012, 2012.
[30] F. El-Mellouhi, N. Mousseau, and L. J. Lewis. Kineticactivation-relaxation technique: An off-lattice self-learning kineticMonte Carlo algorithm. Phys. Rev. B, 78:153202, Oct 2008.
[31] C. S. Hartley and Y. Mishin. Characterization and visualization ofthe lattice misfit associated with dislocation cores. Acta Materialia,53(5):1313–1321, 2005.
18

![arXiv:1804.04369v1 [cond-mat.mtrl-sci] 12 Apr 2018 · Necking instabilities, in which tensile (extensional) deformation localizes into a small spatial re- ... crystalline, polycrystalline](https://img.pdfslide.net/doc/110x75/5b3ee53a7f8b9a91078b72b5/arxiv180404369v1-cond-matmtrl-sci-12-apr-2018-necking-instabilities-in.jpg)
![arXiv:1711.11589v3 [cond-mat.str-el] 18 Sep 2018 · Symmetry indicators and anomalous surface states of topological crystalline insulators Eslam Khalaf,1,2 Hoi Chun Po, 2Ashvin Vishwanath,](https://img.pdfslide.net/doc/110x75/5fd1a09a71ef983cb07e3b27/arxiv171111589v3-cond-matstr-el-18-sep-2018-symmetry-indicators-and-anomalous.jpg)
![arXiv:1201.1432v2 [cond-mat.dis-nn] 27 Apr 2012arXiv:1201.1432v2 [cond-mat.dis-nn] 27 Apr 2012 Phyllotaxis: a non conventional crystalline solution to packing efficiency in situations](https://img.pdfslide.net/doc/110x75/5ec63d4ba60a0e36974164da/arxiv12011432v2-cond-matdis-nn-27-apr-2012-arxiv12011432v2-cond-matdis-nn.jpg)


![arxiv.org · arXiv:cond-mat/0003128v1 [cond-mat.soft] 8 Mar 2000 StructuralPropertiesof theSliding Columnar Phase inLayered Liquid Crystalline Systems L. Golubovi´c1,∗, T. C. Lubensky2,](https://img.pdfslide.net/doc/110x75/5e4d6323498cdb416c2ab430/arxivorg-arxivcond-mat0003128v1-cond-matsoft-8-mar-2000-structuralpropertiesof.jpg)