Embed Size (px)
Citation preview
Singapore Longitudinal Ageing Studies (SLAS):
Tze Pin Ng (MD), Gerontology Research Programme, National University Health System/ Yong Loo Lin School of Medicine, National
University of Singapore
ILSI Conference on Healthy Aging in Asia, March 4-5, 2013 Singapore
Psychosocial, lifestyle, behavioral, biomedical determinants of
ageing and health outcomes

Acknowledgements
Grant funding support
A*STAR Biomedical Research Council
• 03/1/21/17/214: Gerontology Research Programme : Biological, Clinical, Psychosocial And Behavourial Predictors Of
Health Status In Prospectively Followed-Up Cohorts Of Elderly Persons
• SIgN 10-036: Immune Signatures and Biomarker Profiling of Frailty
Ministry of Health National Medical Research Council
• NMRC/0846/2004: Randomised Controlled Trial Of A Community-Based Early Psychiatric Intervention Strategy To Screen
And Manage Depression In The Elderly
• NMRC/1108/2007: Randomized Controlled Trial of Community-based Nutritional, Physical and Cognitive Training
Intervention Programmes for At Risk Frail Elderly
• NMRC/08/1/21/19/567: Gerontology Research Programme: Nutritional, cardiometabolic and vascular factors, ApoE4
gene interactions, and dementia and depression risk”
• CIRG12may033: Insulin Resistance and Mild Cognitive Impairment (MCI) in Older Adults with Pre-Diabetes and Diabetes:
Cognitive Effects of Lifestyle Intervention and Metformin Treatment in a Randomized Controlled Trial
• HSRG0016/2010 : Consultation Liaison and Integrated Care for COPD patients with Psychiatric Co-Morbidity
National University Health System, National University of Singapore,
• AIRC R-177-000-031-133: The built environment and quality of life of older persons
• NUHSRO/2011/009/STB/B2B-05: Levels and activities of sirtuins in peripheral blood cells as biomarkers for healthy
ageing and ageing disorders
Venerable Yen Pei-National Kidney Foundation Research Fund
• NKFRC/2010/07/16Mood,cognitive, physical functioning and quality of life in older adults with chronic kidney disease
Alice Lim Memorial Fund
• R-177-000-030-290: The Association between diet & health status in Asian Elderly
Anonymous Donor
R-177-000-028-720. Successful Ageing: Characterizing its Multiple Dimensions in Singaporean Seniors and the
Development and Validation of a Measurement Scale for Health Care and Promotion Programmes.
GRP-SLAS Collaborators
A/Prof Ng Tze Pin (PI)
A/Prof Yap Keng Bee
A/Prof Lee Tih Shih
A/P Lim Su Chi
A/Prof Fong Ngan Phoon
Prof Kua Ee Heok
A/Prof Tan Chay Hoon
Dr Tong Yoke Yin Terry
Dr Yap Lin Kiat Philip
Dr Tan Boon Yeow
Dr Chong Mei Siang
Dr Lim Wee Shiong
Dr Feng Lei
Dr Simon Lowes Collinson
Dr Anis Larbi
A/P Tang Bor Luen
Prof Bengt Winblad
Prof Laura Fratigliori
Research Fellows and
Graduate Students
Dr Feng Liang
Dr Shwe Zin Nyunt
Ms Hin-Hiang Susan
Ms Lim May Li
Dr Gao Qi
Dr Khin Chaw Yu Aung
Ms Gwee Xinyi
Dr Jiang Mingjun
Research Staff Ms Catherine Yeong
Ms Clare Chan
Ms Dorothy Teo
Ms Hamidah Abd Kadir
Ms Irene Neo
Ms Lim Bee Neo
Ms Low Yin Fong
Ms Rosalind Goh
Ms Teresa Kwan
Ms Wang Wah Fong
Voluntary Welfare Organizations
Support
Geylang East Home for the Aged,
Presbyterian Community Services,
Thye Hua Kwan Moral Society
(Moral Neighbourhood Links),
Yuhua Neighbourhood Link,
Henderson Senior Citizens’ Home,
NTUC Eldercare Co-op Ltd,
Thong Kheng Seniors Activity
Centre (Queenstown Centre)
Redhill Moral Seniors Activity
Centre.
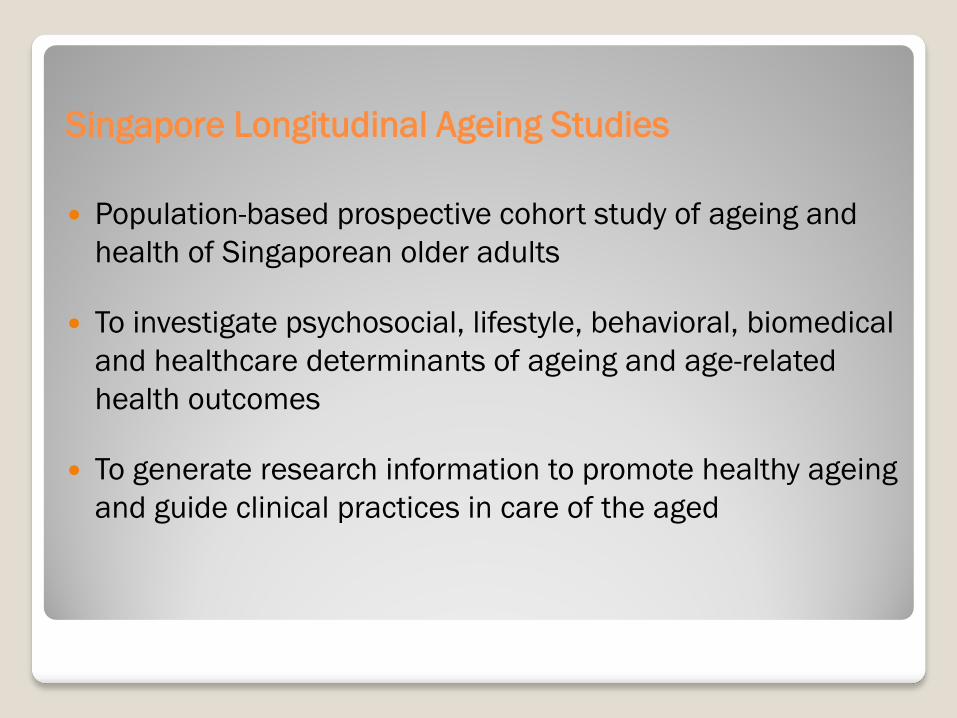
Singapore Longitudinal Ageing Studies
Population-based prospective cohort study of ageing and
health of Singaporean older adults
To investigate psychosocial, lifestyle, behavioral, biomedical
and healthcare determinants of ageing and age-related
health outcomes
To generate research information to promote healthy ageing
and guide clinical practices in care of the aged

SLAS-1: N=2808
South East Region
SLAS-2: N=3,200
South Central Region
South West Region
Community-living older adults age 55+
Singapore Longitudinal Ageing Studies (2004 – 2013)
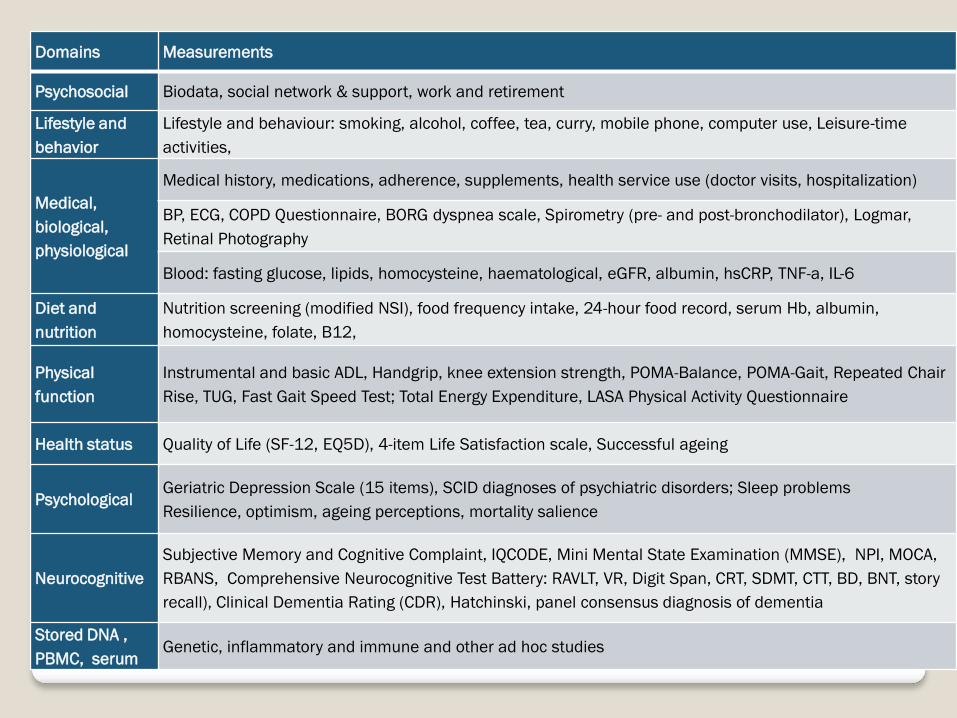
Domains Measurements
Psychosocial Biodata, social network & support, work and retirement
Lifestyle and
behavior
Lifestyle and behaviour: smoking, alcohol, coffee, tea, curry, mobile phone, computer use, Leisure-time
activities,
Medical,
biological,
physiological
Medical history, medications, adherence, supplements, health service use (doctor visits, hospitalization)
BP, ECG, COPD Questionnaire, BORG dyspnea scale, Spirometry (pre- and post-bronchodilator), Logmar,
Retinal Photography
Blood: fasting glucose, lipids, homocysteine, haematological, eGFR, albumin, hsCRP, TNF-a, IL-6
Diet and
nutrition
Nutrition screening (modified NSI), food frequency intake, 24-hour food record, serum Hb, albumin,
homocysteine, folate, B12,
Physical
function
Instrumental and basic ADL, Handgrip, knee extension strength, POMA-Balance, POMA-Gait, Repeated Chair
Rise, TUG, Fast Gait Speed Test; Total Energy Expenditure, LASA Physical Activity Questionnaire
Health status Quality of Life (SF-12, EQ5D), 4-item Life Satisfaction scale, Successful ageing
Psychological Geriatric Depression Scale (15 items), SCID diagnoses of psychiatric disorders; Sleep problems
Resilience, optimism, ageing perceptions, mortality salience
Neurocognitive
Subjective Memory and Cognitive Complaint, IQCODE, Mini Mental State Examination (MMSE), NPI, MOCA,
RBANS, Comprehensive Neurocognitive Test Battery: RAVLT, VR, Digit Span, CRT, SDMT, CTT, BD, BNT, story
recall), Clinical Dementia Rating (CDR), Hatchinski, panel consensus diagnosis of dementia
Stored DNA ,
PBMC, serum Genetic, inflammatory and immune and other ad hoc studies
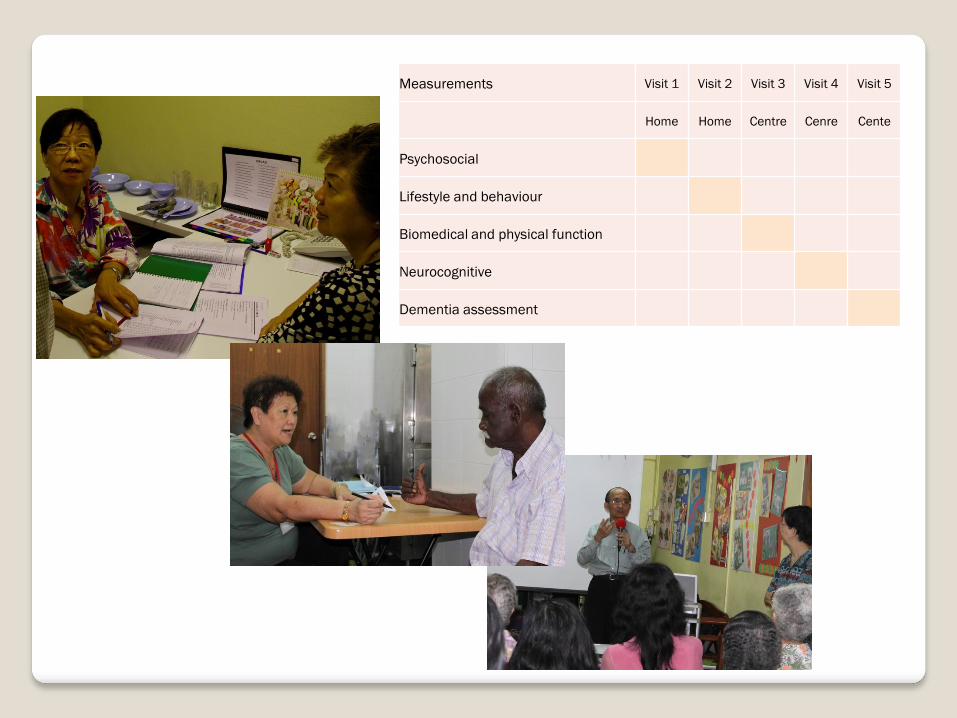
Measurements Visit 1 Visit 2 Visit 3 Visit 4 Visit 5
Home Home Centre Cenre Cente
Psychosocial
Lifestyle and behaviour
Biomedical and physical function
Neurocognitive
Dementia assessment
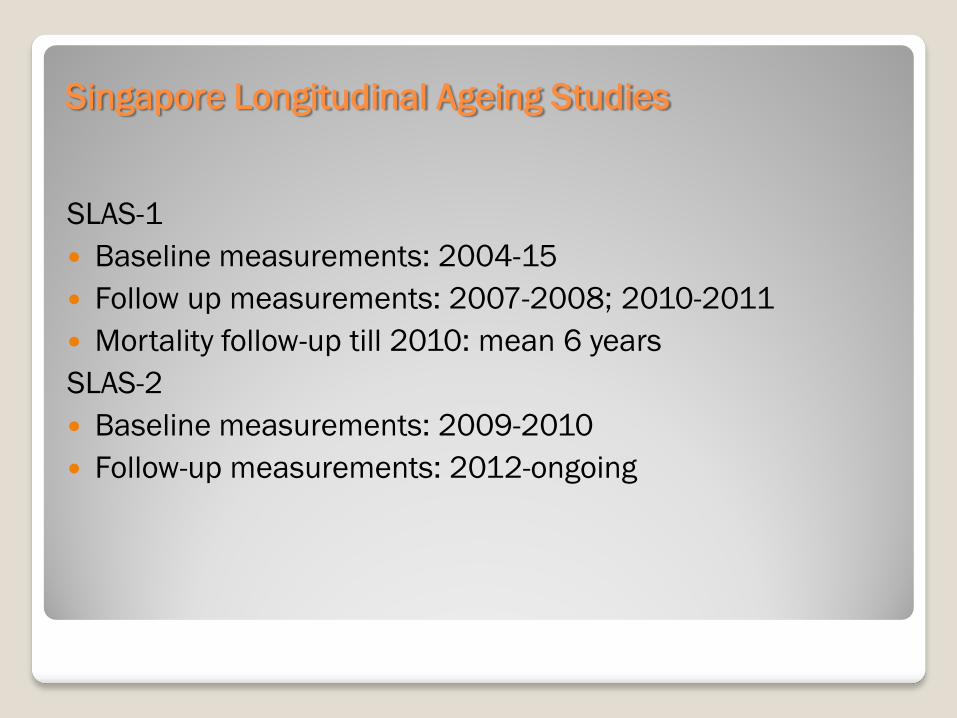
Singapore Longitudinal Ageing Studies
SLAS-1
Baseline measurements: 2004-15
Follow up measurements: 2007-2008; 2010-2011
Mortality follow-up till 2010: mean 6 years
SLAS-2
Baseline measurements: 2009-2010
Follow-up measurements: 2012-ongoing

Cognition and Dementia
– Dementia prevalence
– Risk and Protective Factors
Depression
– Relationships with chronic diseases
– Health service use
– Community Screening and Treatment
Physical function
– Population trends and attributable risks
Frailty
– Defining and characterizing frailty-prefrail states
– Immune ageing factors
– Prevention trial of nutrition, physical and cognitive training
interventions
Successful ageing and quality of life
– Models of successful ageing
– Ethnic and cultural dimensions
– Work, Retirement and Living Alone
Summary of Findings
Dementia, Cognitive Impairment and Decline Prevalence, Risk and Protective Factors
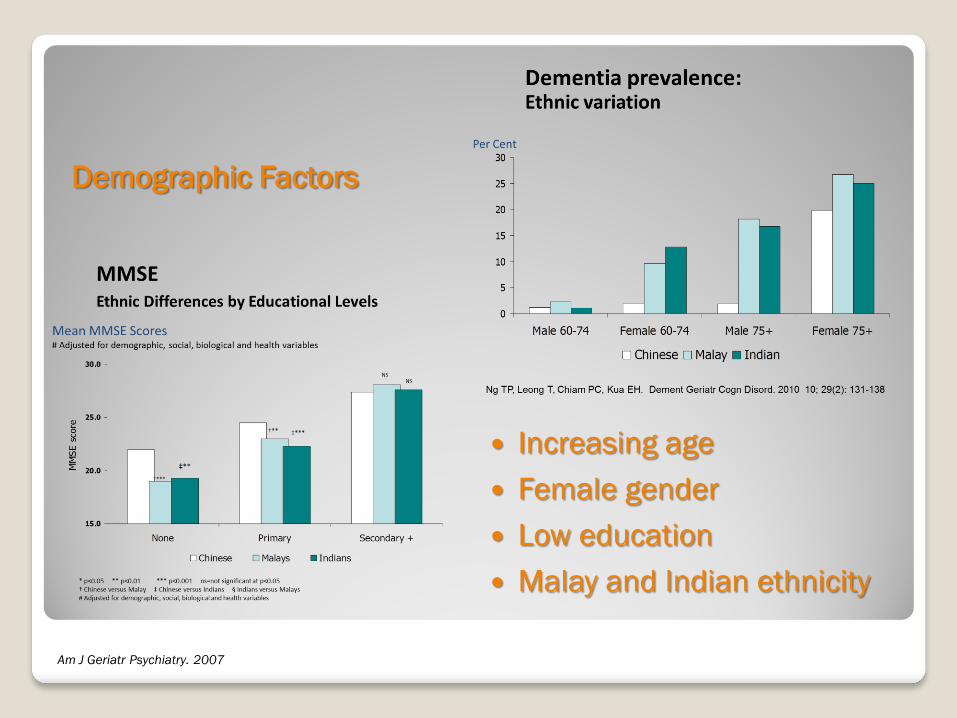
Demographic Factors
Increasing age
Female gender
Low education
Malay and Indian ethnicity
Am J Geriatr Psychiatry. 2007

0
1
2
3
4
5
6
7
8
9
10
Non-depressed
Depressed
0
10
20
30
40
50
Non-depressed
Depressed
% with cognitive decline
Non-APOE-e4
carriers
APOE-e4
carriers
% with Incident Cognitive Impairment
J Am Ger Soc 2009; 57:1058–1063. Journal of Gerontology Series A Medical Sciences 2009
Women Men
Sex * Depression APOE-e4 * Depression
Depressive symptoms
Particularly in men and APOE-e4 carriers
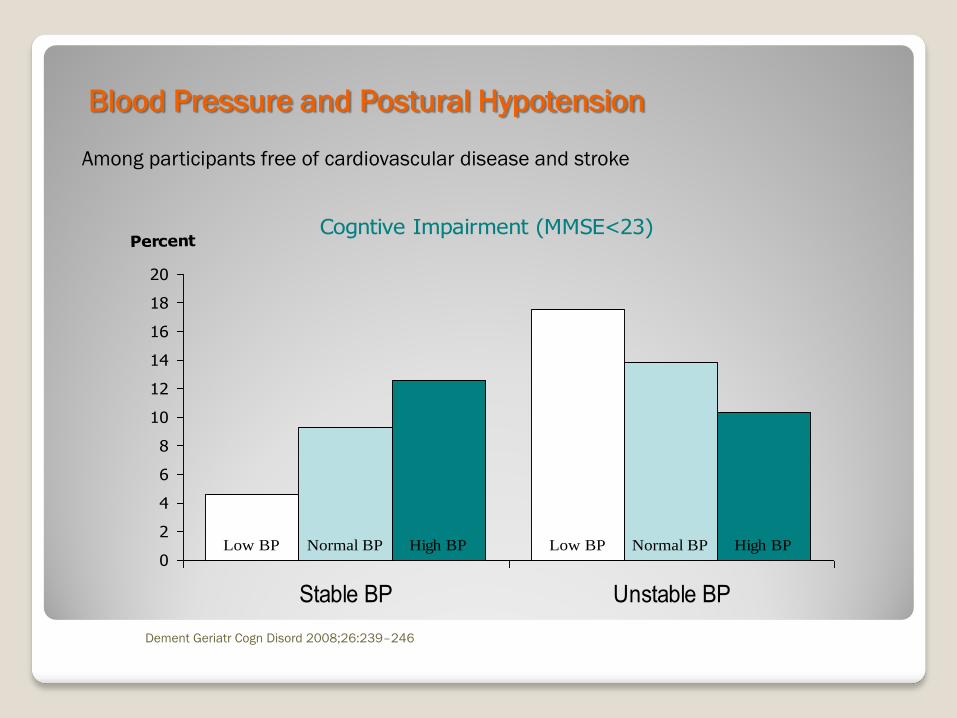
Cogntive Impairment (MMSE<23)
Low BP Low BPNormal BP Normal BPHigh BP High BP0
2
4
6
8
10
12
14
16
18
20
Stable BP Unstable BP
Percent
Blood Pressure and Postural Hypotension
Dement Geriatr Cogn Disord 2008;26:239–246
Among participants free of cardiovascular disease and stroke
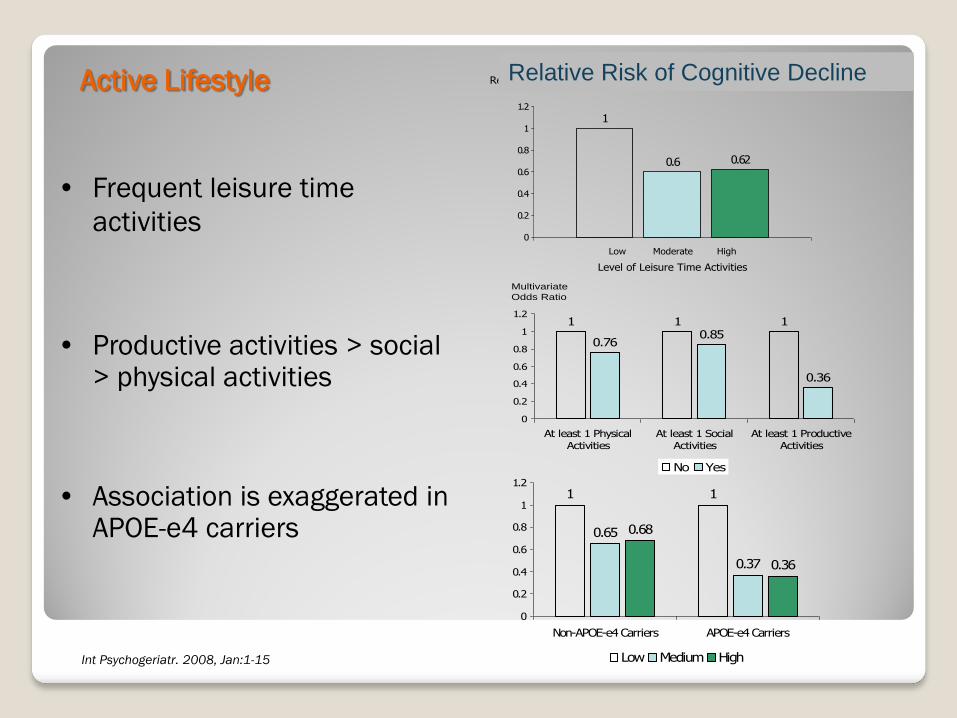
• Frequent leisure time
activities
• Productive activities > social > physical activities
• Association is exaggerated in APOE-e4 carriers
Int Psychogeriatr. 2008, Jan:1-15
0.6 0.62
1
0
0.2
0.4
0.6
0.8
1
1.2
Relative Risk of Cognitive Decline
Low Moderate High
Level of Leisure Time Activities
1 1
0.760.85
0.36
1
0
0.2
0.4
0.6
0.8
1
1.2
At least 1 Physical
Activities
At least 1 Social
Activities
At least 1 Productive
Activities
No Yes
Multivariate
Odds Ratio
1
0.65
0.37
0.68
0.36
1
0
0.2
0.4
0.6
0.8
1
1.2
Non-APOE-e4 Carriers APOE-e4 Carriers
Low Medium High
Active Lifestyle Relative Risk of Cognitive Decline

No Yes 0
0.5
1
1.5
Metabolic Syndrome
Cognitive Decline
Metabolic Syndrome
¶ Adjusted for age, gender, education, baseline
depressive symptoms (for whole sample), hypertension,
cardiovascular illness or stroke, other medical co-
morbidity, other anti-diabetic use, APOE-4 carrier status,
fasting blood glucose, BMI and duration of diabetes.
Amnestic MCI
Subgroups
Association between MetS and Amnestic MCI
OR(95%CI) P
APOE-e4 Carrier 3.35 (1.03-10.85) 0.044
Non-APOE-ε4 carrier 1.54 (0.94-2.50) 0.084
APOE-ε4 Carrier and Age≥65 2.82 (0.60-13.3) 0.19
APOE-ε4 Carrier and Age<65 6.57 (1.03-41.7) 0.046
Non-APOE-ε4 Carrier and Age≥65 1.60 (0.86-2.97) 0.14
Non-APOE-ε4 Carrier and Age<65 1.48 (0.63-3.47) 0.36
Adjusted for age, gender, education, current smoking, alcohol drink, physical activity score, heart disease or stroke, GDS score, APOE-ε4 allele carrying status
J Alz Dis (2013)
Am J Ger Psy (2008)

Metabolic Syndrome
Adjusted OR (95% C.I.) Cognitive Impairment
Cross-sectional analysis Longitudinal analysis
Metformin use: 0 year 1.00 1.00
≤6 years 0.74(0.33-1.67) P=0.47 0.66(0.38-1.16) p=0.15
>6 years 0.31(0.12-0.83) P=0.019 0.27(0.14-0.52) p=<0.001
Linear trend, p P=0.023 p=<0.001
¶ Adjusted for age, gender, education, baseline depressive symptoms (for whole sample), hypertension, cardiovascular
illness or stroke, other medical co-morbidity, other anti-diabetic use, APOE-4 carrier status, fasting blood glucose, BMI and
duration of diabetes.
Metformin use in Diabetic Individuals
Manuscript under review
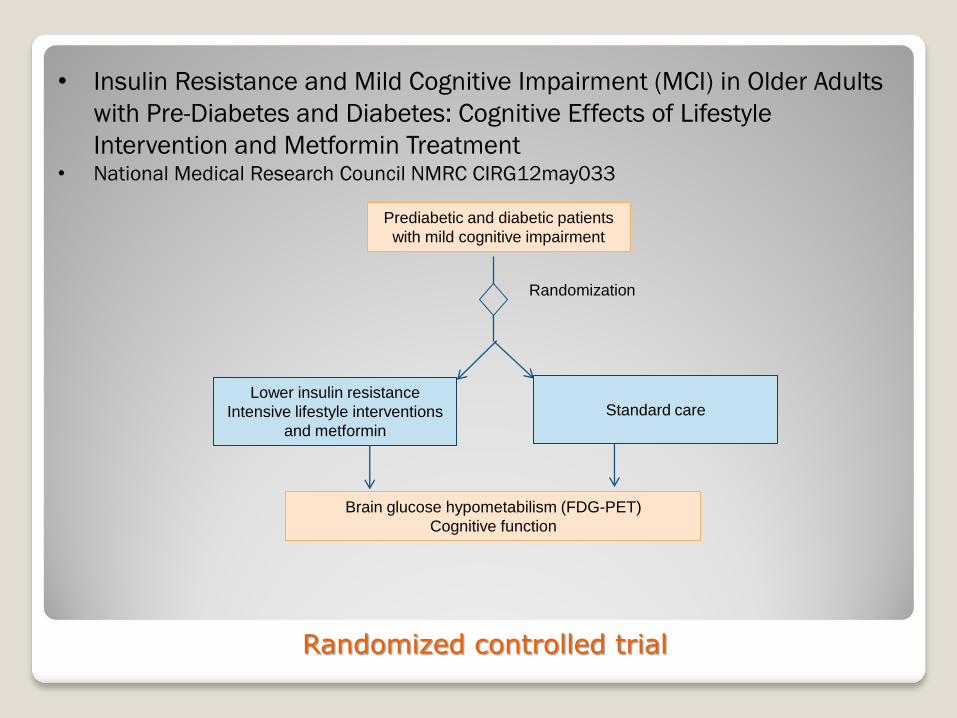
Prediabetic and diabetic patients
with mild cognitive impairment
Lower insulin resistance
Intensive lifestyle interventions
and metformin
Randomization
Brain glucose hypometabilism (FDG-PET)
Cognitive function
• Insulin Resistance and Mild Cognitive Impairment (MCI) in Older Adults
with Pre-Diabetes and Diabetes: Cognitive Effects of Lifestyle
Intervention and Metformin Treatment • National Medical Research Council NMRC CIRG12may033
Randomized controlled trial
Standard care
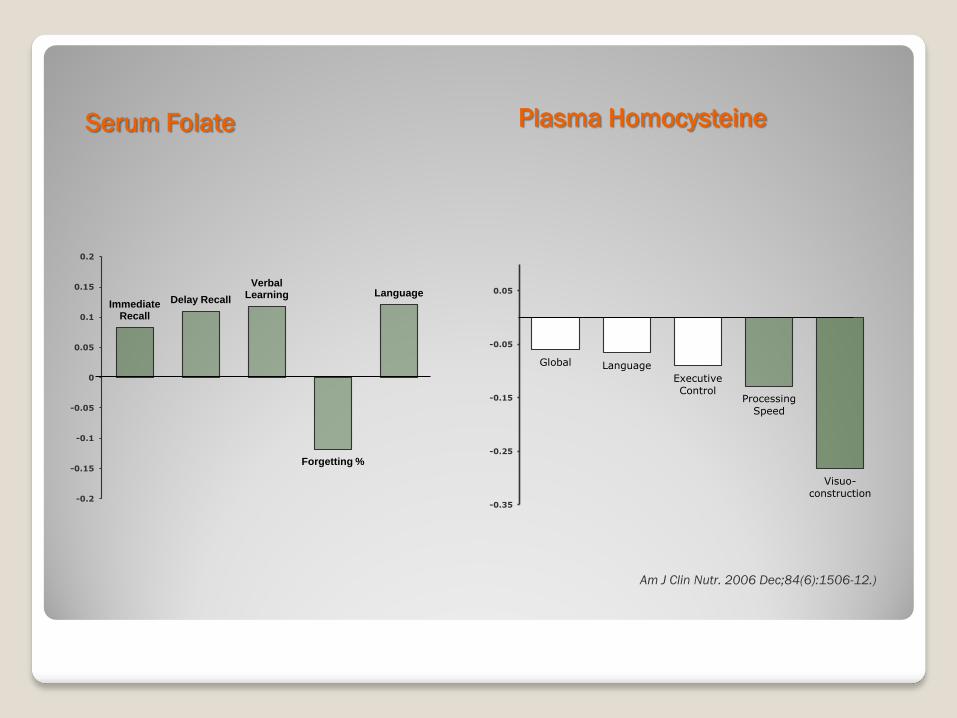
Serum Folate Plasma Homocysteine
Am J Clin Nutr. 2006 Dec;84(6):1506-12.)
Immediate Recall
Delay Recall
Verbal Learning
Forgetting %
Language
-0.2
-0.15
-0.1
-0.05
0
0.05
0.1
0.15
0.2
Global Language
Executive
Control Processing
Speed
Visuo-
construction -0.35
-0.25
-0.15
-0.05
0.05
Depression
Medical comorbidity, health service use

Depression and health service use
Depressive symptoms: 13%
1 in 3 seek treatment
Help seeking:
◦ More likely:
−Psychiatric diagnosis (OR=5.27)
−Disability from mental problem (OR=79.9)
−Poor or fair self-rated mental health (OR=2.63)
−Women (OR=2.25)
−More formal education (OR=2.40)
−Believe ‘to a great extent mental illness can be cured’ (OR=6.89)
−Less likely:
−Have financial limitations for medical care (OR=0.38)
−Higher household income (OR=0.31)
−Availability of family caregiver (OR=0.20)
(Clin Pract Epidemol Ment Health. 2009 Jan 19;5:2)

2
3
4
5
6
7
8
9
10
Baseline 3 Month 6 Month 12 Month
GD
S S
co
re
Non-Participants (N=120) Usual Care (N=112) Collaborative Care (N=102)
RCT: Community outreach
screening, psychoeducation,
primary care treatment of
depressive symptoms
Increases treatment rates
from 10.3% to 73.8% (Int J Ger
Psychr, 2009)
Significantly reduces
depressive symptoms and
improves quality of life (Manuscipt in preparation)
30
35
40
45
50
Baseline 3 Month 6 Month 12 Month
SF
-12 M
CS
Non-Participants (N=120) Usual Care (N=112) Collaborative Care (N=102)
CEPIS project
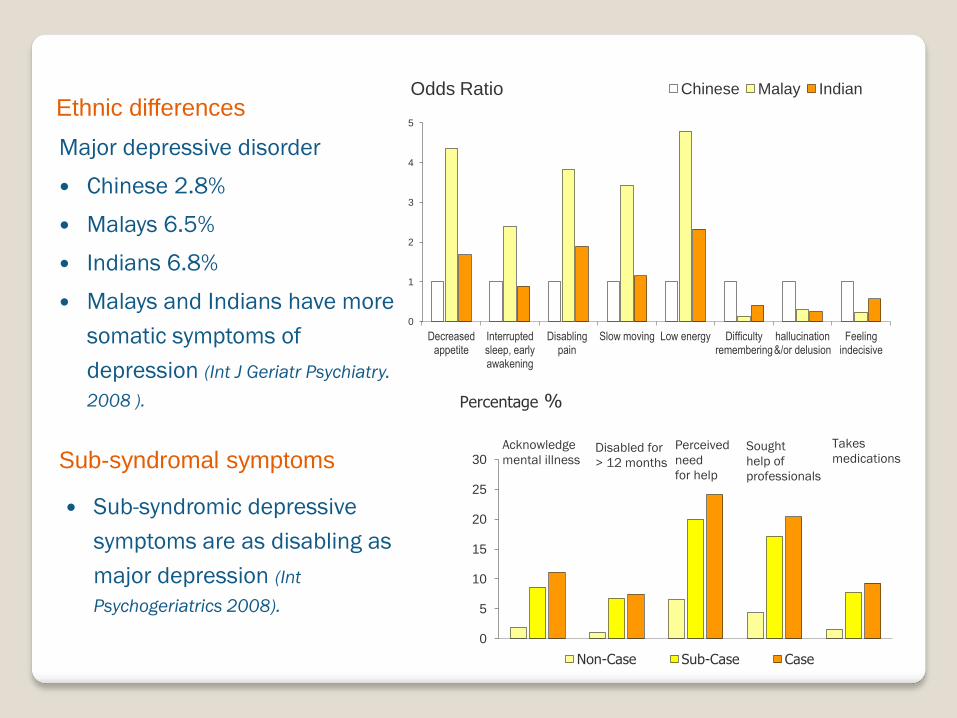
Major depressive disorder
Chinese 2.8%
Malays 6.5%
Indians 6.8%
Malays and Indians have more
somatic symptoms of
depression (Int J Geriatr Psychiatry.
2008 ).
0
1
2
3
4
5
Decreased appetite
Interrupted sleep, early awakening
Disabling pain
Slow moving Low energy Difficulty remembering
hallucination &/or delusion
Feeling indecisive
Chinese Malay Indian Odds Ratio
Acknowledge
mental illness Disabled for
> 12 months
Perceived
need
for help
Sought
help of
professionals
Takes
medications
0
5
10
15
20
25
30
Non-Case Sub-Case Case
Percentage %
Ethnic differences
Sub-syndromal symptoms
Sub-syndromic depressive
symptoms are as disabling as
major depression (Int
Psychogeriatrics 2008).

Risk Factors
Older age (75+)
Less education and lower income
Poor social network and support
Chronic medical illnesses and physical
disability (Int J Ger Psychiatry2007) Depressive symptoms %
0
5
10
15
20
25
30
No disability IADL disability Only
BADL w/wo IADL Disability
Depressive symptoms %
0
5
10
15
20
25
30
No chronic illness 1-2 chronic illnesses
≥3 chronic illnesses
Depressive symptoms %

Living alone and loneliness
Living alone is
associated with 2-3x
increased mortality risk
among men
1.33 1.16
4.17
5.13
0
1
2
3
4
5
6
Not living alone Live alone
Not lonely Lonely
Depressive symptoms
1 1 1.22
2.82
0
1
2
3
Women Men
Live with Others Live alone
Mortality Relative Risk
Loneliness worsens the
psychological effects of
living alone
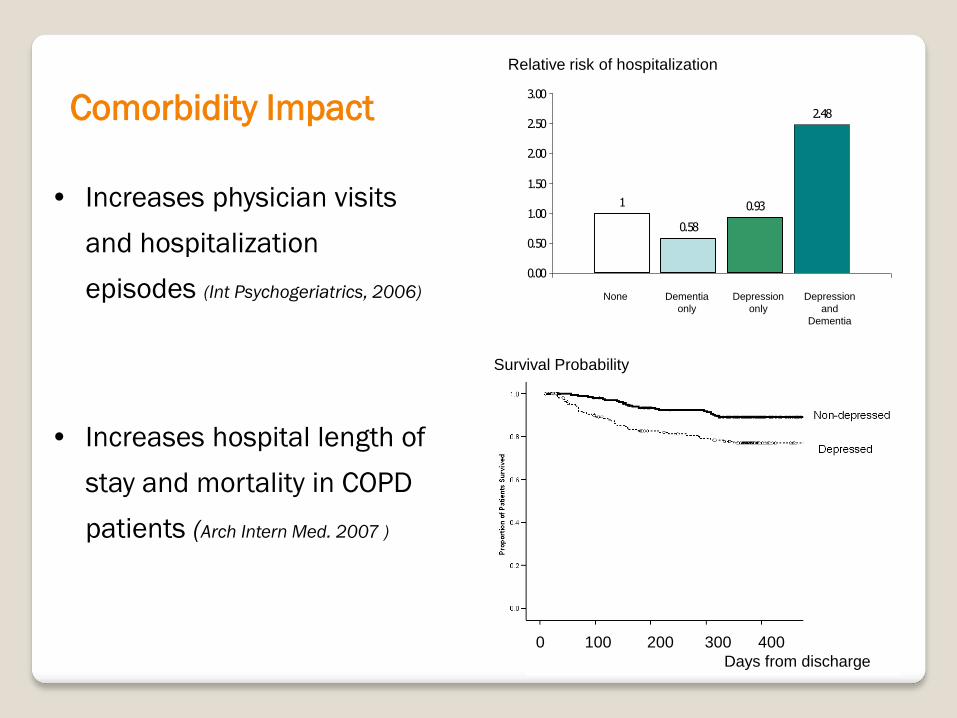
Comorbidity Impact
• Increases physician visits
and hospitalization
episodes (Int Psychogeriatrics, 2006)
• Increases hospital length of
stay and mortality in COPD
patients (Arch Intern Med. 2007 )
0.58
0.93
2.48
1
0.00
0.50
1.00
1.50
2.00
2.50
3.00
None Dementia
only
Depression
only
Depression
and
Dementia
Relative Risk of Hospitalization for chronic Illnesses
0 100 200 300 400
Days from discharge
Survival Probability
Relative risk of hospitalization

COPD Patients
Standard care
Depression screening,
psychoeducation,
psychological
interventions
Randomization
COPD Outcomes
FEV1
Exacerbations
Hospitalization rates
Mortality
• Consultation Liaison and Integrated Care for COPD patients with
Psychiatric Co-Morbidity
• MOH Health Service Research HSRG0016/2010
Randomized controlled trial
Population Trends and Attributable Risks
Physical Function
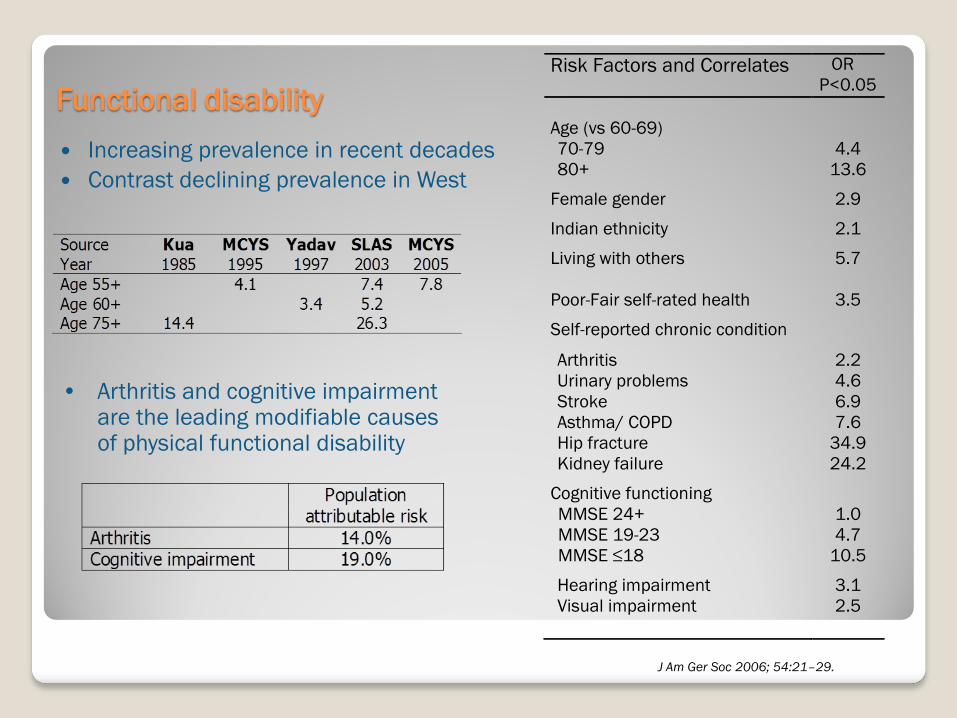
Functional disability
Increasing prevalence in recent decades
Contrast declining prevalence in West
Risk Factors and Correlates OR
P<0.05
Age (vs 60-69)
70-79 4.4
80+ 13.6
Female gender 2.9
Indian ethnicity 2.1
Living with others 5.7
Poor-Fair self-rated health 3.5
Self-reported chronic condition
Arthritis 2.2
Urinary problems 4.6
Stroke 6.9
Asthma/ COPD 7.6
Hip fracture 34.9
Kidney failure 24.2
Cognitive functioning
MMSE 24+ 1.0
MMSE 19-23 4.7
MMSE ≤18 10.5
Hearing impairment 3.1
Visual impairment 2.5
J Am Ger Soc 2006; 54:21–29.
• Arthritis and cognitive impairment are the leading modifiable causes of physical functional disability
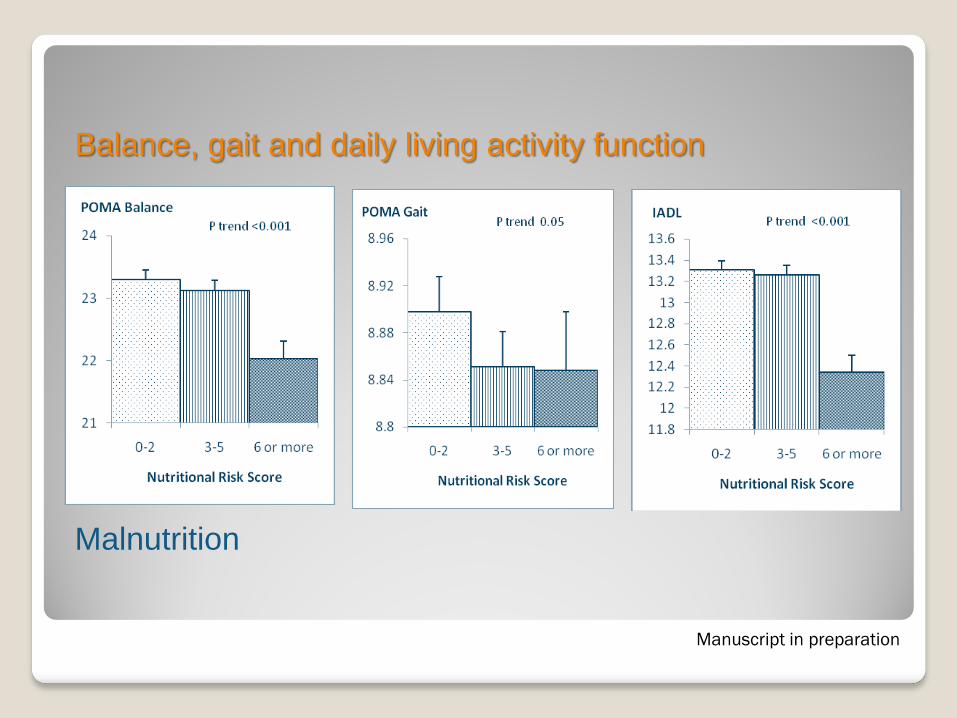
Balance, gait and daily living activity function
Malnutrition
Manuscript in preparation
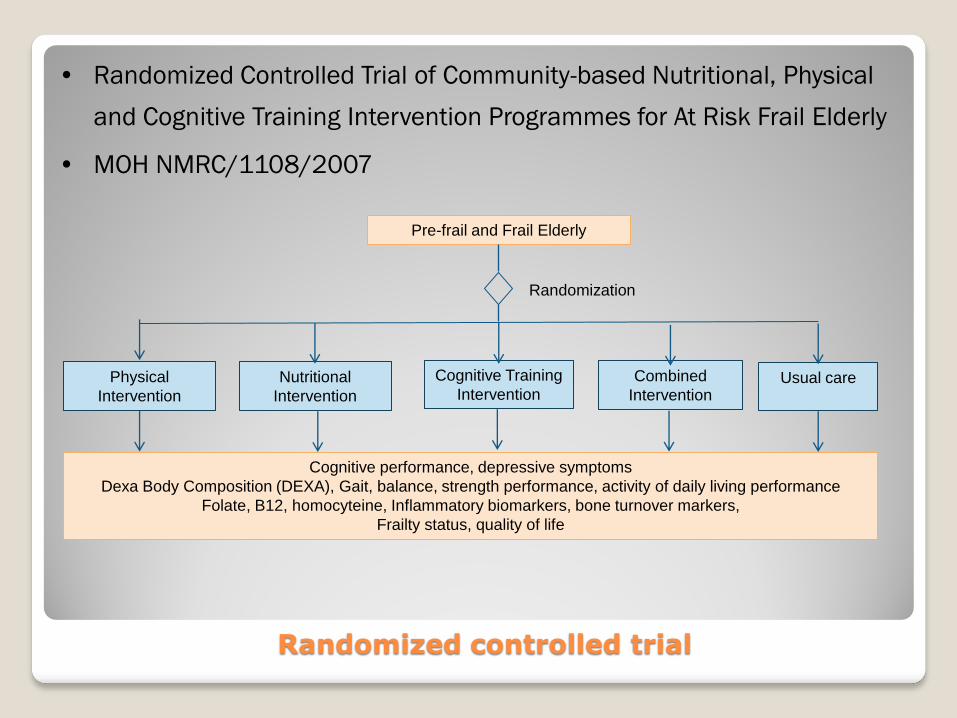
Pre-frail and Frail Elderly
Usual care
Nutritional
Intervention
Randomization
Cognitive performance, depressive symptoms
Dexa Body Composition (DEXA), Gait, balance, strength performance, activity of daily living performance
Folate, B12, homocyteine, Inflammatory biomarkers, bone turnover markers,
Frailty status, quality of life
• Randomized Controlled Trial of Community-based Nutritional, Physical
and Cognitive Training Intervention Programmes for At Risk Frail Elderly
• MOH NMRC/1108/2007
Randomized controlled trial
Physical
Intervention
Cognitive Training
Intervention Combined
Intervention

Successful Ageing
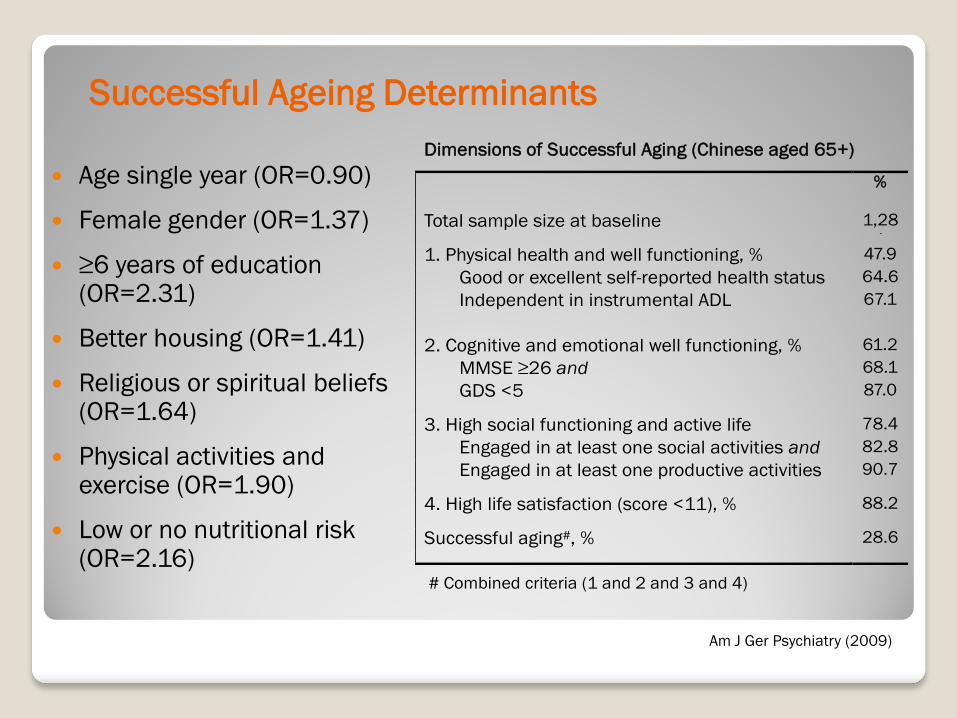
Dimensions of Successful Aging (Chinese aged 65+)
%
Total sample size at baseline 1,28
1 1. Physical health and well functioning, % 47.9
Good or excellent self-reported health status
and
64.6
Independent in instrumental ADL 67.1
2. Cognitive and emotional well functioning, % 61.2
MMSE ≥26 and 68.1
GDS <5 87.0
3. High social functioning and active life
engagement, %
78.4
Engaged in at least one social activities and 82.8
Engaged in at least one productive activities 90.7
4. High life satisfaction (score <11), % 88.2
Successful aging#, % 28.6
# Combined criteria (1 and 2 and 3 and 4)
Successful Ageing Determinants
Age single year (OR=0.90)
Female gender (OR=1.37)
≥6 years of education (OR=2.31)
Better housing (OR=1.41)
Religious or spiritual beliefs (OR=1.64)
Physical activities and exercise (OR=1.90)
Low or no nutritional risk (OR=2.16)
Am J Ger Psychiatry (2009)
0
1
2
3
4
5
No life event 1 or 2 life
events
3 or more life
events
GDS
Low resilience
Moderate to high resilience
30
40
50
60
No life event 1 or 2 life
events
3 or more life
events
SF-36 Mental Health Functioning
Low resilience
Moderate to high resilience
4
5
6
7
8
No life event 1 or 2 life
events
3 or more life
events
Self-rated Successful Ageing
Low resilience
Moderate to high resilience
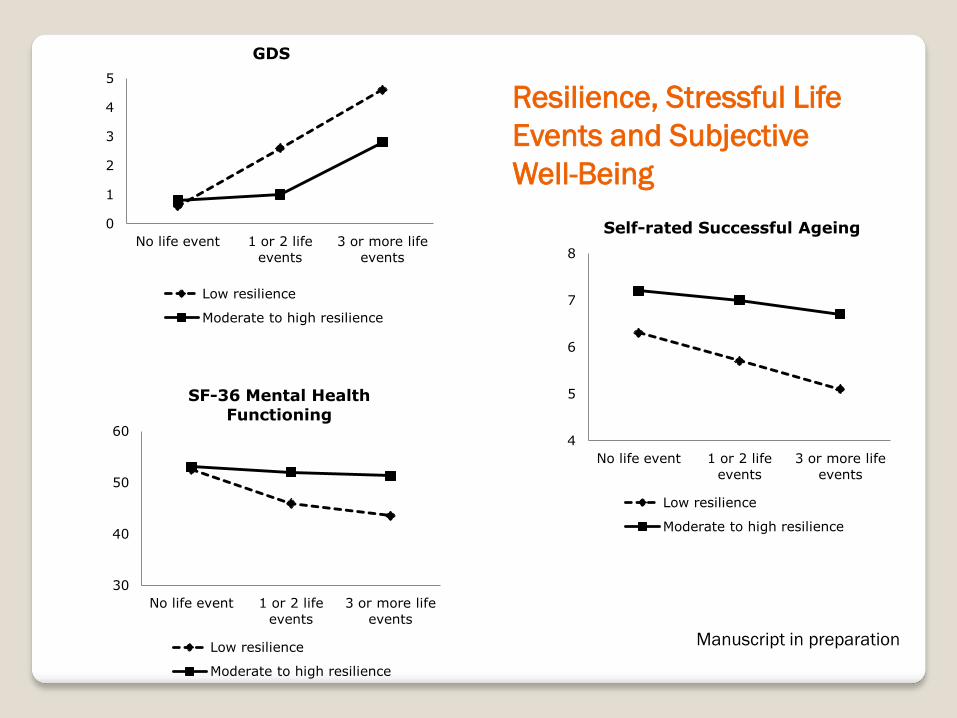
Resilience, Stressful Life
Events and Subjective
Well-Being
Manuscript in preparation
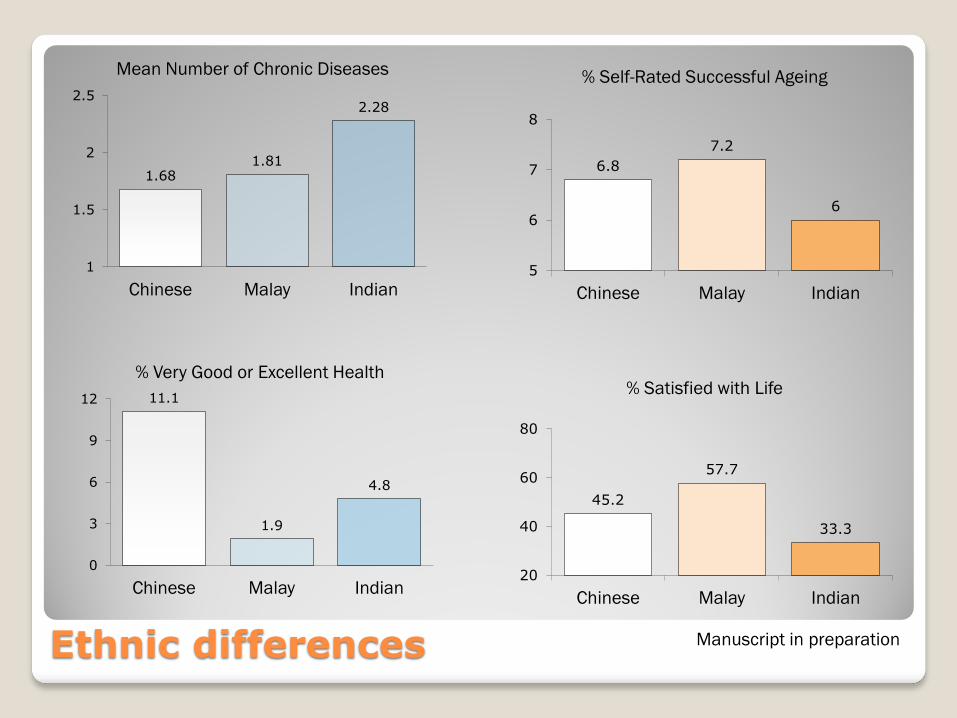
6.8
7.2
6
5
6
7
8
Chinese Malay Indian
% Self-Rated Successful Ageing
45.2
57.7
33.3
20
40
60
80
Chinese Malay Indian
% Satisfied with Life 11.1
1.9
4.8
0
3
6
9
12
Chinese Malay Indian
% Very Good or Excellent Health
1.68 1.81
2.28
1
1.5
2
2.5
Chinese Malay Indian
Mean Number of Chronic Diseases
Ethnic differences Manuscript in preparation

Thank You