Embed Size (px)
DESCRIPTION
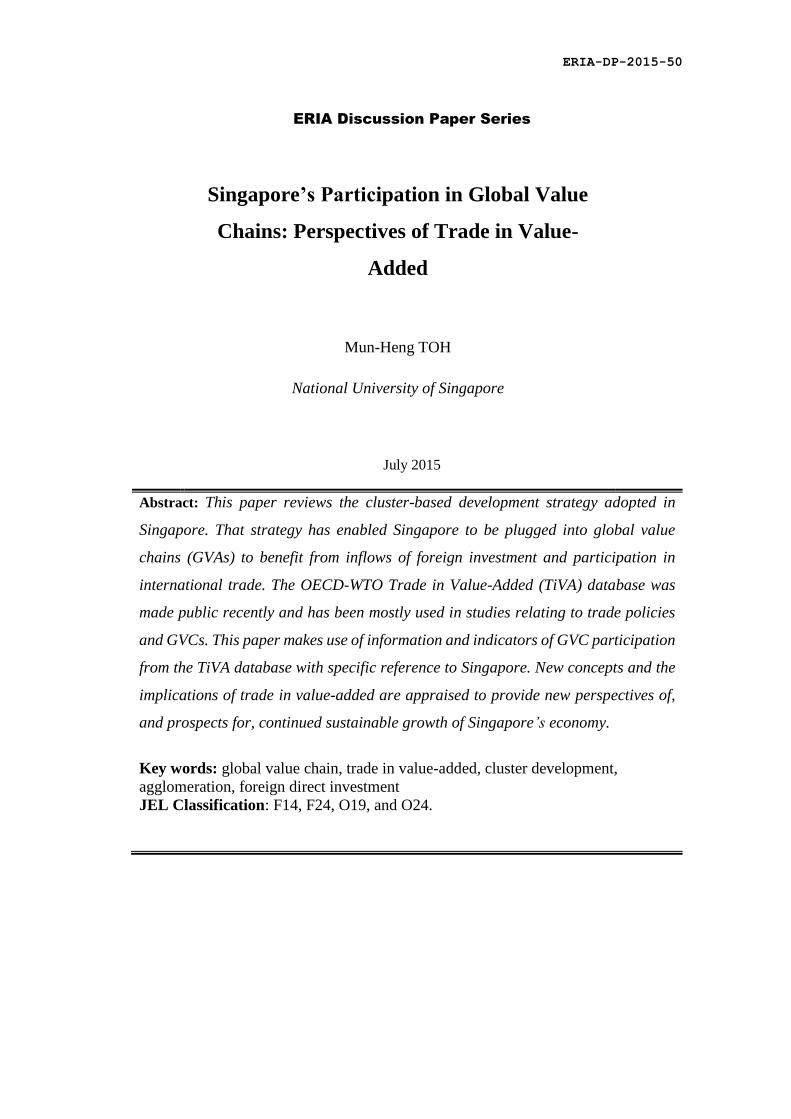
Singapore's Participation in Global Value Chains: Perspectives of Trade in Value-Added
Citation preview
ERIA-DP-2015-50
ERIA Discussion Paper Series
Singapore’s Participation in Global Value
Chains: Perspectives of Trade in Value-
Added
Mun-Heng TOH
National University of Singapore
July 2015
Abstract: This paper reviews the cluster-based development strategy adopted in
Singapore. That strategy has enabled Singapore to be plugged into global value
chains (GVAs) to benefit from inflows of foreign investment and participation in
international trade. The OECD-WTO Trade in Value-Added (TiVA) database was
made public recently and has been mostly used in studies relating to trade policies
and GVCs. This paper makes use of information and indicators of GVC participation
from the TiVA database with specific reference to Singapore. New concepts and the
implications of trade in value-added are appraised to provide new perspectives of,
and prospects for, continued sustainable growth of Singapore’s economy.
Key words: global value chain, trade in value-added, cluster development,
agglomeration, foreign direct investment
JEL Classification: F14, F24, O19, and O24.
1
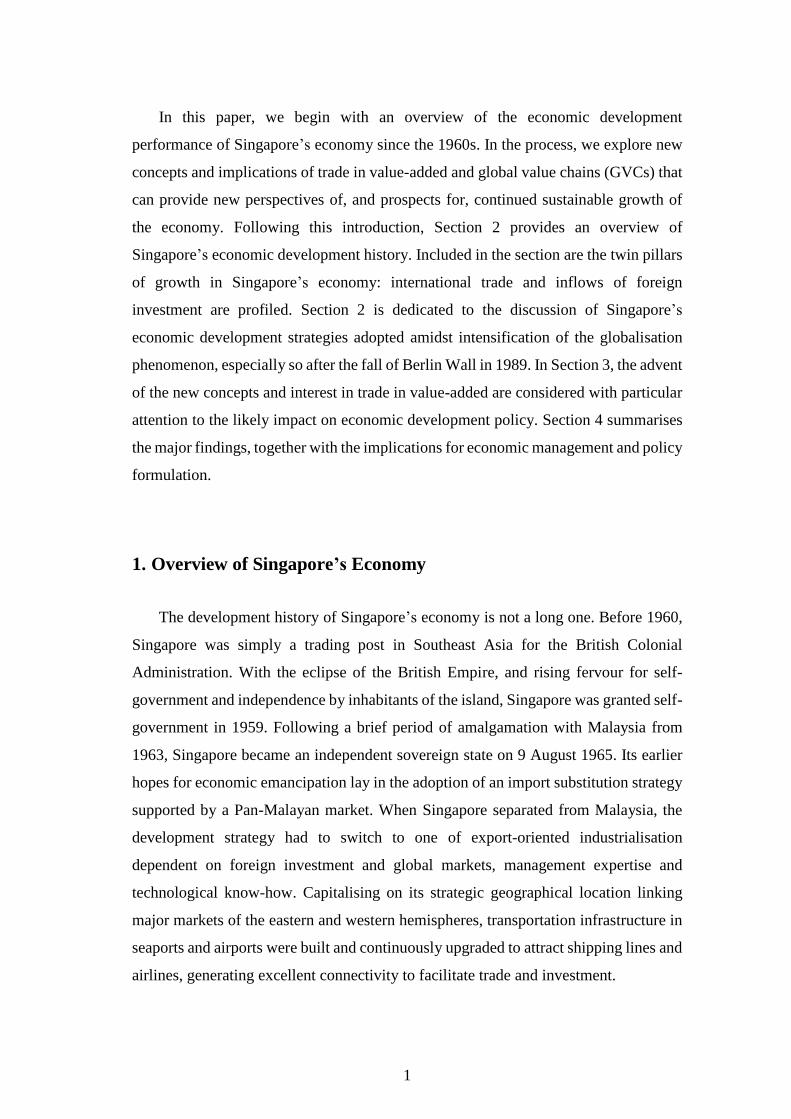
In this paper, we begin with an overview of the economic development
performance of Singapore’s economy since the 1960s. In the process, we explore new
concepts and implications of trade in value-added and global value chains (GVCs) that
can provide new perspectives of, and prospects for, continued sustainable growth of
the economy. Following this introduction, Section 2 provides an overview of
Singapore’s economic development history. Included in the section are the twin pillars
of growth in Singapore’s economy: international trade and inflows of foreign
investment are profiled. Section 2 is dedicated to the discussion of Singapore’s
economic development strategies adopted amidst intensification of the globalisation
phenomenon, especially so after the fall of Berlin Wall in 1989. In Section 3, the advent
of the new concepts and interest in trade in value-added are considered with particular
attention to the likely impact on economic development policy. Section 4 summarises
the major findings, together with the implications for economic management and policy
formulation.
1. Overview of Singapore’s Economy
The development history of Singapore’s economy is not a long one. Before 1960,
Singapore was simply a trading post in Southeast Asia for the British Colonial
Administration. With the eclipse of the British Empire, and rising fervour for self-
government and independence by inhabitants of the island, Singapore was granted self-
government in 1959. Following a brief period of amalgamation with Malaysia from
1963, Singapore became an independent sovereign state on 9 August 1965. Its earlier
hopes for economic emancipation lay in the adoption of an import substitution strategy
supported by a Pan-Malayan market. When Singapore separated from Malaysia, the
development strategy had to switch to one of export-oriented industrialisation
dependent on foreign investment and global markets, management expertise and
technological know-how. Capitalising on its strategic geographical location linking
major markets of the eastern and western hemispheres, transportation infrastructure in
seaports and airports were built and continuously upgraded to attract shipping lines and
airlines, generating excellent connectivity to facilitate trade and investment.
2
Singapore’s economy has evolved from an entrepôt economy in the early 1960s
into one that is powered by modern industries, such as electronics, chemicals and
pharmaceuticals, and sophisticated service industries in the areas of finance, business
consultancies, and medical and education services. It is now a hub for many types of
economic activities: financial services, IT services, medical services, electronics,
aviation, and education services. Over a period of five decades, from 1973 to 2013,
GDP at constant 2005 prices increased by 37 times, from S$8,745 million to S$324,592
million. The average annual growth rate during the same period was 7.2 percent.
Singapore’s GDP per capita on a PPP basis stood at $64,584 in 2013, ranking Singapore
third in the IMF’s list of countries. A summary of the economic statistics is presented
in Table A1 in the Appendix.
1.1. International Trade
The remarkable growth performance of Singapore’s economy is attributed to the
twin strategies of trade expansion and powering its industrialisation driven by foreign
capital, technology and international market access.
Following the recommendation of a United Nations study mission, import
substitution industrialisation was selected as a solution to move Singapore away from its
overdependence on entrepôt trade. Beginning in 1960, tariffs and quotas on manufactured
goods were introduced for the first time. The objective was to encourage the setting-up of
import-substituting firms. The import substitution policy was intensified when
Singapore joined Malaysia in 1963. By the end of 1965, import duties had been
imposed on 157 items including steel bars, sugar, cement, chocolates and a range of
plastic and chemical products, whilst 230 commodities were subject to import quotas.
It was believed that a Pan-Malaysia market would ensure success of the policy.
However, the policy of import substitution proved to be ineffective, because it tended
to develop inefficient domestic manufacturing industries, especially at a time when the
domestic market was limited and lacked sophistication. Inflows of foreign capital were
unimpressive despite the various fiscal incentives and concessions provided by the
Government through the investment promotion agency, the Economic Development
Board (EDB), established in 1961. The separation of Singapore from Malaysia in 1965
spelt the end of the import substitution phase.
3
The policy that gave Singapore a head start in attracting foreign capital was the
Government’s highly liberal stance on ownership, at a time when foreign investment
was viewed with suspicion by other developing countries following the experience of
the Latin American economies. Transnational corporations (TNCs) were footloose and
exploitative. After 1965, the Government consistently maintained an open policy
towards foreign ownership and operations. There were no restrictions on equity
ownership, no foreign-exchange controls and no limits on the repatriation of capital,
dividends, interest or royalties. There were no restrictions on foreign borrowings from
the domestic capital market and no regulations governing the transfer of technology.
Furthermore, the Government was willing to co-invest with foreign companies if there
was a need for risk-sharing and the nurturing of business confidence.
Nonetheless, the transition from an import substitution mindset towards an export
promotion strategy was far from easy. Several structural adjustments had to be made.
In Singapore’s case, the domestic market was small and unable to absorb the goods
manufactured by foreign enterprises. It was therefore vital to gain access to foreign
markets, which in turn required Singapore to become an open economy. Free trade
zones that were previously restricted to areas around the ports expanded their coverage
to include the whole island. Except for a few import duties on ‘sinful’ goods such as
alcohol and tobacco, tariffs were rapidly removed. New institutions and codes of
practice were put in place. In this new environment, there was no place for xenophobia,
and once the course of action had been decided, there was no turning back. The
environment had to be made conducive for investment and growth. Resources had to
be mobilised and used effectively, whilst the welfare of workers and citizens had to be
given concerted attention. Low levels of investment would have meant that fewer jobs
would be created with the risk that increasing unemployment could have led to
desperation, in turn leading to social unrest and increasing levels of crime. In such a
vicious circle, growing social unrest and crime would have also had an adverse impact
on the investment climate.
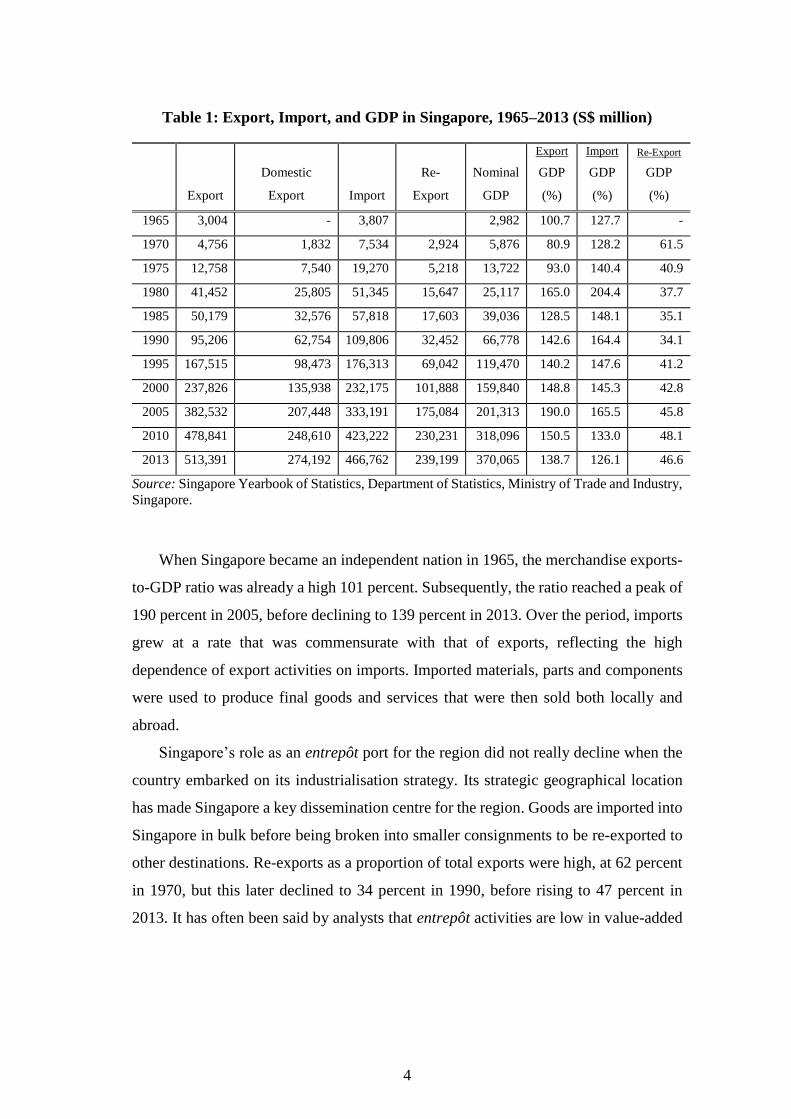
Table 1 illustrates the reliance on trade expansion to power economic growth over
the five decades from 1965.
4
Table 1: Export, Import, and GDP in Singapore, 1965–2013 (S$ million)
Export
Domestic
Export Import
Re-
Export
Nominal
GDP
Export
GDP
(%)
Import
GDP
(%)
Re-Export
GDP
(%)
1965 3,004 - 3,807 2,982 100.7 127.7 -
1970 4,756 1,832 7,534 2,924 5,876 80.9 128.2 61.5
1975 12,758 7,540 19,270 5,218 13,722 93.0 140.4 40.9
1980 41,452 25,805 51,345 15,647 25,117 165.0 204.4 37.7
1985 50,179 32,576 57,818 17,603 39,036 128.5 148.1 35.1
1990 95,206 62,754 109,806 32,452 66,778 142.6 164.4 34.1
1995 167,515 98,473 176,313 69,042 119,470 140.2 147.6 41.2
2000 237,826 135,938 232,175 101,888 159,840 148.8 145.3 42.8
2005 382,532 207,448 333,191 175,084 201,313 190.0 165.5 45.8
2010 478,841 248,610 423,222 230,231 318,096 150.5 133.0 48.1
2013 513,391 274,192 466,762 239,199 370,065 138.7 126.1 46.6
Source: Singapore Yearbook of Statistics, Department of Statistics, Ministry of Trade and Industry,
Singapore.
When Singapore became an independent nation in 1965, the merchandise exports-
to-GDP ratio was already a high 101 percent. Subsequently, the ratio reached a peak of
190 percent in 2005, before declining to 139 percent in 2013. Over the period, imports
grew at a rate that was commensurate with that of exports, reflecting the high
dependence of export activities on imports. Imported materials, parts and components
were used to produce final goods and services that were then sold both locally and
abroad.
Singapore’s role as an entrepôt port for the region did not really decline when the
country embarked on its industrialisation strategy. Its strategic geographical location
has made Singapore a key dissemination centre for the region. Goods are imported into
Singapore in bulk before being broken into smaller consignments to be re-exported to
other destinations. Re-exports as a proportion of total exports were high, at 62 percent
in 1970, but this later declined to 34 percent in 1990, before rising to 47 percent in
2013. It has often been said by analysts that entrepôt activities are low in value-added
5
and attention should be focused on domestic exports, the other component of total
exports.1
Singapore’s domestic exports are exports of Singaporean origin and comprise, (i)
primary commodities grown or produced in Singapore; and (ii) goods that have been
transformed, i.e., manufactured, assembled or processed in Singapore, including those
with imported materials or parts. In recent years, almost half of the total exports are
domestic exports, compared with about 40 percent in 1970.
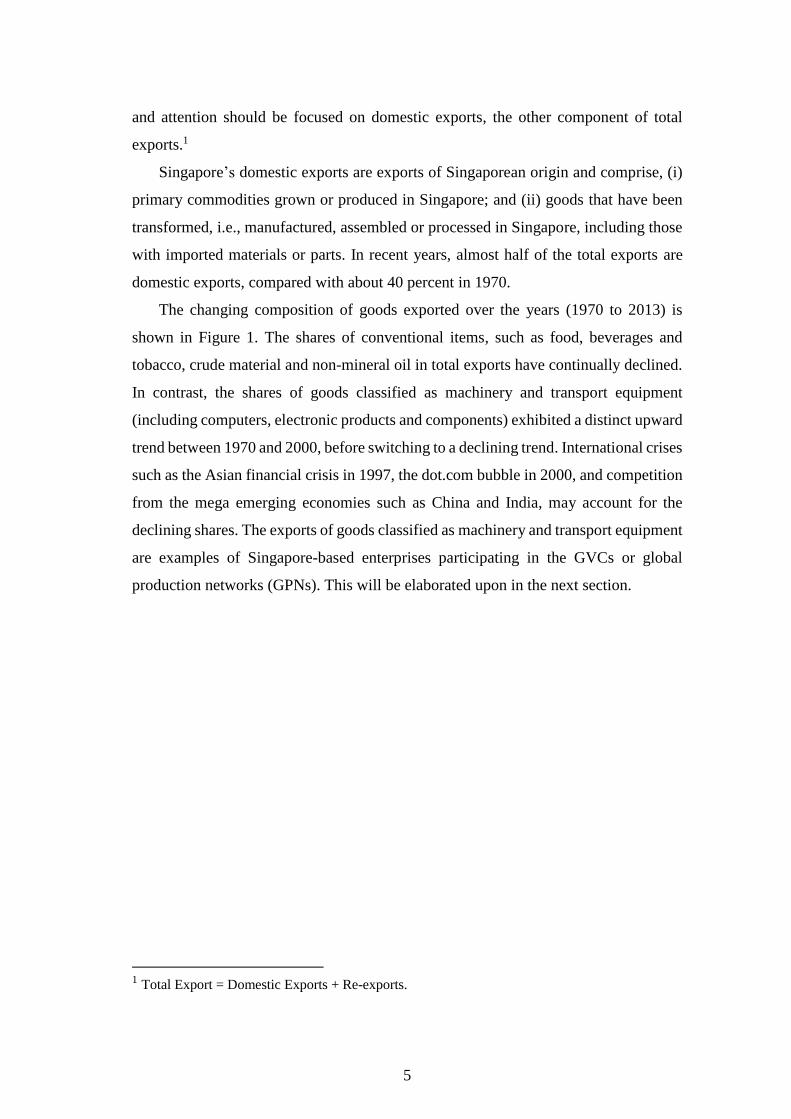
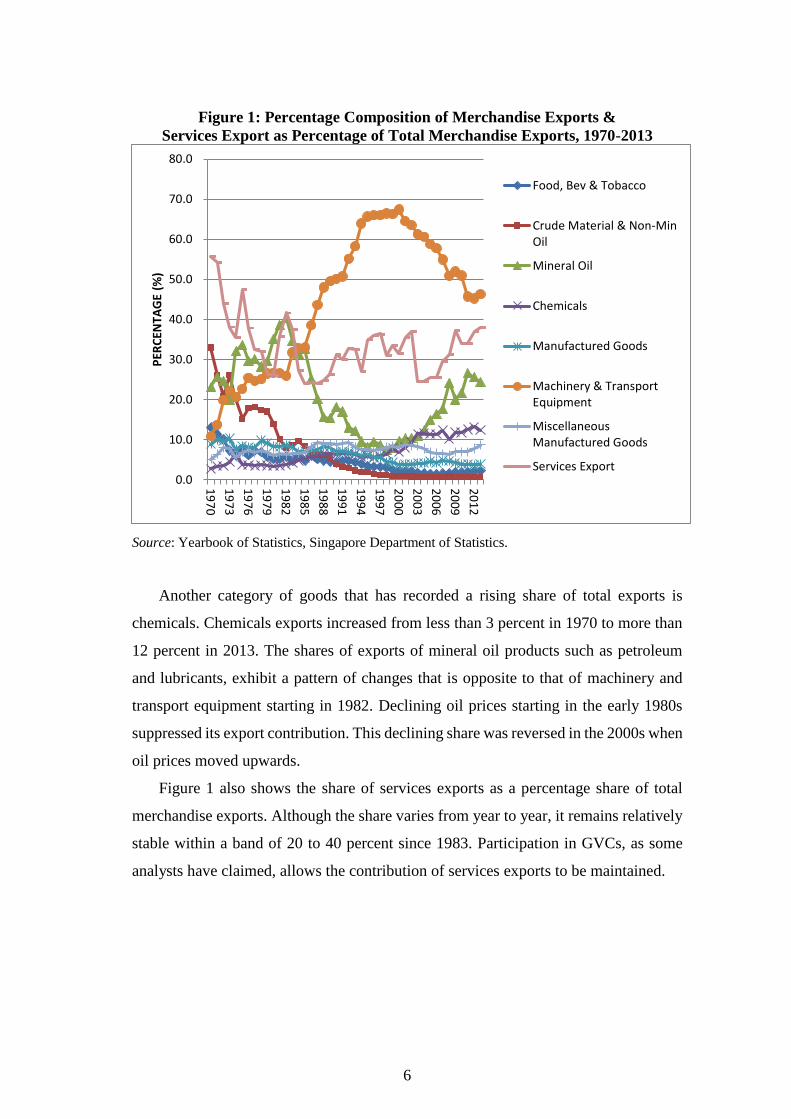
The changing composition of goods exported over the years (1970 to 2013) is
shown in Figure 1. The shares of conventional items, such as food, beverages and
tobacco, crude material and non-mineral oil in total exports have continually declined.
In contrast, the shares of goods classified as machinery and transport equipment
(including computers, electronic products and components) exhibited a distinct upward
trend between 1970 and 2000, before switching to a declining trend. International crises
such as the Asian financial crisis in 1997, the dot.com bubble in 2000, and competition
from the mega emerging economies such as China and India, may account for the
declining shares. The exports of goods classified as machinery and transport equipment
are examples of Singapore-based enterprises participating in the GVCs or global
production networks (GPNs). This will be elaborated upon in the next section.
1 Total Export = Domestic Exports + Re-exports.
6
Figure 1: Percentage Composition of Merchandise Exports &
Services Export as Percentage of Total Merchandise Exports, 1970-2013
Source: Yearbook of Statistics, Singapore Department of Statistics.
Another category of goods that has recorded a rising share of total exports is
chemicals. Chemicals exports increased from less than 3 percent in 1970 to more than
12 percent in 2013. The shares of exports of mineral oil products such as petroleum
and lubricants, exhibit a pattern of changes that is opposite to that of machinery and
transport equipment starting in 1982. Declining oil prices starting in the early 1980s
suppressed its export contribution. This declining share was reversed in the 2000s when
oil prices moved upwards.
Figure 1 also shows the share of services exports as a percentage share of total
merchandise exports. Although the share varies from year to year, it remains relatively
stable within a band of 20 to 40 percent since 1983. Participation in GVCs, as some
analysts have claimed, allows the contribution of services exports to be maintained.
0.0
10.0
20.0
30.0
40.0
50.0
60.0
70.0
80.0
19
70
19
73
19
76
19
79
19
82
19
85
19
88
19
91
19
94
19
97
20
00
20
03
20
06
20
09
20
12
PER
CEN
TAG
E (%
)
Food, Bev & Tobacco
Crude Material & Non-MinOil
Mineral Oil
Chemicals
Manufactured Goods
Machinery & TransportEquipment
MiscellaneousManufactured Goods
Services Export
7
1.2. Foreign Direct Investment
The unemployment situation in the post-independence years was serious.
According to the household survey conducted in 1966, the unemployment rate was 9.2
percent. Job creation became a priority. Local entrepreneurship and expertise essential
for kick-starting the industrialisation campaign were lacking. Many of the leaders and
owners of local enterprises had made their fortunes as shrewd traders rather than
successful industrialists. Policymakers in the Government decided to invite foreign
capital and entrepreneurs to come to Singapore to establish their production bases and
to create employment opportunities. In modern terminology, Singapore became an
outsourcing centre for the foreign multi-national companies (MNCs). A government
agency called the Economic Development Board (EDB) was tasked with providing a
one-stop service centre to facilitate and hasten the setting-up of foreign enterprises in
Singapore. Fiscal incentives such as tax holidays, and the restriction-free repatriation
of profits, as well as incentives and grants for export expansion, were put in place.
Complementing these fiscal incentives were industrial sites with pre-fabricated factory
buildings and physical infrastructure such as communications, telecommunications and
transportation, all of which contributed directly to efficiency and competitiveness. Human
resource development in both education and skills training is vital for Singapore as its
labour force is its only renewable resource. As the locational factor has been attenuated
by information technology and telecommunications, breaking the tyranny of time and
space, so the human factor as a competitive strategy has become more important.
The many efforts made to attract foreign capital to Singapore soon bore fruit. FDI
not only supplemented the limited savings and capital formation in Singapore. Foreign
enterprises also brought along their technological know-how, managerial skills, and
market accessibility in developed economies, in addition to the many jobs created to
be filled by local workers. Indeed, about seven years after independence, in 1972, the
labour market was already tight and foreign workers from neighbouring countries, as
well as from sources in South Asia, were being tapped.
The National Wages Council (NWC) was formed in 1972 to ensure orderly wage
increases in tandem with Singapore's international competitiveness. Furthermore, the
Secretary General of the National Trade Union Congress (NTUC) was also made a cabinet
minister, enabling direct feedback regarding labour concerns to the ruling echelon, a
8
reflection of the importance placed on harmonious employee-employer relationships in
fostering wealth creation. By and large, healthy industrial relations and favourable labour
market conditions formed a virtuous circle and created a conducive environment for FDI.
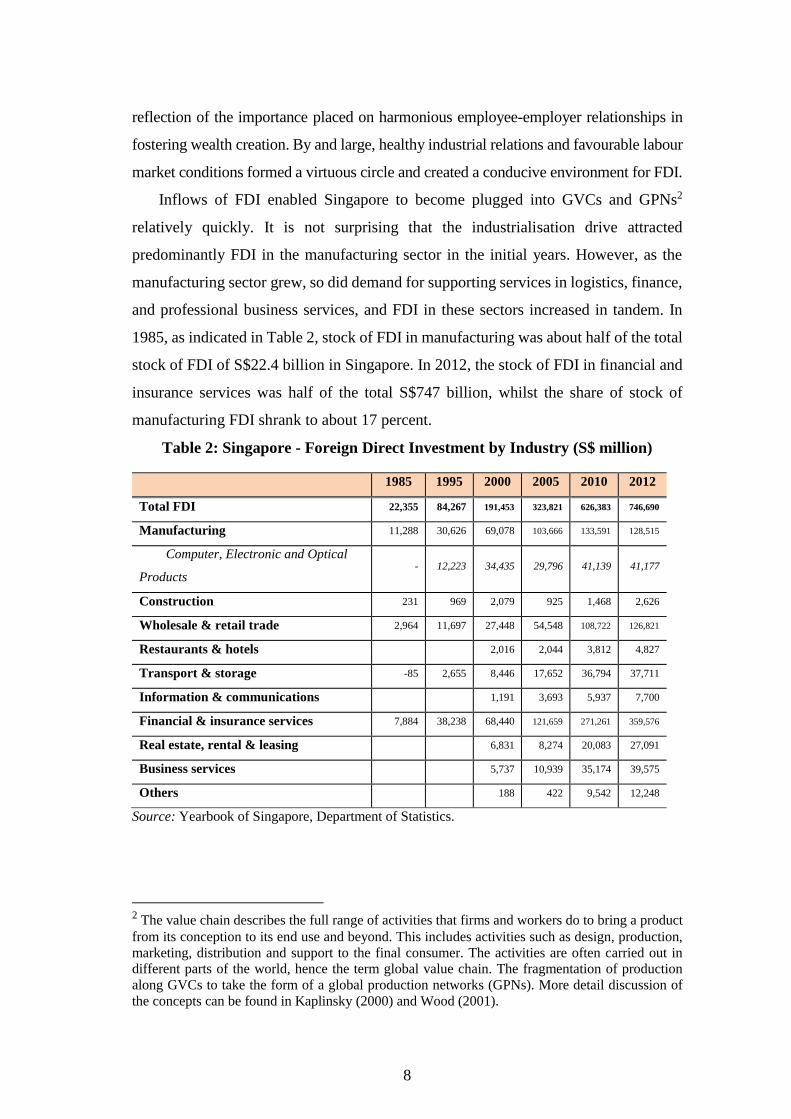
Inflows of FDI enabled Singapore to become plugged into GVCs and GPNs2
relatively quickly. It is not surprising that the industrialisation drive attracted
predominantly FDI in the manufacturing sector in the initial years. However, as the
manufacturing sector grew, so did demand for supporting services in logistics, finance,
and professional business services, and FDI in these sectors increased in tandem. In
1985, as indicated in Table 2, stock of FDI in manufacturing was about half of the total
stock of FDI of S$22.4 billion in Singapore. In 2012, the stock of FDI in financial and
insurance services was half of the total S$747 billion, whilst the share of stock of
manufacturing FDI shrank to about 17 percent.
Table 2: Singapore - Foreign Direct Investment by Industry (S$ million)
1985 1995 2000 2005 2010 2012
Total FDI 22,355 84,267 191,453 323,821 626,383 746,690
Manufacturing 11,288 30,626 69,078 103,666 133,591 128,515
Computer, Electronic and Optical
Products - 12,223 34,435 29,796 41,139 41,177
Construction 231 969 2,079 925 1,468 2,626
Wholesale & retail trade 2,964 11,697 27,448 54,548 108,722 126,821
Restaurants & hotels 2,016 2,044 3,812 4,827
Transport & storage -85 2,655 8,446 17,652 36,794 37,711
Information & communications 1,191 3,693 5,937 7,700
Financial & insurance services 7,884 38,238 68,440 121,659 271,261 359,576
Real estate, rental & leasing 6,831 8,274 20,083 27,091
Business services 5,737 10,939 35,174 39,575
Others 188 422 9,542 12,248
Source: Yearbook of Singapore, Department of Statistics.
2 The value chain describes the full range of activities that firms and workers do to bring a product
from its conception to its end use and beyond. This includes activities such as design, production,
marketing, distribution and support to the final consumer. The activities are often carried out in
different parts of the world, hence the term global value chain. The fragmentation of production
along GVCs to take the form of a global production networks (GPNs). More detail discussion of
the concepts can be found in Kaplinsky (2000) and Wood (2001).
9
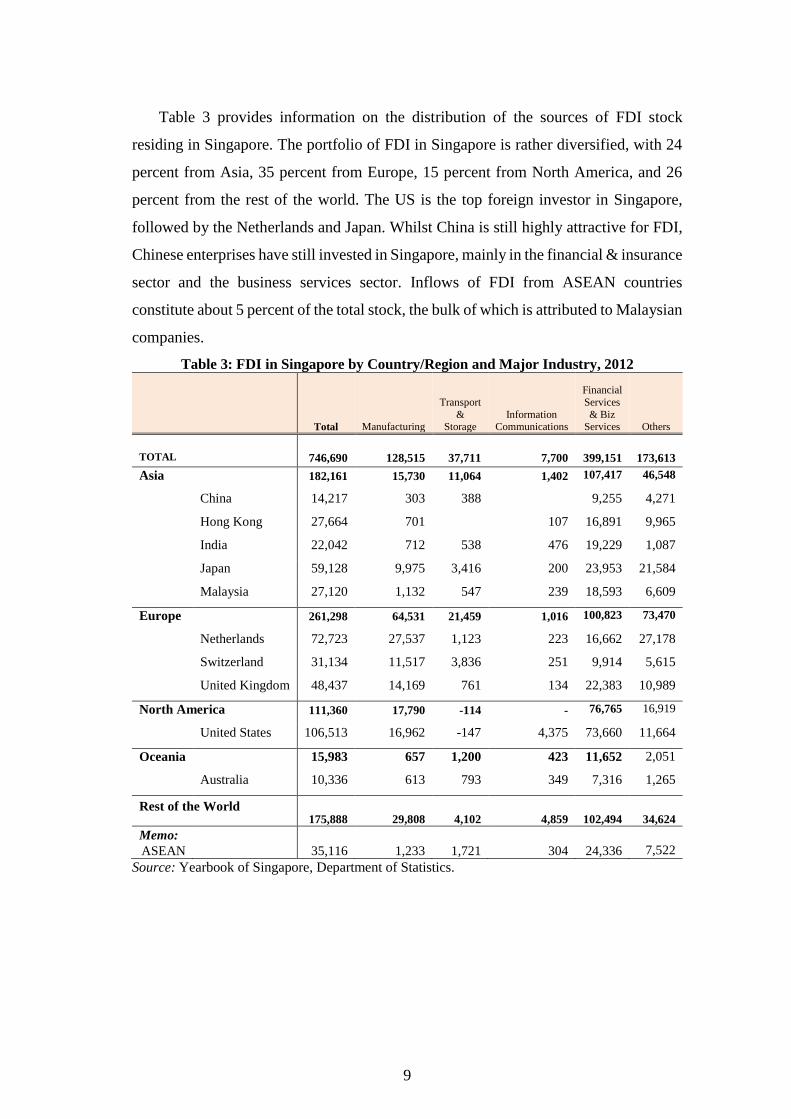
Table 3 provides information on the distribution of the sources of FDI stock
residing in Singapore. The portfolio of FDI in Singapore is rather diversified, with 24
percent from Asia, 35 percent from Europe, 15 percent from North America, and 26
percent from the rest of the world. The US is the top foreign investor in Singapore,
followed by the Netherlands and Japan. Whilst China is still highly attractive for FDI,
Chinese enterprises have still invested in Singapore, mainly in the financial & insurance
sector and the business services sector. Inflows of FDI from ASEAN countries
constitute about 5 percent of the total stock, the bulk of which is attributed to Malaysian
companies.
Table 3: FDI in Singapore by Country/Region and Major Industry, 2012
Total Manufacturing
Transport
& Storage
Information Communications
Financial
Services
& Biz Services Others
TOTAL 746,690 128,515 37,711 7,700 399,151 173,613
Asia 182,161 15,730 11,064 1,402 107,417 46,548
China 14,217 303 388 9,255 4,271
Hong Kong 27,664 701 107 16,891 9,965
India 22,042 712 538 476 19,229 1,087
Japan 59,128 9,975 3,416 200 23,953 21,584
Malaysia 27,120 1,132 547 239 18,593 6,609
Europe 261,298 64,531 21,459 1,016 100,823 73,470
Netherlands 72,723 27,537 1,123 223 16,662 27,178
Switzerland 31,134 11,517 3,836 251 9,914 5,615
United Kingdom 48,437 14,169 761 134 22,383 10,989
North America 111,360 17,790 -114 - 76,765 16,919
United States 106,513 16,962 -147 4,375 73,660 11,664
Oceania 15,983 657 1,200 423 11,652 2,051
Australia 10,336 613 793 349 7,316 1,265
Rest of the World 175,888 29,808 4,102 4,859 102,494 34,624
Memo:
ASEAN 35,116 1,233 1,721 304 24,336 7,522
Source: Yearbook of Singapore, Department of Statistics.
10
2. Economic Development Philosophy and Strategy
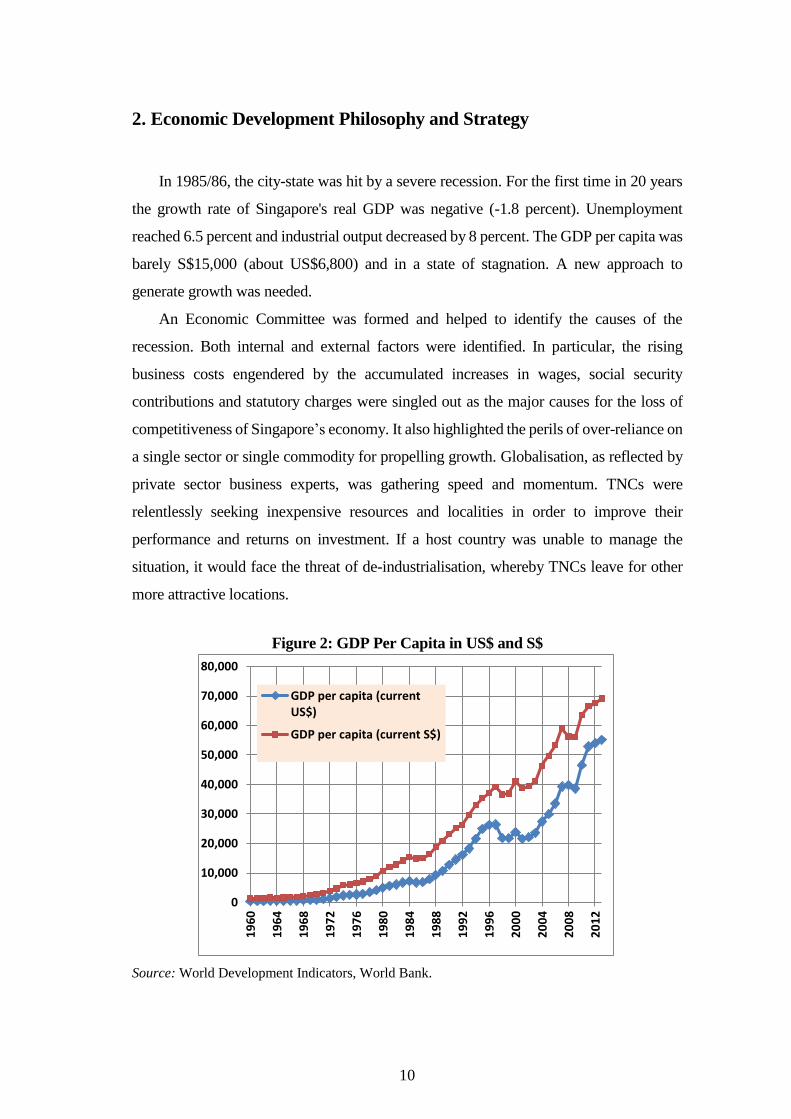
In 1985/86, the city-state was hit by a severe recession. For the first time in 20 years
the growth rate of Singapore's real GDP was negative (-1.8 percent). Unemployment
reached 6.5 percent and industrial output decreased by 8 percent. The GDP per capita was
barely S$15,000 (about US$6,800) and in a state of stagnation. A new approach to
generate growth was needed.
An Economic Committee was formed and helped to identify the causes of the
recession. Both internal and external factors were identified. In particular, the rising
business costs engendered by the accumulated increases in wages, social security
contributions and statutory charges were singled out as the major causes for the loss of
competitiveness of Singapore’s economy. It also highlighted the perils of over-reliance on
a single sector or single commodity for propelling growth. Globalisation, as reflected by
private sector business experts, was gathering speed and momentum. TNCs were
relentlessly seeking inexpensive resources and localities in order to improve their
performance and returns on investment. If a host country was unable to manage the
situation, it would face the threat of de-industrialisation, whereby TNCs leave for other
more attractive locations.
Figure 2: GDP Per Capita in US$ and S$
Source: World Development Indicators, World Bank.
0
10,000
20,000
30,000
40,000
50,000
60,000
70,000
80,000
19
60
19
64
19
68
19
72
19
76
19
80
19
84
19
88
19
92
19
96
20
00
20
04
20
08
20
12
GDP per capita (currentUS$)
GDP per capita (current S$)
11
The Economic Committee report had a profound influence on subsequent investment
policies in Singapore. The services sector was seen to be another source of growth. In
1986, the EDB set up the Services Promotion Division (SPD), which focused on the
development of financial and engineering services, telecommunications, and information
technology, as well as educational and medical services.
The Pioneer Incentives Act and the Economic Expansion Act legislated in 1968 were
extended to include promotion of investment in services. Between April 1985 and April
1986 alone, the EDB awarded pioneer status to 14 companies in the services sector. The
importance of local entrepreneurs was recognised and concerted efforts were made to
promote local small and medium enterprises (SME). An iconoclastic initiative known as
the local industry upgrading programme (LIUP) was started in 1986 by the EDB to foster
closer cooperation and partnerships between TNCs and local enterprises. TNCs provided
mentorship to local SMEs in the form of elevating managerial skills and raising technical
competence to achieve quality standards demanded in international markets. The SMEs
were helped through such programmes to be more effective in supporting industries.
Some of them have since grown to become TNCs in their own right.
To help industries regain their international competitiveness, a substantial reduction
(15 percent) in the social security contributions (CPF) by the employers was introduced.
As a longer-term solution, the workers’ remuneration structure was reformed to take into
consideration the variability in economic performance due mainly to external demand
shocks. Furthermore, rising business and production costs could only be ameliorated if
land- and labour-intensive activities could be strategically guided to relocate to
neighbouring countries that were better endowed with land and labour. This marked the
beginning of the concept of ‘growth triangle’ whereby industrial sites, with the approval
and cooperation of the private sector and governments of neighbouring countries, were
developed to enable the incumbent TNCs to expand and upgrade their production
activities in the region.3 Meanwhile, new foreign investment could also be attracted to the
region to foster greater economic growth.
The publication of the Strategic Economic Plan (SEP) by the Ministry of Trade and
Industry in 1991 marked the beginning of a new development philosophy. It incorporated
3 For more detailed discussion of the concept of growth triangles and their role in regional economic
development, see Toh and Low (1993).
12
concepts such as competitive advantage, value chains and agglomeration economies in
industrial development and strategic business management.
The Strategic Economic Plan sets the strategies and programmes for Singapore
to realize a vision - to attain the status and characteristics of a first league
developed country within the next 30 to 40 years. Key facets of the Vision are
economic dynamism, a high quality of life, a strong national identity and the
configuration of a global city.
Strategies for the long term, which will also produce some benefits for
Singapore in the short to medium term, are directed at maintaining and
extending the nation's inter-national competitiveness. Eight strategic thrusts
have been identified to help propel Singapore's economic and social progress to
that of a developed country.
They are:
Enhancing Human Resources
Promoting National Teamwork
Becoming Internationally Oriented
Creating a Conducive Climate for Innovation
Developing Manufacturing and Service Clusters
Spearheading Economic Redevelopment
Maintaining International Competitiveness
Reducing Vulnerability
- MITI (1991), Executive Summary
Strategic Economic Plan, page 1
Obviously, from the excerpt above, we can note all the sound bites and concepts
resembling those found in the modern industrial organisation and business strategic
management literature. They are arduously advocated by competitiveness gurus such as
Michael Porter, Bruce Scott, and Gary Hammel. Singapore adopted the cluster-based
approach in economic development.4 In fact, as a precursor to the Strategic Economic
Plan, the EDB in an international forum called ‘Global Strategies: The Singapore
Partnership’ declared Singapore’s development philosophy:
If it cannot be the final destination of goods, Singapore can still be a place to
send them on their way. Even if it cannot absorb much more large industry within
its borders, it can facilitate and help manage industrial operations in a nearby
location. . . .
4 For extant discussion on cluster approach to economic development can be found in Best (1999),
Cortright (2006) and Porter (1990). A related area is ‘new economic geography’ associated with the work of Fujita, et al. (1999); Krugman (1991 and 1995).
13
First, competitiveness, differentiation, as opposed to low cost, is pursued.
Singapore cannot be as cheap as other up-and-coming developing countries.
What Singapore can do is to provide superior and technical skills. Businesses
will derive maximum value by operating from Singapore.
Second, Singapore considers the nation as part of a chain of value adding
activities. It will look at the total value chain, seeking to optimize every part of
it. This means close coordination of infrastructure development, manpower
training, development of industrial estates and business parks, education
policies, and labor policies.
Third, at the corporate level the same value chain analysis will also be applied
by positioning itself to be highly competitive in certain part of the value chain.
Other part of the chain can be established in other countries. It will not only
support the establishment of such activities, either according to vertical or
horizontal division of labor, but will also actively network the Singapore
operation and related ones in other countries.
Finally, it will monitor its overall competitive position closely so that any signs
of the economy losing its competitiveness will be dealt with quickly.
- Economic Development Board
(1988),
Global Strategies: The Singapore
Partnership, pp.10–11
In the Strategic Economic Plan (SEP, Ministry of Trade and Industry, 1991), it was
recognised that an industrial policy that takes into account the relative strengths of
Singapore in specific areas and that intelligently supports those cluster enterprises with
the best chance of becoming world-class, would counter the limitations of small size.
However, the identified clusters still needed to be subject to market tests for efficiency
and competitiveness. Based on an extensive survey of industries, 14 clusters were
identified comprising of commodity trading, shipping, precision engineering, electronics,
information technology, petroleum and petrochemical, construction, heavy engineering,
finance, insurance, general supporting industries, tourism, international hub and domestic
industries. Each of these clusters included enterprises that had some common features or
core capabilities in the form of natural advantages, created competitive advantages or
industry structures or attributes. The Government gave assurances to investors in these
core capabilities or provided special incentives to accelerate their development.
14
Government agencies and statutory boards previously assigned the task of
overseeing the performance and development of specific industries had to re-orientate
and review their scope of responsibilities and coordination from the viewpoint of
cluster development. The EDB, Singapore’s premier agency in charge of attracting
foreign investment and the development of the manufacturing sector, spearheaded the
national cluster development programme. Manufacturing is a key engine of
Singapore’s economy, accounting for some 20 to 25 percent of the GDP. Since 1990,
the manufacturing sector has been re-organised into six major industrial clusters:
electronics, chemicals, precision engineering, biomedical, transport engineering, and
general manufacturing.
The EDB considered how the cluster approach could enable the electronics industry
to achieve further expansion and growth. With rising wages and rentals, Singapore risked
losing its manufacturing base and the threat of industrial hollowing out could not be
ignored. The solution came in the form of two transitions that Singapore had to navigate:
first, an internal transition for TNCs, from labour-intensive to automation; and second,
from automation to integrated manufacturing, and from vertically integrated TNCs to
dynamic clusters. Singaporean operations shed labour-intensive activities and focused
more on engineering-intensive activities, including automation, product redesign,
design for manufacture, and logistics functions associated with regional procurement
including complementary business, logistics, marketing and financial services. For
example, the division for product development projects focused on industrial design,
and engineering activities in Singapore. Assembly and other repetitive manufacturing
operations were relocated primarily in Malaysia, followed by Thailand, Indonesia and
China (Best, 1999).
The threat of de-industrialisation was addressed by relocation and re-organising value
chains. TNCs were enlightened enough to take a cluster and value-chain view of their
production decisions. TNCs did not relocate their entire operations to lower-wage, labour-
surplus destinations. Instead, they maintained non-labour-intensive manufacturing and
higher value-added services related activities in Singapore, and relocated only the
labour-intensive activities off-shore. From the perspective of the focal industry, namely
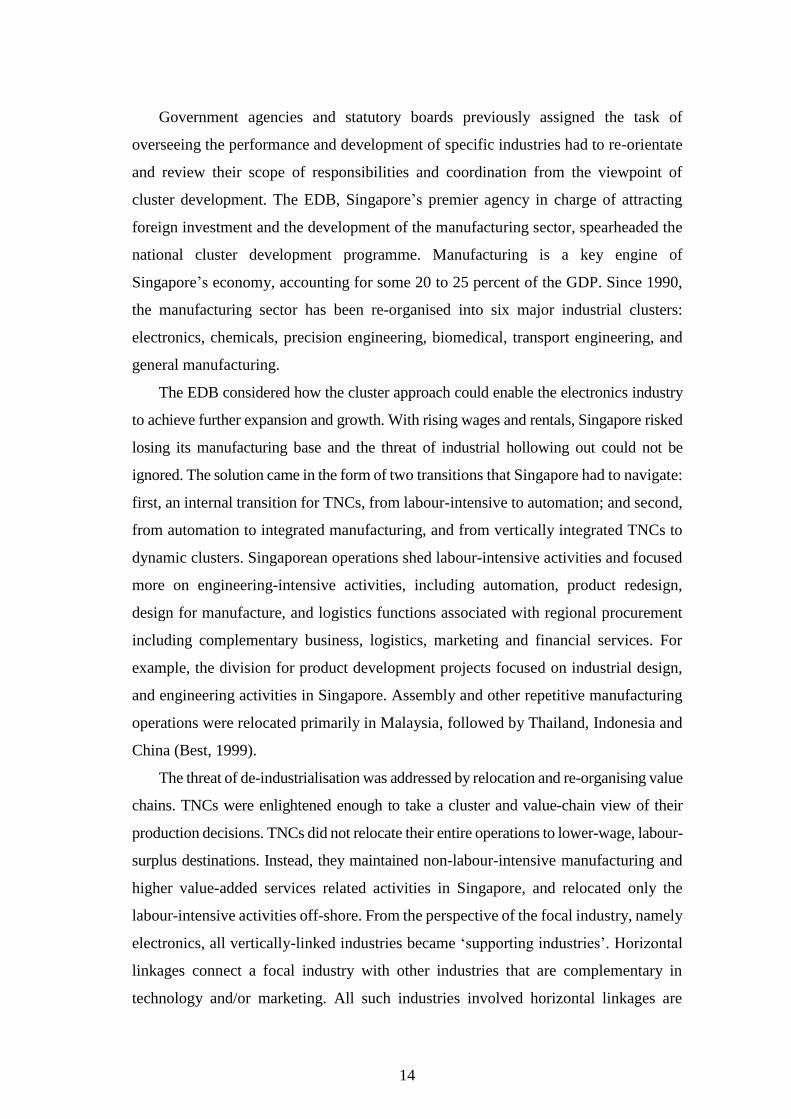
electronics, all vertically-linked industries became ‘supporting industries’. Horizontal
linkages connect a focal industry with other industries that are complementary in
technology and/or marketing. All such industries involved horizontal linkages are
15
called ‘related industries’. Figure 3 shows the set of industries that can cluster around
electronics.
Figure 3: Industries around Microelectronics
Source: Kotler, P., S. et al. (1997).
In the mid-1990s, the electronics industry remained Singapore’s most important
manufacturing industry, accounting for 36 percent of manufacturing value-added, 25
percent of the manufacturing workforce, and contributed 12 percent of the island’s
GDP. The feasibility and benefits of helping companies to relocate labour- and land-
intensive activities to locations where such resources were in abundance provided support
for Singapore’s active participation in cross-border regional development projects, such
as the SIJORI growth triangle (Toh and Low, 1993; Toh and Ng, 2009), and the
collaborative cross-country establishment of industrial parks such as the Singapore-
Suzhou Industrial Park in China, the Singapore-Bangalore Information Technology Park
in India, and the Viet Nam-Singapore Industrial Park in Hanoi. They provided the space
and opportunities for expansion of Singapore-based enterprises, and the loss in low value-
added activities was compensated for by enhanced returns in the form of advanced
processes and headquarters activities retained in Singapore. Such initiatives serve as nodes
16
of clusters and will eventually develop value chains that spark economic development and
growth benefiting local communities and Singapore.
2.1. Jurong Chemical Island Project – Chemical Hub
Another example of cluster development during this phase of development is the
Jurong Island project, started in 1993 to establish a world-class regional hub for the
chemical industry. In 1990, Singapore was already the home of several world-class
refineries and also the third-largest refining centre in the world. The development of
the petrochemical industry in Singapore is a natural progression, given Singapore's
strong base in petroleum refining, which provides feed stocks such as naphtha for the
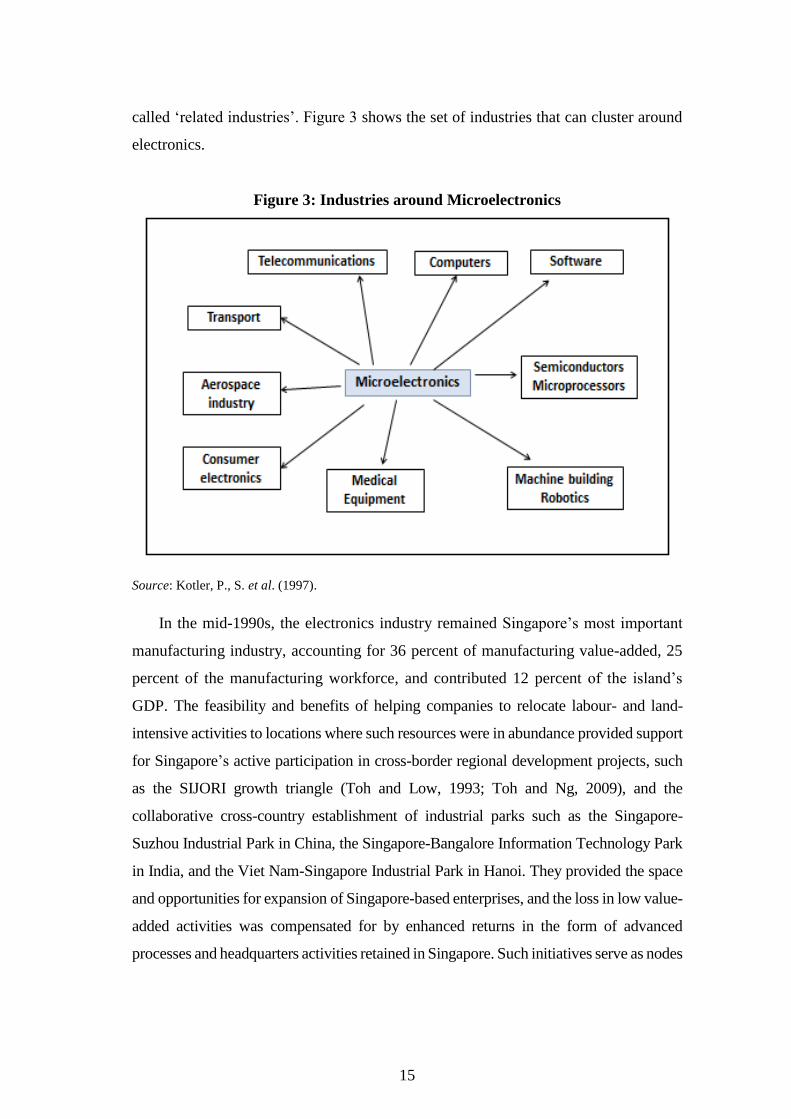
petrochemical industry. Figure 4 provides a graphic view of the chemical industry’s
clusters and their linkages to other industries and clusters. The petrochemical industry
could benefit from the expansion of the industries expected to accompany growth of
emerging economies in Asia.
Figure 4: The Chemical Cluster
Source: Economic Development Board.
17
Jurong Island is an artificial island located to the southwest of the main island of
Singapore, off Jurong Industrial Estate. It was formed from the amalgamation of seven
offshore islands, through land reclamation. The Jurong Island project was implemented
based on a total approach to industry development. Central to the industry cluster
concept and development of Jurong Island as an integrated complex was the sharing of
common facilities. These include marine facilities, such as jetties and other berthing
facilities; services such as warehousing, waste treatment, fire-fighting, medical and
emergency response; a common service corridor and infrastructure such as roads and
drains. The objective was to reduce capital investment and minimise operational costs
through creating synergistic linkages, one of which was the concept of sharing
facilities. For instance, feedstock transportation and handling costs could be minimised
and economies of scale generated through the provision of centralised logistics and
common corridors for materials flow.
Currently, Jurong Island hosts over 95 global companies, including heavyweights
such as Shell, ExxonMobil, Chevron, DuPont™, BASF, Sumitomo Chemicals and
Mitsui Chemicals. Jurong Island has drawn cumulative fixed-asset investments of over
S$40 billion and employed about 10,000 in 2012.
Singapore needs to maintain its relevance in GVCs and GPNs. As a result, EDB
officers have worked hard to design viable schemes to enable MNCs to ‘justify’ their
presence in Singapore, despite many emerging competitive locations that now beckon
them. One of these schemes is the Business Headquarters (BHQ) scheme introduced in
1994. The BHQ scheme complements the Overseas Headquarters scheme. The latter
helps local service-oriented companies and TNCs expand in the region. Because
production can be easily shifted based on cost considerations, core business support
capabilities such as product development, logistics operations and management,
merchandising and data management give manufacturers a critical competitive advantage
and broadens Singapore's expertise along the value-added chain. Both the Overseas
Headquarters and the BHQ schemes have a tax holiday for 10 years, but the latter is more
flexible. The five pioneer companies awarded the business headquarters include two
foreign (Baker Hughes, DNV Petroleum Services) and three local firms.
18
2.2. Prospects for Future Growth amidst Global Value Chains
Quest for a Knowledge-Based Economy
Singapore has managed to thrive on GVCs. However, it is not an easy task to
maintain Singapore’s relevance in GVCs. From a long-term perspective, the
Government adheres to the plan of developing Singapore into a knowledge-based
economy. It decided to move upstream in GVCs. Technology and human capital
development took on renewed importance in the new millennium. Under the EDB
Industry 21 initiative, industrial sector development placed emphasis on R&D, product
design and development, process engineering, testing and market research. The
Ministry of Manpower launched its Manpower 21 blueprint, which seeks to transform
Singapore into a country known for its talent, ideas and capital flows. It envisages that
the Singapore of the future will thrive on innovation and knowledge exchanges,
encouraging further innovation amongst its people and attracting creative visitors from
overseas.
The emphasis on technology remains pertinent for continued growth and
sustainability. The National Technology Plan (NTP) implemented since 1991 was
reviewed and continued with a new agenda and new targets under the latest Research,
Innovation and Enterprise (RIE) Plan launched in 2011. Complementing the ESC, the
target for gross expenditure on R&D (GERD) in 2015 is 3.5 percent of GDP, with
private sector R&D increasing its share. Between 2011 and 2015, the Government will
invest S$16.1 in RIE. At the same time, the emphasis on commercialisation of R&D
will be strengthened. The RIE 2015 Plan sets out Singapore’s key R&D strategies, to
support the long-term vision to become a research-intensive, innovative and
entrepreneurial economy similar to Sweden, Finland, or Israel.
Dedicated ministries of technology and other public agencies in charge of
technological development and R&D can be found in several countries. In Singapore,
the Agency for Science, Technology and Research (A*STAR) (formerly known as the
National Science and Technology Board) plays that role. A*STAR comprises 12
research institutes (RIs), with five RIs under the Biomedical Research Council
(BMRC) and seven RIs under the Science and Engineering Research Council (SERC).
A*STAR has a rich talent pool of more than 1,800 research scientists and engineers,
19
half of whom have PhDs. The biomedical science sector is targeted to be a new growth
engine for the economy5 (A*Star, 2009).
As an island state that is highly dependent on trade for economic survival,
Singapore is fully committed to an environment in which trade and investment flows
freely and unfettered. A rules-based trading environment is one that will ensure fair
treatment of all traders, large and small. With the limited progress seen in global multi-
lateral trade liberalisation championed by the WTO, Singapore had embarked on a very
intensive programme to established bilateral free-trade agreements (FTAs) with its
trading partners. The existing ASEAN Free Trade Agreement (AFTA) is an important
first step for regional economic integration and there is still much more that can be
done. FTAs are superhighways that connect Singapore to major economies and new
markets. With FTAs, Singapore-based exporters and investors stand to enjoy a myriad
of benefits, such as tariff concessions, preferential access to certain sectors, faster entry
into markets and intellectual property (IP) protection (IES, 2006). In fact, Singapore is
the most ‘promiscuous’ country in the world in establishing FTAs. Singapore is well-
connected to the world through an extensive network of FTAs. It has so far concluded
18 regional and bilateral FTAs, and is actively negotiating 10 more. In terms of
economic output, the 83 FTA partners together account for over 50 percent of the
world’s GDP. They also represent most of Singapore’s major trading partners,
accounting for more than 30 percent of its domestic exports.
A recent initiative to raise productivity in the economy was the establishment of
the Economic Strategy Committee (ESC) in 2009 to chart out the new roadmap for
Singapore. The ESC recommended seven broad strategies to help Singapore sustains
long-term growth of 3 to 5 percent over the next decade. The seven key strategies are:
1. Growing through skills and innovation
2. Anchor Singapore as a global-Asia hub
3. Build a vibrant and diverse corporate ecosystem
4. Make innovation pervasive, and strengthen commercialisation of R&D
5. Become a smart energy economy
5 A more detailed discussion of the Singapore’s cluster development of the Biomedical Science
sector can be found in Toh and Thangavelu (2008) and Wong, et al. (2009).
20
6. Enhance land productivity to secure future growth
7. Build a distinctive global city and an endearing home
ESC recommendations represent a bold strategic shift towards a focus on
productivity. It recommends a paradigm shift away from population-driven or
immigration-driven economic growth towards productivity-driven economic growth.
Basically, the intention is to make skills, innovation and productivity the drivers of
growth. It recognises that Singapore needs to readjust its economic policies and model
to address its over-reliance on developed markets, the importation of foreign workers
and declining productivity.
The ESC believes that competitive development advantages powered by skills and
innovation will need continuous upgrading of skills through retraining, and
encouraging R&D and investment in technology. The quantity and quality of foreign
workers will be managed through phased increases in foreign-worker levies.
Developing Singapore as a key Global-Asia hub in manufacturing, finance and logistics
will facilitate enterprises based in Singapore to tap into opportunities offered by a rising
Asia. It will help to develop a deeper base of globally competitive Singaporean
enterprises. This is another example of Singapore’s deliberate intention to remain
relevant in GVCs.
3. Global Value Chains and Trade in Value-Added: Importance and
Implications for Development Policies in Singapore
Trade data based on gross flows are increasingly inadequate as a basis for
understanding modern trade, as the value of a final good now comes from many
countries (Grossman, 2010). Around 80 percent of all trade takes place within the
international production networks of TNCs, including contractual relationships
between firms. But around one-third of global trade is now estimated to be intra-firm
trade, occurring within the ownership structure of a single firm or TNC (UNCTAD,
2013). Current trade data, based on gross flows, are failing to capture this shift,
hampering a thorough understanding of modern trade within GVCs.
21
Policymakers need to better understand where production is taking place and how
value is being added. This can only be known through understanding the proportion of
subcontracting components made elsewhere. The input–output technique pioneered by
Nobel Laureate Leontief (1951) offers one way of estimating the source(s) of value (by
country and industry) that is added in producing goods and services for export (and
import). It recognises that growing GVCs mean that a country's exports increasingly
rely on significant intermediate imports (and so, value-added by industries in upstream
countries). The availability of global I-O matrices6 has led to the development of
methodological contributions suggesting more general metrics of GVCs. In particular,
it helps to quantify the value-added embodied in the goods and services traded
internationally. Several recent articles generalise the vertical specialisation concept of
Hummels et al. (2001) and capture different dimensions of value-added embedded in
trade. Essentially, these new databases measure the extent to which countries are
involved in vertically fragmented production.7 This is approximated by the sum of the
value of imported inputs in the overall exports of a country (the backward linkage) plus
the percentage of exported goods and services used as imported inputs to produce other
countries’ exports (the forward linkage). The value-added shares describe the
participation of a country in GVCs, both as a user of foreign inputs and as a supplier of
intermediate goods and services used in other countries’ exports.
3.1. Singapore Participation in GVCs from the Perspective of Trade in Value-
Added
The OECD-WTO Trade in Value-Added (TiVA) database was made public
recently and has been used in many policy-oriented studies. OECD (2013) summarises
the main evidence and policy implications of the OECD’s work on GVCs, including
trade and investment policies targeted to GVCs. In addition, the OECD has produced
6 A recent special issue of the Economic Systems Research provides a very useful and detailed
description of several global multi-regional I-O databases currently available (see Tukker and
Dietzenbacher, 2013). 7 The first studies on the measurement of the value-added of trade in an international I-O framework
were those of Johnson and Noguera (2012a) Daudin, et al. (2011), and Koopman, et al. (2013),
using the Global Trade Analysis Project (GTAP) database.
22
several comparable country notes, including indicators on the relevance of value-added
trade and the participation in GVCs.8
According to information gathered from the OECD-WTO TiVA database, in 2009,
world gross exports amounted to US$17.05 trillion. However, world value-added
exports amounted to US$13.7 trillion (around 19 percent lower than gross exports),
emphasising the extent of double-counting in total trade due to trade in intermediate
inputs related to production network spanning across countries. Whilst world gross
exports as a proportion of GDP increased from 19 percent in 1995 to 25 percent in
2005, and then to 29 percent in 2009, world value-added exports were much lower and
increased from 16 to 18 percent in 2005, and then to 24 percent in 2009. In this paper
we use the information in the OECD-WTO TiVA database to consider Singapore’s
participation in GVCs in the light of the new TiVA indicators available.
Composition of Value-Added in Gross Exports
The global input–output table enables users and policymakers to decompose the
entire value of any good, exported by industry I, into the following components:
(a) Direct domestic value-added from industry I;
(b) Indirect domestic value-added generated via purely domestic transactions,
disaggregated by all domestic industries;
(c) Indirect domestic value-added embodied in imports (broken down by all
domestic industries);
(d) Indirect imported (foreign) value-added (broken down by producing
country and industry)
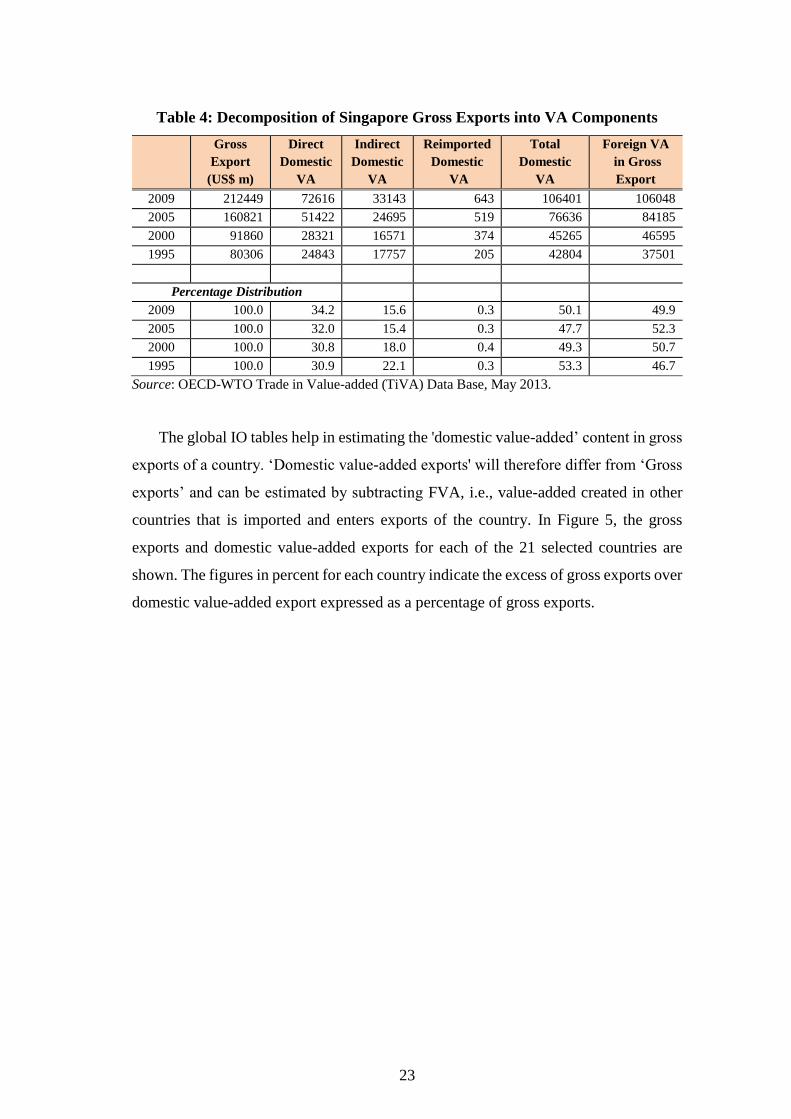
In Table 4, at the aggregate level, the gross exports of Singapore for selected years
between 1995 and 2009 are decomposed into the four VA components. Foreign value-
added (FVA) made up about 50 percent of gross exports in 2009, and this proportion
is higher than that in 1995 and slightly lower than in 2005.
8 Description of the database and the methodologies used in the computation of the various TiVA
indicators are available in Backer and Miroudot (2013) and Nadim Ahmad (2013).
23
Table 4: Decomposition of Singapore Gross Exports into VA Components
Gross
Export
(US$ m)
Direct
Domestic
VA
Indirect
Domestic
VA
Reimported
Domestic
VA
Total
Domestic
VA
Foreign VA
in Gross
Export
2009 212449 72616 33143 643 106401 106048
2005 160821 51422 24695 519 76636 84185
2000 91860 28321 16571 374 45265 46595
1995 80306 24843 17757 205 42804 37501
Percentage Distribution
2009 100.0 34.2 15.6 0.3 50.1 49.9
2005 100.0 32.0 15.4 0.3 47.7 52.3
2000 100.0 30.8 18.0 0.4 49.3 50.7
1995 100.0 30.9 22.1 0.3 53.3 46.7
Source: OECD-WTO Trade in Value-added (TiVA) Data Base, May 2013.
The global IO tables help in estimating the 'domestic value-added’ content in gross
exports of a country. ‘Domestic value-added exports' will therefore differ from ‘Gross
exports’ and can be estimated by subtracting FVA, i.e., value-added created in other
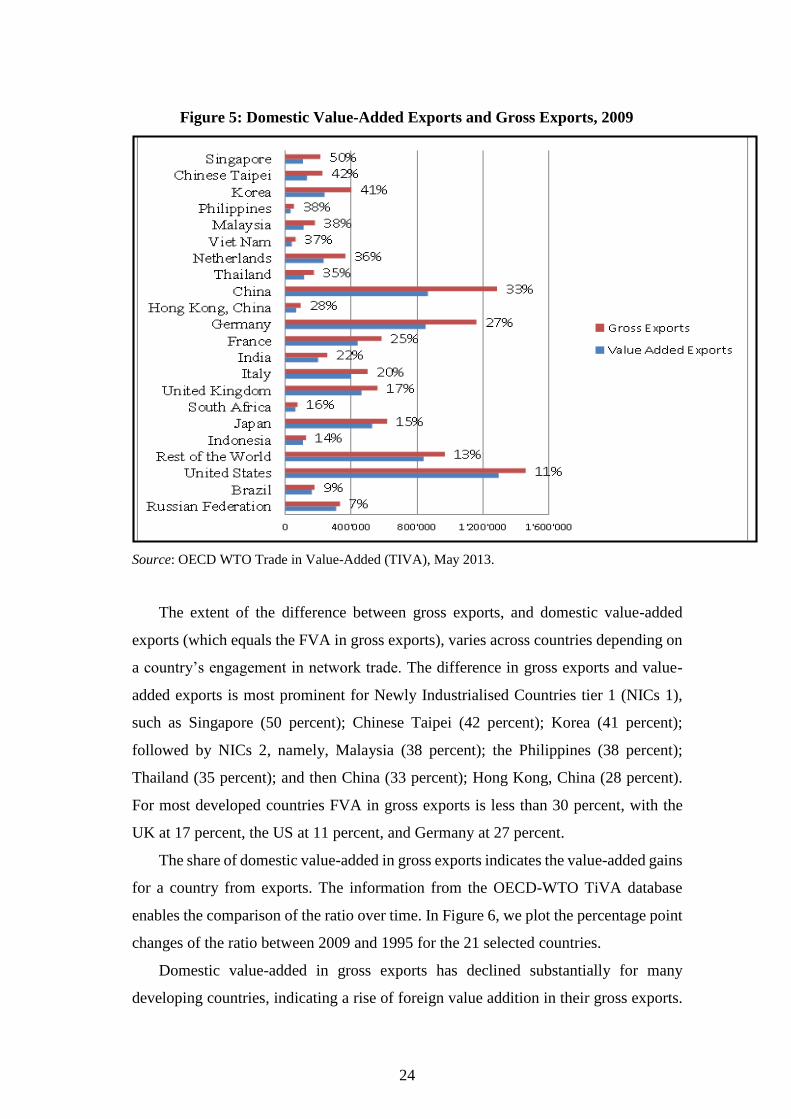
countries that is imported and enters exports of the country. In Figure 5, the gross
exports and domestic value-added exports for each of the 21 selected countries are
shown. The figures in percent for each country indicate the excess of gross exports over
domestic value-added export expressed as a percentage of gross exports.
24
Figure 5: Domestic Value-Added Exports and Gross Exports, 2009
Source: OECD WTO Trade in Value-Added (TIVA), May 2013.
The extent of the difference between gross exports, and domestic value-added
exports (which equals the FVA in gross exports), varies across countries depending on
a country’s engagement in network trade. The difference in gross exports and value-
added exports is most prominent for Newly Industrialised Countries tier 1 (NICs 1),
such as Singapore (50 percent); Chinese Taipei (42 percent); Korea (41 percent);
followed by NICs 2, namely, Malaysia (38 percent); the Philippines (38 percent);
Thailand (35 percent); and then China (33 percent); Hong Kong, China (28 percent).
For most developed countries FVA in gross exports is less than 30 percent, with the
UK at 17 percent, the US at 11 percent, and Germany at 27 percent.
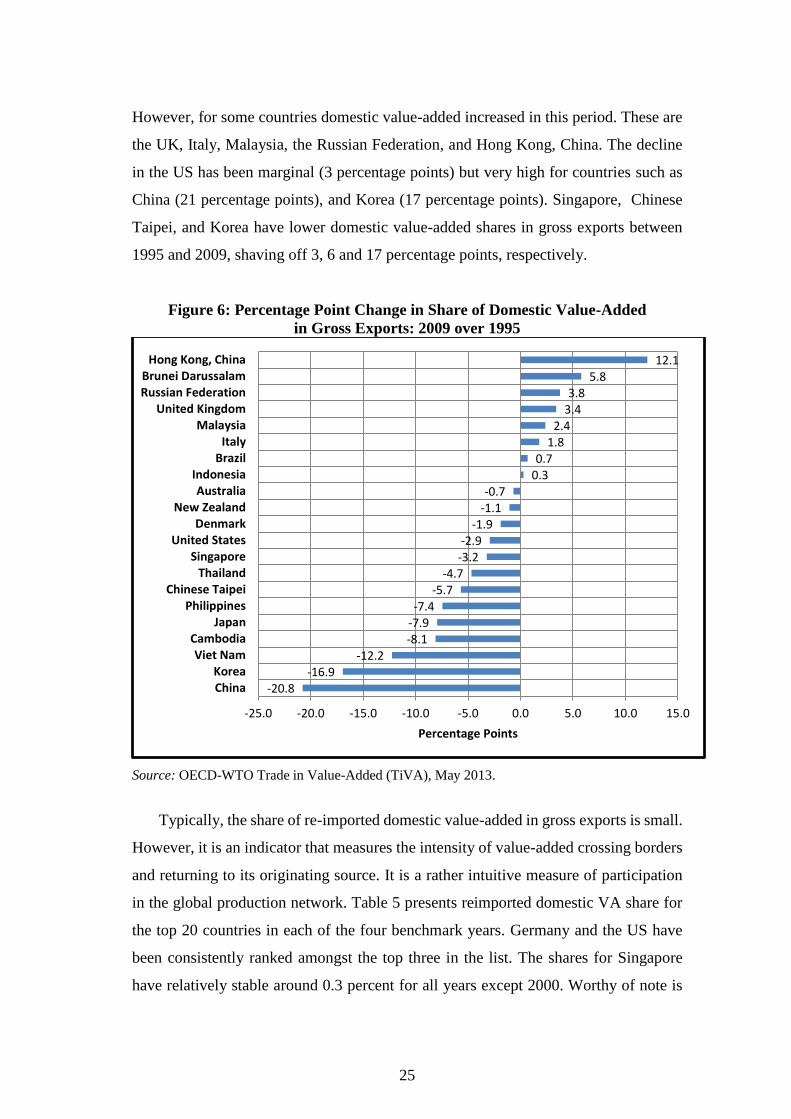
The share of domestic value-added in gross exports indicates the value-added gains
for a country from exports. The information from the OECD-WTO TiVA database
enables the comparison of the ratio over time. In Figure 6, we plot the percentage point
changes of the ratio between 2009 and 1995 for the 21 selected countries.
Domestic value-added in gross exports has declined substantially for many
developing countries, indicating a rise of foreign value addition in their gross exports.
25
However, for some countries domestic value-added increased in this period. These are
the UK, Italy, Malaysia, the Russian Federation, and Hong Kong, China. The decline
in the US has been marginal (3 percentage points) but very high for countries such as
China (21 percentage points), and Korea (17 percentage points). Singapore, Chinese
Taipei, and Korea have lower domestic value-added shares in gross exports between
1995 and 2009, shaving off 3, 6 and 17 percentage points, respectively.
Figure 6: Percentage Point Change in Share of Domestic Value-Added
in Gross Exports: 2009 over 1995
Source: OECD-WTO Trade in Value-Added (TiVA), May 2013.
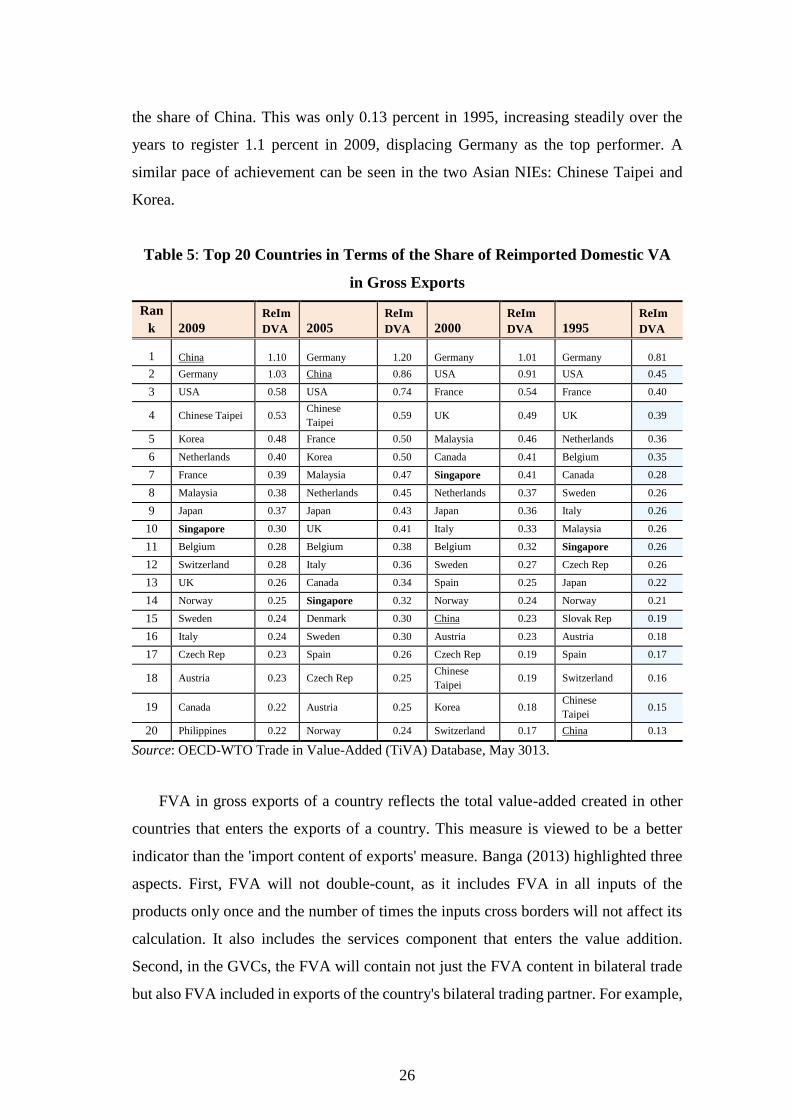
Typically, the share of re-imported domestic value-added in gross exports is small.
However, it is an indicator that measures the intensity of value-added crossing borders
and returning to its originating source. It is a rather intuitive measure of participation
in the global production network. Table 5 presents reimported domestic VA share for
the top 20 countries in each of the four benchmark years. Germany and the US have
been consistently ranked amongst the top three in the list. The shares for Singapore
have relatively stable around 0.3 percent for all years except 2000. Worthy of note is
-20.8-16.9
-12.2-8.1-7.9-7.4
-5.7-4.7
-3.2-2.9
-1.9-1.1-0.7
0.30.7
1.82.4
3.43.8
5.812.1
-25.0 -20.0 -15.0 -10.0 -5.0 0.0 5.0 10.0 15.0
ChinaKorea
Viet NamCambodia
JapanPhilippines
Chinese TaipeiThailand
SingaporeUnited States
DenmarkNew Zealand
AustraliaIndonesia
BrazilItaly
MalaysiaUnited Kingdom
Russian FederationBrunei Darussalam
Hong Kong, China
Percentage Points
26
the share of China. This was only 0.13 percent in 1995, increasing steadily over the
years to register 1.1 percent in 2009, displacing Germany as the top performer. A
similar pace of achievement can be seen in the two Asian NIEs: Chinese Taipei and
Korea.
Table 5: Top 20 Countries in Terms of the Share of Reimported Domestic VA
in Gross Exports
Ran
k 2009
ReIm
DVA 2005
ReIm
DVA 2000
ReIm
DVA 1995
ReIm
DVA
1 China 1.10 Germany 1.20 Germany 1.01 Germany 0.81
2 Germany 1.03 China 0.86 USA 0.91 USA 0.45
3 USA 0.58 USA 0.74 France 0.54 France 0.40
4 Chinese Taipei 0.53 Chinese
Taipei 0.59 UK 0.49 UK 0.39
5 Korea 0.48 France 0.50 Malaysia 0.46 Netherlands 0.36
6 Netherlands 0.40 Korea 0.50 Canada 0.41 Belgium 0.35
7 France 0.39 Malaysia 0.47 Singapore 0.41 Canada 0.28
8 Malaysia 0.38 Netherlands 0.45 Netherlands 0.37 Sweden 0.26
9 Japan 0.37 Japan 0.43 Japan 0.36 Italy 0.26
10 Singapore 0.30 UK 0.41 Italy 0.33 Malaysia 0.26
11 Belgium 0.28 Belgium 0.38 Belgium 0.32 Singapore 0.26
12 Switzerland 0.28 Italy 0.36 Sweden 0.27 Czech Rep 0.26
13 UK 0.26 Canada 0.34 Spain 0.25 Japan 0.22
14 Norway 0.25 Singapore 0.32 Norway 0.24 Norway 0.21
15 Sweden 0.24 Denmark 0.30 China 0.23 Slovak Rep 0.19
16 Italy 0.24 Sweden 0.30 Austria 0.23 Austria 0.18
17 Czech Rep 0.23 Spain 0.26 Czech Rep 0.19 Spain 0.17
18 Austria 0.23 Czech Rep 0.25 Chinese
Taipei 0.19 Switzerland 0.16
19 Canada 0.22 Austria 0.25 Korea 0.18 Chinese
Taipei 0.15
20 Philippines 0.22 Norway 0.24 Switzerland 0.17 China 0.13
Source: OECD-WTO Trade in Value-Added (TiVA) Database, May 3013.
FVA in gross exports of a country reflects the total value-added created in other
countries that enters the exports of a country. This measure is viewed to be a better
indicator than the 'import content of exports' measure. Banga (2013) highlighted three
aspects. First, FVA will not double-count, as it includes FVA in all inputs of the
products only once and the number of times the inputs cross borders will not affect its
calculation. It also includes the services component that enters the value addition.
Second, in the GVCs, the FVA will contain not just the FVA content in bilateral trade
but also FVA included in exports of the country's bilateral trading partner. For example,
27
if Singapore imports intermediate products from Malaysia, FVA content in Singapore's
exports will be the sum of value-added created in Malaysia, as well as value-added
created in other countries from where Malaysia, imported its inputs for producing its
intermediate product. It therefore includes all direct imports, as well as indirect imports
(from countries where there is no direct trade). This can have important implications
for bilateral trade balance. Third, the re-imported domestic value-added will be netted
out.
Table 6: Total FVA in Gross Exports (%), 1995–2009
2009 2005 2000 1995
Singapore 49.9 52.4 50.7 46.7 Chinese Taipei 41.5 42.2 35.4 35.8
Korea 40.6 37.7 32.9 23.7
Philippines 38.4 45.6 45.9 30.9
Malaysia 37.9 41.5 43.0 40.3
Viet Nam 36.7 35.0 29.6 24.4
Thailand 34.5 38.5 34.8 29.9
Cambodia 34.1 37.9 34.5 26.0
China 32.6 36.4 18.8 11.9
Denmark 32.0 32.0 26.2 30.1
Hong Kong, China 28.5 28.3 32.6 40.6
Italy 20.1 27.1 25.3 21.9
New Zealand 18.4 19.6 20.2 17.4
United Kingdom 17.3 20.3 18.4 20.7
Japan 14.8 13.8 9.9 6.9
Indonesia 14.4 17.8 19.3 14.7
Australia 12.5 13.0 13.5 11.8
Brunei Darussalam 11.3 6.8 10.4 17.1
United States 11.3 11.1 8.9 8.4
Brazil 9.0 13.0 11.5 9.7
Russian Federation 6.9 8.2 12.5 10.7
Source: OECD-WTO Trade in Value-Added (TiVA) database, May 2013.
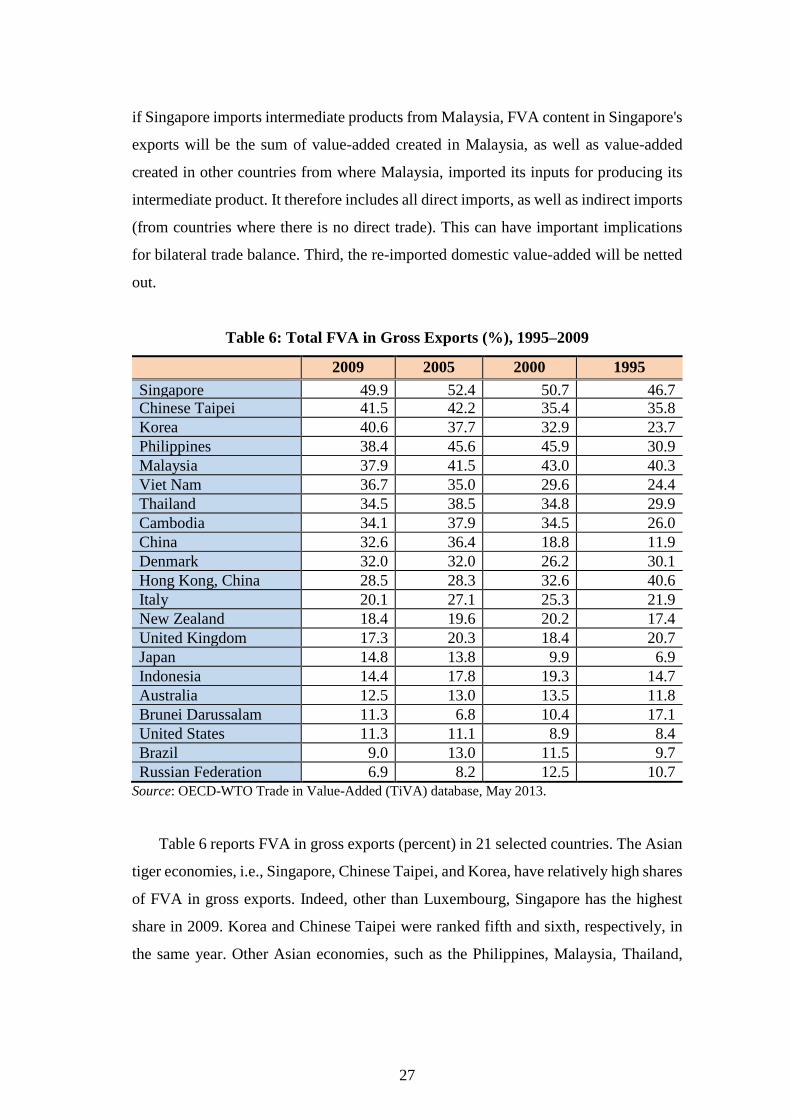
Table 6 reports FVA in gross exports (percent) in 21 selected countries. The Asian
tiger economies, i.e., Singapore, Chinese Taipei, and Korea, have relatively high shares
of FVA in gross exports. Indeed, other than Luxembourg, Singapore has the highest
share in 2009. Korea and Chinese Taipei were ranked fifth and sixth, respectively, in
the same year. Other Asian economies, such as the Philippines, Malaysia, Thailand,
28
and Viet Nam, have also experienced a steady rise in their share of FVA in gross
exports, whilst there has been a steady decline in case of Hong Kong, China.
Shares of FVA in gross exports for most developed countries have remained at less
than 30 percent, whilst those of Japan, the US, the UK and Australia have remained at
less than 20 percent. This brings us to the question of whether FVA in gross exports is
an appropriate indicator for measuring the extent of a country’s participation in GVCs.
We examine this issue in some detail in the next section.
Participation in GVCs confers considerable benefits. It may allow suppliers in
developing countries to meet standards and regulations that give them access to
developed country markets; it may allow imports under privileged tariff treatment for
intra-firm trade; it may permit the utilisation of network technology that would not
otherwise be available; and it may open up new sources of capital. The OECD-WTO
database provides an indicator (participation index) that measures the extent of
participation in GVCs. The measure is based on the share of exports involved in a
vertically fragmented production process (Hummels, et al., 2001; Koopman, et al.,
2010). The index is expressed as a percentage of gross exports and indicates the share
of foreign inputs (backward participation) and domestically produced inputs used in
third countries’ exports (forward participation).
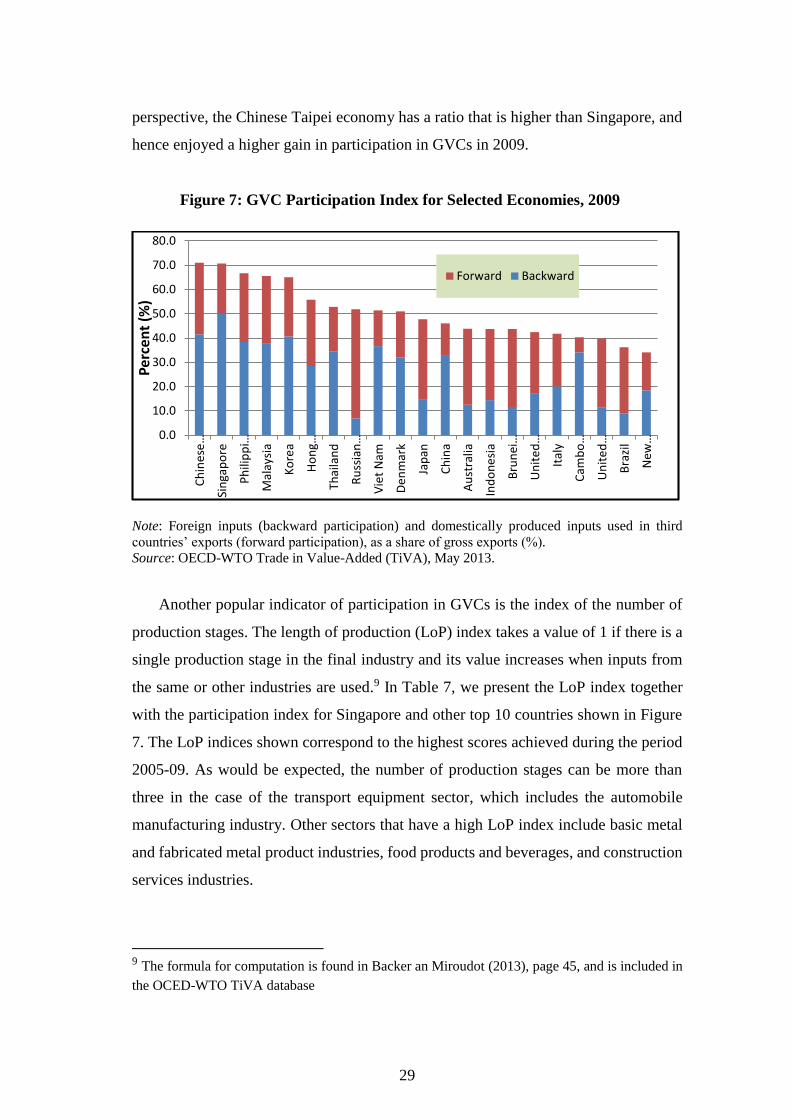
The participation index at the country level is represented on Figure 7 for selected
countries. Open economies such as Singapore, Chinese Taipei are amongst the top 10
economies with the high participation index. Small open economies such as Singapore
source more inputs from abroad in GVCs than large countries, such as the US or Japan.
The forward and backward participation indices, which sum to give the participation
index, offer additional information on the type of participation. Singapore and Chinese
Taipei share the same score in the participation index. However, Singapore’s backward
participation is larger than that of Chinese Taipei, reflecting Singapore’s relatively
greater reliance on foreign inputs and value-added to support its export activities. If
gains are measured in terms of ‘net value-added’ by participation in GVCs, then the
higher the forward linkages compared with backward linkages, the higher the gains.
This would imply that by its participation in GVCs, a country is creating and exporting
more domestic value-added than the FVA that it is importing. The ratio of forward to
backward participation therefore can be a measure of the extent of net gains. From this
29
perspective, the Chinese Taipei economy has a ratio that is higher than Singapore, and
hence enjoyed a higher gain in participation in GVCs in 2009.
Figure 7: GVC Participation Index for Selected Economies, 2009
Note: Foreign inputs (backward participation) and domestically produced inputs used in third
countries’ exports (forward participation), as a share of gross exports (%).
Source: OECD-WTO Trade in Value-Added (TiVA), May 2013.
Another popular indicator of participation in GVCs is the index of the number of
production stages. The length of production (LoP) index takes a value of 1 if there is a
single production stage in the final industry and its value increases when inputs from
the same or other industries are used.9 In Table 7, we present the LoP index together
with the participation index for Singapore and other top 10 countries shown in Figure
7. The LoP indices shown correspond to the highest scores achieved during the period
2005-09. As would be expected, the number of production stages can be more than
three in the case of the transport equipment sector, which includes the automobile
manufacturing industry. Other sectors that have a high LoP index include basic metal
and fabricated metal product industries, food products and beverages, and construction
services industries.
9 The formula for computation is found in Backer an Miroudot (2013), page 45, and is included in
the OCED-WTO TiVA database
0.0
10.0
20.0
30.0
40.0
50.0
60.0
70.0
80.0
Chinese…
Sin
gap
ore
Philippi…
Mal
aysi
a
Ko
rea
Hong…
Thai
lan
d
Russian…
Vie
t N
am
De
nm
ark
Jap
an
Ch
ina
Au
stra
lia
Ind
on
esi
a
Brunei…
United…
Ital
y
Cam
bo…
United…
Bra
zil
New
…
Per
cen
t (%
)
Forward Backward
30
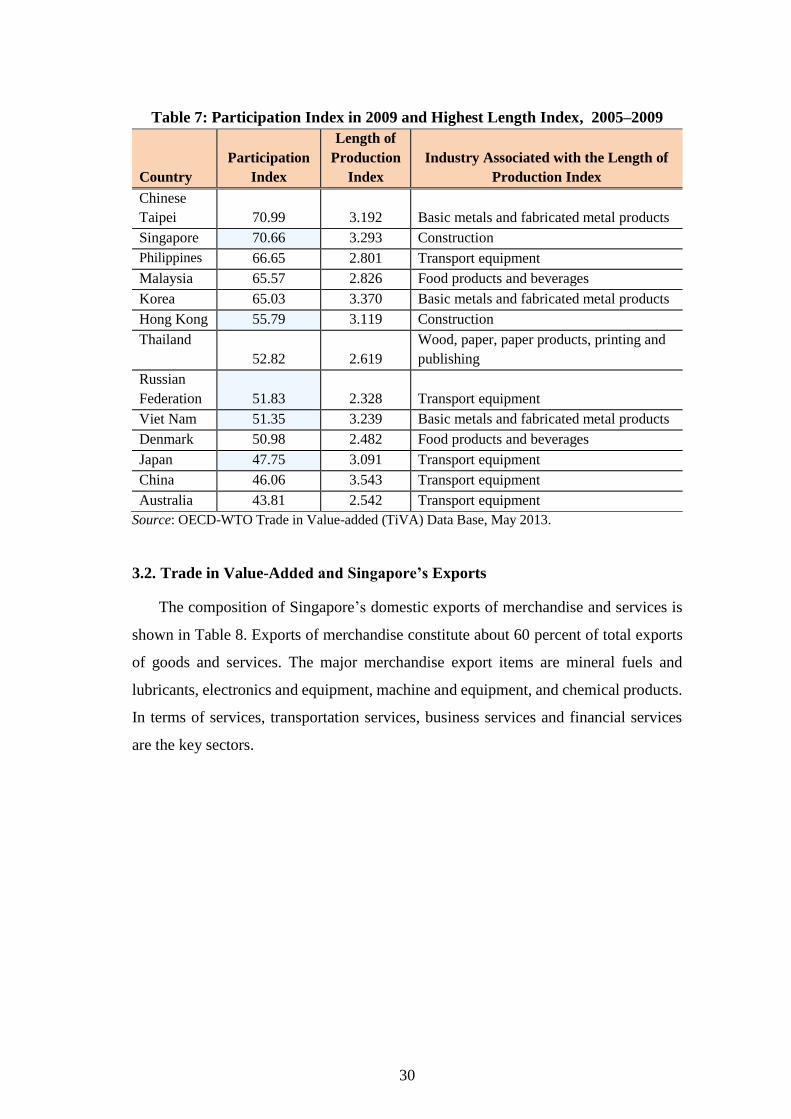
Table 7: Participation Index in 2009 and Highest Length Index, 2005–2009
Country
Participation
Index
Length of
Production
Index
Industry Associated with the Length of
Production Index
Chinese
Taipei 70.99 3.192 Basic metals and fabricated metal products
Singapore 70.66 3.293 Construction
Philippines 66.65 2.801 Transport equipment
Malaysia 65.57 2.826 Food products and beverages
Korea 65.03 3.370 Basic metals and fabricated metal products
Hong Kong 55.79 3.119 Construction
Thailand
52.82 2.619
Wood, paper, paper products, printing and
publishing
Russian
Federation 51.83 2.328 Transport equipment
Viet Nam 51.35 3.239 Basic metals and fabricated metal products
Denmark 50.98 2.482 Food products and beverages
Japan 47.75 3.091 Transport equipment
China 46.06 3.543 Transport equipment
Australia 43.81 2.542 Transport equipment
Source: OECD-WTO Trade in Value-added (TiVA) Data Base, May 2013.
3.2. Trade in Value-Added and Singapore’s Exports
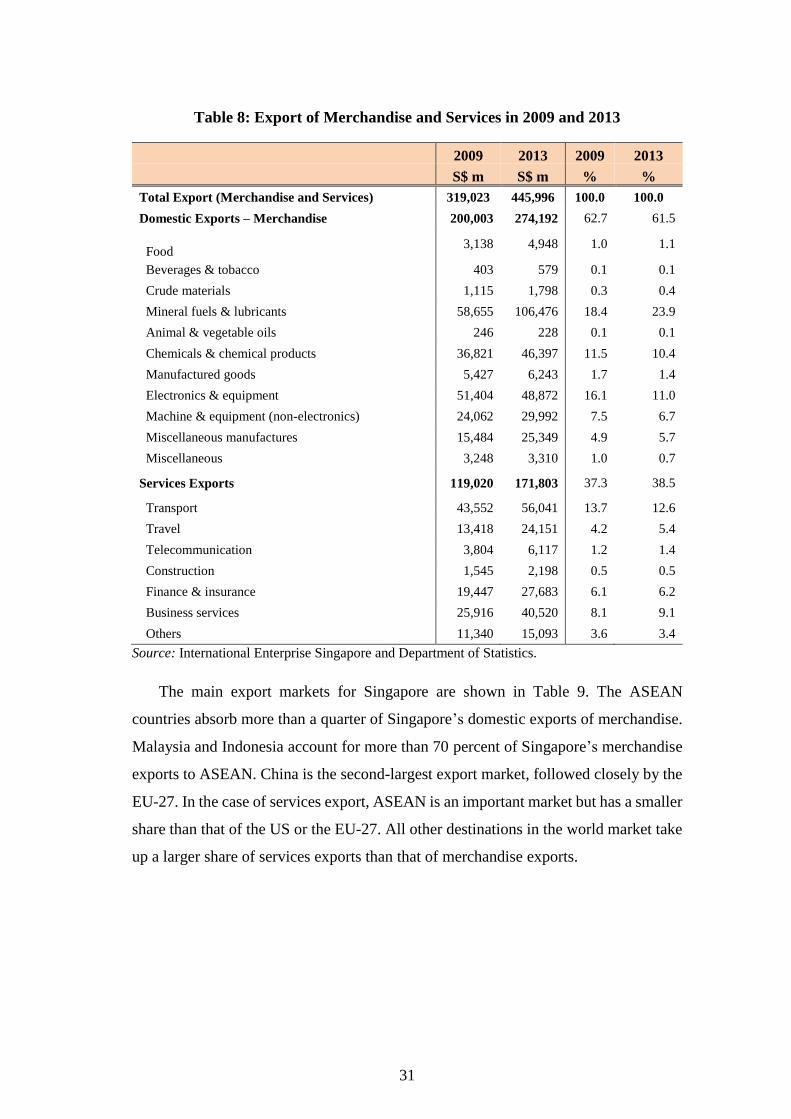
The composition of Singapore’s domestic exports of merchandise and services is
shown in Table 8. Exports of merchandise constitute about 60 percent of total exports
of goods and services. The major merchandise export items are mineral fuels and
lubricants, electronics and equipment, machine and equipment, and chemical products.
In terms of services, transportation services, business services and financial services
are the key sectors.
31
Table 8: Export of Merchandise and Services in 2009 and 2013
2009 2013 2009 2013
S$ m S$ m % %
Total Export (Merchandise and Services) 319,023 445,996 100.0 100.0
Domestic Exports – Merchandise 200,003 274,192 62.7 61.5
Food 3,138 4,948 1.0 1.1
Beverages & tobacco 403 579 0.1 0.1
Crude materials 1,115 1,798 0.3 0.4
Mineral fuels & lubricants 58,655 106,476 18.4 23.9
Animal & vegetable oils 246 228 0.1 0.1
Chemicals & chemical products 36,821 46,397 11.5 10.4
Manufactured goods 5,427 6,243 1.7 1.4
Electronics & equipment 51,404 48,872 16.1 11.0
Machine & equipment (non-electronics) 24,062 29,992 7.5 6.7
Miscellaneous manufactures 15,484 25,349 4.9 5.7
Miscellaneous 3,248 3,310 1.0 0.7
Services Exports 119,020 171,803 37.3 38.5
Transport 43,552 56,041 13.7 12.6
Travel 13,418 24,151 4.2 5.4
Telecommunication 3,804 6,117 1.2 1.4
Construction 1,545 2,198 0.5 0.5
Finance & insurance 19,447 27,683 6.1 6.2
Business services 25,916 40,520 8.1 9.1
Others 11,340 15,093 3.6 3.4
Source: International Enterprise Singapore and Department of Statistics.
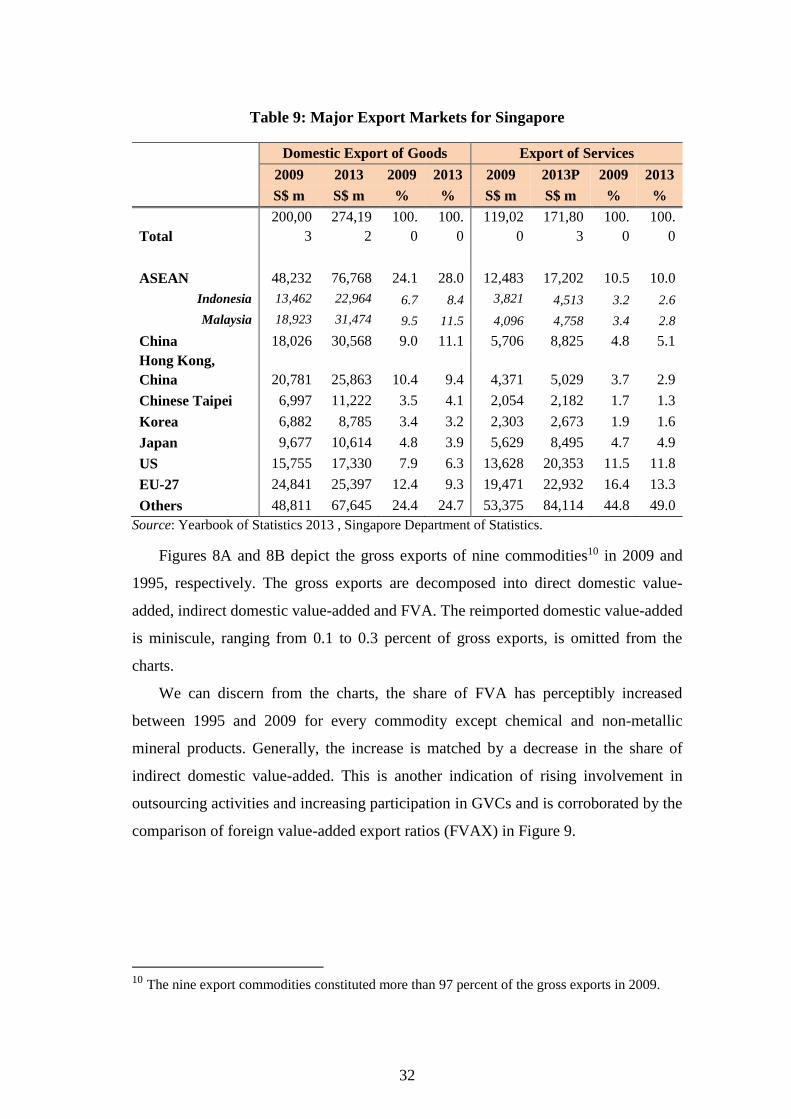
The main export markets for Singapore are shown in Table 9. The ASEAN
countries absorb more than a quarter of Singapore’s domestic exports of merchandise.
Malaysia and Indonesia account for more than 70 percent of Singapore’s merchandise
exports to ASEAN. China is the second-largest export market, followed closely by the
EU-27. In the case of services export, ASEAN is an important market but has a smaller
share than that of the US or the EU-27. All other destinations in the world market take
up a larger share of services exports than that of merchandise exports.
32
Table 9: Major Export Markets for Singapore
Domestic Export of Goods Export of Services
2009 2013 2009 2013 2009 2013P 2009 2013
S$ m S$ m % % S$ m S$ m % %
Total
200,00
3
274,19
2
100.
0
100.
0
119,02
0
171,80
3
100.
0
100.
0
ASEAN 48,232 76,768 24.1 28.0 12,483 17,202 10.5 10.0
Indonesia 13,462 22,964 6.7 8.4 3,821 4,513 3.2 2.6
Malaysia 18,923 31,474 9.5 11.5 4,096 4,758 3.4 2.8
China 18,026 30,568 9.0 11.1 5,706 8,825 4.8 5.1
Hong Kong,
China 20,781 25,863 10.4 9.4 4,371 5,029 3.7 2.9
Chinese Taipei 6,997 11,222 3.5 4.1 2,054 2,182 1.7 1.3
Korea 6,882 8,785 3.4 3.2 2,303 2,673 1.9 1.6
Japan 9,677 10,614 4.8 3.9 5,629 8,495 4.7 4.9
US 15,755 17,330 7.9 6.3 13,628 20,353 11.5 11.8
EU-27 24,841 25,397 12.4 9.3 19,471 22,932 16.4 13.3
Others 48,811 67,645 24.4 24.7 53,375 84,114 44.8 49.0
Source: Yearbook of Statistics 2013 , Singapore Department of Statistics.
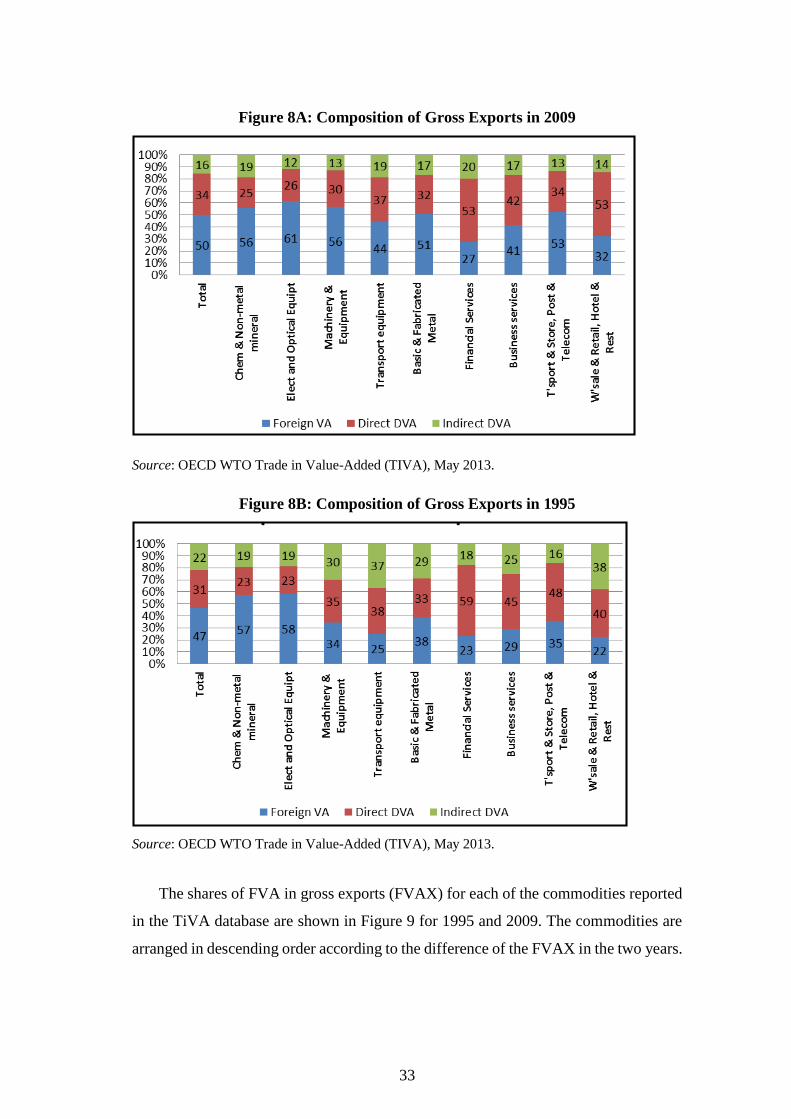
Figures 8A and 8B depict the gross exports of nine commodities10 in 2009 and
1995, respectively. The gross exports are decomposed into direct domestic value-
added, indirect domestic value-added and FVA. The reimported domestic value-added
is miniscule, ranging from 0.1 to 0.3 percent of gross exports, is omitted from the
charts.
We can discern from the charts, the share of FVA has perceptibly increased
between 1995 and 2009 for every commodity except chemical and non-metallic
mineral products. Generally, the increase is matched by a decrease in the share of
indirect domestic value-added. This is another indication of rising involvement in
outsourcing activities and increasing participation in GVCs and is corroborated by the
comparison of foreign value-added export ratios (FVAX) in Figure 9.
10 The nine export commodities constituted more than 97 percent of the gross exports in 2009.
33
Figure 8A: Composition of Gross Exports in 2009
Source: OECD WTO Trade in Value-Added (TIVA), May 2013.
Figure 8B: Composition of Gross Exports in 1995
Source: OECD WTO Trade in Value-Added (TIVA), May 2013.
The shares of FVA in gross exports (FVAX) for each of the commodities reported
in the TiVA database are shown in Figure 9 for 1995 and 2009. The commodities are
arranged in descending order according to the difference of the FVAX in the two years.
34
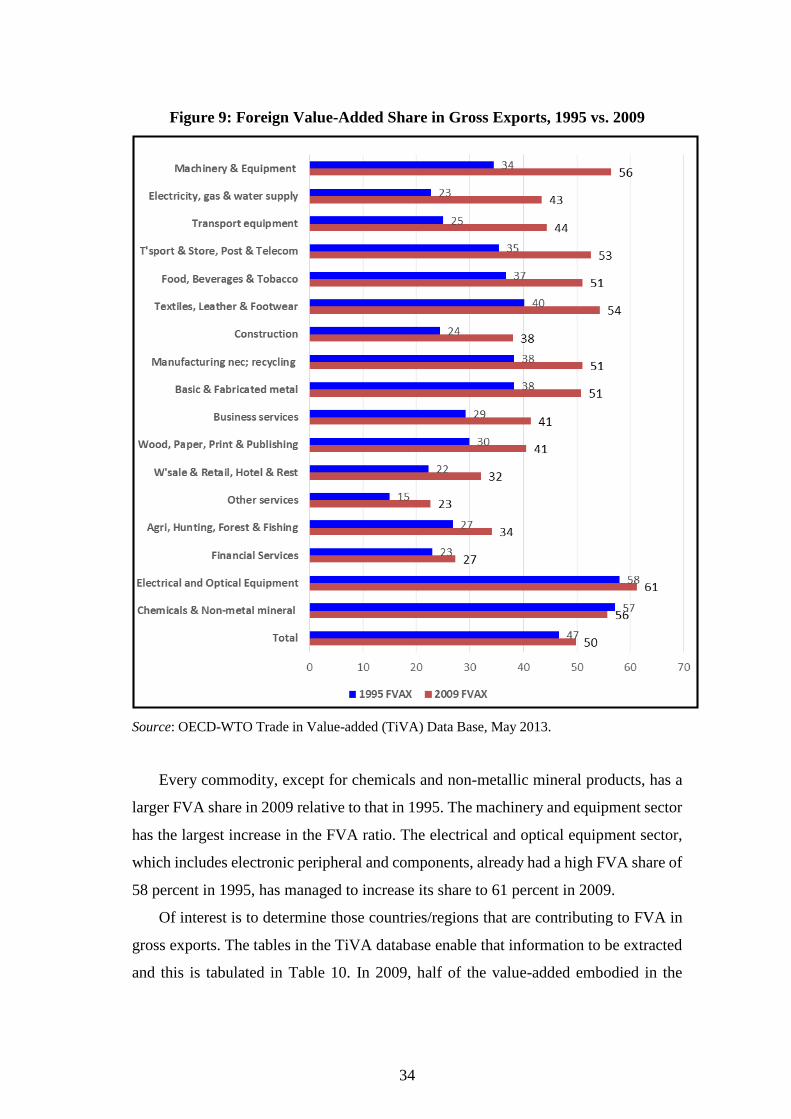
Figure 9: Foreign Value-Added Share in Gross Exports, 1995 vs. 2009
Source: OECD-WTO Trade in Value-added (TiVA) Data Base, May 2013.
Every commodity, except for chemicals and non-metallic mineral products, has a
larger FVA share in 2009 relative to that in 1995. The machinery and equipment sector
has the largest increase in the FVA ratio. The electrical and optical equipment sector,
which includes electronic peripheral and components, already had a high FVA share of
58 percent in 1995, has managed to increase its share to 61 percent in 2009.
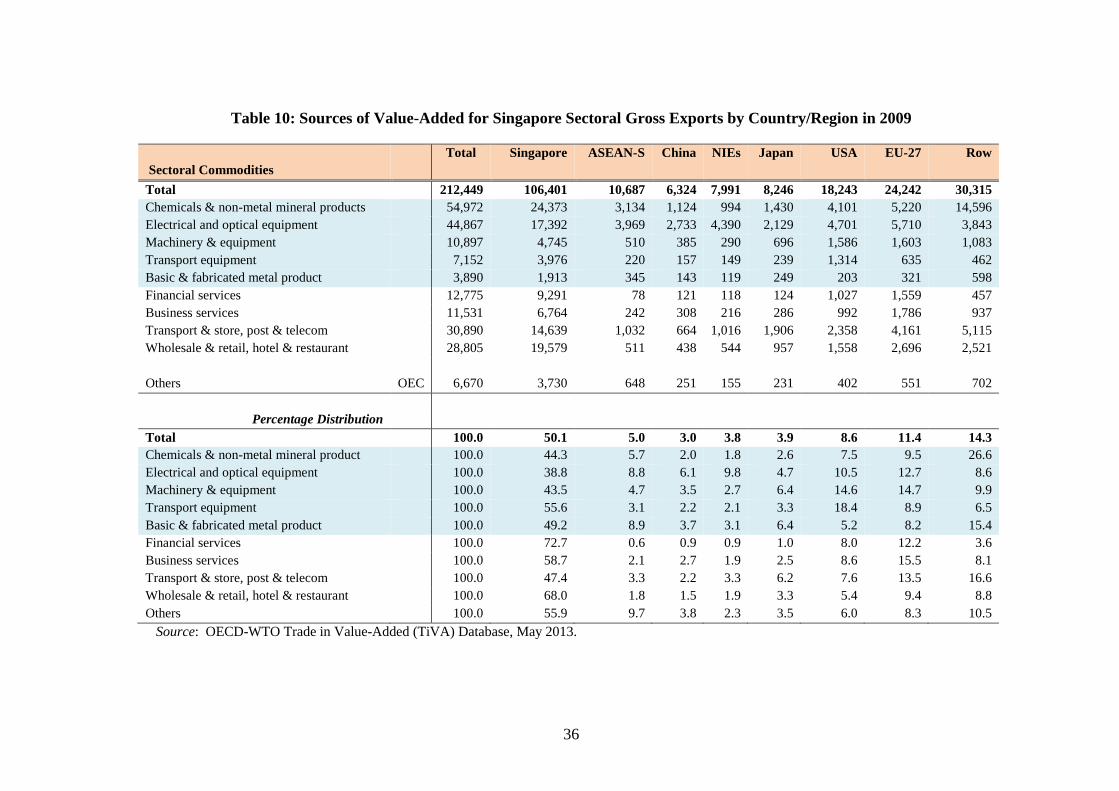
Of interest is to determine those countries/regions that are contributing to FVA in
gross exports. The tables in the TiVA database enable that information to be extracted
and this is tabulated in Table 10. In 2009, half of the value-added embodied in the
35
aggregate exports is foreign. The EU-27 contribute 11.4 percent of the total VA, whilst
8.3 percent and 5 percent of total VA originate from the US and ASEAN region,
respectively.
Electronic products are included in the category of electrical and optical
equipment. The export of commodities from this category has the lowest share of
domestic value-added amongst all the categories listed in the table. Slightly more than
60 percent of the value-added originated from abroad. The EU-27, the US, and the NIEs
contribute between 10 to 13 percent each to the total VA embodied in gross exports of
this category.
As expected, exports from the services sector have higher domestic value-added
content than the non-services sectors. In particular, the financial services sector has the
highest domestic VA share of 73 percent and the bulk of its foreign VA originates from
the EU-27 region.
36
Table 10: Sources of Value-Added for Singapore Sectoral Gross Exports by Country/Region in 2009
Total Singapore ASEAN-S China NIEs Japan USA EU-27 Row
Sectoral Commodities
Total 212,449 106,401 10,687 6,324 7,991 8,246 18,243 24,242 30,315
Chemicals & non-metal mineral products 54,972 24,373 3,134 1,124 994 1,430 4,101 5,220 14,596
Electrical and optical equipment 44,867 17,392 3,969 2,733 4,390 2,129 4,701 5,710 3,843
Machinery & equipment 10,897 4,745 510 385 290 696 1,586 1,603 1,083
Transport equipment 7,152 3,976 220 157 149 239 1,314 635 462
Basic & fabricated metal product 3,890 1,913 345 143 119 249 203 321 598
Financial services 12,775 9,291 78 121 118 124 1,027 1,559 457
Business services 11,531 6,764 242 308 216 286 992 1,786 937
Transport & store, post & telecom 30,890 14,639 1,032 664 1,016 1,906 2,358 4,161 5,115
Wholesale & retail, hotel & restaurant 28,805 19,579 511 438 544 957 1,558 2,696 2,521
Others
OEC 6,670 3,730 648 251 155 231 402 551 702
Percentage Distribution
Total 100.0 50.1 5.0 3.0 3.8 3.9 8.6 11.4 14.3
Chemicals & non-metal mineral product 100.0 44.3 5.7 2.0 1.8 2.6 7.5 9.5 26.6
Electrical and optical equipment 100.0 38.8 8.8 6.1 9.8 4.7 10.5 12.7 8.6
Machinery & equipment 100.0 43.5 4.7 3.5 2.7 6.4 14.6 14.7 9.9
Transport equipment 100.0 55.6 3.1 2.2 2.1 3.3 18.4 8.9 6.5
Basic & fabricated metal product 100.0 49.2 8.9 3.7 3.1 6.4 5.2 8.2 15.4
Financial services 100.0 72.7 0.6 0.9 0.9 1.0 8.0 12.2 3.6
Business services 100.0 58.7 2.1 2.7 1.9 2.5 8.6 15.5 8.1
Transport & store, post & telecom 100.0 47.4 3.3 2.2 3.3 6.2 7.6 13.5 16.6
Wholesale & retail, hotel & restaurant 100.0 68.0 1.8 1.5 1.9 3.3 5.4 9.4 8.8
Others 100.0 55.9 9.7 3.8 2.3 3.5 6.0 8.3 10.5
Source: OECD-WTO Trade in Value-Added (TiVA) Database, May 2013.
37
3.3. Services Export and Service Value-Added in Exports
The share of services exports in total exports has risen steadily over the years to
reach 38.5 percent in 2013 (Table 8). Based on TiVA database information for
Singapore, the value-added contribution of services exports to the economy increased
considerably between 2000 and 2009, rising from 24 percent of GDP to 34 percent of
GDP.
According to the OECD research brief,11 accounting for the value-added by
services in the production of goods shows that the services sector contributes over 50
percent of total exports in the US, the UK, France, Germany and Italy and nearly one-
third in China, with a significant contribution (typically one third in 2009) across all
manufactured goods provided by both foreign and domestic service providers, with the
contribution rising between 5 and 10 percent in many countries since 1995.
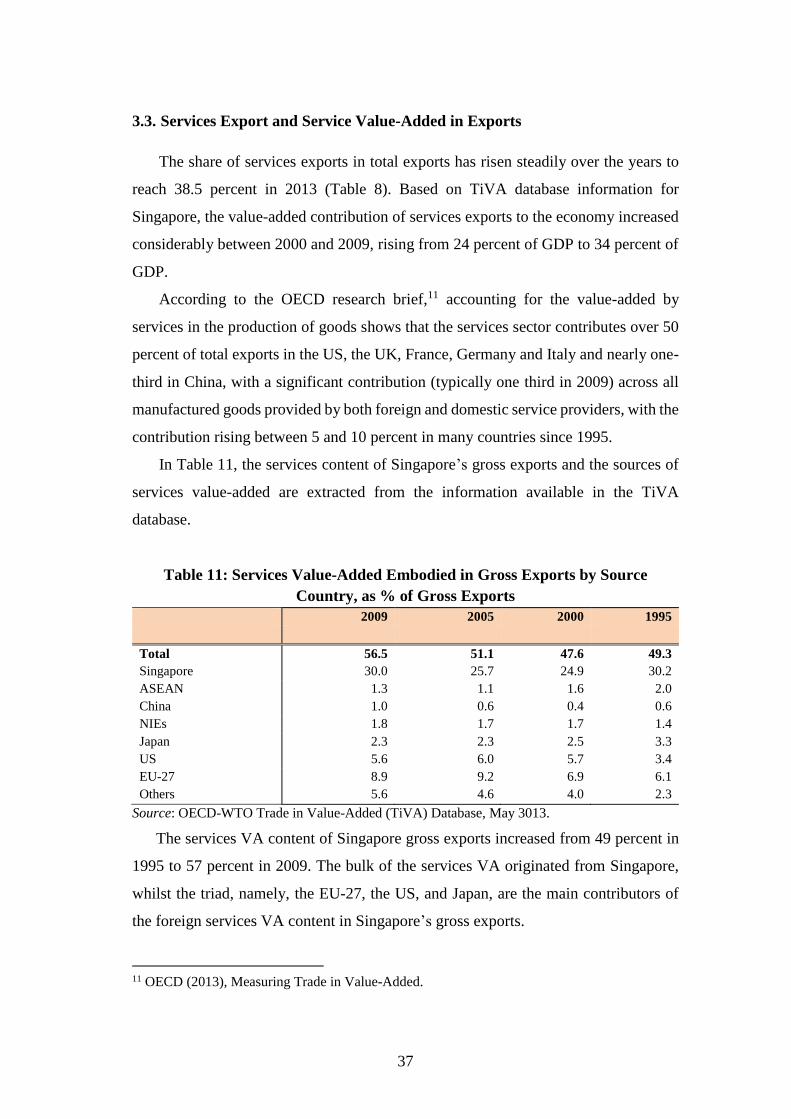
In Table 11, the services content of Singapore’s gross exports and the sources of
services value-added are extracted from the information available in the TiVA
database.
Table 11: Services Value-Added Embodied in Gross Exports by Source
Country, as % of Gross Exports
2009 2005 2000 1995
Total 56.5 51.1 47.6 49.3
Singapore 30.0 25.7 24.9 30.2
ASEAN 1.3 1.1 1.6 2.0
China 1.0 0.6 0.4 0.6
NIEs 1.8 1.7 1.7 1.4
Japan 2.3 2.3 2.5 3.3
US 5.6 6.0 5.7 3.4
EU-27 8.9 9.2 6.9 6.1
Others 5.6 4.6 4.0 2.3
Source: OECD-WTO Trade in Value-Added (TiVA) Database, May 3013.
The services VA content of Singapore gross exports increased from 49 percent in
1995 to 57 percent in 2009. The bulk of the services VA originated from Singapore,
whilst the triad, namely, the EU-27, the US, and Japan, are the main contributors of
the foreign services VA content in Singapore’s gross exports.
11 OECD (2013), Measuring Trade in Value-Added.
38
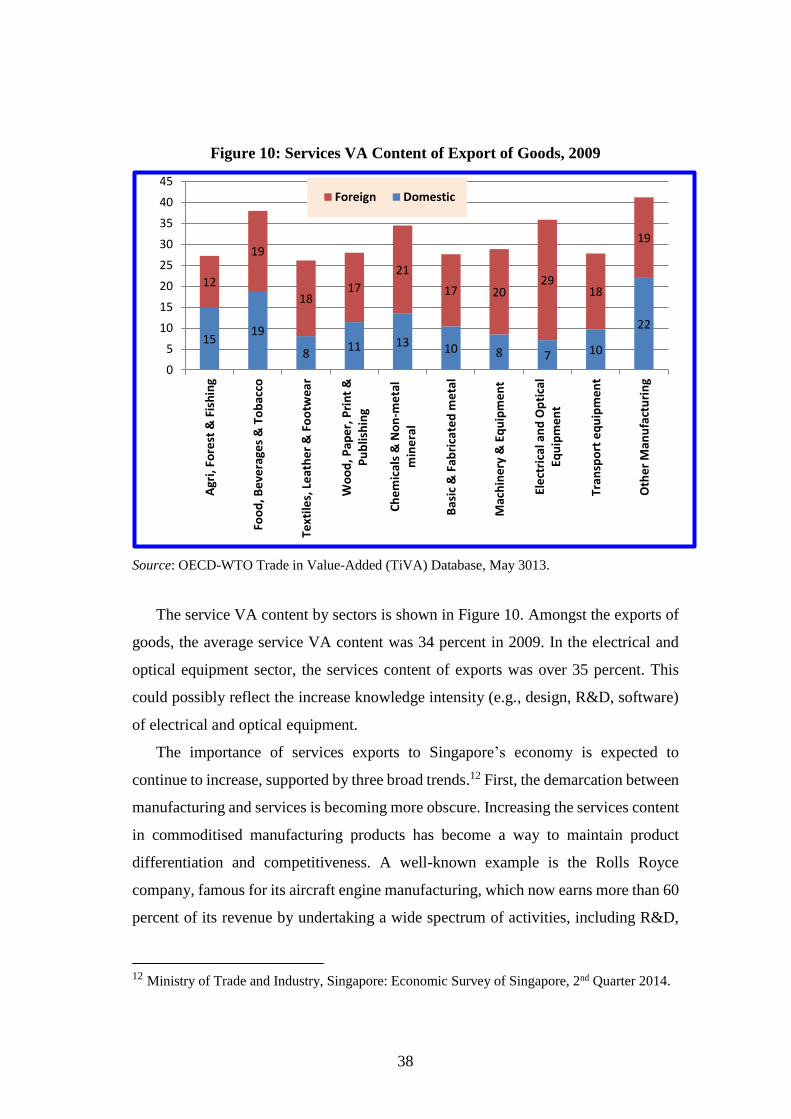
Figure 10: Services VA Content of Export of Goods, 2009
Source: OECD-WTO Trade in Value-Added (TiVA) Database, May 3013.
The service VA content by sectors is shown in Figure 10. Amongst the exports of
goods, the average service VA content was 34 percent in 2009. In the electrical and
optical equipment sector, the services content of exports was over 35 percent. This
could possibly reflect the increase knowledge intensity (e.g., design, R&D, software)
of electrical and optical equipment.
The importance of services exports to Singapore’s economy is expected to
continue to increase, supported by three broad trends.12 First, the demarcation between
manufacturing and services is becoming more obscure. Increasing the services content
in commoditised manufacturing products has become a way to maintain product
differentiation and competitiveness. A well-known example is the Rolls Royce
company, famous for its aircraft engine manufacturing, which now earns more than 60
percent of its revenue by undertaking a wide spectrum of activities, including R&D,
12 Ministry of Trade and Industry, Singapore: Economic Survey of Singapore, 2nd Quarter 2014.
1519
811 13 10 8 7 10
22
12
19
1817
21
17 2029
18
19
0
5
10
15
20
25
30
35
40
45
Agr
i, F
ore
st &
Fis
hin
g
Foo
d, B
eve
rage
s &
To
bac
co
Text
iles,
Le
ath
er
& F
oo
twea
r
Wo
od
, Pap
er,
Pri
nt
&P
ub
lish
ing
Ch
em
ical
s &
No
n-m
eta
lm
ine
ral
Bas
ic &
Fab
rica
ted
me
tal
Mac
hin
ery
& E
qu
ipm
en
t
Ele
ctri
cal a
nd
Op
tica
lEq
uip
me
nt
Tran
spo
rt e
qu
ipm
en
t
Oth
er
Man
ufa
ctu
rin
g
Foreign Domestic
39
testing, repair, overhaul (MRO), and overall services and parts management in many
countries including Singapore. Second, the trend towards fragmentation is expanding.
This will engender more business for services relating to transport and logistics,
financing, legal services, business consultancy and management. Singapore is well-
placed and well-equipped to provide such services. Third, the successful
implementation of the various regional trade agreements (such as the TPP, RCEP,
AFTA, and AFAS) will provide greater opportunities to boost trade in services in
tandem with rising incomes and the removal of barriers to the movement of goods.
4. Conclusion
The emergence of mainstream research on GVCs is an acknowledgment of the
increased importance of networked MNCs in global trade. New developments within
trade theory have recognised the increasing importance of these trends for some time,
but the GVC framework provides an easier way for policymakers to conceptualise
these trends. Success in pursuing a strategy of trade-led economic growth is translated
to be successfully trading in integrated global markets and upgrading within the
GVCs. The ability of countries to do so depends on many of the policy measures
applied at their borders, as noted by the traditional trade literature, as well as
considerations related to institutions and geography. However, success also requires
consideration of new issues beyond border measures, including the management of
FDI.
Linking into GVCs is increasingly being considered the new development
challenge by many policymakers, especially in developing countries. GVCs are
expected to bring gains to linked-in countries in terms of improved competitiveness,
and better access to global markets and expansion of production and jobs. However,
whether countries realise these gains or not is still not clearly understood, mainly
because the tools to measure a country’s extent of participation in GVCs and
distribution of incomes generated in GVCs across countries are limited. The rising
share of intermediate products in total trade has challenged the use of traditional tools,
such as export shares, in assessing countries’ competitiveness. Higher export shares
40
may not necessarily imply higher competitiveness if exports contain a large share of
imported intermediate products. In a similar fashion, higher exports may not guarantee
more domestic production and more jobs if the domestic value-added content of
exports does not rise (Banga, 2013)
Value-added in trade (export) can be decomposed into domestic value-added and
foreign value-added. The increasing proportion of foreign value-added is considered
to show increasing participation in GVCs by many analysts. However, this can be
unfavourable if it comes at the price of declining domestic value-added from lower
domestic absorptive capacity and de-industrialisation. In fact, a study by Kummritz
(2014) using a new set of OECD inter-country IO tables shows that GVC participation
is positively related to domestic value-added along the whole value chain. He added
that foreign value-added works as a complement rather than a substitute to domestic
value-added, and that GVC participation benefits the domestic economy.
The new Trade in Value-Added (TiVA) database launched by the OECD and the
WTO in January 2013 reveals that services play a far more important role in global
trade than suggested by the standard measurement of gross flows of exports and
imports. The TiVA initiative shows the value-added by a country in the production of
any good or service that is then exported, and offers a fuller picture of commercial
relations between nations.
The value created by services as intermediate inputs represents, on average, over
30 percent of the total value-added in manufactured goods. Liberalisation of the
services trade would allow for more efficient and higher-quality services, thus
enhancing the competitiveness of manufacturing firms and allowing them to better
participate in global production networks.
It is heartening to note that there would be no GVCs without well-functioning
transport, logistics, finance, communication, and other business and professional
services to move goods and coordinate production along the value chain. As
Singapore’s economy transforms into a knowledge-based services economy, its
prospects are not diminished with expansion and proliferation of GVCs.
As noted in UNCTAD (2013), integration into GVCs is not synonymous with
economic development: even though a greater integration into value chains may
generate long-term benefits, evidence shows that relatively few developing countries
41
have been able to increase their domestic value-added and to enhance new capabilities
and productive capacity only by integrating into GVCs. Singapore recognised the
importance of GVCs and GPNs at an early stage in its development. Instead of blanket
subsidies for exports and FDI, efforts were made to attract MNCs to produce key
inputs or to bring specific knowledge needed by clusters with the ability to absorb
them. Without policies to develop local capabilities, MNC-led exports are likely to
remain technologically stagnant, leaving developing countries unable to progress
beyond the assembly of imported components (Chandra and Kolavalli, 2006)
Government intervention to have enterprises participate in GVCs via cluster-based
development policies is undeniably a form of industrial policy. Pro-market
intervention is generally more welcome than policies designed to help or discourage
specific industries. ‘Light’ interventions that are grounded on informational
externalities (Hausmann and Rodrik, 2003), i.e., to subsidise search costs for
innovative investors and phase them out once the business model has proven its
viability, are now widely accepted. The much more controversial issue are long-term
strategic interventions that are justified on the grounds of coordination failures and
assumed dynamic scale economies. To successfully build a globally competitive
biotechnology industry or an aerospace industry would have been unthinkable without
anticipatory and coordinated public support for a range of complementary activities.
Betting on the success of an entirely new industry and sustaining it throughout its
infancy, however, is obviously very risky. The risk can be mitigated by close
surveillance of trends and performance, together with flexibility and courage to modify
and change policies along the way.
Singapore has adapted its policies to meet the needs of international investors and
has proved able to retain their presence in the economy to generate employment and
income. Trade and investment with active participation in GVCs will remain the key
pillars to sustain Singapore’s economy for a long time to come.
42
References
Backer, K.D., and S. Miroudot (2013), ‘Mapping Global Value Chains’, OECD Trade
Policy Papers, No. 159, OECD Publishing. Available at http://www.oecd-
ilibrary.org/trade/mapping-global-value-chains_5k3v1trgnbr4-en (accessed on
20 August 2014).
Banga, R. (2013), ‘Measuring Value in Global Value Chains’, UNCTAD, Regional
Value Chain Background Paper No. RVC-8.
Best, M.H. (1999), ‘Cluster Dynamics in Theory and Practice: Singapore/Johor and
Penang Electronics’, mimeo, Center for Industrial Competitiveness, University
of Massachusetts Lowell.
Chandra, V., and S. Kolavalli (2006), ‘Technology, Adaptation, and Exports: How
Some Countries Got It Right’, in Chandra, V. (ed.), Technology, Adaptation,
and Exports: How Some Countries Got It Right. Washington DC: World Bank.
Cortright, J. (2006), ‘Making Sense of Clusters: Regional Competitiveness and
Economic Development’, Brookings Research. USA.
Daudin, G., C. Rifflart, and D. Schweisguth (2011), ‘Who Produces for Whom in the
World Economy?’, Canadian Journal of Economics 44(4), pp.1403–1437.
Dunning, J. (1992), ‘The competitive advantage of Countries and the Activities of
Transnational Corporations’, Transnational Corporation, 1(1), pp. 135–168.
Geneva, Switzerland: United Nations Publications.
Fujita, M., P. Krugman, and A. Venables (1999), The Spatial Economy: Cities, Region
and International Trade, MIT Press, USA.
Glaeser, E.L. (1992), ‘Growth in Cities’, Journal of Political Economy, 100, pp. 1126–
52.
Goh Keng Swee (1977), The Practice of Economic Growth. Singapore: Federal
Publication.
Grossman, G. (2010), ‘Panel Discussion at World Bank Workshop on: Fragmentation
of Global Production and Trade in Value Added’, Washington DC: World
Bank. http://bit.ly/1o4IBzb
Hausmann, R., and D. Rodrik (2003), ‘Economic Development as Self-Discovery’,
Journal of Development Economics, 72, pp.603–33.
Hirschman, A.O. (1958), The Strategy of Economic Development. Yale University
Press, USA.
Hummels, D., J. Ishii, and K.-M. Yi (2001), ‘The Nature and Growth of Vertical
Specialization in World Trade’, Journal of International Economics 54(1),
pp.75–96.
Johnson, R.C., and G. Noguera (2012), ‘Accounting for Intermediates: Production
Sharing and Trade in Value Added’, Journal of International Economics 86(2),
pp.224–236.
43
Kaplinsky, R. (2000), ‘Globalization and Unequalisation: What Can Be Learned from
Value Chain Analysis?’, Journal of Development Studies, 37(2), pp.117–146.
Koopman, R., Z. Wang, and S.-J. Wei (2012), ‘Estimating Domestic Content in
Exports when Processing Trade is Pervasive’, Journal of Development
Economics 99(1), pp.178– 89.
Kotler, P., S. Jatusripitak, and S. Maesincee (1997), The Marketing of Nations: A
Strategic Approach to Building National Wealth, New York: The Free Press.
Krugman, P. (1991), Geography and Trade, MIT Press.
Krugman, P. (1995), Development, Geography and Economic Theory, MIT Press.
Kummritz, V. (2014), ‘Global Value Chains: Benefitting the Domestic Economy?’,
Working paper CTEI-2014-05, Geneva: Centre for Trade and Economic
Integration, Graduate Institute.
Leontief, W.W. (1951), ‘Input-Output Economics,’ Scientific American, October
issue, pp.15–21.
Ministry of Trade and Industry (2014), ‘Rising Contribution of Services Exports to the
Singapore Economy’, Economic Survey of Singapore, 2nd Quarter 2014.
Nadim Ahmad (2013), ‘Measuring Trade in Value Added and Beyond’, paper
presented at the Conference on Measuring the Effects of Globalization,
Washington DC. Available at:
http://www.upjohn.org/MEG/papers/Ahmad_Trade_in_VA.pdf (accessed on
20 August 2014).
OECD (2013), Measuring Trade in Value Added: An OECD-WTO Joint Initiative.
Available at: http://www.oecd.org/sti/ind/measuringtradeinvalue-
addedanoecd-wtojointinitiative.htm.
OECD and WTO (2013), ‘OECD-WTO Database on Trade in Value-Added First
Estimates: 16 January 2013’, Paris: Organisation for Economic Co-operation
and Development and World Trade Organization.
Porter, M.E. (1985), Competitive Advantage. New York: The Free Press.
Porter, M.E. (1990), The Competitive Advantage of Nations, New York: The Free
Press.
Singapore Economic Development Board (1988), Global Strategies - The Singapore
Partnership (Conference Proceedings, 24–26October).
Tukker, A., and E. Dietzenbacher (2013), ‘Global Multiregional Input-output
Frameworks: An Introduction and Outlook’, Economic Systems Research,
25(1), pp.1–19.
Toh M.H., and L. Low (1993), Regional Cooperation and Growth Triangles in
ASEAN, Singapore: Times Academic Press.
Toh M.H., and S.M. Thangavelu (2008), ‘The Biomedical Science (BMS) Industry in
Singapore: Can it plug into the Global Value Chain?’, Chapter 6, pp. 158–195,
in Kuroiwa I. and M.H. Toh (eds.) Production Networks and Industrial
Clusters: Integrating Economies in Southeast Asia. Singapore: Institute of
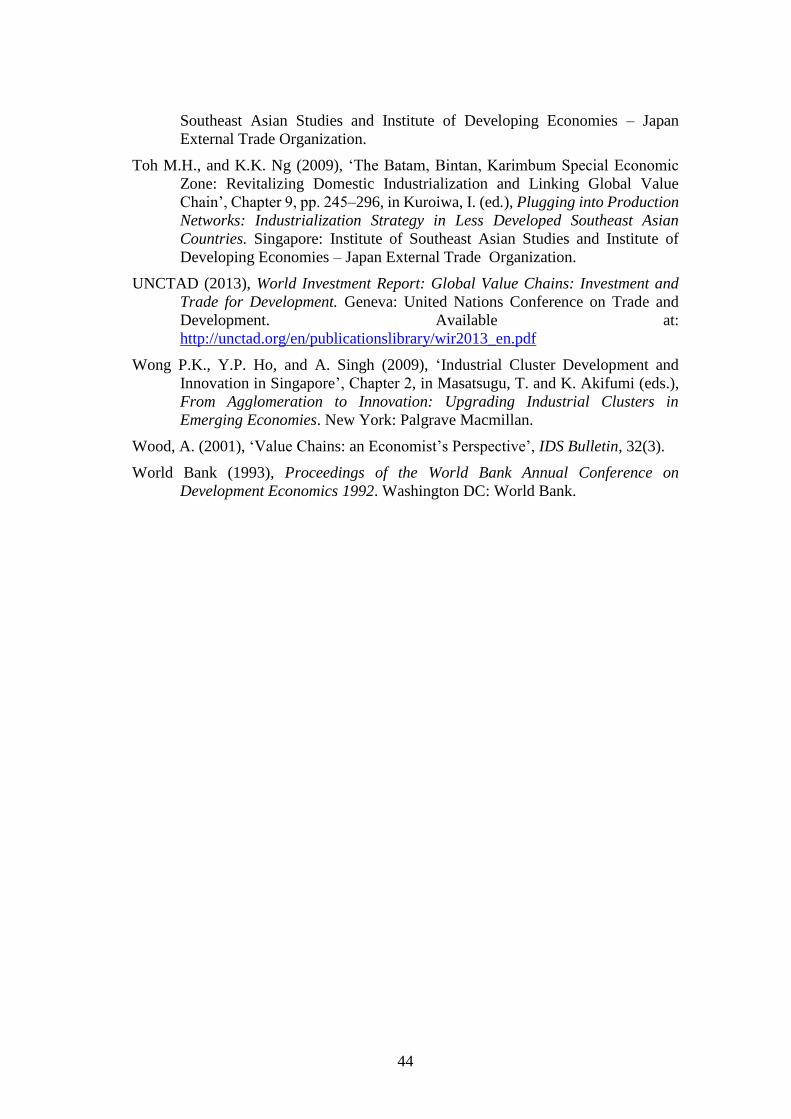
44
Southeast Asian Studies and Institute of Developing Economies – Japan
External Trade Organization.
Toh M.H., and K.K. Ng (2009), ‘The Batam, Bintan, Karimbum Special Economic
Zone: Revitalizing Domestic Industrialization and Linking Global Value
Chain’, Chapter 9, pp. 245–296, in Kuroiwa, I. (ed.), Plugging into Production
Networks: Industrialization Strategy in Less Developed Southeast Asian
Countries. Singapore: Institute of Southeast Asian Studies and Institute of
Developing Economies – Japan External Trade Organization.
UNCTAD (2013), World Investment Report: Global Value Chains: Investment and
Trade for Development. Geneva: United Nations Conference on Trade and
Development. Available at:
http://unctad.org/en/publicationslibrary/wir2013_en.pdf
Wong P.K., Y.P. Ho, and A. Singh (2009), ‘Industrial Cluster Development and
Innovation in Singapore’, Chapter 2, in Masatsugu, T. and K. Akifumi (eds.),
From Agglomeration to Innovation: Upgrading Industrial Clusters in
Emerging Economies. New York: Palgrave Macmillan.
Wood, A. (2001), ‘Value Chains: an Economist’s Perspective’, IDS Bulletin, 32(3).
World Bank (1993), Proceedings of the World Bank Annual Conference on
Development Economics 1992. Washington DC: World Bank.
45
APPENDIX A
Table A1: Economic Statistics – Singapore
1960
1960-
70
1970-
80
1980-
90
1990-
2000
2000-
13
GDP at Constant 2005 Prices as at end of
Period (S$ million) 6,863 16,567 39,229 82,659 165,245 324,592
Average Growth p.a. (%) 9.3 9.0 7.8 7.2 5.2
Manufacturing (%) 13.8 11.1 7.3 7.5 5.2
Construction (%) 16.7 6.4 5.3 10.8 2.6
Services (%) 7.6 8.5 7.9 7.5 5.4
Share in GDP (at end of period)
Manufacturing (%) 15.2 22.8 27.4 26.3 25.7 25.6
Construction (%) 4.3 8.2 6.2 4.3 5.6 4.1
Services (%) 80.5 69.0 66.3 69.3 68.6 66.2
Aggregate Demand
Average Growth per annum (%)
Private Consumption Expenditure 6.4 7.1 6.1 6.7 5.1
Government Consumption Expenditure 14.4 7.3 7.0 9.3 5.7
Gross Fixed Capital Formation 23.3 11.0 6.2 9.0 4.9
Exports of Goods & Services 8.5 14.4 9.5 10.7 7.7
Imports of Goods & Services 9.2 13.1 8.8 10.8 8.2
Share in GDP (at end of period)
Private Consumption Expenditure 57.6 52.2 48.9 45.4 42.2 38.4
Government Consumption Expenditure (%) 5.3 9.8 9.3 9.2 10.8 10.3
Gross Fixed Capital Formation (%) 36.1 41.7 40.8 33.6 33.3 23.1
Exports of Goods & Services (%) 63.7 65.6 116.7 146.1 195.6 191.5
Imports of Goods & Services (%) 66.7 73.4 115.7 136.6 182.0 168.4
Population (million) 1.6 2.1 2.4 3.0 4.0 5.4
Unemployment Rate (%) 9.5 4.5 3.5 1.8 2.1 2.0
Share of Indigenous GDP in Total GDP (%) na 81.8 70.8 69.5 63.3 55.9
Share of Foreign Workers in Total
Employment (%) na na 12.3 17.9 29.4 35.7
Merchandise Export (S$ million) 2,000 4,756 41,452 95,206 237,826 513,391
Domestic Export (S$ million) na na 24,015 59,296 130,166 274,192
Current Account Balance as % of GDP (%) na na -13.4 8.5 11.6 18.4
Source: Yearbook of Statistics, Singapore Department of Statistics.
46
ERIA Discussion Paper Series
No. Author(s) Title Year
2015-50 Mun-Heng TOH Singapore’s Participation in Global Value Chains:
Perspectives of Trade in Value-Added
July
2015
2015-49 Ben SHPEHERD
Developing Domestic and Export Markets and
Levelling Up Trade in Value-Added: Lessons
Learnt
July
2015
2015-48 Siwage Dharma
NEGARA
How Labour Market Policies Affect Innovation and
Trade Competitiveness
July
2015
2015-47
Hank LIM, Bernard
AW, LOKE Hoe
Yeong
AEC Scorecard Phase IV: Furthering the
Implementation of the AEC Blueprint Measures
The Singapore Country Report
June
2015
2015-46
Saowaruj
RATTANAKHAMFU
Sumet
ONGKITTIKUL
Nutthawut
LAKSANAPUNYAK
UL
Nichamon
THONGPAT
Natcha O-CHAROEN
Thailand Country Study
ASEAN Economic Community
Blueprint Mid-term Review Project
June
2015
2015-45 Koji KUBO Evolving Informal Remittance Methods of
Myanmar Migrant Workers in Thailand
June
2015
2015-44 Philippa DEE Monitoring the Implementation of Services Trade
Reform towards an ASEAN Economic Community
May
2015
2015-43 Shandre
THANGAVELU
FDI Restrictiveness Index for ASEAN:
Implementation of AEC Blueprint Measures
May
2015
47
No. Author(s) Title Year
2015-42
Rully PRASSETYA
and Ponciano S.
INTAL, Jr.
AEC Blueprint Implementation Performance and
Challenges: Standards and Conformance
May
2015
2015-41 Ponciano INTAL Jr. AEC Blueprint Implementation Performance and
Challenges: Trade Facilitation
May
2015
2015-40
Fukunari KIMURA,
Tomohiro
MACHIKITA, and
Yasushi UEKI
Technology Transfer in ASEAN Countries: Some
Evidence from Buyer-Provided Training Network
Data
May
2015
2015-39 Dionisius NARJOKO AEC Blueprint Implementation Performance and
Challenges: Services Liberalization
May
2015
2015-38
Kazunobu
HAYAKAWA,
Nuttawut
LAKSANAPANYAK
UL, Shujiro URATA
Measuring the Costs of FTA Utilization: Evidence
from Transaction-level Import Data of Thailand
May
2015
2015-37
Kazunobu
HAYAKAWA,
Nuttawut
LAKSANAPANYAK
UL, Pisit PUAPAN,
Sastra SUDSAWASD
Government Strategy and Support for Regional
Trade Agreements: The Case of Thailand
May
2015
2015-36 Dionisius A.
NARJOKO
AEC Blueprint Implementation Performance and
Challenges: Non-Tariff Measures and Non-Tariff
Barriers
May
2015
2015-35
Kazunobu
HAYAKAWA,
Tadashi ITO, and
Fukunari KIMURA
Trade Creation Effects of Regional Trade
Agreements: Tariff Reduction versus Non-tariff
Barrier Removal
Apr
2015
2015-34
Kazunobu
HAYAKAWA,
Tadashi ITO
Tarrif Pass-through of the World-wide Trade:
Empirical Evidence at Tarriff-line Level
Apr
2015
2015-33
Kazubobu
HAYAKAWA,
Nuttawut
LAKSANAPNYAKU
Firm-level Impact of Free Trade Agreements on
Import Prices
Apr
2015
48
No. Author(s) Title Year
L, and Shujiro
URATA
2015-32 Ponciano INTAL, Jr. AEC Blueprint Implementation Performance and
Challenges: Investment Liberalization
Apr
2015
2015-31 Emily Christi A.
CABEGIN
The Challenge of China and the Role of Deepening
ASEAN Integration for the Philippine
Semiconductor Industry
Apr
2015
2015-30
Venkatachalam
ANBUMOZHI, Alex
BOWEN and
Puthusserikunnel
Devasia JOSE
Market-Based Mechanisms to Promote Renewable
Energy in Asia
Apr
2015
2015-29 Venkatachalam
ANBUMOZHI
Low Carbon Green Growth in Asia: What is the
Scope for Regional Cooperation?
Apr
2015
2015-28 Tan LI and Larry D.
QIU
Beyond Trade Creation: Free Trade Agreements
and Trade Disputes
Mar
2015
2015-27 Mai Anh NGO Exporting and Firm-Level Credit Constraints –
Evidence from Ghana
Mar
2015
2015-26
Sunghoon CHUNG,
Joonhyung LEE,
Thomas OSANG
Did China Tire Safeguard Save U.S. Workers? Mar
2015
2015-25
Esther Ann BØLER,
Beata JAVORCIK,
Karen Helene
ULLTVEI-MOE
Globalization: A Woman’s Best Friend? Exporters
and the Gender Wage Gap
Mar
2015
2015-24 Tristan Leo Dallo
AGUSTIN and Martin
SCHRÖDER
The Indian Automotive Industry and the ASEAN
Supply Chain Relations
Mar
2015
2015-23 Hideo KOBAYASHI
and Yingshan JIN The CLMV Automobile and Auto Parts Industry
Mar
2015
2015-22 Hideo KOBAYASHI
Current State and Issues of the Automobile and Auto
Parts Industries in ASEAN Mar
49
No. Author(s) Title Year
2015
2015-21 Yoshifumi
FUKUNAGA
Assessing the Progress of ASEAN MRAs on
Professional Services
Mar
2015
2015-20 Yoshifumi
FUKUNAGA and
Hikari ISHIDO
Values and Limitations of the ASEAN Agreement
on the Movement of Natural Persons
Mar
2015
2015-19 Nanda NURRIDZKI Learning from the ASEAN + 1 Model and the ACIA
Mar
2015
2015-18
Patarapong
INTARAKUMNERD
and Pun-Arj
CHAIRATANA and
Preeda
CHAYANAJIT
Global Production Networks and Host-Site
Industrial Upgrading: The Case of the
Semiconductor Industry in Thailand
Feb
2015
2015-17 Rajah RASIAH and
Yap Xiao SHAN
Institutional Support, Regional Trade Linkages and
Technological Capabilities in the Semiconductor
Industry in Singapore
Feb
2015
2015-16 Rajah RASIAH and
Yap Xiao SHAN
Institutional Support, Regional Trade Linkages and
Technological Capabilities in the Semiconductor
Industry in Malaysia
Feb
2015
2015-15 Xin Xin KONG, Miao
ZHANG and Santha
Chenayah RAMU
China’s Semiconductor Industry in Global Value
Chains
Feb
2015
2015-14 Tin Htoo NAING and
Yap Su FEI
Multinationals, Technology and Regional Linkages
in Myanmar’s Clothing Industry
Feb
2015
2015-13 Vanthana NOLINTHA
and Idris JAJRI
The Garment Industry in Laos: Technological
Capabilities, Global Production Chains and
Competitiveness
Feb
2015
2015-12 Miao ZHANG, Xin
Xin KONG, Santha
Chenayah RAMU
The Transformation of the Clothing Industry in
China
Feb
2015
2015-11
NGUYEN Dinh Chuc,
NGUYEN Ngoc Anh,
NGUYEN Ha Trang
and NGUYEN Ngoc
Minh
Host-site institutions, Regional Production Linkages and Technological Upgrading: A study of Automotive Firms in Vietnam
Feb
2015
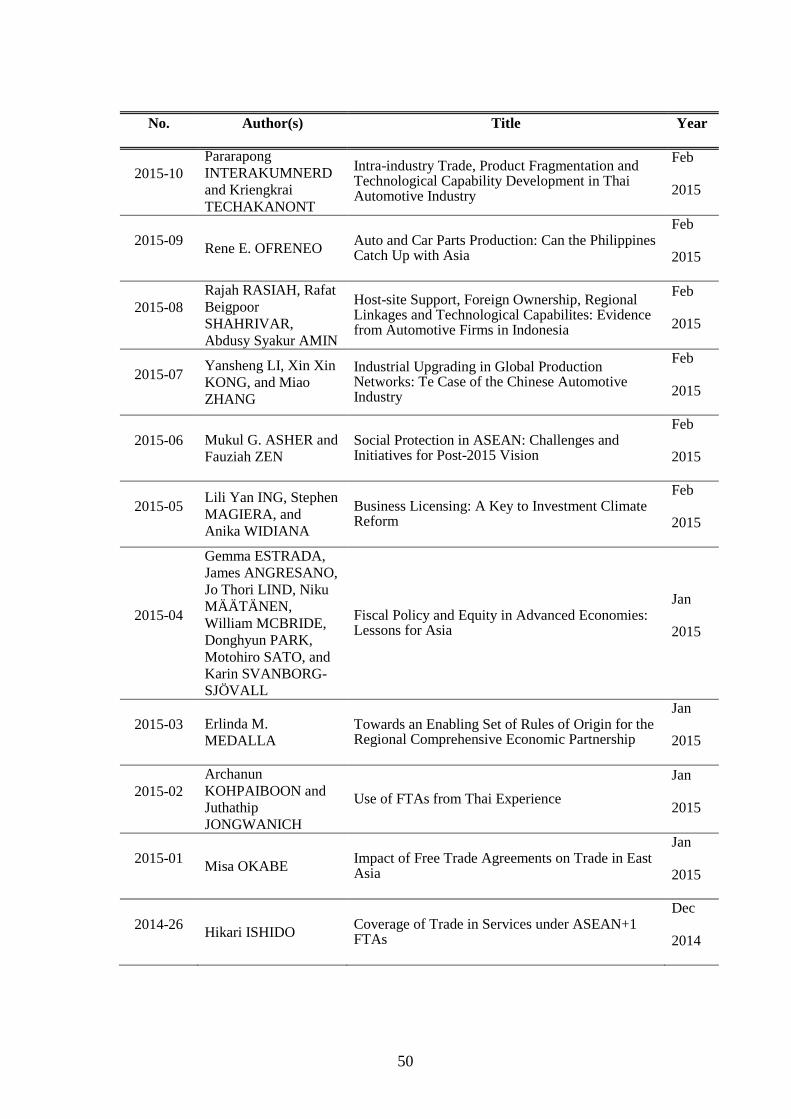
50
No. Author(s) Title Year
2015-10
Pararapong
INTERAKUMNERD
and Kriengkrai
TECHAKANONT
Intra-industry Trade, Product Fragmentation and Technological Capability Development in Thai Automotive Industry
Feb
2015
2015-09 Rene E. OFRENEO
Auto and Car Parts Production: Can the Philippines Catch Up with Asia
Feb
2015
2015-08
Rajah RASIAH, Rafat
Beigpoor
SHAHRIVAR,
Abdusy Syakur AMIN
Host-site Support, Foreign Ownership, Regional Linkages and Technological Capabilites: Evidence from Automotive Firms in Indonesia
Feb
2015
2015-07 Yansheng LI, Xin Xin
KONG, and Miao
ZHANG
Industrial Upgrading in Global Production Networks: Te Case of the Chinese Automotive Industry
Feb
2015
2015-06 Mukul G. ASHER and
Fauziah ZEN Social Protection in ASEAN: Challenges and Initiatives for Post-2015 Vision
Feb
2015
2015-05 Lili Yan ING, Stephen
MAGIERA, and
Anika WIDIANA
Business Licensing: A Key to Investment Climate Reform
Feb
2015
2015-04
Gemma ESTRADA,
James ANGRESANO,
Jo Thori LIND, Niku
MÄÄTÄNEN,
William MCBRIDE,
Donghyun PARK,
Motohiro SATO, and
Karin SVANBORG-
SJÖVALL
Fiscal Policy and Equity in Advanced Economies: Lessons for Asia
Jan
2015
2015-03 Erlinda M.
MEDALLA Towards an Enabling Set of Rules of Origin for the Regional Comprehensive Economic Partnership
Jan
2015
2015-02
Archanun
KOHPAIBOON and
Juthathip
JONGWANICH
Use of FTAs from Thai Experience
Jan
2015
2015-01 Misa OKABE
Impact of Free Trade Agreements on Trade in East Asia
Jan
2015
2014-26 Hikari ISHIDO
Coverage of Trade in Services under ASEAN+1 FTAs
Dec
2014
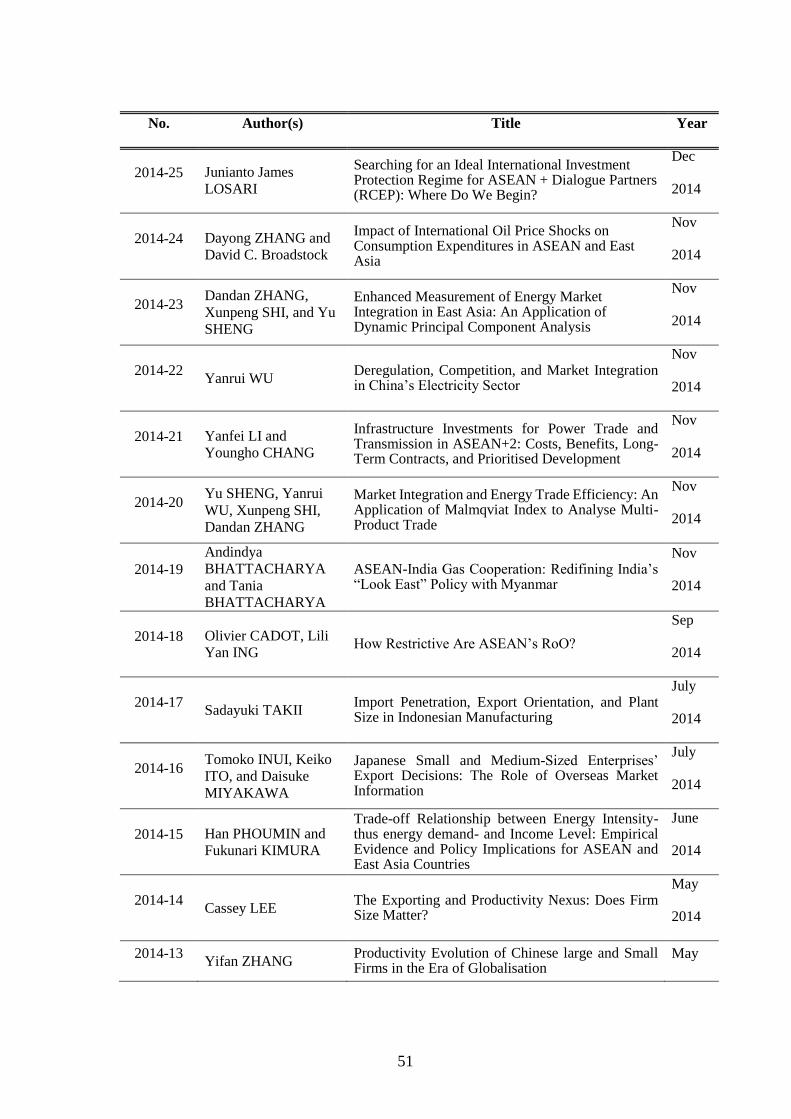
51
No. Author(s) Title Year
2014-25 Junianto James
LOSARI
Searching for an Ideal International Investment Protection Regime for ASEAN + Dialogue Partners (RCEP): Where Do We Begin?
Dec
2014
2014-24 Dayong ZHANG and
David C. Broadstock
Impact of International Oil Price Shocks on Consumption Expenditures in ASEAN and East Asia
Nov
2014
2014-23 Dandan ZHANG,
Xunpeng SHI, and Yu
SHENG
Enhanced Measurement of Energy Market Integration in East Asia: An Application of Dynamic Principal Component Analysis
Nov
2014
2014-22 Yanrui WU
Deregulation, Competition, and Market Integration in China’s Electricity Sector
Nov
2014
2014-21 Yanfei LI and
Youngho CHANG
Infrastructure Investments for Power Trade and Transmission in ASEAN+2: Costs, Benefits, Long-Term Contracts, and Prioritised Development
Nov
2014
2014-20 Yu SHENG, Yanrui
WU, Xunpeng SHI,
Dandan ZHANG
Market Integration and Energy Trade Efficiency: An Application of Malmqviat Index to Analyse Multi-Product Trade
Nov
2014
2014-19
Andindya
BHATTACHARYA
and Tania
BHATTACHARYA
ASEAN-India Gas Cooperation: Redifining India’s “Look East” Policy with Myanmar
Nov
2014
2014-18 Olivier CADOT, Lili
Yan ING How Restrictive Are ASEAN’s RoO?
Sep
2014
2014-17 Sadayuki TAKII
Import Penetration, Export Orientation, and Plant Size in Indonesian Manufacturing
July
2014
2014-16 Tomoko INUI, Keiko
ITO, and Daisuke
MIYAKAWA
Japanese Small and Medium-Sized Enterprises’ Export Decisions: The Role of Overseas Market Information
July
2014
2014-15 Han PHOUMIN and
Fukunari KIMURA
Trade-off Relationship between Energy Intensity-thus energy demand- and Income Level: Empirical Evidence and Policy Implications for ASEAN and East Asia Countries
June
2014
2014-14 Cassey LEE
The Exporting and Productivity Nexus: Does Firm Size Matter?
May
2014
2014-13 Yifan ZHANG
Productivity Evolution of Chinese large and Small Firms in the Era of Globalisation
May
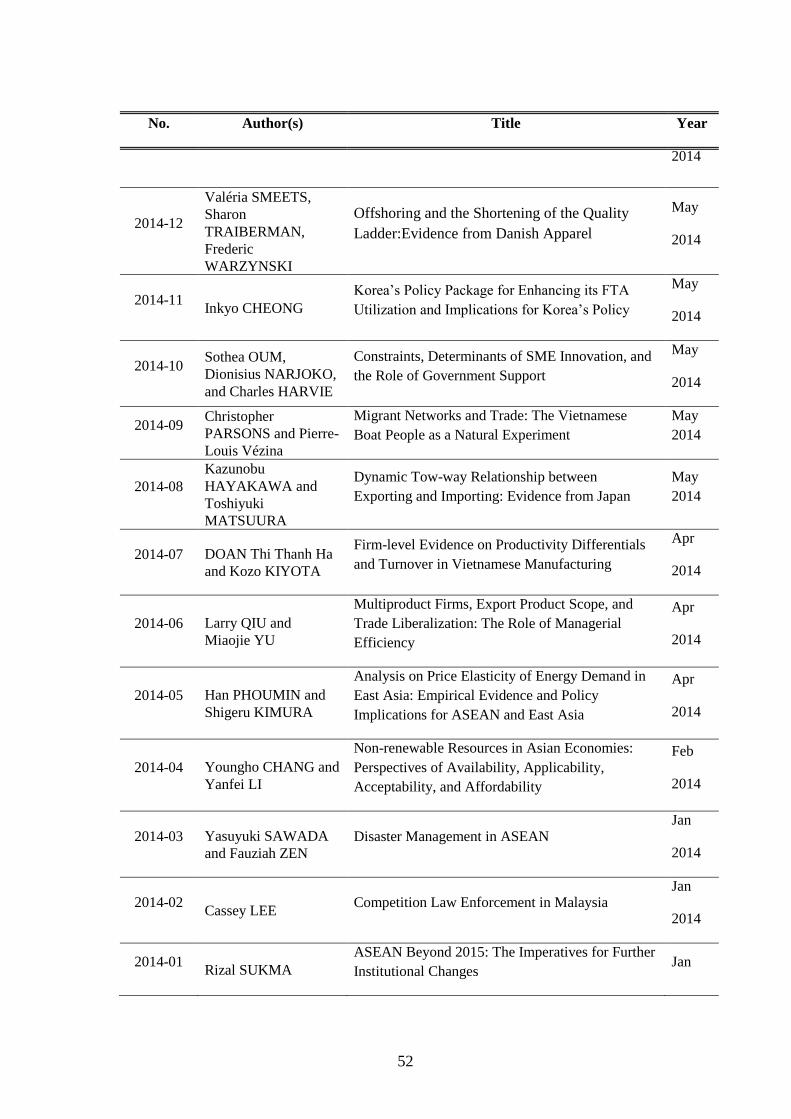
52
No. Author(s) Title Year
2014
2014-12
Valéria SMEETS,
Sharon
TRAIBERMAN,
Frederic
WARZYNSKI
Offshoring and the Shortening of the Quality
Ladder:Evidence from Danish Apparel
May
2014
2014-11 Inkyo CHEONG
Korea’s Policy Package for Enhancing its FTA
Utilization and Implications for Korea’s Policy
May
2014
2014-10 Sothea OUM,
Dionisius NARJOKO,
and Charles HARVIE
Constraints, Determinants of SME Innovation, and
the Role of Government Support
May
2014
2014-09 Christopher
PARSONS and Pierre-
Louis Vézina
Migrant Networks and Trade: The Vietnamese
Boat People as a Natural Experiment
May
2014
2014-08
Kazunobu
HAYAKAWA and
Toshiyuki
MATSUURA
Dynamic Tow-way Relationship between
Exporting and Importing: Evidence from Japan
May
2014
2014-07 DOAN Thi Thanh Ha
and Kozo KIYOTA
Firm-level Evidence on Productivity Differentials
and Turnover in Vietnamese Manufacturing
Apr
2014
2014-06 Larry QIU and
Miaojie YU
Multiproduct Firms, Export Product Scope, and
Trade Liberalization: The Role of Managerial
Efficiency
Apr
2014
2014-05 Han PHOUMIN and
Shigeru KIMURA
Analysis on Price Elasticity of Energy Demand in
East Asia: Empirical Evidence and Policy
Implications for ASEAN and East Asia
Apr
2014
2014-04 Youngho CHANG and
Yanfei LI
Non-renewable Resources in Asian Economies:
Perspectives of Availability, Applicability,
Acceptability, and Affordability
Feb
2014
2014-03 Yasuyuki SAWADA
and Fauziah ZEN
Disaster Management in ASEAN Jan
2014
2014-02 Cassey LEE
Competition Law Enforcement in Malaysia Jan
2014
2014-01 Rizal SUKMA
ASEAN Beyond 2015: The Imperatives for Further
Institutional Changes Jan
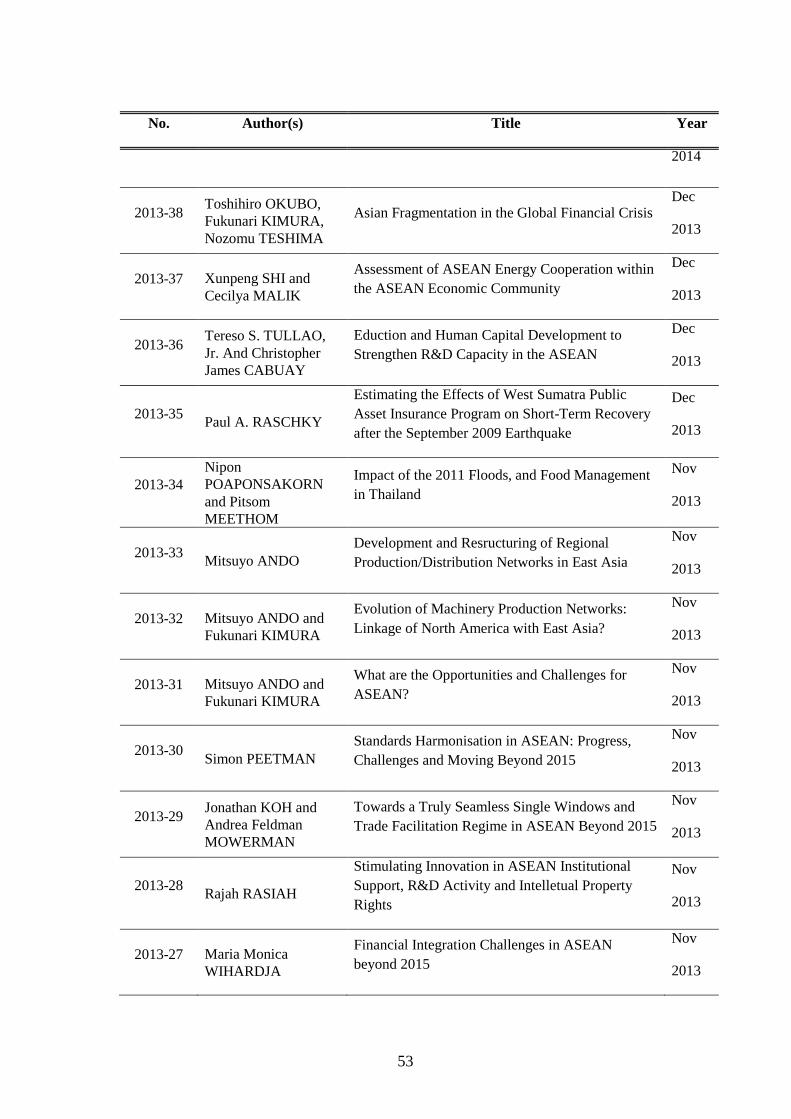
53
No. Author(s) Title Year
2014
2013-38 Toshihiro OKUBO,
Fukunari KIMURA,
Nozomu TESHIMA
Asian Fragmentation in the Global Financial Crisis Dec
2013
2013-37 Xunpeng SHI and
Cecilya MALIK
Assessment of ASEAN Energy Cooperation within
the ASEAN Economic Community
Dec
2013
2013-36 Tereso S. TULLAO,
Jr. And Christopher
James CABUAY
Eduction and Human Capital Development to
Strengthen R&D Capacity in the ASEAN
Dec
2013
2013-35 Paul A. RASCHKY
Estimating the Effects of West Sumatra Public
Asset Insurance Program on Short-Term Recovery
after the September 2009 Earthquake
Dec
2013
2013-34
Nipon
POAPONSAKORN
and Pitsom
MEETHOM
Impact of the 2011 Floods, and Food Management
in Thailand
Nov
2013
2013-33 Mitsuyo ANDO
Development and Resructuring of Regional
Production/Distribution Networks in East Asia
Nov
2013
2013-32 Mitsuyo ANDO and
Fukunari KIMURA
Evolution of Machinery Production Networks:
Linkage of North America with East Asia?
Nov
2013
2013-31 Mitsuyo ANDO and
Fukunari KIMURA
What are the Opportunities and Challenges for
ASEAN?
Nov
2013
2013-30 Simon PEETMAN
Standards Harmonisation in ASEAN: Progress,
Challenges and Moving Beyond 2015
Nov
2013
2013-29 Jonathan KOH and
Andrea Feldman
MOWERMAN
Towards a Truly Seamless Single Windows and
Trade Facilitation Regime in ASEAN Beyond 2015
Nov
2013
2013-28 Rajah RASIAH
Stimulating Innovation in ASEAN Institutional
Support, R&D Activity and Intelletual Property
Rights
Nov
2013
2013-27 Maria Monica
WIHARDJA
Financial Integration Challenges in ASEAN
beyond 2015
Nov
2013
54
No. Author(s) Title Year
2013-26 Tomohiro MACHIKIT
A and Yasushi UEKI
Who Disseminates Technology to Whom, How,
and Why: Evidence from Buyer-Seller Business
Networks
Nov
2013
2013-25 Fukunari KIMURA
Reconstructing the Concept of “Single Market a
Production Base” for ASEAN beyond 2015
Oct
2013
2013-24
Olivier CADOT
Ernawati MUNADI
Lili Yan ING
Streamlining NTMs in ASEAN:
The Way Forward
Oct
2013
2013-23
Charles HARVIE,
Dionisius NARJOKO,
Sothea OUM
Small and Medium Enterprises’ Access to Finance:
Evidence from Selected Asian Economies
Oct
2013
2013-22 Alan Khee-Jin TAN Toward a Single Aviation Market in ASEAN:
Regulatory Reform and Industry Challenges
Oct
2013
2013-21
Hisanobu SHISHIDO,
Shintaro SUGIYAMA,
Fauziah ZEN
Moving MPAC Forward: Strengthening Public-
Private Partnership, Improving Project Portfolio
and in Search of Practical Financing Schemes
Oct
2013
2013-20
Barry DESKER, Mely
CABALLERO-
ANTHONY, Paul
TENG
Thought/Issues Paper on ASEAN Food Security:
Towards a more Comprehensive Framework
Oct
2013
2013-19
Toshihiro KUDO,
Satoru KUMAGAI, So
UMEZAKI
Making Myanmar the Star Growth Performer in
ASEAN in the Next Decade: A Proposal of Five
Growth Strategies
Sep
2013
2013-18 Ruperto MAJUCA
Managing Economic Shocks and Macroeconomic
Coordination in an Integrated Region: ASEAN
Beyond 2015
Sep
2013
2013-17
Cassy LEE and
Yoshifumi
FUKUNAGA
Competition Policy Challenges of Single Market
and Production Base
Sep
2013
2013-16 Simon TAY Growing an ASEAN Voice? : A Common Platform
in Global and Regional Governance Sep
55
No. Author(s) Title Year
2013
2013-15
Danilo C. ISRAEL
and Roehlano M.
BRIONES
Impacts of Natural Disasters on Agriculture, Food
Security, and Natural Resources and Environment
in the Philippines
Aug
2013
2013-14 Allen Yu-Hung LAI
and Seck L. TAN
Impact of Disasters and Disaster Risk Management
in Singapore: A Case Study of Singapore’s
Experience in Fighting the SARS Epidemic
Aug
2013
2013-13 Brent LAYTON Impact of Natural Disasters on Production
Networks and Urbanization in New Zealand
Aug
2013
2013-12 Mitsuyo ANDO
Impact of Recent Crises and Disasters on Regional
Production/Distribution Networks and Trade in
Japan
Aug
2013
2013-11 Le Dang TRUNG Economic and Welfare Impacts of Disasters in East
Asia and Policy Responses: The Case of Vietnam
Aug
2013
2013-10
Sann VATHANA,
Sothea OUM, Ponhrith
KAN, Colas
CHERVIER
Impact of Disasters and Role of Social Protection
in Natural Disaster Risk Management in Cambodia
Aug
2013
2013-09
Sommarat
CHANTARAT, Krirk
PANNANGPETCH,
Nattapong
PUTTANAPONG,
Preesan RAKWATIN,
and Thanasin
TANOMPONGPHAN
DH
Index-Based Risk Financing and Development of
Natural Disaster Insurance Programs in Developing
Asian Countries
Aug
2013
2013-08 Ikumo ISONO and
Satoru KUMAGAI
Long-run Economic Impacts of Thai Flooding:
Geographical Simulation Analysis
July
2013
2013-07
Yoshifumi
FUKUNAGA and
Hikaru ISHIDO
Assessing the Progress of Services Liberalization in
the ASEAN-China Free Trade Area (ACFTA)
May
2013
56
No. Author(s) Title Year
2013-06
Ken ITAKURA,
Yoshifumi
FUKUNAGA, and
Ikumo ISONO
A CGE Study of Economic Impact of Accession of
Hong Kong to ASEAN-China Free Trade
Agreement
May
2013
2013-05 Misa OKABE and
Shujiro URATA The Impact of AFTA on Intra-AFTA Trade
May
2013
2013-04 Kohei SHIINO How Far Will Hong Kong’s Accession to ACFTA
will Impact on Trade in Goods?
May
2013
2013-03
Cassey LEE and
Yoshifumi
FUKUNAGA
ASEAN Regional Cooperation on Competition
Policy
Apr
2013
2013-02
Yoshifumi
FUKUNAGA and
Ikumo ISONO
Taking ASEAN+1 FTAs towards the RCEP:
A Mapping Study
Jan
2013
2013-01 Ken ITAKURA
Impact of Liberalization and Improved
Connectivity and Facilitation in ASEAN for the
ASEAN Economic Community
Jan
2013
2012-17
Sun XUEGONG, Guo
LIYAN, Zeng
ZHENG
Market Entry Barriers for FDI and Private
Investors: Lessons from China’s Electricity Market
Aug
2012
2012-16 Yanrui WU Electricity Market Integration: Global Trends and
Implications for the EAS Region
Aug
2012
2012-15 Youngho CHANG,
Yanfei LI
Power Generation and Cross-border Grid Planning
for the Integrated ASEAN Electricity Market: A
Dynamic Linear Programming Model
Aug
2012
2012-14 Yanrui WU, Xunpeng
SHI
Economic Development, Energy Market
Integration and Energy Demand: Implications for
East Asia
Aug
2012
2012-13
Joshua AIZENMAN,
Minsoo LEE, and
Donghyun PARK
The Relationship between Structural Change and
Inequality: A Conceptual Overview with Special
Reference to Developing Asia
July
2012
57
No. Author(s) Title Year
2012-12
Hyun-Hoon LEE,
Minsoo LEE, and
Donghyun PARK
Growth Policy and Inequality in Developing Asia:
Lessons from Korea
July
2012
2012-11 Cassey LEE Knowledge Flows, Organization and Innovation:
Firm-Level Evidence from Malaysia
June
2012
2012-10
Jacques MAIRESSE,
Pierre MOHNEN,
Yayun ZHAO, and
Feng ZHEN
Globalization, Innovation and Productivity in
Manufacturing Firms: A Study of Four Sectors of
China
June
2012
2012-09 Ari KUNCORO
Globalization and Innovation in Indonesia:
Evidence from Micro-Data on Medium and Large
Manufacturing Establishments
June
2012
2012-08 Alfons
PALANGKARAYA
The Link between Innovation and Export: Evidence
from Australia’s Small and Medium Enterprises
June
2012
2012-07 Chin Hee HAHN and
Chang-Gyun PARK
Direction of Causality in Innovation-Exporting
Linkage: Evidence on Korean Manufacturing
June
2012
2012-06 Keiko ITO Source of Learning-by-Exporting Effects: Does
Exporting Promote Innovation?
June
2012
2012-05 Rafaelita M.
ALDABA
Trade Reforms, Competition, and Innovation in the
Philippines
June
2012
2012-04
Toshiyuki
MATSUURA and
Kazunobu
HAYAKAWA
The Role of Trade Costs in FDI Strategy of
Heterogeneous Firms: Evidence from Japanese
Firm-level Data
June
2012
2012-03
Kazunobu
HAYAKAWA,
Fukunari KIMURA,
and Hyun-Hoon LEE
How Does Country Risk Matter for Foreign Direct
Investment?
Feb
2012
2012-02
Ikumo ISONO, Satoru
KUMAGAI, Fukunari
KIMURA
Agglomeration and Dispersion in China and
ASEAN:
A Geographical Simulation Analysis
Jan
2012
2012-01 Mitsuyo ANDO and
Fukunari KIMURA
How Did the Japanese Exports Respond to Two
Crises in the International Production Network?:
The Global Financial Crisis and the East Japan
Earthquake
Jan
2012
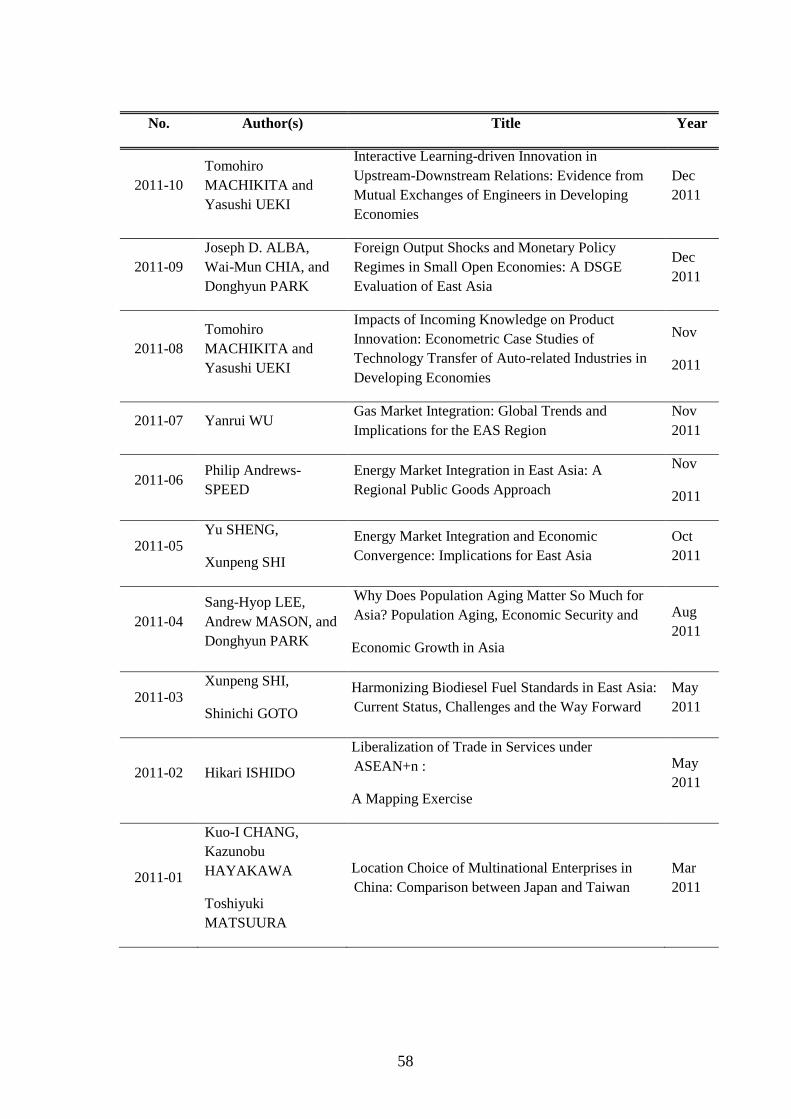
58
No. Author(s) Title Year
2011-10
Tomohiro
MACHIKITA and
Yasushi UEKI
Interactive Learning-driven Innovation in
Upstream-Downstream Relations: Evidence from
Mutual Exchanges of Engineers in Developing
Economies
Dec
2011
2011-09
Joseph D. ALBA,
Wai-Mun CHIA, and
Donghyun PARK
Foreign Output Shocks and Monetary Policy
Regimes in Small Open Economies: A DSGE
Evaluation of East Asia
Dec
2011
2011-08
Tomohiro
MACHIKITA and
Yasushi UEKI
Impacts of Incoming Knowledge on Product
Innovation: Econometric Case Studies of
Technology Transfer of Auto-related Industries in
Developing Economies
Nov
2011
2011-07 Yanrui WU Gas Market Integration: Global Trends and
Implications for the EAS Region
Nov
2011
2011-06 Philip Andrews-
SPEED
Energy Market Integration in East Asia: A
Regional Public Goods Approach
Nov
2011
2011-05 Yu SHENG,
Xunpeng SHI
Energy Market Integration and Economic
Convergence: Implications for East Asia
Oct
2011
2011-04
Sang-Hyop LEE,
Andrew MASON, and
Donghyun PARK
Why Does Population Aging Matter So Much for
Asia? Population Aging, Economic Security and
Economic Growth in Asia
Aug
2011
2011-03 Xunpeng SHI,
Shinichi GOTO
Harmonizing Biodiesel Fuel Standards in East Asia:
Current Status, Challenges and the Way Forward
May
2011
2011-02 Hikari ISHIDO
Liberalization of Trade in Services under
ASEAN+n :
A Mapping Exercise
May
2011
2011-01
Kuo-I CHANG,
Kazunobu
HAYAKAWA
Toshiyuki
MATSUURA
Location Choice of Multinational Enterprises in
China: Comparison between Japan and Taiwan
Mar
2011
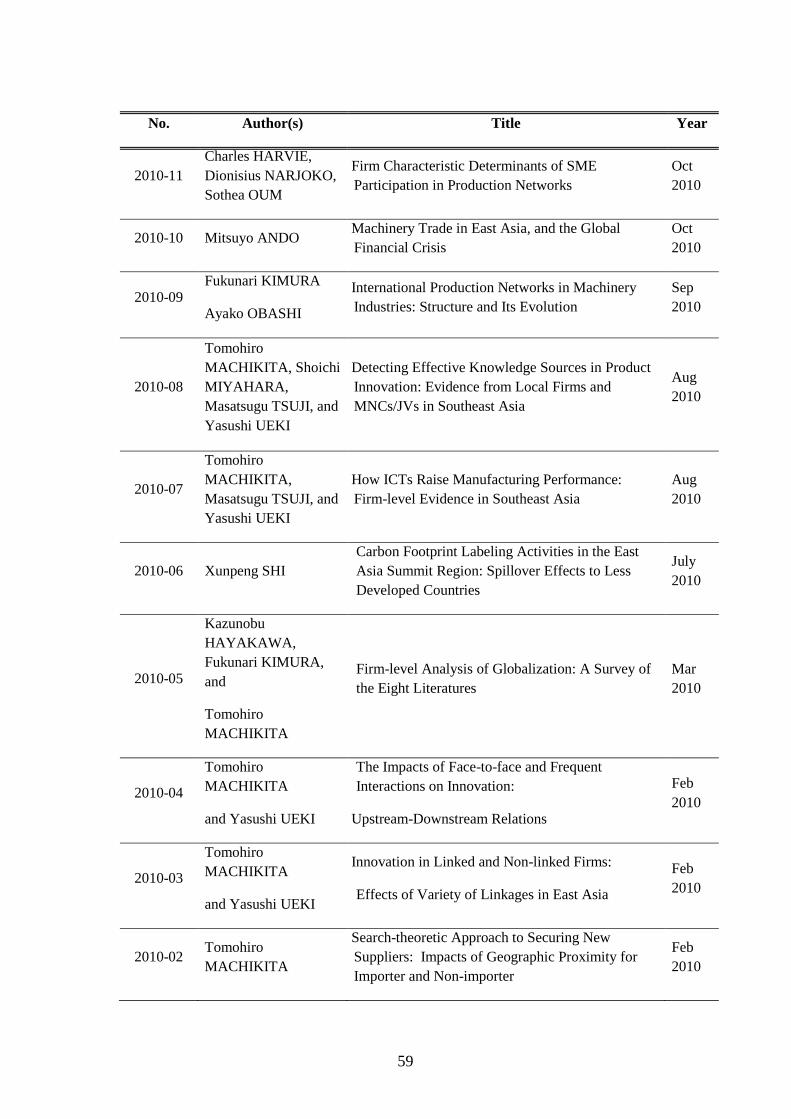
59
No. Author(s) Title Year
2010-11
Charles HARVIE,
Dionisius NARJOKO,
Sothea OUM
Firm Characteristic Determinants of SME
Participation in Production Networks
Oct
2010
2010-10 Mitsuyo ANDO Machinery Trade in East Asia, and the Global
Financial Crisis
Oct
2010
2010-09 Fukunari KIMURA
Ayako OBASHI
International Production Networks in Machinery
Industries: Structure and Its Evolution
Sep
2010
2010-08
Tomohiro
MACHIKITA, Shoichi
MIYAHARA,
Masatsugu TSUJI, and
Yasushi UEKI
Detecting Effective Knowledge Sources in Product
Innovation: Evidence from Local Firms and
MNCs/JVs in Southeast Asia
Aug
2010
2010-07
Tomohiro
MACHIKITA,
Masatsugu TSUJI, and
Yasushi UEKI
How ICTs Raise Manufacturing Performance:
Firm-level Evidence in Southeast Asia
Aug
2010
2010-06 Xunpeng SHI
Carbon Footprint Labeling Activities in the East
Asia Summit Region: Spillover Effects to Less
Developed Countries
July
2010
2010-05
Kazunobu
HAYAKAWA,
Fukunari KIMURA,
and
Tomohiro
MACHIKITA
Firm-level Analysis of Globalization: A Survey of
the Eight Literatures
Mar
2010
2010-04
Tomohiro
MACHIKITA
and Yasushi UEKI
The Impacts of Face-to-face and Frequent
Interactions on Innovation:
Upstream-Downstream Relations
Feb
2010
2010-03
Tomohiro
MACHIKITA
and Yasushi UEKI
Innovation in Linked and Non-linked Firms:
Effects of Variety of Linkages in East Asia
Feb
2010
2010-02 Tomohiro
MACHIKITA
Search-theoretic Approach to Securing New
Suppliers: Impacts of Geographic Proximity for
Importer and Non-importer
Feb
2010
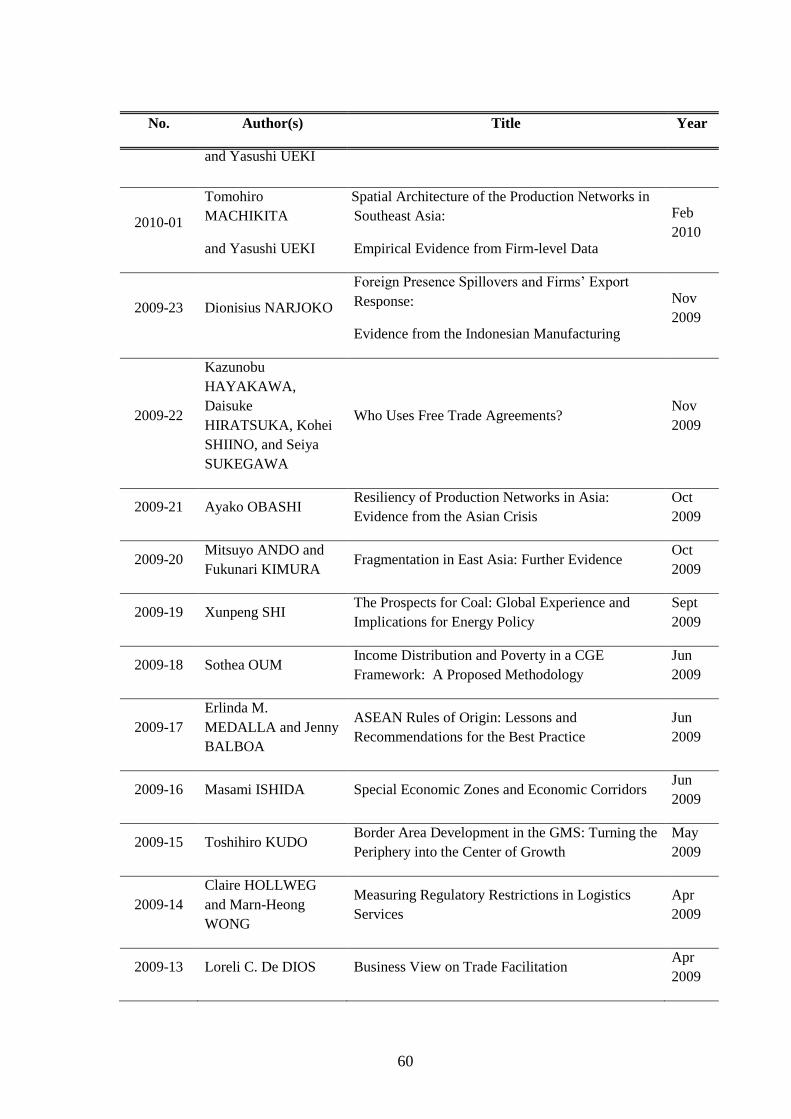
60
No. Author(s) Title Year
and Yasushi UEKI
2010-01
Tomohiro
MACHIKITA
and Yasushi UEKI
Spatial Architecture of the Production Networks in
Southeast Asia:
Empirical Evidence from Firm-level Data
Feb
2010
2009-23 Dionisius NARJOKO
Foreign Presence Spillovers and Firms’ Export
Response:
Evidence from the Indonesian Manufacturing
Nov
2009
2009-22
Kazunobu
HAYAKAWA,
Daisuke
HIRATSUKA, Kohei
SHIINO, and Seiya
SUKEGAWA
Who Uses Free Trade Agreements? Nov
2009
2009-21 Ayako OBASHI Resiliency of Production Networks in Asia:
Evidence from the Asian Crisis
Oct
2009
2009-20 Mitsuyo ANDO and
Fukunari KIMURA Fragmentation in East Asia: Further Evidence
Oct
2009
2009-19 Xunpeng SHI The Prospects for Coal: Global Experience and
Implications for Energy Policy
Sept
2009
2009-18 Sothea OUM Income Distribution and Poverty in a CGE
Framework: A Proposed Methodology
Jun
2009
2009-17
Erlinda M.
MEDALLA and Jenny
BALBOA
ASEAN Rules of Origin: Lessons and
Recommendations for the Best Practice
Jun
2009
2009-16 Masami ISHIDA Special Economic Zones and Economic Corridors Jun
2009
2009-15 Toshihiro KUDO Border Area Development in the GMS: Turning the
Periphery into the Center of Growth
May
2009
2009-14
Claire HOLLWEG
and Marn-Heong
WONG
Measuring Regulatory Restrictions in Logistics
Services
Apr
2009
2009-13 Loreli C. De DIOS Business View on Trade Facilitation Apr
2009
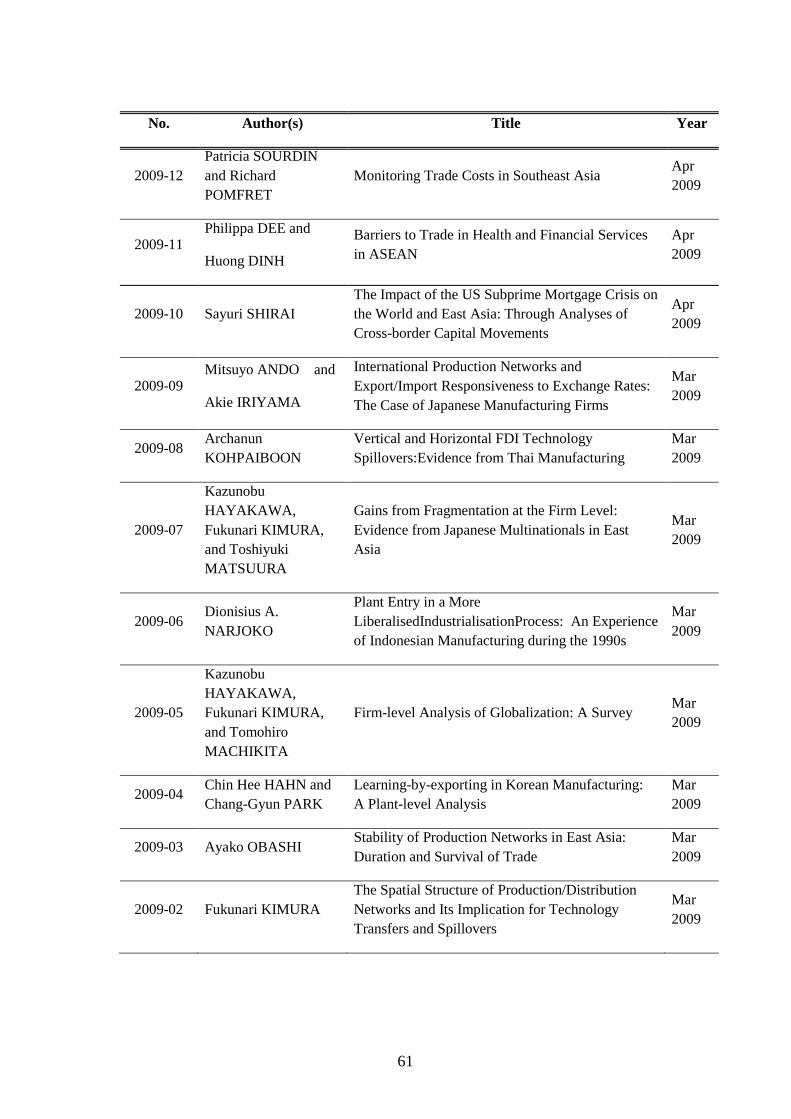
61
No. Author(s) Title Year
2009-12
Patricia SOURDIN
and Richard
POMFRET
Monitoring Trade Costs in Southeast Asia Apr
2009
2009-11 Philippa DEE and
Huong DINH
Barriers to Trade in Health and Financial Services
in ASEAN
Apr
2009
2009-10 Sayuri SHIRAI
The Impact of the US Subprime Mortgage Crisis on
the World and East Asia: Through Analyses of
Cross-border Capital Movements
Apr
2009
2009-09 Mitsuyo ANDO and
Akie IRIYAMA
International Production Networks and
Export/Import Responsiveness to Exchange Rates:
The Case of Japanese Manufacturing Firms
Mar
2009
2009-08 Archanun
KOHPAIBOON
Vertical and Horizontal FDI Technology
Spillovers:Evidence from Thai Manufacturing
Mar
2009
2009-07
Kazunobu
HAYAKAWA,
Fukunari KIMURA,
and Toshiyuki
MATSUURA
Gains from Fragmentation at the Firm Level:
Evidence from Japanese Multinationals in East
Asia
Mar
2009
2009-06 Dionisius A.
NARJOKO
Plant Entry in a More
LiberalisedIndustrialisationProcess: An Experience
of Indonesian Manufacturing during the 1990s
Mar
2009
2009-05
Kazunobu
HAYAKAWA,
Fukunari KIMURA,
and Tomohiro
MACHIKITA
Firm-level Analysis of Globalization: A Survey Mar
2009
2009-04 Chin Hee HAHN and
Chang-Gyun PARK
Learning-by-exporting in Korean Manufacturing:
A Plant-level Analysis
Mar
2009
2009-03 Ayako OBASHI Stability of Production Networks in East Asia:
Duration and Survival of Trade
Mar
2009
2009-02 Fukunari KIMURA
The Spatial Structure of Production/Distribution
Networks and Its Implication for Technology
Transfers and Spillovers
Mar
2009
62
No. Author(s) Title Year
2009-01 Fukunari KIMURA
and Ayako OBASHI
International Production Networks: Comparison
between China and ASEAN
Jan
2009
2008-03
Kazunobu
HAYAKAWA and
Fukunari KIMURA
The Effect of Exchange Rate Volatility on
International Trade in East Asia
Dec
2008
2008-02
Satoru KUMAGAI,
Toshitaka GOKAN,
Ikumo ISONO, and
Souknilanh KEOLA
Predicting Long-Term Effects of Infrastructure
Development Projects in Continental South East
Asia: IDE Geographical Simulation Model
Dec
2008
2008-01
Kazunobu
HAYAKAWA,
Fukunari KIMURA,
and Tomohiro
MACHIKITA
Firm-level Analysis of Globalization: A Survey Dec
2008