Embed Size (px)
Citation preview
Single Case Design: Focus on Experimental Control, Visual Analysis, and Appropriate Statistical
Analysis Chris Riley-Tillman, PhD.,
University of Missouri
Daniel Maggin Ph.D., University of Illinois at Chicago

Goals of Today’s Presentation • Brief background on SCD • Highlight the two issues (methods and analysis)
o Determining a functional relationship § Baseline logic overview § Design overview § Using Visual Analysis to consider an Functional
Relationship o Determining is there was a change in the dependent variable
§ Visual analysis § Effect sizes and other complex analysis

Current Issues with SCD Research
• Hyper focus on measuring a change in target behavior
• Lack of focus on if there is evidence for a functional relationship

Single-Case Design and Analysis
• Single-case designs (SCD) are a class of experimental methodology that has been utilized for decades in a number of disciplines including psychology and education (Kazdin, 1982).
• Other names o Single-subject o intra-subject o N = 1

Purpose of Single-Case Design
• SCD is a collection of experimental methods that are developed to essentially document three things: o If there is an observable and important change in
some dependent variable, o If the observed change in the outcome data post-
application of the independent variable is a result of the application of the independent variable, and
o If this change is something that is generalizable across time, setting, and target.
Purpose of Single-Case Design in an Educational Environment.
• Did the outcome variable (e.g. percent of time on task) change when the intervention was implemented?
• Was the observed change due to the implementation of the intervention and only the implementation of the intervention?
• Can the information learned from this educational intervention be generalized to other similar educational problems and settings?
Why is Single-case Design Ideal for Educational Practice?
¨ Perhaps the most attractive element of SCD is that it is a family of experimental methods that are designed for use with one student (or a small group of students). ¤ More strongly suited for applied work than traditional
“large N” methods
Allows one to make a defensible statement about the relationship between the independent variable (intervention) and dependent variable (outcome data)

SCD Role in Educational Research
• Ideal for initial testing of theory in a fully experimental method
• Ideal for targeted systematic replication to observe difference in validated methods with unique participants
The strength of SCD is the combination of a fully experimental approach that also allows for a close examination of unique features of
each case.

The Nuts and Bolts of Single-Case Design

A Quick Experimental Methods Primer
• Three Steps of the Scientific Method o Step 1: Development of a Hypothesis –
Experimental Thinking o Step 2: Observation of Functional Relationship for
the First Time o Step 3: Replication

Development of a Hypothesis – Experimental Thinking
¨ Scientific or research hypotheses, are stated as predictions about some observable phenomena based on existing knowledge or theory. ¨ While this informed prediction or belief is clearly a
useful tool, it is critical to take one more step and create a formal hypothesis.
¨ There are three critical elements to a formal hypothesis: ¨ an independent variable, ¨ a dependent variable, ¨ and a statement of the direction of the expected
change.

Independent Variable ¨ The independent variable is the set of experimental
conditions (or treatments) that is expected to bring about some observable change in the participants.
¨ It is critical that it is well defined so that the experience in question is consistent across participants and fully understood by the applied experimenter. ¤ If we are interested in the effect of a particular reading
intervention, we would want the specifics of that intervention (activity, materials, frequency and so on) to be clearly spelled out.
¤ It would be imperative to know that the “reading intervention” is a repeated readings activity using instructional level text conducted for 30 minutes 5 times a week.

Dependent Variable
• The second critical element of a hypothesis is a clear statement of the behavior that will change as a result of the application of the independent variable.
• A specific form of outcome data

Direction of the expected change
¨ Finally, hypotheses should include a clear statement about the nature and direction of the expected change (e.g., increase, positive relationship or lesser gain).
¨ In addition, creating a complete hypothesis statement automatically generates an alternative hypothesis predicting that no change will be observed.
It is critical that the design selected makes sense in relation to the expected change

Observation of Functional Relationship for the First Time
• After developing a hypothesis that indicates the anticipated relationship between the independent and the dependent variable, the next step is to test this hypothesis in a controlled manner to determine if the statement is correct.

Logic of the First Observation If X, then Y
Y Therefore, X
OR
If the independent variable is a controlling factor for the dependent variable (X), then the outcome data will show a change when the independent
variable is present (Y)(If X, then Y)
The outcome data show a change when the independent variable is present (Y is true)
Therefore, the independent variable is a controlling variable (effective in
changing) for the dependent variable (therefore, X is true)
The Problem
• This is a classic formal fallacy called affirmation of the consequent o Simply because X means Y will occur does not
mean that X is the only reason that Y can occur. For example, consider the following:
If you have food poisoning, you will feel nausea
You feel nauseous Therefore, you have food poisoning
The Solution: Replication ¨ In an attempt to make stronger assertions as to the
reliability of a relationship between an independent and dependent variable, we must replicate this initial observation.
¨ By observing the relationship several times, one can gain confidence in the dependability or reliability of the relationship (with some specific stipulations based on the form of replication undertaken).
¨ Replication is the process in experimental design that allows us to make stronger statements as to the reliability of a particular situation or relationship.

How can this information be put into a usable package?
Baseline Logic….

The Technology of Successful Intervention: Baseline Logic
• Understanding baseline logic will allow you to design and interpret any Single Case Design study
• Steps of baseline logic o Prediction o Affirming the Consequent o Verification o Replication

Prediction
• This is the anticipation of some future measurement based on the existence of a stable series of data o When the data becomes stable prediction is
possible o It is assumed that if nothing changed the
measurement should remain stable in the future.
Baseline Logic: Prediction The image cannot be displayed. Your computer may not have enough memory to open the image, or the image may have been corrupted. Restart your computer, and then open the file again. If the red x still appears, you may have to delete the image and then insert it again.

Affirming the Consequent ¨ A piece of inductive logic
¤ If A is true B is true ¤ B is true ¤ Therefore A is true
¨ The intervention adaptation of this ¤ If the intervention (A) is a controlling factor for the
behavior, then the data (B) will show a change when the intervention is present
¤ The data shows a change when this intervention is present (B is true)
¤ Therefore, the intervention is a controlling variable (effective in changing) for the behavior (therefore, A is true)

Baseline Logic: Affirming the Consequent
Adapted from Cooper, Heron, & Heward, 2007
0
10
20
30
40
50
60
70
80
90
100
1 2 3 4 5 6 7 8 9 10 11 12 13 14 15
Outco
me Va
riable
(e.g., tim
e on t
ask o
r WCP
M)
Time (e.g., day or intervention session)
Theoretical Data: Predicted Level of Outcome
Data with No Intervention
Actual Data: Intervention
Affirmation
of
the
Consequent
Actual Data: Baseline

Verification
• To further demonstrate that the change in behavior is functionally related to the independent variable you need to demonstrate that the change would not have been obtained if the independent variable was not present

Baseline Logic: Verification
Adapted from Cooper, Heron, & Heward, 2007
0
10
20
30
40
50
60
70
80
90
100
1 2 3 4 5 6 7 8 9 10 11 12 13 14 15 16 17 18 19 20
Outcom
e Variable (e.g., tim
e on task or W
CPM)
Time (e.g., day or intervention session)
Actual Data: Baseline
Actual Data: Intervention
Theoretical Data: Predicted Level of Outcome Data with
No Intervention
Actual Data: Return to Baseline
Verificaton

Replication
• By repeating the affirmation of the consequent you decrease the likelihood that some outside variable was responsible for the first data series change.

Baseline Logic: Replication by AoC
Adapted from Cooper, Heron, & Heward, 2007
0
10
20
30
40
50
60
70
80
90
100
1 2 3 4 5 6 7 8 9 10 11 12 13 14 15 16 17 18 19 20 21 22 23 24 25 26 27 28 29 30
Outcom
e Variable (e.g., tim
e on
task or W
CPM)
Time (e.g., day or intervention session)
Actual Data: Baseline
Actual Data: Return to Baseline
Theoretical Data: Predicted Level of Outcome Data with No Intervention
Theoretical Data: Predicted Level of
Outcome Data with No Intervention
Actual Data: Intervention
Actual Data: Return to Intervention
Replication

Critical Issues for any SCD Researcher
• For each study you must build a case that your design AND data support each stage of baseline logic. o Without this case, the amount of the effect is
irrelevant. The case for a functional relationship is not the
design – but experimental designs are a pathway to help build a case.
Transforming Baseline Logic into Formal Designs
• Why talk about formal designs? ¨ Formal SCD allows for an agreed upon standard
• It is understood that these formal design will not always be realized in applied settings!

The Classic A-B-A-B Design

A-B Designs
• An A-B design is the most basic design to monitor intervention effectiveness
• The A-B design has been called the most basic quasi-experimental version of single-case design (Tawney & Gast, 1982).

A-B Designs and Baseline Logic
• The first two stages, prediction and affirmation of the consequent are observed in an A-B design. o The collection of baseline data allows for the
prediction statement (what would happen if nothing was done).
o Once the baseline data are collected, any intervention (experimental hypothesis) can be tested by simply implementing it in a controlled manner, and then observing if the outcome data change from baseline in the predicted manner.

A-B Design Example
05101520253035404550
1 2 3 4 5 6 7 8 9 10 11 12
WCP
M
CBM Probe (three per week)
A B

General SCD Issue – “How much data are needed for each phase?”
¨ The traditional answer is you need to collect enough data so that a stable pattern is demonstrated. ¤ By collecting a sufficient and steady stream of outcome data
we are able to predict future levels of the behavior if nothing were to change.
¨ What is sufficient? ¤ There is no simple definition of sufficient because it is
impacted significantly by what outcome behavior is being measured.
n If a very stable behavior is being measured, then it could be argued that three data points are defensible.
n In cases where there is some variability in the outcome data, it is suggested that a minimum of five data points are collected in both the baseline and the intervention phases.

Baseline Issues – Delaying the Intervention I
¨ Is it reasonable to delay the intervention? ¨ While it is clear that baseline data is essential in the
documentation of a change, it can be difficult to argue for this data collection in practice.
¤ Most educational professionals and parents will want a change to happen quickly.
¨ Questions to ask ¤ Do you need to document a change in the target child’s
behavior? ¤ Is that need more important than the significance of
changing the behavior immediately?
Baseline Issues – Delaying the Intervention II
¨ While delaying a intervention may seem unfair, the potential information acquired from baseline data collection can be well worth it.
¨ Is it ethical NOT to collect baseline data? ¨ If anything, it is only ethical in most cases to make sure
that intervention is working (that a change has occurred) and thus should be continued.
¨ The rush to intervene in the case of mild and moderate cases without baseline data only increases the likelihood that ineffective interventions that don’t actually change the outcome behavior will be retained.

A-B-A-B Designs ¨ One of the most well known and incorporated single-case
methods is the A-B-A-B design. ¨ In circles where single-case designs are used commonly,
the A-B-A-B design is often simply referred to as a reversal (Baer, Wolf, & Risley, 1968; Risley; 2005) or withdrawal (Leitenberg, 1973) design. ¤ Procedurally, a reversal design is suggested to refer to situations
when the intervention is actually reversed while a withdrawal design refers to situations then the intervention is simply removed (Poling & Gossett, 1984).
¤ Cooper, Heron and Heward (2007) argue that the most appropriate term for A-B-A-B designs is a reversal design as it refers to both the withdrawal and reversal of the intervention in an attempt to demonstrate behavioral reversibility (Baer, Wolf, Risely, 1968; Thompson & Iwata, 2005).

A-B-A-B Example
012345678910
1 2 3 4 5 6 7 8 9 10 11 12 13 14 15 16 17 18 19 20
DBR of Acade
mic Eng
agem
ent
Day
A B A B

Wagner & Winnet 1988

Steps to a successful A-B-A-B design (adapted from Tawney & Gast, 1984)
• Clear description of the target, target behavior, and ecology (time, place, instructional activities and all other relevant features.
• A defensible data collection method • As frequent data collection as possible • Sufficient baseline data (A) so that the pattern of outcome data
is stable • Sufficient intervention data (B) so that the pattern of outcome
data is stable • Sufficient return to baseline data (A) so that the pattern of
outcome data is stable • Sufficient replication of the intervention data (A) so that the
pattern of outcome data is stable

Other Baseline Issues – Slow and Partial Returns to Baseline
• A slow return to baseline is observed when it takes a concerning number of sessions for the outcome data to return to pre-intervention levels after the intervention has been removed. o In the first case, a slow return to baseline, baseline logic can
be obtained but it is required that the withdrawal phase be extended so that a full return to baseline be observed.
• A partial return to baseline is observed when pre-intervention levels of the outcome data are never observed o Essentially, the partial return gives you confidence that the
intervention is partially responsible for the observed change in outcome data

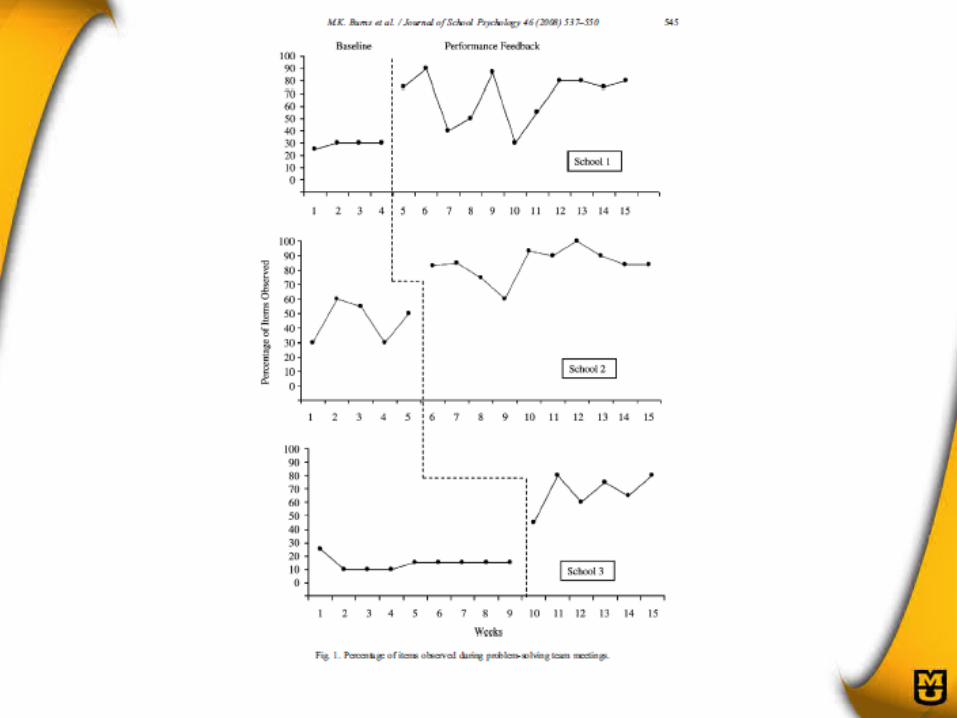
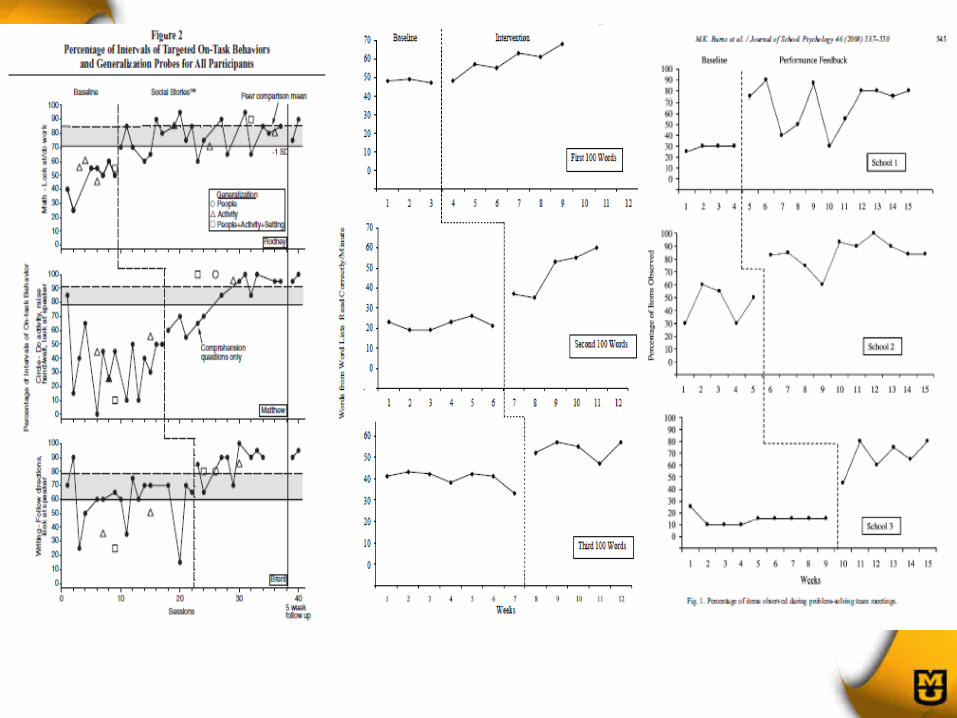
Complex Single-Case Designs
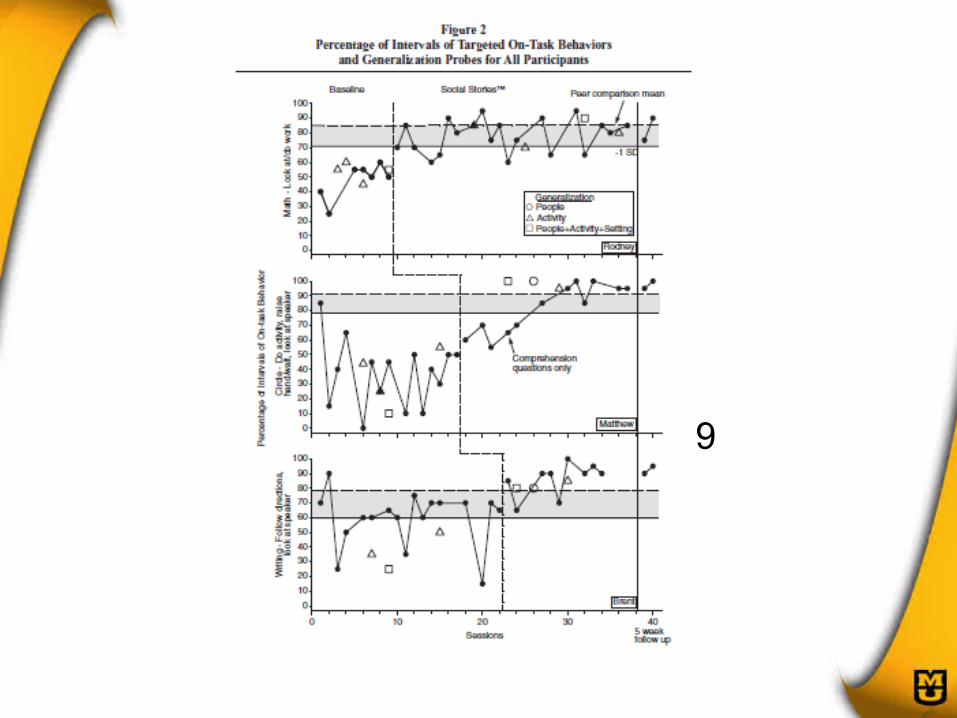
Schneider & Goldstein, 2009


Steps to a successful MB design (adapted from Tawney & Gast, 1984)
¨ Clear description of the target, target behavior, and ecology (time, place, instructional activities and all other relevant features)
¨ Similarity in the targets in terms of their predicted functional relationship with the independent variable (intervention) with minimal threat of contamination of the intervention effect from one target to the next.
¨ A defensible data collection method ¨ As frequent data collection as possible ¨ Sufficient baseline data (A) ¨ Sufficient intervention data (B) ¨ Sufficient lag between phase changes across participants,
settings, or stimuli

What a MB design can tell you.
¨ That there was a change in outcome data from the baseline to the intervention phases for the participant(s)
¨ The specific nature of that change (e.g. level, trend, or variability)
¨ The settings and/or stimuli for the participant(s) for which that change could be replicated
¨ That the change observed was due to the intervention. Or, in practical terms, that the intervention was effective. This assumes that all four phases of baseline logic are supported by the pattern of the outcome data.
¨ That a lack of observed change suggests the intervention is not functionally related to the target behavior. Or, in practical terms, that the intervention was ineffective. This assumes that the baseline phase verified across setting or stimuli.

What a MB design cannot tell you
• That the results are generalizable beyond the participants or stimuli studied.
• What the functional relationship is for an individual student unless data are compared across settings or stimuli for that particular student.

Visual Analysis and Interpretation Strategies for Single-Case
Design

Considering “Change” ¨ Within vs. Between Phase
¤ Within Phase – Collect more data! n Could be typical variability n Could be something changed
¤ Between Phase – The whole point of intervention! ¨ Two Stages for the Analysis of Single-Case
Design Data ¤ Step 1: Was there a change between phases? ¤ Step 2: Was the documented change functionally
related to the intervention? ¤ Reconsidering Baseline Logic during analysis

Step 1: Was there a change? Strategies for Summarization and Analysis of Behavioral Data
• Traditional visual analysis includes examining o (a) level o (b) immediacy o (c) variability o (d) trend
Visual Analysis Strengths
• Systematic methods
• Readily applicable
• Appropriate for all single-case research data
• Large and clear mandate

Visual Analysis Limitations
• Need for stable baselines that can be difficult to achieve in applied settings
• Difficult to communicate about the magnitude of change
• Reliability across visual analysts
• Large and clear mandate

SCD Effect Sizes
• Effect sizes are a statistical approach for indexing the magnitude of change o More reliable and consistent than visual analysis (in
theory)
o Assists with documenting and communicating about the size of change
o Might assist with acceptability of single-case research to those without familiarity
o Can be used to supplement and extend research findings.

SCD Effect Size Challenges
• Statistical o Small number of data points per phase
o Distributional concerns
o Serial dependencies
o Modeling data trend and variability
o Standardization
SCD Effect Size Challenges
• Statistical challenges lead to several questions: o What is the best metric for indexing an effect?
o Do these methods really provide a more reliable estimate than visual analysis?
o Are these methods even applicable to single-case data?
o Why are there so many stinking options?
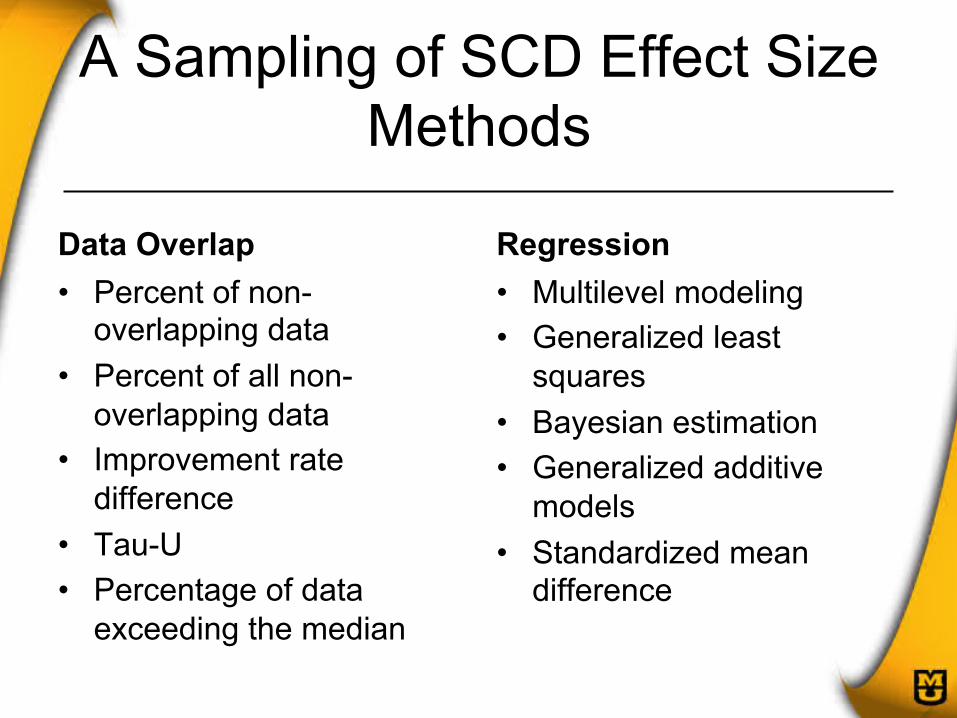
A Sampling of SCD Effect Size Methods
Data Overlap • Percent of non-
overlapping data • Percent of all non-
overlapping data • Improvement rate
difference • Tau-U • Percentage of data
exceeding the median
Regression • Multilevel modeling • Generalized least
squares • Bayesian estimation • Generalized additive
models • Standardized mean
difference

Data Overlap Methods
• Nonoverlap methods are used to compare the “data clouds” associated with diffferent phases (Parker, Vannest, Davis, & Sauber, 2011)

Data Overlap Review
• Strengths o Data overlap methods index an important aspect
of visual analysis. o Becoming increasingly more sophisticated. o Preferred method for single-case researchers due
to ease of computation and interpretability. • Limitations
o Does not index magnitude of effect. o Most lack a sampling distribution. o Focus on between-phase overlap and does not
necessarily “punish” for within-phase trend or variability.

Regression Methods
• Regression methods use various modeling techniques to estimate differences in the “data clouds.”
Regression Methods Overview
• Tremendous strides made over the past decade with some of the finest statistical minds in our field addressing the issue.
• There is a light at the end of the tunnel, though there is considerable digging left to be done.

Strengths of Recently Proposed Methods
• Account for the range of commonly cited concerns such as o Autocorrelation o Distributional concerns o Presence of data trend o Standardization o Interpretability o Results in magnitude of effect
Limitations of Recently Proposed Methods
• Still considerable work to be done… o None of the methods handles all concerns.
• … but it is clear that each can probably be fashioedn to meet the various criteria… o Such as serial dependence, data trend, and
standardization.
• …additional testing is needed on more complex data series.

The Way Forward
• Visual analysis is used to carry out studies and establish experimental control (or not)
• Statistical analysis used to verify visual analysis and index magnitude of effect.
• The Having Your Cake and Eating It Too Principle: o Results used to communicate more efficiently and
increase with the notion of replication remaining essential.