Embed Size (px)
Citation preview
Single-cell O2 exchange imaging shows thatcytoplasmic diffusion is a dominant barrier to efficientgas transport in red blood cellsSarah L. Richardsona, Alzbeta Hulikovaa, Melanie Provenb, Ria Hipkissb, Magbor Akannic, Noémi B. A. Royb,d,and Pawel Swietacha,1
aDepartment of Physiology, Anatomy & Genetics, University of Oxford, OX1 3PT Oxford, England; bMolecular Haematology Laboratory, Oxford UniversityHospitals National Health Service (NHS) Foundation Trust, John Radcliffe Hospital, OX3 9DS Oxford, England; cHaematology, Milton Keynes UniversityHospital, MK6 5LD Milton Keynes, England; and dWeatherall Institute of Molecular Medicine & National Institute for Health Research (NIHR) OxfordBiomedical Research Center (BRC) Haematology Theme, University of Oxford, OX3 9DS Oxford, England
Edited by Peter Agre, Johns Hopkins Bloomberg School of Public Health, Baltimore, MD, and approved March 23, 2020 (received for review September25, 2019)
Disorders of oxygen transport are commonly attributed to in-adequate carrying capacity (anemia) but may also relate toinefficient gas exchange by red blood cells (RBCs), a process thatis poorly characterized yet assumed to be rapid. Without directmeasurements of gas exchange at the single-cell level, the barriersto O2 transport and their relationship with hematological disor-ders remain ill defined. We developed a method to track the flowof O2 in individual RBCs by combining ultrarapid solution switch-ing (to manipulate gas tension) with single-cell O2 saturation fluo-rescence microscopy. O2 unloading from RBCs was considerablyslower than previously estimated in acellular hemoglobin solu-tions, indicating the presence of diffusional barriers in intact cells.Rate-limiting diffusion across cytoplasm was demonstrated by os-motically induced changes to hemoglobin concentration (i.e., diffusivetortuosity) and cell size (i.e., diffusion pathlength) and by comparingwild-type cells with hemoglobin H (HbH) thalassemia (shorter path-length and reduced tortuosity) and hereditary spherocytosis (HS; ex-panded pathlength). Analysis of the distribution of O2 unloading ratesin HS RBCs identified a subpopulation of spherocytes with greatly im-paired gas exchange. Tortuosity imposed by hemoglobin was verifiedby demonstrating restricted diffusivity of CO2, an acidic gas, from thedissipative spread of photolytically uncaged H+ ions across cytoplasm.Our findings indicate that cytoplasmic diffusion, determined by path-length and tortuosity, is a major barrier to efficient gas handling byRBCs. Consequently, changes in RBC shape and hemoglobin concentra-tion, which are commonmanifestations of hematological disorders, canhave hitherto unrecognized and clinically significant implications ongas exchange.
erythrocyte | diffusion | oxygen | fluorescence | gas channels
Red blood cells (RBCs) are highly adapted morphologically,biochemically, and physiologically to exchange large volumes
of O2 and CO2 during a capillary sojourn of less than 1 s (1).Impairment to any one of these adaptations can compromise gasexchange at the lungs and systemic tissues to the detriment ofwhole-body physiology. Blood samples taken as part of clinicalcare are routinely tested for indices of O2-carrying capacity, suchas total hemoglobin (Hb) concentration, hematocrit, or meancorpuscular hemoglobin concentration (MCHC), but these donot supply information pertaining to the kinetics of gas turnover.Indeed, impaired gas (un-)loading from RBCs can be as damagingas anemia but come undetected using routinely used blood tests.Historically, our understanding of O2 handling by RBCs has
been based on reaction rates measured in acellular Hb solutions.However, the intact RBC imposes additional structural barriers,such as membrane permeation and cytoplasmic diffusion (2).Due to their naturally rapid pace, gas fluxes in and out of RBCsare technically challenging to capture, and consequently, therate-limiting steps for gas exchange are difficult to identify. In
particular, measurements of gas diffusion inside intact RBCs arelacking, although it is widely assumed that this is a rapid process(3–7). In contrast, permeation across the membrane bilayer hasbeen postulated to be rate limiting for gas flows (2), and a par-allel pathway in the form of gas channels (8) is considered nec-essary for efficient gas exchange (9–13). If, contrary to thisparadigm, resistance to gas flow was imposed mainly by the cy-toplasm, then gas exchange would be exquisitely sensitive to cellshape (diffusion pathlength) and MCHC (tortuosity imposed byHb “crowding”) (14, 15), with major implications for our un-derstanding of RBC disorders. A comprehensive appraisal of gashandling must also consider RBC heterogeneity because manyhematological disorders manifest a spectrum of phenotypesamong circulating cells. Pooled population measurements of gasexchange inherently lack single-cell resolution and hence fail todetect subpopulations, which may be relevant to the manage-ment of blood diseases. Indeed, the clinical value of measuringthe statistical distribution of an RBC parameter has been dem-onstrated for corpuscular volume, which has a wider distributionwidth in iron deficiency and certain thalassemias (16, 17).
Significance
Blood is routinely tested for gas-carrying capacity (total he-moglobin), but this cannot determine the speed at which redblood cells (RBCs) exchange gases. Such information is criticalfor evaluating the physiological fitness of RBCs, which havevery limited capillary transit times (<1 s) for turning oversubstantial volumes of gas. We developed a method to quan-tify gas exchange in individual RBCs and used it to show thatrestricted diffusion, imposed by hemoglobin crowding, is amajor barrier to gas flows. Consequently, hematological dis-orders manifesting a change in cell shape or hemoglobin con-centration have uncharted implications on gas exchange,which we illustrate using inherited anemias. With its single-cellresolution, the method can identify physiologically inferiorsubpopulations, providing a clinically useful appraisal ofblood quality.
Author contributions: A.H., N.B.A.R., and P.S. designed research; S.L.R., A.H., and P.S.performed research; M.A., N.B.A.R., and P.S. contributed new reagents/analytic tools;S.L.R., A.H., M.P., R.H., N.B.A.R., and P.S. analyzed data; and S.L.R., N.B.A.R., and P.S.wrote the paper.
The authors declare no competing interest.
This article is a PNAS Direct Submission.
This open access article is distributed under Creative Commons Attribution License 4.0(CC BY).1To whom correspondence may be addressed. Email: [email protected].
This article contains supporting information online at https://www.pnas.org/lookup/suppl/doi:10.1073/pnas.1916641117/-/DCSupplemental.
First published April 22, 2020.
www.pnas.org/cgi/doi/10.1073/pnas.1916641117 PNAS | May 5, 2020 | vol. 117 | no. 18 | 10067–10078
PHYS
IOLO
GY
Dow
nloa
ded
by g
uest
on
Aug
ust 2
, 202
0
For the purpose of this study, we developed a method fortracking gas exchange in RBCs at single-cell resolution. Weapply this method to measure O2 (un-)loading in individualRBCs, describe the statistical distribution of gas exchange ki-netics in a population of RBCs, and characterize the barriers thatrestrict the flow of respiratory gases. We tested evidence for rate-limiting diffusion by subjecting wild-type RBCs to osmoticallyinduced changes in cell volume and Hb concentration and bystudying RBC disorders in which diffusive properties are altered.Hemoglobin H (HbH) disease is an alpha-thalassemia commonlyarising from the deletion of three alpha genes. It is characterizedby microcytic and hypochromic RBCs (18), circumstances thatwould favor faster cytoplasmic diffusion rates, but also increasedmembrane rigidity (19), which should restrict membrane per-meability (20). Hereditary spherocytosis (HS) is the most com-mon inherited anemia with a prevalence of 1:2,000 in northernEuropeans (21, 22). Here, defective surface anchoring of thecytoskeleton causes cells to progressively attain a spherical shapewith expanded cytoplasmic pathlength for diffusing gases (21,23). We illustrate the utility of making single-cell measurementsby describing the kinetic heterogeneity of RBCs in HS blood. Asthe spleen extracts aberrantly shaped cells, blood from HS pa-tients will contain a mixture of spherical and disk-shaped cells(24, 25). Although the physical characteristics of these subpop-ulations are known, their gas exchange kinetics are implicitlyassumed to be adequate. This supposition underpins the ratio-nale for interventions, such as splenectomy, which reversesanemia by withholding spherocytes. If, however, these “rescued”cells were found to be physiologically inadequate for exchangingO2, their systemic retention may be less beneficial than anticipated.Herein, we present a single-cell method for tracking gas
handling by RBCs and demonstrate its scientific and clinicalvalue by describing the rate-limiting steps to efficient gas ex-change and relating these to hematological disorders.
ResultsO2 Exchange Can Be Followed in an Individual RBC by Single-Cell O2
Saturation Imaging. The appropriate technique for measuring O2handling by RBCs must satisfy two criteria: 1) produce rapid andwell-controlled changes in O2 tension immediately outside theRBCs so that the maneuver itself does not artifactually set therate of the biological response and 2) dynamically track the O2saturation response in an individual RBC.To address the first requirement, a double-barreled, square-
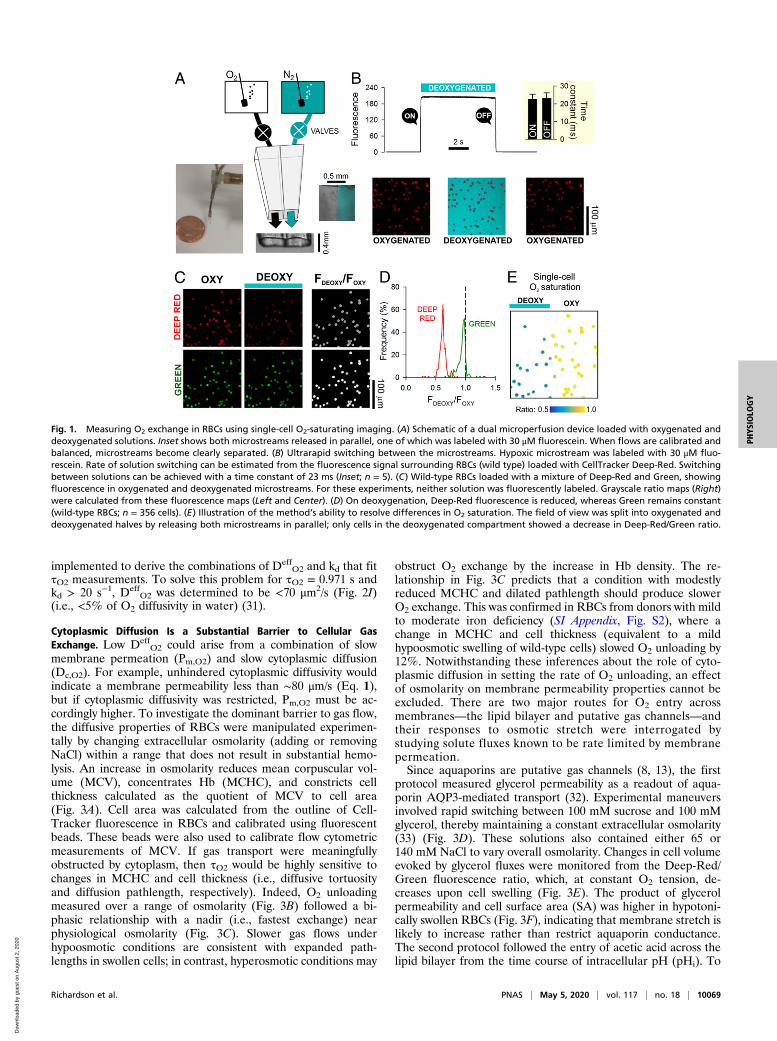
bore (0.4-mm) microperfusion device (Fig. 1A) was used torapidly alternate between an oxygenated microstream (bubbledwith 100% O2) and a deoxygenated (anoxic) microstream(bubbled with 100% N2 and containing the O2 scavengerdithionite; 1 mM). Experiments were performed in the absenceof CO2 to simplify data interpretation. To determine the speedof solution switching, the deoxygenated solution was labeled with30 μM fluorescein (excitation 488 nm, emission 500 to 550 nm),and the device was placed upstream to RBCs that had beenpreloaded with CellTracker Deep-Red and settled at the base ofa glass coverslip. Switching to the fluorescein-labeled microstreamproduced a sharp increase in fluorescence immediately outsidecells following a very fast time constant of 23 ms (Fig. 1B).The second criterion was met by exploiting O2-dependent
changes in the optical properties of Hb. Upon oxygenation, ab-sorbance of Hb in the 650- to 700-nm range decreases relative tothat in the 500- to 550-nm range. Thus, O2 saturation of an in-dividual RBC could be interrogated using a combination of twofluorescent dyes that emit in these ranges. A suitable pair of dyesis CellTracker Deep-Red and CellTracker Green (Fig. 1C),which produce no significant bleed through when excited by 633-and 488-nm lasers simultaneously. RBCs, loaded with Cell-Tracker Deep-Red and CellTracker Green, were plated on aglass coverslip at the base of an inspection chamber and
superfused with 4-(2-hydroxyethyl)-1-piperazineethanesulfonicacid (Hepes)-buffered solution (3 mL/min). The dual micro-perfusion device, placed upstream of cells, delivered a Hepes-buffered microstream at ∼8 μL/s, producing a linear velocity of50 mm/s at the outlet of the pipette. Such laminar flow produces amodest shear rate of ∼102 s−1 (velocity/height of the stream),which is below the level that normally leads to complex defor-mations (e.g., parachute or polylobe) of RBCs in the microcircu-lation (26, 27). O2 unloading was triggered by switching from theoxygenated to deoxygenated microstream. This maneuver reducedDeep-Red fluorescence to a greater degree than Green fluores-cence (Fig. 1D), and therefore, the fluorescence ratio provides adynamic readout of Hb O2 saturation. To illustrate the versatilityof this method, the dual microperfusion device was configured torelease both microstreams in parallel, which sharply divided RBCsin the field of view according to oxygenation status (Fig. 1E). Inthis protocol, the response of Deep-Red to anoxia relates to HbO2 unloading rather than an unreported effect of O2 on the dye, asno change in fluorescence ratio was observed in cell lines that donot produce Hb (SI Appendix, Fig. S1).
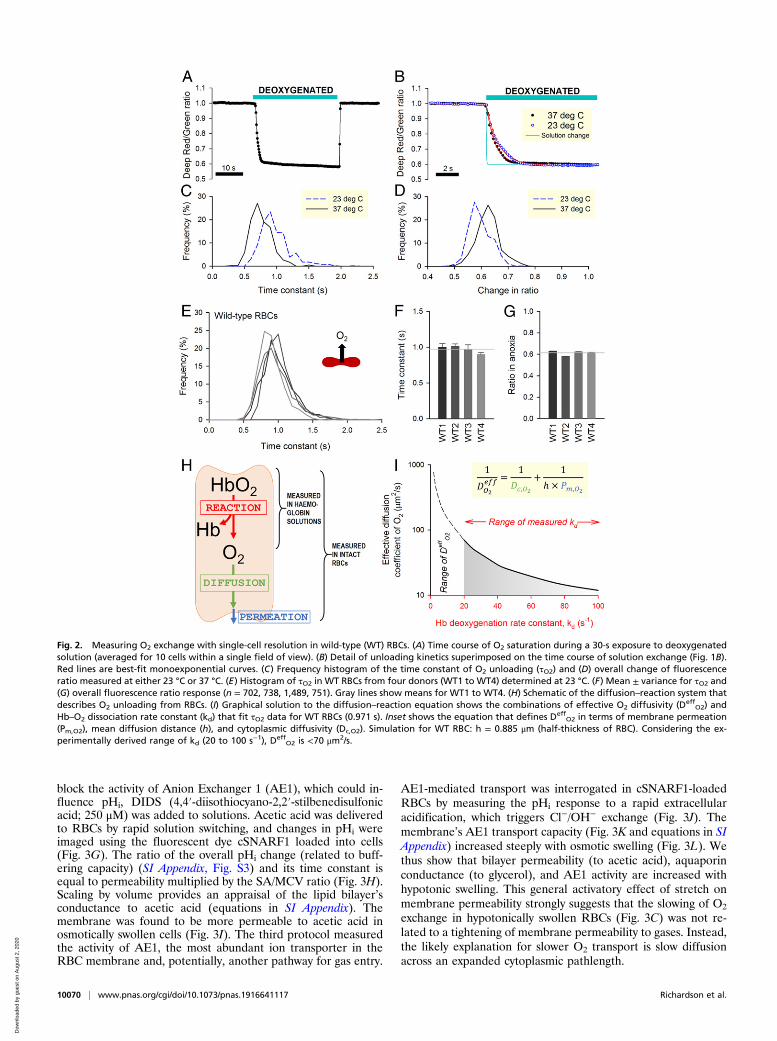
O2 Unloading from Wild-Type RBCs Is Slower than PreviouslyEstimated. Fig. 2A shows an exemplar time course of O2 satura-tion measured in RBCs during controlled changes in extracel-lular O2 tension. The kinetics of O2 unloading can be expressedin terms of a time constant (τO2) calculated by best fitting to amonoexponential curve (Fig. 2B). Since these measurements areperformed on a cell-by-cell basis, the statistical distribution ofτO2 can be obtained for the imaged cohort (Fig. 2C). Timecourses can also be analyzed in terms of the overall decrease inratio, which relates to the amount of oxygen released (Fig. 2D).The rate of O2 unloading was ∼30% faster at 37 °C comparedwith room temperature (23 °C), a difference that is consistentwith the thermodynamics diffusion phenomena (28). To de-termine the rate of O2 unloading from wild-type RBCs, mea-surements were undertaken on blood samples from four controlindividuals (Fig. 2E). To improve temporal resolution, theseexperiments were performed at 23 °C. Data were acquired fromat least five fields of view and five independent dye loadings inorder to collect adequate data for constructing frequency histo-grams of τO2. Mean τO2 was similar in all control samples(Fig. 2F), and the population variance of τO2 was relatively small.The overall decrease in fluorescence ratio upon deoxygenationwas, on average, 39% and showed narrow variation (Fig. 2G).In wild-type RBCs, mean τO2 was 0.971 s, which is strikingly
slow, particularly in relation to a typical capillary transit time.Indeed, previous measurements on acellular Hb solutions haddetermined O2 unloading to follow a substantially faster timeconstant of 20 to 100 ms at matching temperature (23 °C) (3, 29).This discrepancy can be explained by the presence of additionalbarriers that exist uniquely in the cellular context, notably dif-fusion through cytoplasm and permeation across the surfacemembrane. The resistance imposed collectively by these barrierscan be quantified using a mathematical model describing O2unloading in terms of reaction, diffusion, and permeation(Fig. 2H). Using kinetic data for Hb–O2 binding, it is thus pos-sible to estimate the effective diffusion coefficient (Deff
O2),which lumps membrane permeation (Pm,O2), cytoplasmic diffu-sion (Dc,O2), and mean diffusion distance (h) as follows:
(DeffO2)−1 = (Dc,O2)−1 + (h × Pm,O2)−1. [1]
Unbinding of the first O2 molecule from oxyhemoglobin followsa rate constant (kd) of 20 to 30 s−1 (3, 29), but subsequent un-binding steps are faster due to cooperativity, resulting in an en-semble kd as fast as ∼100 s−1. A mathematical representation ofthe Hb–O2 reaction (30) (equations in SI Appendix) was
10068 | www.pnas.org/cgi/doi/10.1073/pnas.1916641117 Richardson et al.
Dow
nloa
ded
by g
uest
on
Aug
ust 2
, 202
0
implemented to derive the combinations of DeffO2 and kd that fit
τO2 measurements. To solve this problem for τO2 = 0.971 s andkd > 20 s−1, Deff
O2 was determined to be <70 μm2/s (Fig. 2I)(i.e., <5% of O2 diffusivity in water) (31).
Cytoplasmic Diffusion Is a Substantial Barrier to Cellular GasExchange. Low Deff
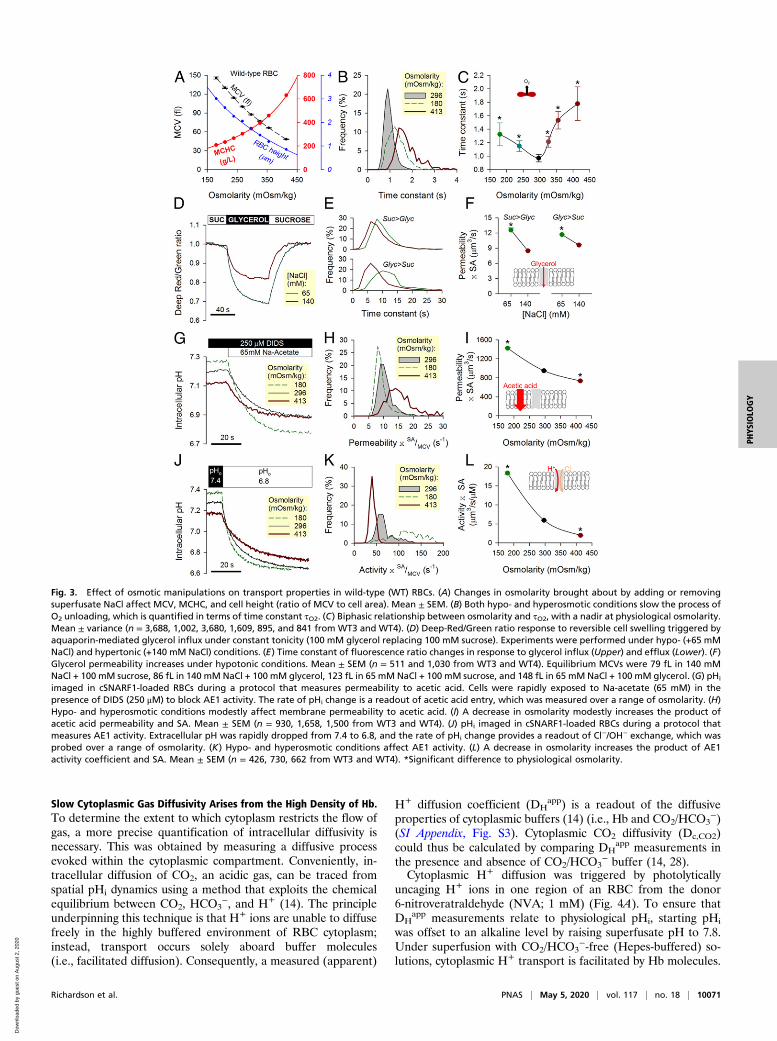
O2 could arise from a combination of slowmembrane permeation (Pm,O2) and slow cytoplasmic diffusion(Dc,O2). For example, unhindered cytoplasmic diffusivity wouldindicate a membrane permeability less than ∼80 μm/s (Eq. 1),but if cytoplasmic diffusivity was restricted, Pm,O2 must be ac-cordingly higher. To investigate the dominant barrier to gas flow,the diffusive properties of RBCs were manipulated experimen-tally by changing extracellular osmolarity (adding or removingNaCl) within a range that does not result in substantial hemo-lysis. An increase in osmolarity reduces mean corpuscular vol-ume (MCV), concentrates Hb (MCHC), and constricts cellthickness calculated as the quotient of MCV to cell area(Fig. 3A). Cell area was calculated from the outline of Cell-Tracker fluorescence in RBCs and calibrated using fluorescentbeads. These beads were also used to calibrate flow cytometricmeasurements of MCV. If gas transport were meaningfullyobstructed by cytoplasm, then τO2 would be highly sensitive tochanges in MCHC and cell thickness (i.e., diffusive tortuosityand diffusion pathlength, respectively). Indeed, O2 unloadingmeasured over a range of osmolarity (Fig. 3B) followed a bi-phasic relationship with a nadir (i.e., fastest exchange) nearphysiological osmolarity (Fig. 3C). Slower gas flows underhypoosmotic conditions are consistent with expanded path-lengths in swollen cells; in contrast, hyperosmotic conditions may
obstruct O2 exchange by the increase in Hb density. The re-lationship in Fig. 3C predicts that a condition with modestlyreduced MCHC and dilated pathlength should produce slowerO2 exchange. This was confirmed in RBCs from donors with mildto moderate iron deficiency (SI Appendix, Fig. S2), where achange in MCHC and cell thickness (equivalent to a mildhypoosmotic swelling of wild-type cells) slowed O2 unloading by12%. Notwithstanding these inferences about the role of cyto-plasmic diffusion in setting the rate of O2 unloading, an effectof osmolarity on membrane permeability properties cannot beexcluded. There are two major routes for O2 entry acrossmembranes—the lipid bilayer and putative gas channels—andtheir responses to osmotic stretch were interrogated bystudying solute fluxes known to be rate limited by membranepermeation.Since aquaporins are putative gas channels (8, 13), the first
protocol measured glycerol permeability as a readout of aqua-porin AQP3-mediated transport (32). Experimental maneuversinvolved rapid switching between 100 mM sucrose and 100 mMglycerol, thereby maintaining a constant extracellular osmolarity(33) (Fig. 3D). These solutions also contained either 65 or140 mM NaCl to vary overall osmolarity. Changes in cell volumeevoked by glycerol fluxes were monitored from the Deep-Red/Green fluorescence ratio, which, at constant O2 tension, de-creases upon cell swelling (Fig. 3E). The product of glycerolpermeability and cell surface area (SA) was higher in hypotoni-cally swollen RBCs (Fig. 3F), indicating that membrane stretch islikely to increase rather than restrict aquaporin conductance.The second protocol followed the entry of acetic acid across thelipid bilayer from the time course of intracellular pH (pHi). To
Fig. 1. Measuring O2 exchange in RBCs using single-cell O2-saturating imaging. (A) Schematic of a dual microperfusion device loaded with oxygenated anddeoxygenated solutions. Inset shows both microstreams released in parallel, one of which was labeled with 30 μM fluorescein. When flows are calibrated andbalanced, microstreams become clearly separated. (B) Ultrarapid switching between the microstreams. Hypoxic microstream was labeled with 30 μM fluo-rescein. Rate of solution switching can be estimated from the fluorescence signal surrounding RBCs (wild type) loaded with CellTracker Deep-Red. Switchingbetween solutions can be achieved with a time constant of 23 ms (Inset; n = 5). (C) Wild-type RBCs loaded with a mixture of Deep-Red and Green, showingfluorescence in oxygenated and deoxygenated microstreams. For these experiments, neither solution was fluorescently labeled. Grayscale ratio maps (Right)were calculated from these fluorescence maps (Left and Center). (D) On deoxygenation, Deep-Red fluorescence is reduced, whereas Green remains constant(wild-type RBCs; n = 356 cells). (E) Illustration of the method’s ability to resolve differences in O2 saturation. The field of view was split into oxygenated anddeoxygenated halves by releasing both microstreams in parallel; only cells in the deoxygenated compartment showed a decrease in Deep-Red/Green ratio.
Richardson et al. PNAS | May 5, 2020 | vol. 117 | no. 18 | 10069
PHYS
IOLO
GY
Dow
nloa
ded
by g
uest
on
Aug
ust 2
, 202
0
block the activity of Anion Exchanger 1 (AE1), which could in-fluence pHi, DIDS (4,4′-diisothiocyano-2,2′-stilbenedisulfonicacid; 250 μM) was added to solutions. Acetic acid was deliveredto RBCs by rapid solution switching, and changes in pHi wereimaged using the fluorescent dye cSNARF1 loaded into cells(Fig. 3G). The ratio of the overall pHi change (related to buff-ering capacity) (SI Appendix, Fig. S3) and its time constant isequal to permeability multiplied by the SA/MCV ratio (Fig. 3H).Scaling by volume provides an appraisal of the lipid bilayer’sconductance to acetic acid (equations in SI Appendix). Themembrane was found to be more permeable to acetic acid inosmotically swollen cells (Fig. 3I). The third protocol measuredthe activity of AE1, the most abundant ion transporter in theRBC membrane and, potentially, another pathway for gas entry.
AE1-mediated transport was interrogated in cSNARF1-loadedRBCs by measuring the pHi response to a rapid extracellularacidification, which triggers Cl−/OH− exchange (Fig. 3J). Themembrane’s AE1 transport capacity (Fig. 3K and equations in SIAppendix) increased steeply with osmotic swelling (Fig. 3L). Wethus show that bilayer permeability (to acetic acid), aquaporinconductance (to glycerol), and AE1 activity are increased withhypotonic swelling. This general activatory effect of stretch onmembrane permeability strongly suggests that the slowing of O2
exchange in hypotonically swollen RBCs (Fig. 3C) was not re-lated to a tightening of membrane permeability to gases. Instead,the likely explanation for slower O2 transport is slow diffusionacross an expanded cytoplasmic pathlength.
Fig. 2. Measuring O2 exchange with single-cell resolution in wild-type (WT) RBCs. (A) Time course of O2 saturation during a 30-s exposure to deoxygenatedsolution (averaged for 10 cells within a single field of view). (B) Detail of unloading kinetics superimposed on the time course of solution exchange (Fig. 1B).Red lines are best-fit monoexponential curves. (C) Frequency histogram of the time constant of O2 unloading (τO2) and (D) overall change of fluorescenceratio measured at either 23 °C or 37 °C. (E) Histogram of τO2 in WT RBCs from four donors (WT1 to WT4) determined at 23 °C. (F) Mean ± variance for τO2 and(G) overall fluorescence ratio response (n = 702, 738, 1,489, 751). Gray lines show means for WT1 to WT4. (H) Schematic of the diffusion–reaction system thatdescribes O2 unloading from RBCs. (I) Graphical solution to the diffusion–reaction equation shows the combinations of effective O2 diffusivity (Deff
O2) andHb–O2 dissociation rate constant (kd) that fit τO2 data for WT RBCs (0.971 s). Inset shows the equation that defines Deff
O2 in terms of membrane permeation(Pm,O2), mean diffusion distance (h), and cytoplasmic diffusivity (Dc,O2). Simulation for WT RBC: h = 0.885 μm (half-thickness of RBC). Considering the ex-perimentally derived range of kd (20 to 100 s−1), Deff
O2 is <70 μm2/s.
10070 | www.pnas.org/cgi/doi/10.1073/pnas.1916641117 Richardson et al.
Dow
nloa
ded
by g
uest
on
Aug
ust 2
, 202
0
Slow Cytoplasmic Gas Diffusivity Arises from the High Density of Hb.To determine the extent to which cytoplasm restricts the flow ofgas, a more precise quantification of intracellular diffusivity isnecessary. This was obtained by measuring a diffusive processevoked within the cytoplasmic compartment. Conveniently, in-tracellular diffusion of CO2, an acidic gas, can be traced fromspatial pHi dynamics using a method that exploits the chemicalequilibrium between CO2, HCO3
−, and H+ (14). The principleunderpinning this technique is that H+ ions are unable to diffusefreely in the highly buffered environment of RBC cytoplasm;instead, transport occurs solely aboard buffer molecules(i.e., facilitated diffusion). Consequently, a measured (apparent)
H+ diffusion coefficient (DHapp) is a readout of the diffusive
properties of cytoplasmic buffers (14) (i.e., Hb and CO2/HCO3−)
(SI Appendix, Fig. S3). Cytoplasmic CO2 diffusivity (Dc,CO2)could thus be calculated by comparing DH
app measurements inthe presence and absence of CO2/HCO3
− buffer (14, 28).Cytoplasmic H+ diffusion was triggered by photolytically
uncaging H+ ions in one region of an RBC from the donor6-nitroveratraldehyde (NVA; 1 mM) (Fig. 4A). To ensure thatDH
app measurements relate to physiological pHi, starting pHi
was offset to an alkaline level by raising superfusate pH to 7.8.Under superfusion with CO2/HCO3
−-free (Hepes-buffered) so-lutions, cytoplasmic H+ transport is facilitated by Hb molecules.
Fig. 3. Effect of osmotic manipulations on transport properties in wild-type (WT) RBCs. (A) Changes in osmolarity brought about by adding or removingsuperfusate NaCl affect MCV, MCHC, and cell height (ratio of MCV to cell area). Mean ± SEM. (B) Both hypo- and hyperosmotic conditions slow the process ofO2 unloading, which is quantified in terms of time constant τO2. (C) Biphasic relationship between osmolarity and τO2, with a nadir at physiological osmolarity.Mean ± variance (n = 3,688, 1,002, 3,680, 1,609, 895, and 841 from WT3 and WT4). (D) Deep-Red/Green ratio response to reversible cell swelling triggered byaquaporin-mediated glycerol influx under constant tonicity (100 mM glycerol replacing 100 mM sucrose). Experiments were performed under hypo- (+65 mMNaCl) and hypertonic (+140 mM NaCl) conditions. (E) Time constant of fluorescence ratio changes in response to glycerol influx (Upper) and efflux (Lower). (F)Glycerol permeability increases under hypotonic conditions. Mean ± SEM (n = 511 and 1,030 from WT3 and WT4). Equilibrium MCVs were 79 fL in 140 mMNaCl + 100 mM sucrose, 86 fL in 140 mM NaCl + 100 mM glycerol, 123 fL in 65 mM NaCl + 100 mM sucrose, and 148 fL in 65 mM NaCl + 100 mM glycerol. (G) pHi
imaged in cSNARF1-loaded RBCs during a protocol that measures permeability to acetic acid. Cells were rapidly exposed to Na-acetate (65 mM) in thepresence of DIDS (250 μM) to block AE1 activity. The rate of pHi change is a readout of acetic acid entry, which was measured over a range of osmolarity. (H)Hypo- and hyperosmotic conditions modestly affect membrane permeability to acetic acid. (I) A decrease in osmolarity modestly increases the product ofacetic acid permeability and SA. Mean ± SEM (n = 930, 1,658, 1,500 from WT3 and WT4). (J) pHi imaged in cSNARF1-loaded RBCs during a protocol thatmeasures AE1 activity. Extracellular pH was rapidly dropped from 7.4 to 6.8, and the rate of pHi change provides a readout of Cl−/OH− exchange, which wasprobed over a range of osmolarity. (K) Hypo- and hyperosmotic conditions affect AE1 activity. (L) A decrease in osmolarity increases the product of AE1activity coefficient and SA. Mean ± SEM (n = 426, 730, 662 from WT3 and WT4). *Significant difference to physiological osmolarity.
Richardson et al. PNAS | May 5, 2020 | vol. 117 | no. 18 | 10071
PHYS
IOLO
GY
Dow
nloa
ded
by g
uest
on
Aug
ust 2
, 202
0
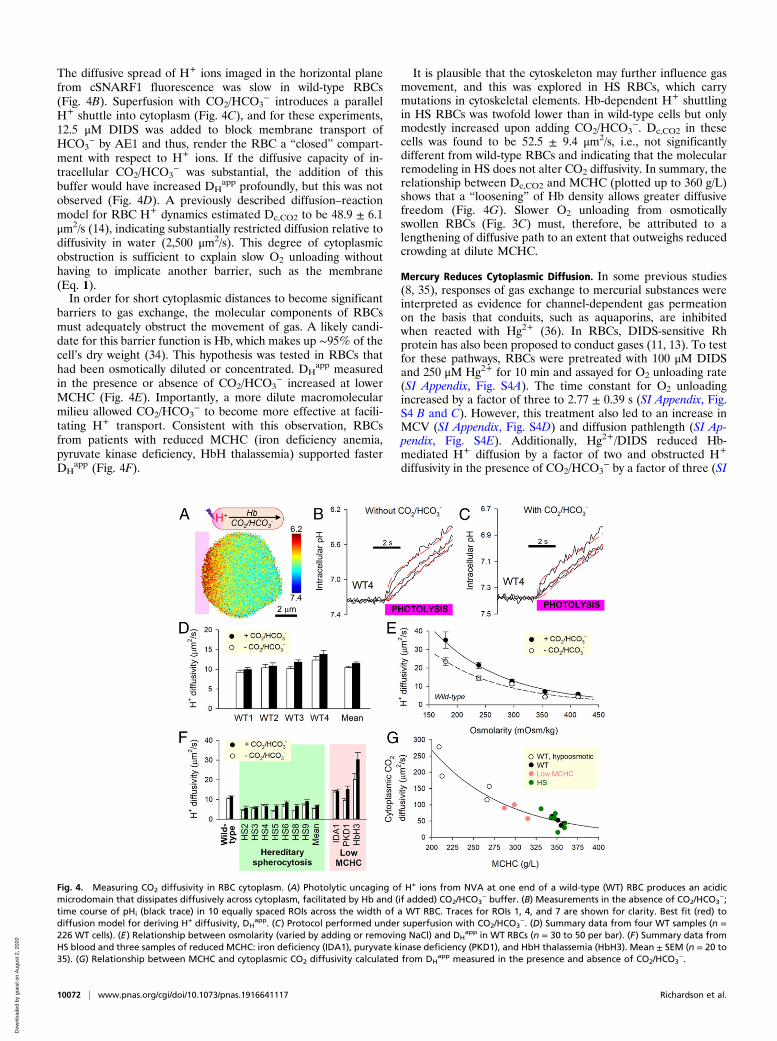
The diffusive spread of H+ ions imaged in the horizontal planefrom cSNARF1 fluorescence was slow in wild-type RBCs(Fig. 4B). Superfusion with CO2/HCO3
− introduces a parallelH+ shuttle into cytoplasm (Fig. 4C), and for these experiments,12.5 μM DIDS was added to block membrane transport ofHCO3
− by AE1 and thus, render the RBC a “closed” compart-ment with respect to H+ ions. If the diffusive capacity of in-tracellular CO2/HCO3
− was substantial, the addition of thisbuffer would have increased DH
app profoundly, but this was notobserved (Fig. 4D). A previously described diffusion–reactionmodel for RBC H+ dynamics estimated Dc,CO2 to be 48.9 ± 6.1μm2/s (14), indicating substantially restricted diffusion relative todiffusivity in water (2,500 μm2/s). This degree of cytoplasmicobstruction is sufficient to explain slow O2 unloading withouthaving to implicate another barrier, such as the membrane(Eq. 1).In order for short cytoplasmic distances to become significant
barriers to gas exchange, the molecular components of RBCsmust adequately obstruct the movement of gas. A likely candi-date for this barrier function is Hb, which makes up ∼95% of thecell’s dry weight (34). This hypothesis was tested in RBCs thathad been osmotically diluted or concentrated. DH
app measuredin the presence or absence of CO2/HCO3
− increased at lowerMCHC (Fig. 4E). Importantly, a more dilute macromolecularmilieu allowed CO2/HCO3
− to become more effective at facili-tating H+ transport. Consistent with this observation, RBCsfrom patients with reduced MCHC (iron deficiency anemia,pyruvate kinase deficiency, HbH thalassemia) supported fasterDH
app (Fig. 4F).
It is plausible that the cytoskeleton may further influence gasmovement, and this was explored in HS RBCs, which carrymutations in cytoskeletal elements. Hb-dependent H+ shuttlingin HS RBCs was twofold lower than in wild-type cells but onlymodestly increased upon adding CO2/HCO3
−. Dc,CO2 in thesecells was found to be 52.5 ± 9.4 μm2/s, i.e., not significantlydifferent from wild-type RBCs and indicating that the molecularremodeling in HS does not alter CO2 diffusivity. In summary, therelationship between Dc,CO2 and MCHC (plotted up to 360 g/L)shows that a “loosening” of Hb density allows greater diffusivefreedom (Fig. 4G). Slower O2 unloading from osmoticallyswollen RBCs (Fig. 3C) must, therefore, be attributed to alengthening of diffusive path to an extent that outweighs reducedcrowding at dilute MCHC.
Mercury Reduces Cytoplasmic Diffusion. In some previous studies(8, 35), responses of gas exchange to mercurial substances wereinterpreted as evidence for channel-dependent gas permeationon the basis that conduits, such as aquaporins, are inhibitedwhen reacted with Hg2+ (36). In RBCs, DIDS-sensitive Rhprotein has also been proposed to conduct gases (11, 13). To testfor these pathways, RBCs were pretreated with 100 μM DIDSand 250 μM Hg2+ for 10 min and assayed for O2 unloading rate(SI Appendix, Fig. S4A). The time constant for O2 unloadingincreased by a factor of three to 2.77 ± 0.39 s (SI Appendix, Fig.S4 B and C). However, this treatment also led to an increase inMCV (SI Appendix, Fig. S4D) and diffusion pathlength (SI Ap-pendix, Fig. S4E). Additionally, Hg2+/DIDS reduced Hb-mediated H+ diffusion by a factor of two and obstructed H+
diffusivity in the presence of CO2/HCO3− by a factor of three (SI
Fig. 4. Measuring CO2 diffusivity in RBC cytoplasm. (A) Photolytic uncaging of H+ ions from NVA at one end of a wild-type (WT) RBC produces an acidicmicrodomain that dissipates diffusively across cytoplasm, facilitated by Hb and (if added) CO2/HCO3
− buffer. (B) Measurements in the absence of CO2/HCO3−;
time course of pHi (black trace) in 10 equally spaced ROIs across the width of a WT RBC. Traces for ROIs 1, 4, and 7 are shown for clarity. Best fit (red) todiffusion model for deriving H+ diffusivity, DH
app. (C) Protocol performed under superfusion with CO2/HCO3−. (D) Summary data from four WT samples (n =
226 WT cells). (E) Relationship between osmolarity (varied by adding or removing NaCl) and DHapp in WT RBCs (n = 30 to 50 per bar). (F) Summary data from
HS blood and three samples of reduced MCHC: iron deficiency (IDA1), puryvate kinase deficiency (PKD1), and HbH thalassemia (HbH3). Mean ± SEM (n = 20 to35). (G) Relationship between MCHC and cytoplasmic CO2 diffusivity calculated from DH
app measured in the presence and absence of CO2/HCO3−.
10072 | www.pnas.org/cgi/doi/10.1073/pnas.1916641117 Richardson et al.
Dow
nloa
ded
by g
uest
on
Aug
ust 2
, 202
0
Appendix, Fig. S4F). Taken together, the threefold slowing of O2exchange in Hg2+/DIDS-treated RBCs can be explained by amore tortuous cytoplasmic environment for diffusion and anexpanded pathlength without necessarily implicating changes tomembrane properties.
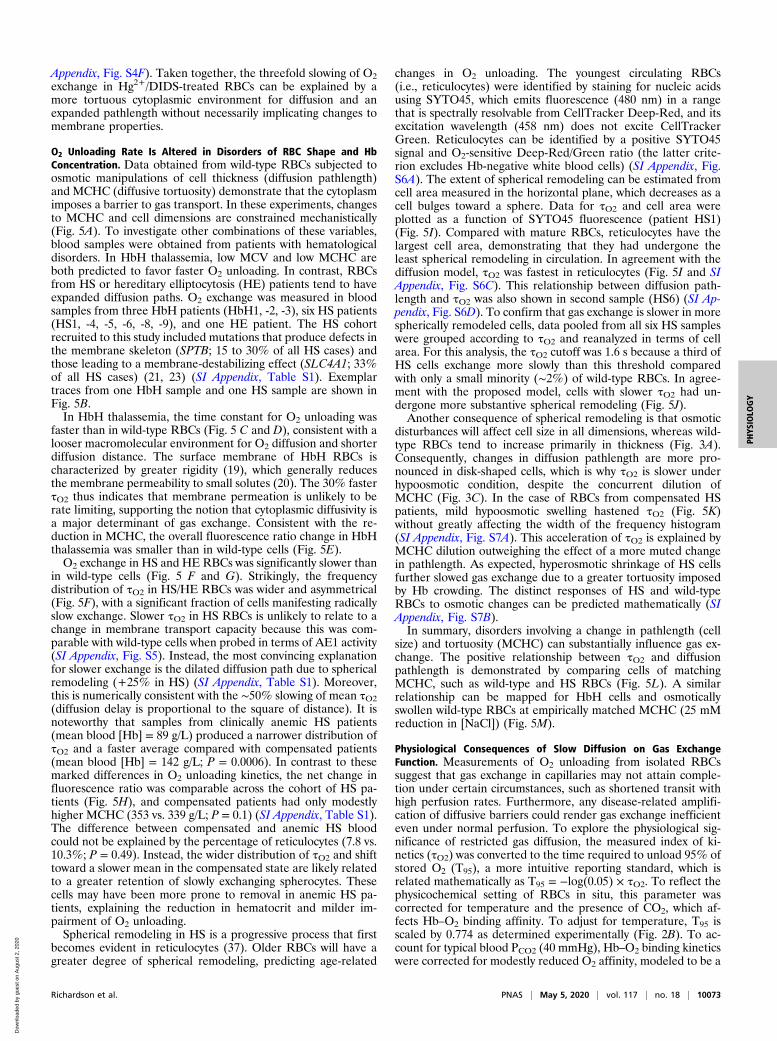
O2 Unloading Rate Is Altered in Disorders of RBC Shape and HbConcentration. Data obtained from wild-type RBCs subjected toosmotic manipulations of cell thickness (diffusion pathlength)and MCHC (diffusive tortuosity) demonstrate that the cytoplasmimposes a barrier to gas transport. In these experiments, changesto MCHC and cell dimensions are constrained mechanistically(Fig. 5A). To investigate other combinations of these variables,blood samples were obtained from patients with hematologicaldisorders. In HbH thalassemia, low MCV and low MCHC areboth predicted to favor faster O2 unloading. In contrast, RBCsfrom HS or hereditary elliptocytosis (HE) patients tend to haveexpanded diffusion paths. O2 exchange was measured in bloodsamples from three HbH patients (HbH1, -2, -3), six HS patients(HS1, -4, -5, -6, -8, -9), and one HE patient. The HS cohortrecruited to this study included mutations that produce defects inthe membrane skeleton (SPTB; 15 to 30% of all HS cases) andthose leading to a membrane-destabilizing effect (SLC4A1; 33%of all HS cases) (21, 23) (SI Appendix, Table S1). Exemplartraces from one HbH sample and one HS sample are shown inFig. 5B.In HbH thalassemia, the time constant for O2 unloading was
faster than in wild-type RBCs (Fig. 5 C and D), consistent with alooser macromolecular environment for O2 diffusion and shorterdiffusion distance. The surface membrane of HbH RBCs ischaracterized by greater rigidity (19), which generally reducesthe membrane permeability to small solutes (20). The 30% fasterτO2 thus indicates that membrane permeation is unlikely to berate limiting, supporting the notion that cytoplasmic diffusivity isa major determinant of gas exchange. Consistent with the re-duction in MCHC, the overall fluorescence ratio change in HbHthalassemia was smaller than in wild-type cells (Fig. 5E).O2 exchange in HS and HE RBCs was significantly slower than
in wild-type cells (Fig. 5 F and G). Strikingly, the frequencydistribution of τO2 in HS/HE RBCs was wider and asymmetrical(Fig. 5F), with a significant fraction of cells manifesting radicallyslow exchange. Slower τO2 in HS RBCs is unlikely to relate to achange in membrane transport capacity because this was com-parable with wild-type cells when probed in terms of AE1 activity(SI Appendix, Fig. S5). Instead, the most convincing explanationfor slower exchange is the dilated diffusion path due to sphericalremodeling (+25% in HS) (SI Appendix, Table S1). Moreover,this is numerically consistent with the ∼50% slowing of mean τO2(diffusion delay is proportional to the square of distance). It isnoteworthy that samples from clinically anemic HS patients(mean blood [Hb] = 89 g/L) produced a narrower distribution ofτO2 and a faster average compared with compensated patients(mean blood [Hb] = 142 g/L; P = 0.0006). In contrast to thesemarked differences in O2 unloading kinetics, the net change influorescence ratio was comparable across the cohort of HS pa-tients (Fig. 5H), and compensated patients had only modestlyhigher MCHC (353 vs. 339 g/L; P = 0.1) (SI Appendix, Table S1).The difference between compensated and anemic HS bloodcould not be explained by the percentage of reticulocytes (7.8 vs.10.3%; P = 0.49). Instead, the wider distribution of τO2 and shifttoward a slower mean in the compensated state are likely relatedto a greater retention of slowly exchanging spherocytes. Thesecells may have been more prone to removal in anemic HS pa-tients, explaining the reduction in hematocrit and milder im-pairment of O2 unloading.Spherical remodeling in HS is a progressive process that first
becomes evident in reticulocytes (37). Older RBCs will have agreater degree of spherical remodeling, predicting age-related
changes in O2 unloading. The youngest circulating RBCs(i.e., reticulocytes) were identified by staining for nucleic acidsusing SYTO45, which emits fluorescence (480 nm) in a rangethat is spectrally resolvable from CellTracker Deep-Red, and itsexcitation wavelength (458 nm) does not excite CellTrackerGreen. Reticulocytes can be identified by a positive SYTO45signal and O2-sensitive Deep-Red/Green ratio (the latter crite-rion excludes Hb-negative white blood cells) (SI Appendix, Fig.S6A). The extent of spherical remodeling can be estimated fromcell area measured in the horizontal plane, which decreases as acell bulges toward a sphere. Data for τO2 and cell area wereplotted as a function of SYTO45 fluorescence (patient HS1)(Fig. 5I). Compared with mature RBCs, reticulocytes have thelargest cell area, demonstrating that they had undergone theleast spherical remodeling in circulation. In agreement with thediffusion model, τO2 was fastest in reticulocytes (Fig. 5I and SIAppendix, Fig. S6C). This relationship between diffusion path-length and τO2 was also shown in second sample (HS6) (SI Ap-pendix, Fig. S6D). To confirm that gas exchange is slower in morespherically remodeled cells, data pooled from all six HS sampleswere grouped according to τO2 and reanalyzed in terms of cellarea. For this analysis, the τO2 cutoff was 1.6 s because a third ofHS cells exchange more slowly than this threshold comparedwith only a small minority (∼2%) of wild-type RBCs. In agree-ment with the proposed model, cells with slower τO2 had un-dergone more substantive spherical remodeling (Fig. 5J).Another consequence of spherical remodeling is that osmotic
disturbances will affect cell size in all dimensions, whereas wild-type RBCs tend to increase primarily in thickness (Fig. 3A).Consequently, changes in diffusion pathlength are more pro-nounced in disk-shaped cells, which is why τO2 is slower underhypoosmotic condition, despite the concurrent dilution ofMCHC (Fig. 3C). In the case of RBCs from compensated HSpatients, mild hypoosmotic swelling hastened τO2 (Fig. 5K)without greatly affecting the width of the frequency histogram(SI Appendix, Fig. S7A). This acceleration of τO2 is explained byMCHC dilution outweighing the effect of a more muted changein pathlength. As expected, hyperosmotic shrinkage of HS cellsfurther slowed gas exchange due to a greater tortuosity imposedby Hb crowding. The distinct responses of HS and wild-typeRBCs to osmotic changes can be predicted mathematically (SIAppendix, Fig. S7B).In summary, disorders involving a change in pathlength (cell
size) and tortuosity (MCHC) can substantially influence gas ex-change. The positive relationship between τO2 and diffusionpathlength is demonstrated by comparing cells of matchingMCHC, such as wild-type and HS RBCs (Fig. 5L). A similarrelationship can be mapped for HbH cells and osmoticallyswollen wild-type RBCs at empirically matched MCHC (25 mMreduction in [NaCl]) (Fig. 5M).
Physiological Consequences of Slow Diffusion on Gas ExchangeFunction. Measurements of O2 unloading from isolated RBCssuggest that gas exchange in capillaries may not attain comple-tion under certain circumstances, such as shortened transit withhigh perfusion rates. Furthermore, any disease-related amplifi-cation of diffusive barriers could render gas exchange inefficienteven under normal perfusion. To explore the physiological sig-nificance of restricted gas diffusion, the measured index of ki-netics (τO2) was converted to the time required to unload 95% ofstored O2 (T95), a more intuitive reporting standard, which isrelated mathematically as T95 = −log(0.05) × τO2. To reflect thephysicochemical setting of RBCs in situ, this parameter wascorrected for temperature and the presence of CO2, which af-fects Hb–O2 binding affinity. To adjust for temperature, T95 isscaled by 0.774 as determined experimentally (Fig. 2B). To ac-count for typical blood PCO2 (40 mmHg), Hb–O2 binding kineticswere corrected for modestly reduced O2 affinity, modeled to be a
Richardson et al. PNAS | May 5, 2020 | vol. 117 | no. 18 | 10073
PHYS
IOLO
GY
Dow
nloa
ded
by g
uest
on
Aug
ust 2
, 202
0
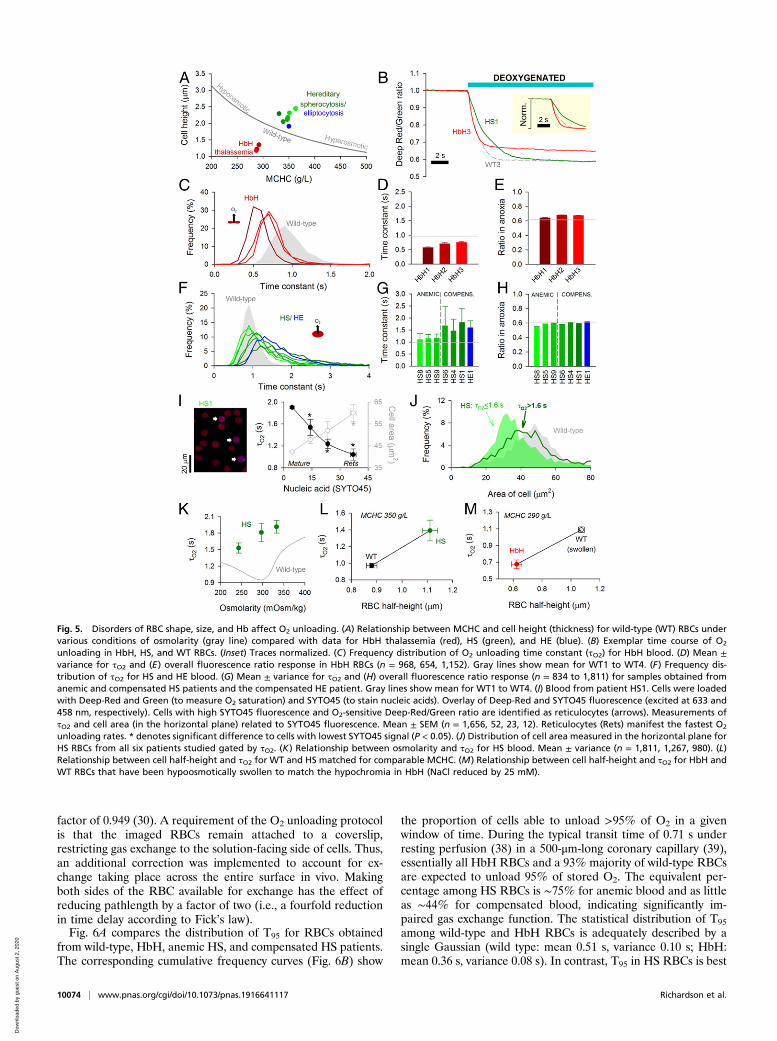
factor of 0.949 (30). A requirement of the O2 unloading protocolis that the imaged RBCs remain attached to a coverslip,restricting gas exchange to the solution-facing side of cells. Thus,an additional correction was implemented to account for ex-change taking place across the entire surface in vivo. Makingboth sides of the RBC available for exchange has the effect ofreducing pathlength by a factor of two (i.e., a fourfold reductionin time delay according to Fick’s law).Fig. 6A compares the distribution of T95 for RBCs obtained
from wild-type, HbH, anemic HS, and compensated HS patients.The corresponding cumulative frequency curves (Fig. 6B) show
the proportion of cells able to unload >95% of O2 in a givenwindow of time. During the typical transit time of 0.71 s underresting perfusion (38) in a 500-μm-long coronary capillary (39),essentially all HbH RBCs and a 93% majority of wild-type RBCsare expected to unload 95% of stored O2. The equivalent per-centage among HS RBCs is ∼75% for anemic blood and as littleas ∼44% for compensated blood, indicating significantly im-paired gas exchange function. The statistical distribution of T95
among wild-type and HbH RBCs is adequately described by asingle Gaussian (wild type: mean 0.51 s, variance 0.10 s; HbH:mean 0.36 s, variance 0.08 s). In contrast, T95 in HS RBCs is best
Fig. 5. Disorders of RBC shape, size, and Hb affect O2 unloading. (A) Relationship between MCHC and cell height (thickness) for wild-type (WT) RBCs undervarious conditions of osmolarity (gray line) compared with data for HbH thalassemia (red), HS (green), and HE (blue). (B) Exemplar time course of O2
unloading in HbH, HS, and WT RBCs. (Inset) Traces normalized. (C) Frequency distribution of O2 unloading time constant (τO2) for HbH blood. (D) Mean ±variance for τO2 and (E) overall fluorescence ratio response in HbH RBCs (n = 968, 654, 1,152). Gray lines show mean for WT1 to WT4. (F) Frequency dis-tribution of τO2 for HS and HE blood. (G) Mean ± variance for τO2 and (H) overall fluorescence ratio response (n = 834 to 1,811) for samples obtained fromanemic and compensated HS patients and the compensated HE patient. Gray lines show mean for WT1 to WT4. (I) Blood from patient HS1. Cells were loadedwith Deep-Red and Green (to measure O2 saturation) and SYTO45 (to stain nucleic acids). Overlay of Deep-Red and SYTO45 fluorescence (excited at 633 and458 nm, respectively). Cells with high SYTO45 fluorescence and O2-sensitive Deep-Red/Green ratio are identified as reticulocytes (arrows). Measurements ofτO2 and cell area (in the horizontal plane) related to SYTO45 fluorescence. Mean ± SEM (n = 1,656, 52, 23, 12). Reticulocytes (Rets) manifest the fastest O2
unloading rates. * denotes significant difference to cells with lowest SYTO45 signal (P < 0.05). (J) Distribution of cell area measured in the horizontal plane forHS RBCs from all six patients studied gated by τO2. (K) Relationship between osmolarity and τO2 for HS blood. Mean ± variance (n = 1,811, 1,267, 980). (L)Relationship between cell half-height and τO2 for WT and HS matched for comparable MCHC. (M) Relationship between cell half-height and τO2 for HbH andWT RBCs that have been hypoosmotically swollen to match the hypochromia in HbH (NaCl reduced by 25 mM).
10074 | www.pnas.org/cgi/doi/10.1073/pnas.1916641117 Richardson et al.
Dow
nloa
ded
by g
uest
on
Aug
ust 2
, 202
0
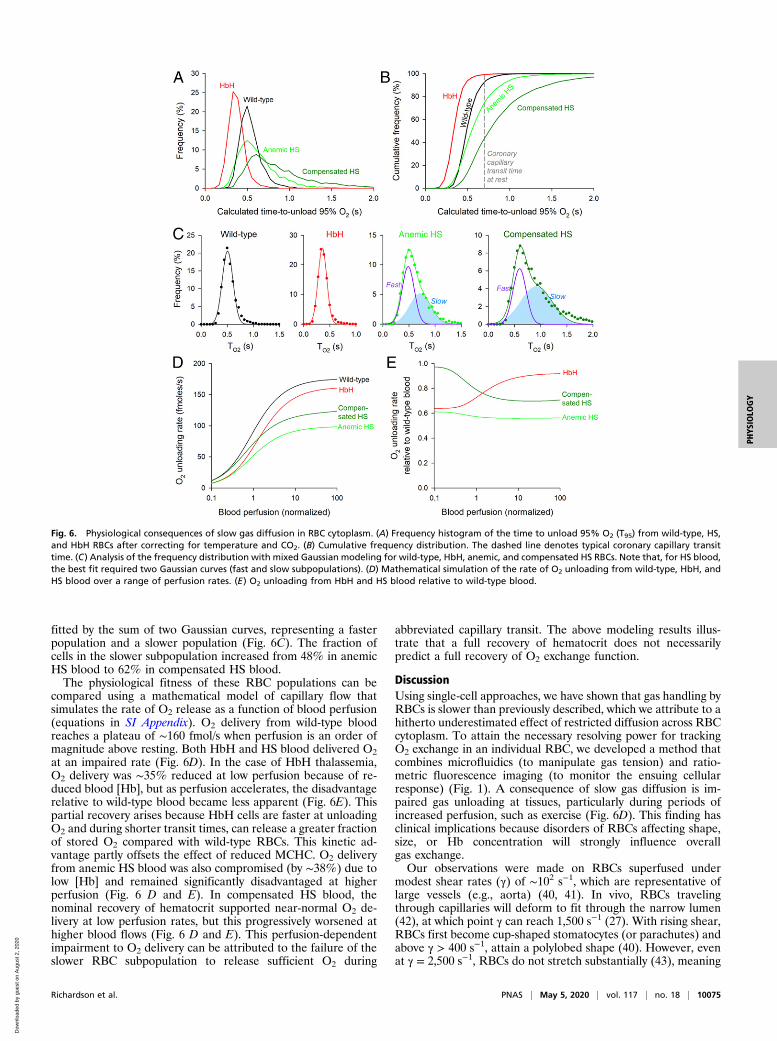
fitted by the sum of two Gaussian curves, representing a fasterpopulation and a slower population (Fig. 6C). The fraction ofcells in the slower subpopulation increased from 48% in anemicHS blood to 62% in compensated HS blood.The physiological fitness of these RBC populations can be
compared using a mathematical model of capillary flow thatsimulates the rate of O2 release as a function of blood perfusion(equations in SI Appendix). O2 delivery from wild-type bloodreaches a plateau of ∼160 fmol/s when perfusion is an order ofmagnitude above resting. Both HbH and HS blood delivered O2at an impaired rate (Fig. 6D). In the case of HbH thalassemia,O2 delivery was ∼35% reduced at low perfusion because of re-duced blood [Hb], but as perfusion accelerates, the disadvantagerelative to wild-type blood became less apparent (Fig. 6E). Thispartial recovery arises because HbH cells are faster at unloadingO2 and during shorter transit times, can release a greater fractionof stored O2 compared with wild-type RBCs. This kinetic ad-vantage partly offsets the effect of reduced MCHC. O2 deliveryfrom anemic HS blood was also compromised (by ∼38%) due tolow [Hb] and remained significantly disadvantaged at higherperfusion (Fig. 6 D and E). In compensated HS blood, thenominal recovery of hematocrit supported near-normal O2 de-livery at low perfusion rates, but this progressively worsened athigher blood flows (Fig. 6 D and E). This perfusion-dependentimpairment to O2 delivery can be attributed to the failure of theslower RBC subpopulation to release sufficient O2 during
abbreviated capillary transit. The above modeling results illus-trate that a full recovery of hematocrit does not necessarilypredict a full recovery of O2 exchange function.
DiscussionUsing single-cell approaches, we have shown that gas handling byRBCs is slower than previously described, which we attribute to ahitherto underestimated effect of restricted diffusion across RBCcytoplasm. To attain the necessary resolving power for trackingO2 exchange in an individual RBC, we developed a method thatcombines microfluidics (to manipulate gas tension) and ratio-metric fluorescence imaging (to monitor the ensuing cellularresponse) (Fig. 1). A consequence of slow gas diffusion is im-paired gas unloading at tissues, particularly during periods ofincreased perfusion, such as exercise (Fig. 6D). This finding hasclinical implications because disorders of RBCs affecting shape,size, or Hb concentration will strongly influence overallgas exchange.Our observations were made on RBCs superfused under
modest shear rates (γ) of ∼102 s−1, which are representative oflarge vessels (e.g., aorta) (40, 41). In vivo, RBCs travelingthrough capillaries will deform to fit through the narrow lumen(42), at which point γ can reach 1,500 s−1 (27). With rising shear,RBCs first become cup-shaped stomatocytes (or parachutes) andabove γ > 400 s−1, attain a polylobed shape (40). However, evenat γ = 2,500 s−1, RBCs do not stretch substantially (43), meaning
Fig. 6. Physiological consequences of slow gas diffusion in RBC cytoplasm. (A) Frequency histogram of the time to unload 95% O2 (T95) from wild-type, HS,and HbH RBCs after correcting for temperature and CO2. (B) Cumulative frequency distribution. The dashed line denotes typical coronary capillary transittime. (C) Analysis of the frequency distribution with mixed Gaussian modeling for wild-type, HbH, anemic, and compensated HS RBCs. Note that, for HS blood,the best fit required two Gaussian curves (fast and slow subpopulations). (D) Mathematical simulation of the rate of O2 unloading from wild-type, HbH, andHS blood over a range of perfusion rates. (E) O2 unloading from HbH and HS blood relative to wild-type blood.
Richardson et al. PNAS | May 5, 2020 | vol. 117 | no. 18 | 10075
PHYS
IOLO
GY
Dow
nloa
ded
by g
uest
on
Aug
ust 2
, 202
0
that their critical thickness remains a significant diffusionalbarrier, not dissimilar to that in discocytes. Early experimentaldesigns based on highly viscous media (to increase γ) reportedtank treading, which results in elliptically stretched (i.e., thinner)RBCs (44, 45). However, tank treading is not normally observedin media of physiological viscosity (27, 41, 46) or in narrowvessels at high γ (41). Although our method does not re-capitulate the shear rates in capillaries, it stabilizes cell thicknessat a level that is relevant to physiologically deformed cells forrobust measurements of diffusional delays.Our measurements of O2 unloading indicate that membrane
permeation and cytoplasmic diffusion collectively reduce O2diffusivity in wild-type RBCs to <70 μm2/s (i.e., a >35-fold de-crease relative to plasma) (3, 29). Based on several independentlines of evidence, we show that the majority of this restriction isattributable to slow cytoplasmic diffusion rather than slowmembrane permeation. We first show that CO2 diffuses at ∼50μm2/s in the cytoplasmic compartment (Fig. 4D). To arrive at thisvalue, we applied a previously published method (14) that probesthe dissipation of cytoplasmic solute gradients at the subcellularlevel and therefore, is not sensitive to membrane properties.Given that O2 and CO2 have similar diffusive properties inplasma, a substantial resistance to gas transport must reside inthe cytoplasm. Using osmotically diluted wild-type cells andRBCs from individuals of low MCHC, we show that this cyto-plasmic barrier arises from macromolecular crowding becauseCO2 diffusivity halves with every 62-g/L rise in MCHC (Fig. 4G).A separate line of evidence in favor of rate-setting cytoplasmic
diffusion is the response of O2 unloading to changes in diffusionpathlength. Osmotic swelling of wild-type RBCs decreases therate of O2 unloading (Fig. 3C), despite a concurrent dilution ofHb and a general increase in membrane permeability properties.The latter was probed by analyzing acetic acid entry across thelipid bilayer (Fig. 3I), aquaporin-mediated glycerol transport(Fig. 3F), and AE1-dependent Cl−/OH− exchange (Fig. 3L).Although the permeability of these solutes will be different toO2, these measurements provide readouts of how the distinctroutes for gas entry (the lipid bilayer and gas channels) mayrespond to osmotic stretch. In all three cases, stretch increasedconductance, which is also a likely response of O2 permeation.The overall slowing of gas exchange in hypotonically swollenRBCs must, therefore, relate to the expanded diffusion path inswollen cytoplasm. The importance of pathlength was alsodemonstrated in RBCs from HbH thalassemia and HS patients(Fig. 5). Compared with wild-type RBCs, O2 unloading fromHbH cells was faster (Fig. 5 C and D), which our model canexplain in terms of a shorter diffusion path acting in concert withlower MCHC (less tortuous cytoplasm). The argument for rate-setting cytoplasmic diffusion is strengthened by the observationthat HbH cells also have higher Hb–O2 affinity (18) and a morerigid (19) [hence, less permeable (20)] surface membrane, twofactors that would have reduced gas exchange kinetics, if ratelimiting. HS blood contains RBCs manifesting a range of geo-metrical remodeling, and the most spherical cells (i.e., bearingthe longest cytoplasmic pathlength) were found to exchangegases slower (Fig. 5J). In a sample of HS blood, O2 unloadingwas fastest in reticulocytes (i.e., the youngest RBCs in circula-tion) (Fig. 5I and SI Appendix, Fig. S6). Compared with matureRBCs, reticulocytes have modestly greater volume (+20%) (37),but the majority of this difference is transmitted to a growth inhorizontal cell area (+40%) (Fig. 5I). Consequently, HS retic-ulocytes are thinner than mature RBCs, consistent with the no-tion that they had the least time in circulation to undergospherical remodeling. Additionally, reticulocytes have modestlylower MCHC (−15%) (SI Appendix, Fig. S6B) (37), which alsocontributes toward faster gas exchange, in agreement with ourproposed model. The prominence of the cytoplasmic barrier insetting gas exchange is illustrated by the Fickian relationship
between diffusion distance and time delay plotted for cells atmatching MCHC (Fig. 5 L and M).Overall, our evidence is not supportive of rate-limiting mem-
brane permeation. For instance, if the membrane was rate lim-iting for O2 unloading, then we would have expected faster ratesin osmotically swollen wild-type RBCs (due to an activation ofmembrane permeability properties) (Fig. 3) and slower exchangein HbH cells [due to increased rigidity (19, 20)], but neither ofthese were observed. While we confirm that blockers of putativegas channels (Hg2+/DIDS) slow O2 unloading, we attribute thiseffect to an expansion of pathlength and further slowing of cy-toplasmic diffusivity (SI Appendix, Fig. S4) rather than a changein membrane permeability. The sensitivity of gas transport to cellthickness highlights the importance of accounting for cell di-mensions when interpreting measurements of gas handling inresponse to drugs or in disease models. Moreover, a cell mem-brane can be erroneously attributed a low permeability constantif it is adjacent to a high-resistance cytoplasmic barrier, but themeasurement technique assumes fast diffusion in cytoplasm.Given that our method for tracking O2 exchange has single-
cell resolution, we have been able to describe populations of cellsin terms of a tangible measure of RBC physiological fitness.Frequency histograms can readily identify subpopulations, whichwould otherwise be disguised in pooled population measure-ments. While wild-type and HbH RBCs are a relatively ho-mogenous population, results from HS patients present evidencefor a large subpopulation of spherocytes with significantly im-paired gas exchange (Fig. 6C). This slow population was moreevident in HS patients with compensated [Hb], which could notbe explained in terms of the percentage of reticulocytes (SIAppendix, Table S1) or a change in the transport capacity of themembrane (probed in terms of AE1 activity) (SI Appendix, Fig.S5). Instead, the likely reason for the broader distribution of τO2and shift toward a lower mean is that the compensated statearises from a retention of spherocytes with longer diffusionpathlengths. Thus, the recovery of hematocrit comes at the priceof a slower population-averaged rate of O2 unloading. Sincethese spherical RBCs also have altered deformability (47), gasexchange may be further compromised at the high shear ratesinside capillaries.Findings described herein can influence clinical practice by
providing information about the functional quality of blood, anassessment that is lacking in clinical trials and guidelines re-garding treatments and procedures, such as splenectomy.Changes to gas transport in disorders of blood are largelyinterpreted in terms of hematocrit, and consequently, clinicalguidelines for anemias generally prioritize interventions thatincrease RBC count (48), even if this inadvertently leads to aretention of physiologically inferior cells. However, a full re-covery of hematocrit may not necessarily produce a proportionalimprovement in O2 delivery as this critically depends on thediffusion delays in cells that underpin the reversal of anemia.The rationale for splenectomy, for instance, is to improve ane-mia by systemically withholding RBCs from premature de-struction. While splenectomy is generally advocated intransfusion-dependent HS [European Hematology Association(49)], the recommendations for moderate forms of the disease(two-thirds of patients) are less clear because of the lack of ap-propriate randomized trials (49, 50). While there is evidence thatsplenectomy can ameliorate anemia assayed in terms of O2storage (total [Hb] or hematocrit) (51–53), its effect on gas ex-change kinetics is uncharted. Without such a functional assess-ment, it is not possible to determine whether a splenectomy isphysiologically curative. This information would be important incost–benefit analyses, where infection and thrombosis are majorcomplications of splenectomy (48, 49). As an illustration of theinadequacy of current guidelines, half of children who underwentpartial splenectomy were later found to require a full procedure
10076 | www.pnas.org/cgi/doi/10.1073/pnas.1916641117 Richardson et al.
Dow
nloa
ded
by g
uest
on
Aug
ust 2
, 202
0
to resolve symptoms (49). This observation may suggest thatcontemporary recommendations may overestimate the curativevalue of a partial splenectomy. Future guidelines could improvepredictive power if based on prospective studies that factor thegain in the physiological quality of blood against the risks.Analysis of our nonsplenectomized patient cohort reveals a siz-able proportion of RBCs unable to provide efficient gas delivery(Fig. 6B). Even in HS patients with nominally compensated [Hb]levels, O2 exchange kinetics remain below normal. A full resto-ration of O2 delivery rate would, therefore, require an overshootof hematocrit, which may have unfavorable repercussions (e.g.,increased blood viscosity) and possibly necessitate a more radicalsplenectomy. By monitoring the extent of anemia and obtainingthe population-wide distribution of RBC quality, it would bepossible to predict the extent to which a partial or completesplenectomy improves physiological outcomes. Such informationmay provide insights into the hitherto unexplained variability ofHS patient responses to splenectomy (54).In summary, we describe an approach for interrogating the
physiological quality of RBCs. We use this to identify barriers togas flow, characterize population-level heterogeneity in terms ofgas exchange kinetics, and evaluate the functional consequencesof hematological disorders with single-cell resolution. By pro-viding a kinetic appraisal of blood quality, this method could beimplemented in clinical trials that inform guidelines for theclinical management of hematological disorders. Similarly, itcould perform quality control of blood for transfusion that isknown to undergo spontaneous shape changes during storage(55). The notion of restricted gas diffusion in a protein-rich cy-toplasmic matrix is likely to apply to cells other than RBCs. Thegenesis of tissue hypoxia, which evokes the virtually ubiquitoushypoxia-inducible factor (HIF)-dependent signaling cascade(56), is typically considered in terms of high metabolic O2 con-sumption, but our results indicate that slow O2 diffusion may bean additional biologically regulated variable to consider.
Materials and MethodsPatients and Ethical Approval. Venous blood was obtained from healthyvolunteers and from consenting patients with hematological disorders (HbHthalassemia, HS, HE, pyruvate kinase deficiency) attending the hematologyclinic at Oxford University Hospitals (ethical approval REC 13WA0371).Samples were deidentified prior to use and then, referred to using ananonymized alphanumerical code. Blood parameters were determined byroutine clinical methods (Sysmex XN series) and are listed in SI Appendix,Table S1. Cell volume was measured flow cytometrically and calibrated bystandard procedures. Cell area was measured in CellTracker-labeled RBCs byfluorescence imaging in the horizontal plane during superfusion experi-ments. Area was calibrated by fluorescent beads (Beckman FluoroSphere) ofknown geometry (10 μm in diameter). Mean thickness of cells (also referredto as cell height) was calculated as the ratio of MCV to cell area.
Single-Cell O2 Saturation Imaging. Blood was first diluted 200-fold in Ca2+-freeHepes-buffered Tyrode, and cells were loaded with a mixture of CellTrackerDeep-Red (5 μM) and CellTracker Green (15 μM) in dimethyl sulfoxide(DMSO). For some experiments, cells were also loaded with SYTO45 (Invi-trogen) at 1:1,000 dilution of 5 mM stock. After allowing 10 min for dyeloading, cells were spun down, resuspended in Ca2+-containing solution, andplated on a poly-L-lysine pretreated Perspex superfusion chamber that wasmounted on a Leica LCS confocal system. Cells were superfused with solu-tions at 23 °C or 37 °C. CellTracker Deep-Red and Green dyes were excited
simultaneously by 488- and 633-nm laser lines, and fluorescence was ac-quired by two photomultiplier tubes at 500 to 550 and 650 to 700 nm at7.8 Hz in bidirectional x–y scan mode (128 × 128 pixels) to maximize tem-poral resolution with pinhole at 4 Airy units to maximize signal to back-ground ratio. Fluorescence was ratioed and normalized to starting ratio.
Ultrarapid Solution Switching. A dual microperfusion device (52) released oneof two types of solution (57, 58). One microstream was fed from a reservoirbubbled with O2; the second microstream was fed from a reservoir con-taining 1 mM sodium dithionite and bubbled with N2 to produce anoxia.Under gravity feed, solution flows were first adjusted manually to produceequal velocity; this was visualized as a sharp interstream boundary whenboth solutions were running (57, 58). On average, flow per channel was 8 μL/s. At the outlet of the device (square bore of side 400 μm), the linear velocitywas 50 mm/s, producing shear rates of 102 s−1. At this speed, solution ex-change is rapid but does not produce visible deformation of cells as de-termined by symmetrical cell area and normal cell thickness. Beforemeasurements, the device was flushed to clear stagnant solution, which mayhave become oxygenated prior to experiments. Following this, the devicewas placed upstream within a 200 × 200-μm field of view containing RBCs.After equilibration with the oxygenated microstream, O2 unloading wastriggered by a 30-s exposure to the anoxic microstream.
Cytoplasmic pH Imaging and H+ Uncaging. Blood was first diluted 200-fold inCa2+-free Hepes-buffered Tyrode, and cells were loaded with the pH re-porter cSNARF1 (acetoxymethyl ester; 20 μM). After allowing 10 min forloading, cells were plated on a poly-L-lysine pretreated Perspex superfusionchamber, which was mounted on a Zeiss LSM 700 confocal system. Cells weresuperfused with Ca2+-containing solutions heated to 37 °C. cSNARF1 wasexcited at 555 nm, and emission was collected at 580 and 640 nm by x–ymode scanning and pinhole at 6.3 Airy units. The fluorescence ratio wasconverted to pH using a previously determined calibration curve (59). Touncage H+ ions, 1 mM NVA was added to superfusates, and 405-nm laserlight was guided to photolytically release H+ ions in a region of interest (ROI)at one end of an RBC (width equal to 1/10th of cell diameter). To produce acontinuous source of localized acid loading, uncaging alternated withcSNARF1 imaging every 0.133 s.
Solutions. Hepes-buffered solutions were 130 mM NaCl, 4.5 mM KCl, 1 mMCaCl2, 1 mM MgCl2, 11 mM glucose, and 20 mM Hepes pH adjusted to 6.8,7.4, or 7.8 with 4 M NaOH. CO2/HCO3
−-buffered solutions at pH 7.8 were75 mM NaCl, 4.5 mM KCl, 1 mM CaCl2, 1 mM MgCl2, 11 mM glucose, and55 mM NaHCO3 bubbled with 5% CO2/balanced air. To change osmolarity,the amount of NaCl was varied, and final osmolarity was measured byfreezing point depression (Camlab Osmometer). For osmolarities of 180, 209,238, 267, 297, 326, 355, and 414 mOsm/kg, NaCl values in Hepes-bufferedsolutions were 65, 81.25, 97.5, 113.75, 130, 146.25, 162.5, and 195 mM. Theconcentration of NaCl was reduced accordingly in CO2/HCO3
−-buffered so-lutions (by 55 mM) or in acetate-containing solutions (by 65 mM). For Ca2+-free solution, 1 mM Ca2+ was replaced with 0.5 mM ethylene glycol bis(-b-aminoethyl ether)-N,N,N′,N′-tetraacetic acid. All salts were obtained fromSigma-Aldrich.
Data Availability. All relevant data are included herein or in SI Appendix. Allrelevant clinical information concerning patient samples is given in SI Ap-pendix, Table S1.
ACKNOWLEDGMENTS.We thank Prof. Kenneth Spitzer for training and helpin setting up the dual microperfusion equipment, Kyung Chan Park forcollecting venous blood, Dr. Matthew Frise for access to blood samples, RosieBrady for helpful comments on the manuscript, and Prof. Daniele Dini forperforming calculations relating to shear rate. This work was supported byBritish Heart Foundation Programme Grant RG/15/9/31534 (to P.S.) andCorpus Christi College, Oxford.
1. P. D. Wagner, Diffusion and chemical reaction in pulmonary gas exchange. Physiol.
Rev. 57, 257–312 (1977).2. W. F. Boron, V. Endeward, G. Gros, R. Musa-Aziz, P. Pohl, Intrinsic CO2 permeability of
cell membranes and potential biological relevance of CO2 channels. ChemPhysChem
12, 1017–1019 (2011).3. S. Chakraborty, V. Balakotaiah, A. Bidani, Diffusing capacity reexamined: Relative
roles of diffusion and chemical reaction in red cell uptake of O2, CO, CO2, and NO.
J. Appl. Physiol. 97, 2284–2302 (2004).4. C. Geers, G. Gros, Carbon dioxide transport and carbonic anhydrase in blood and
muscle. Physiol. Rev. 80, 681–715 (2000).
5. G. Gros, W. Moll, The diffusion of carbon dioxide in erythrocytes and hemoglobin
solutions. Pflugers Arch. 324, 249–266 (1971).6. K. D. Vandegriff, J. S. Olson, Morphological and physiological factors affecting oxygen
uptake and release by red blood cells. J. Biol. Chem. 259, 12619–12627 (1984).7. K. D. Vandegriff, J. S. Olson, The kinetics of O2 release by human red blood cells in the
presence of external sodium dithionite. J. Biol. Chem. 259, 12609–12618 (1984).8. W. F. Boron, Sharpey-schafer lecture: Gas channels. Exp. Physiol. 95, 1107–1130 (2010).9. V. Endeward, S. Al-Samir, F. Itel, G. Gros, How does carbon dioxide permeate cell
membranes? A discussion of concepts, results and methods. Front. Physiol. 4, 382
(2014).
Richardson et al. PNAS | May 5, 2020 | vol. 117 | no. 18 | 10077
PHYS
IOLO
GY
Dow
nloa
ded
by g
uest
on
Aug
ust 2
, 202
0
10. V. Endeward, J. P. Cartron, P. Ripoche, G. Gros, Red cell membrane CO2 permeabilityin normal human blood and in blood deficient in various blood groups, and effect ofDIDS. Transfus. Clin. Biol. 13, 123–127 (2006).
11. V. Endeward, J. P. Cartron, P. Ripoche, G. Gros, RhAG protein of the Rhesus complex isa CO2 channel in the human red cell membrane. FASEB J. 22, 64–73 (2008).
12. V. Endeward, G. Gros, Low carbon dioxide permeability of the apical epithelialmembrane of Guinea-pig colon. J. Physiol. 567, 253–265 (2005).
13. V. Endeward et al., Evidence that aquaporin 1 is a major pathway for CO2 transportacross the human erythrocyte membrane. FASEB J. 20, 1974–1981 (2006).
14. S. L. Richardson, P. Swietach, Red blood cell thickness is evolutionarily constrained byslow, hemoglobin-restricted diffusion in cytoplasm. Sci. Rep. 6, 36018 (2016).
15. C. Hannesschlaeger, A. Horner, P. Pohl, Intrinsic membrane permeability to smallmolecules. Chem. Rev. 119, 5922–5953 (2019).
16. D. Aslan, F. Gümrük, A. Gürgey, C. Altay, Importance of RDW value in differentialdiagnosis of hypochrome anemias. Am. J. Hematol. 69, 31–33 (2002).
17. S. Bouri, J. Martin, Investigation of iron deficiency anaemia. Clin. Med. 18, 242–244(2018).
18. R. Galanello, A. Cao, Gene test review. Alpha-thalassemia. Genet. Med. 13, 83–88(2011).
19. S. L. Schrier, E. Rachmilewitz, N. Mohandas, Cellular and membrane properties ofalpha and beta thalassemic erythrocytes are different: Implication for differences inclinical manifestations. Blood 74, 2194–2202 (1989).
20. M. B. Lande, J. M. Donovan, M. L. Zeidel, The relationship between membrane fluidityand permeabilities to water, solutes, ammonia, and protons. J. Gen. Physiol. 106,67–84 (1995).
21. S. Perrotta, P. G. Gallagher, N. Mohandas, Hereditary spherocytosis. Lancet 372,1411–1426 (2008).
22. J. Delaunay, The molecular basis of hereditary red cell membrane disorders. BloodRev. 21, 1–20 (2007).
23. S. Eber, S. E. Lux, Hereditary spherocytosis—defects in proteins that connect themembrane skeleton to the lipid bilayer. Semin. Hematol. 41, 118–141 (2004).
24. L. A. Michaels, A. R. Cohen, H. Zhao, R. I. Raphael, C. S. Manno, Screening for he-reditary spherocytosis by use of automated erythrocyte indexes. J. Pediatr. 130,957–960 (1997).
25. D. Kutter, N. Coulon, F. Stirn, M. Thoma, J. Janecki, Demonstration and quantificationof “hyperchromic” erythrocytes by haematological analysers. Application to screen-ing for hereditary and acquired spherocytosis. Clin. Lab. 48, 163–170 (2002).
26. P. Connes et al., The role of blood rheology in sickle cell disease. Blood Rev. 30,111–118 (2016).
27. E. Nader et al., Blood rheology: Key parameters, impact on blood flow, role in sicklecell disease and effects of exercise. Front. Physiol. 10, 1329 (2019).
28. P. Swietach et al., Modelling intracellular H(+) ion diffusion. Prog. Biophys. Mol. Biol.83, 69–100 (2003).
29. J. S. Olson, E. W. Foley, D. H. Maillett, E. V. Paster, “Measurement of rate constants forreactions of O2, CO, and NO with hemoglobin” in Hemoglobin Disorders: Methods inMolecular Biology, R. L. Nagel, Ed. (Humana Press, Totowa, NJ, 2003), vol. 82, p.65–91.
30. R. K. Dash, B. Korman, J. B. Bassingthwaighte, Simple accurate mathematical modelsof blood HbO2 and HbCO2 dissociation curves at varied physiological conditions:Evaluation and comparison with other models. Eur. J. Appl. Physiol. 116, 97–113(2016).
31. P. Han, D. M. Bartels, Temperature dependence of oxygen diffusion in H2O and D2O.J. Phys. Chem. 100, 5597–5602 (1996).
32. N. Roudier, J. M. Verbavatz, C. Maurel, P. Ripoche, F. Tacnet, Evidence for the pres-ence of aquaporin-3 in human red blood cells. J. Biol. Chem. 273, 8407–8412 (1998).
33. A. Madeira, T. F. Moura, G. Soveral, Detecting aquaporin function and regulation.Front Chem. 4, 3 (2016).
34. S. Longeville, L. R. Stingaciu, Hemoglobin diffusion and the dynamics of oxygencapture by red blood cells. Sci. Rep. 7, 10448 (2017).
35. G. J. Cooper, W. F. Boron, Effect of PCMBS on CO2 permeability of Xenopus oocytesexpressing aquaporin 1 or its C189S mutant. Am. J. Physiol. 275, C1481–C1486 (1998).
36. L. V. Virkki, C. Franke, P. Somieski, W. F. Boron, Cloning and functional character-ization of a novel aquaporin from Xenopus laevis oocytes. J. Biol. Chem. 277,40610–40616 (2002).
37. L. Da Costa et al., Temporal differences in membrane loss lead to distinct reticulocytefeatures in hereditary spherocytosis and in immune hemolytic anemia. Blood 98,2894–2899 (2001).
38. M. F. Allard, C. T. Kamimura, D. R. English, S. L. Henning, B. R. Wiggs, Regionalmyocardial capillary erythrocyte transit time in the normal resting heart. Circ. Res. 72,187–193 (1993).
39. G. S. Kassab, Y. C. Fung, Topology and dimensions of pig coronary capillary network.Am. J. Physiol. 267, H319–H325 (1994).
40. L. Lanotte et al., Red cells’ dynamic morphologies govern blood shear thinning undermicrocirculatory flow conditions. Proc. Natl. Acad. Sci. U.S.A. 113, 13289–13294 (2016).
41. F. Reichel et al., High-throughput microfluidic characterization of erythrocyte shapesand mechanical variability. Biophys. J. 117, 14–24 (2019).
42. R. Skalak, P. I. Branemark, Deformation of red blood cells in capillaries. Science 164,717–719 (1969).
43. A. M. Forsyth, J. Wan, P. D. Owrutsky, M. Abkarian, H. A. Stone, Multiscale approachto link red blood cell dynamics, shear viscosity, and ATP release. Proc. Natl. Acad. Sci.U.S.A. 108, 10986–10991 (2011).
44. T. M. Fischer, M. Stöhr-Lissen, H. Schmid-Schönbein, The red cell as a fluid droplet:Tank tread-like motion of the human erythrocyte membrane in shear flow. Science202, 894–896 (1978).
45. H. L. Goldsmith, The flow of model particles and blood cells and its relation tothrombogenesis. Prog. Hemost. Thromb. 1, 97–127 (1972).
46. J. Dupire, M. Socol, A. Viallat, Full dynamics of a red blood cell in shear flow. Proc.Natl. Acad. Sci. U.S.A. 109, 20808–20813 (2012).
47. M. Diez-Silva, M. Dao, J. Han, C. T. Lim, S. Suresh, Shape and biomechanical charac-teristics of human red blood cells in health and disease. MRS Bull. 35, 382–388 (2010).
48. P. H. Bolton-Maggs, J. C. Langer, A. Iolascon, P. Tittensor, M. J. King; General Hae-matology Task Force of the British Committee for Standards in Haematology,Guidelines for the diagnosis and management of hereditary spherocytosis–2011 up-date. Br. J. Haematol. 156, 37–49 (2012).
49. A. Iolascon et al.; Working Study Group on Red Cells and Iron of the EHA, Recom-mendations regarding splenectomy in hereditary hemolytic anemias. Haematologica102, 1304–1313 (2017).
50. M. Casale, S. Perrotta, Splenectomy for hereditary spherocytosis: Complete, partial ornot at all? Expert Rev. Hematol. 4, 627–635 (2011).
51. R. Reliene et al., Splenectomy prolongs in vivo survival of erythrocytes differently inspectrin/ankyrin- and band 3-deficient hereditary spherocytosis. Blood 100,2208–2215 (2002).
52. P. Agre, A. Asimos, J. F. Casella, C. McMillan, Inheritance pattern and clinical responseto splenectomy as a reflection of erythrocyte spectrin deficiency in hereditaryspherocytosis. N. Engl. J. Med. 315, 1579–1583 (1986).
53. T. Pincez et al., Long-term follow-up of subtotal splenectomy for hereditary spher-ocytosis: A single-center study. Blood 127, 1616–1618 (2016).
54. S. I. Tripodi, R. C. Shamberger, M. M. Heeney, V. N. Tubman, Clinical and laboratoryoutcomes following total or partial splenectomy in patients with hereditary spher-ocytosis. Pediatr. Hematol. Oncol. 36, 382–389 (2019).
55. C. Roussel et al., Spherocytic shift of red blood cells during storage provides aquantitative whole cell-based marker of the storage lesion. Transfusion 57,1007–1018 (2017).
56. G. L. Semenza, Regulation of mammalian O2 homeostasis by hypoxia-inducible factor1. Annu. Rev. Cell Dev. Biol. 15, 551–578 (1999).
57. A. Hulikova, P. Swietach, Rapid CO2 permeation across biological membranes: Im-plications for CO2 venting from tissue. FASEB J. 28, 2762–2774 (2014).
58. K. W. Spitzer, J. H. Bridge, A simple device for rapidly exchanging solution sur-rounding a single cardiac cell. Am. J. Physiol. 256, C441–C447 (1989).
59. P. Swietach et al., Hydrogen ion dynamics in human red blood cells. J. Physiol. 588,4995–5014 (2010).
10078 | www.pnas.org/cgi/doi/10.1073/pnas.1916641117 Richardson et al.
Dow
nloa
ded
by g
uest
on
Aug
ust 2
, 202
0

![Active nuclear import and cytoplasmic retention of ... · Mutation assay in E coli BW310 [Δung] shows that AID FYRN is catalytically inactive. Data from two independent experiments](https://img.pdfslide.net/doc/110x75/5e38f1cea0b9ba26f746db5b/active-nuclear-import-and-cytoplasmic-retention-of-mutation-assay-in-e-coli.jpg)


![New Analytica Chimica Acta - sdnu.edu.cn · 2018. 5. 22. · Simultaneous fluorescence imaging of cytoplasmic precursor and ... [1,2]. Mature miRNA molecules are initially transcribed](https://img.pdfslide.net/doc/110x75/606e9748b32ef569543ca5d9/new-analytica-chimica-acta-sdnueducn-2018-5-22-simultaneous-iuorescence.jpg)