Embed Size (px)
Citation preview
1
Single Laboratory Validation (SLV) Protocol For Submission to the Interstate
Shellfish Sanitation Conference (ISSC) For Method Approval
Justification for New Method
Name of the New Method.
Saxitoxin (PSP) Microtiter Plate Test Kit.
Specify the Type of Method.
Enzyme linked immunosorbent assay (ELISA) using anti-saxitoxin polyclonal antibody.
Name of Method Developer. Drs. Titan Fan and Byungchul Kim
Developer Contact Information. Beacon Analytical Systems, INC. 82 Industrial Park Rd. Saco, 04072 Phone: 207-571-4302 Email: [email protected] or [email protected]
Date of Submission. June 26, 2013
Purpose and Intended Use of the Method. Rapid analysis of saxitoxin (PSP) from shellfish such as blue mussels, steamers and mahogany clams. This method can be used for screening purpose that screens out negative samples (below 30 μg/100g). Suspicious samples with PSP levels between 30 and 100 μg/100g will need confirmation with NSSP Approved Method, mouse bioassay (MBA). PSP levels higher than 100 μg/100g would be considered as positive, and may not need further confirmation.
Need for the New Method in the NSSP, Noting Any Relationships to Existing Methods. The regulatory methods for PSP toxins are mouse bioassay (MBA) as NSSP Approved Method, and high performance liquid chromatography (HPLC) and liquid chromatography with post-column oxidation (PCOX) as NSSP Approved Limited Use Method. These methods are laborious, time consuming and expensive. Using these regulatory methods, it is difficult to process large amount of shellfish samples with limited resources. Therefore, there is a need of screening technique prior to the regulatory method that can screen out negative shellfish samples containing low levels of PSP (below 30 μg/100g). Only suspicious samples with PSP levels between 30 μg/100g and 100 μg/100g need further confirmation test with mouse bioassay. Therefore, this screening procedure will dramatically reduce the volume of samples to be confirmed with MBA, and save time and resources for the private, certified or state laboratories.
Method Limitations and Potential Indications of Cases Where the Method May Not Be Applicable to Specific Matrix Types.
Proposal No. 13-110
2
Due to extremely high sensitivity of the method, sample can be easily diluted with buffer solution (total 15000 folds). This high degree of sample dilution results in reduction in sample preparation time and elimination of any potential matrix effects either positive or negative from shellfish samples. Therefore, it is possible that this method could be used for any shellfish species for the determination of PSP level.
Other Comments.
Method Documentation
Method Title. Saxitoxin (PSP) Microtiter Plate Test Kit.
Method Scope. The method is a competitive enzyme linked immunosorbent assay (ELISA) for the detection of saxitoxins in blue mussels, steamers and mahogany clams from North Atlantic Ocean as an Approved Limited Use Method.
References. 1. B. J. Yakes, S. M. Prezioso, S. L. DeGrasse. Developing improved immunoassays for paralytic
shellfish toxins: The need for multiple, superior antibodies. Talanta 2012, 99, 668-676. 2. G. B. Inami, C. Crandall, D. Csuti, M. Oshiro, R. Brenden. Presence/Absence Screening for
Saxitoxin in Frozen Acidified Mussel and Oyster Extracts from the Coast of California with In Vitro Methods, J AOAC. Int. 2004, 87 (5), 1133-1142.
3. E. Usleber, R. Dietrich, C. Burk, E. Schneider, E. Martlbauer. Immunoassay Methods for Paralytic Shellfish Poisoning Toxins. J. AOAC. Int. 2001, 84 (5), 1649-1656.
4. Anderson, D.M., P. Andersen, V. M. Bricelj, J. J. Cullen, and J. EE. Rensel, 2001. Monitoring and management strategies for harmful algal blooms in coastal waters, APEC #201-MR-01.1, Asia Pacific Economic Program and Intergovernmental Oceanographic Commission Technical Series No. 59, Paris.
5. Fun S. Chu and Titan S. L. Fan. Indirect enzyme-linked immunosorbent assay for saxitoxin in shellfish. Journal-Association of Official Analytical Chemists 1985, 68 (1):13-16.
Principle. The Beacon Saxitoxin (PSP) Microtiter Plate Kit is a competitive enzyme-labeled immunoassay.
The Saxitoxin HRP conjugate, sample extract and calibrators are pipetted into the test wells followed by Saxitoxin antibody into the test wells to initiate the reaction. During the 30 minute incubation period, PSP toxins from the sample and Saxitoxin HRP conjugate compete for binding to Saxitoxin antibody. The Saxitoxin antibody is captured on the walls of the test well. Following this 30 minute incubation, the contents of the well are removed and the wells are washed to remove any unbound PSP toxins, Saxitoxin HRP conjugate and free Saxitoxin antibody. After wash, a clear substrate is then added to the wells and any bound enzyme conjugate causes the conversion to a blue color. Following a 30 minute incubation, the reaction is stopped and the amount of color in each well is read. The color of the unknown samples is compared to the color of the calibrators and the Saxitoxin concentration of the samples is derived.
Proposal No. 13-110

3
Analytes/Measurands. Paralytic shellfish poisoning toxins (Saxitoxin, Neo-saxitoxin, Decarbamoylsaxitoxin, Gonyautoxin-2 and -3)
Proprietary Aspects. Beacon Analytical Systems developed the kit including antibody and enzyme conjugate.
Reagents provided. Antibody coated microplate Calibrators Enzyme conjugate Anti-saxitoxin rabbit polyclonal antibody Wash solution concentrate Substrate Stop solution
Materials required but not provided. Laboratory quality distilled or deionized water 20 mM Phosphate buffered saline Pipet with disposable tips capable of dispensing 50 µL Multi-channel pipet; 8-channel capable of dispensing 50 and 100 µL Paper towels or equivalent absorbent material Microwell plate or strip reader with 450nm filter Timer Wash bottle
Media. A mixture of 70% Isopropanol and 5% Acetic acid in a ratio of 2 to 1 is used to extract PSP toxins from shellfish homogenate. To dilute the extract, 10% Methanol in 20 mM PBS buffer (10 mL of Methanol + 90 mL of 20 mM PBS) is used. Phosphate buffered saline with tween 20 (PBST) is used for washing.
Matrices of Interest. Blue mussel (Mytilus edulis), steamer (Mya arenaria) and mahogany clam (Arctica islandica).
Sample Collection, Preservation, Preparation, Storage, Cleanup, etc. Preparation: Shellfish (12 animals) are shucked, rinsed and homogenized with a kitchen blender. Five grams (5 g) of homogenate is weighed in a 50 mL centrifuge tube, and 10 mL of extraction solvent (70% Isopropanol + 5% acetic acid solution, 2 + 1) is added. The tube is vortexed for 3 min. Approximately 1 mL of the extract is transferred into a microcentrifuge tube, and centrifuged for 5 min at 12,000 rpm. The supernatant is diluted with 10% Methanol in 20 mM PBS buffer to 5000 folds (e.g. 0.1 mL of supernatant + 9.9 mL of buffer and 0.1 mL of the diluted solution + 4.9 mL of buffer), and ready for the analysis.
Safety Requirements. Personal safety items such as safety glasses, gloves and lab coat must be required. Calibrators and enzyme conjugate are toxic materials, and must be kept in the original vials when they are
Proposal No. 13-110

4
not used. Since stop solution is a strong acidic solution (1 N hydrochloric acid), skin or eye contact must be avoided. Lab items with contact of toxins (sample extract and calibrator) such as pipette tips and lab wares must be soaked in 50% dilution of house bleach at least 1 hour before washing or disposal.
Other Information (Cost of the Method, Special Technical Skills Required to Perform the Method, Special Equipment Required and Associated Cost, Abbreviations and Acronyms Defined and Details of Turn Around Times [Time Involved to Complete the Method]).
o Cost of the method: Saxitoxin (PSP) Microtiter Plate Test Kit costs $325 and can test up to 44 samples in duplicate (approximately $7 per sample)
o Special technical skills: Experience in ELISA assay would be preferable but not necessary. Basic lab experience is recommended such as pipetting and safety training.
o Special equipment and cost: Single channel micropipette (200 and 1000 μL) $560 Multi channel micropipette (either 200 or 300 μL) $680 Microplate reader (capable of reading at 450 nm, StatFax 303+) $2,100
o Abbreviations and acronyms: PSP – Paralytic Shellfish Poisoning ELISA – Enzyme Linked ImmunoSorbent Assay HRP – Horse Radish Peroxidase PBS – Phosphate Buffered Saline MBA – Mouse BioAssay HPLC-PCOX – High Performance Liquid Chromatography with Post-Column OXidation
o Turnaround time: More than 200 samples can be tested in a day (8 hours). MBA and HPLC-PCOX may test up to 60 and 15 samples, respectively. (Reference 4, Page 33)
Test Procedures, (Be Specific and Provide Easy-to-Follow Step-by-Step Procedures and indicate critical steps.). Please refer to the instructional booklet (Appendix).
1. Prepare the 1X wash solution by adding the contents of the 10X wash concentrate bottle to 450 mL Lab grade water in a wash bottle.
2. Allow reagents and sample extracts to reach room temperature prior to running the test. Place the appropriate number of test wells into a micro well holder. Be sure to re-seal unused wells in the zip-lock bag with desiccant.
3. Using a pipet with disposable tips, add 50 μL enzyme conjugate to the appropriate test wells. Be sure to use a clean pipet tip for each.
4. Add 50 µL of Calibrators or Sample extract to each well. Dispense 50 µL of Antibody Solution into each test well. Shake the plate gently for 30 seconds and incubate the test wells for 30 minutes.
5. Decant the contents of the wells into an appropriate waste container. Fill the wells to overflowing with wash solution and dump. Repeat 3X for a total of four washes.
6. Following the last wash, tap the inverted wells onto absorbent paper to remove the last of the wash solution. Dispense 100 µL of Substrate, and incubate for 30 minutes.
7. Dispense 100 µL of Stop Solution into each test well. Read and record the absorbance of the wells at 450nm using a strip or plate reader.
8. The concentration of PSP toxins in the sample is calculated based on the calibration curve (4-parameter fit). The dilution factor of 15000 must be applied to the calculated concentration (e.g., 1 ppb as calculated concentration X 15000 = 15000 ppb as real
Proposal No. 13-110

5
concentration of PSP in sample). Then, the value in ppb (μg/1000 g) can be converted to μg/100 g by dividing by 10. For people who don’t have 4-parameter fit in their readers, the Microsoft spreadsheet for the calculation would be provided upon request (Attached separately).
Quality Control (Provide Specific Steps). Coefficient of variation (CV, %) of the results from duplicate wells for each test should be below 15%. If this CV (%) is not calculated by the reader, it can be manually calculated as standard deviation divided by average, and then multiply by 100. Coefficient of determination (R2) from the calibration curve must be higher than 0.990, which indicates the assay performs accurately. Absorbance of zero calibrator should not be higher than 2.5. Customized QC protocol can be developed with assistance from Beacon Analytical Systems.
Validation Criteria (Include Accuracy / Trueness, Measurement Uncertainty, Precision [Repeatability and Reproducibility], Recovery, Specificity, Working and Linear Ranges, Limit of Detection, Limit of Quantitation / Sensitivity, Ruggedness, Matrix Effects and Comparability (if intended as a substitute for an established method accepted by the NSSP). Accuracy/Trueness The range chosen is 5 to 160 μg/100 g because any results higher than 100 μg/100 g are considered as positive. There is no reason to test the accuracy and trueness at such high levels. Sample type is shellfish tissue. Shellfish samples were purchased from a local fish market (Portland, Maine) and tested prior to the study to see if any considerable levels of PSP toxins are found. Only negligible levels of PSP were found (less than 3 μg/100 g). Samples used for spiking are blue mussel (Mytilus edulis), steamer (Mya arenaria) and mahogany clam (Arctica islandica). Since the regulatory limit of PSP toxin is 80 μg/100 g, a broad range of saxitoxin levels were spiked between 5 and 160 μg/100 g. The standard saxitoxin used for the spike was purchased from NIST (RM 8642, FDA Saxitoxin Dihydrocholoride Solution, National Institute of Standards and Technology). Detailed procedures are as below.
1. Twelve animals (mussel, steamer or mahogany clam) were shucked and homogenized in a kitchen blender and stored in -20 °C freezer.
2. Five grams of the homogenate was weighed in 50 mL centrifuge tube and saxitoxin was added into the tube so that the final concentration in 5 g is 5, 10, 20, 30, 40, 50, 55, 60, 65, 70, 75, 80, 90, 100, 110, 120, 130, 140, 150 or 160 μg/100 g.
3. Extraction solvent of 10 mL was added into the tube, and vortexed for 3 minutes. (Extraction solvent is a mixture of 70% Isopropanol and 5% Acetic acid in a ratio of 2 to 1)
4. Transfer 1 mL of extract into a microcentrifuge tube to spin at 12,000 rpm for 5 minutes. 5. Mix 0.1 mL of the supernatant with 9.9 mL of 10% Methanol/20 mM PBS buffer for 100
times dilution, and transfer 0.1 mL of the diluted extract into a 4.9 mL of buffer solution. to make the final dilution of 5000 times. This diluted extract was used for the assay. As directed in the instructional booklet, multiply the assay result by 15000 in order to compensate the dilution. This results in saxitoxin concentration in the shellfish tissue (ppb). Then, the value in ppb (μg/1000 g) can be converted to μg/100 g by dividing by 10.
Ruggedness
Proposal No. 13-110

6
Sample type is shellfish tissue. Organisms used for spiking are blue mussel (Mytilus edulis), steamer (Mya arenaria) and mahogany clam (Arctica islandica). Spike and extraction were conducted same as Accuracy/Trueness. Spike levels chosen were 10, 20, 40, 50, 60, 70, 80, 90, 100 and 120 μg/100 g. However, two aliquots from each sample were tested with two different lots of the kit. Precision Working range, sample type and organism used for spiking are same as Accuracy/Trueness. Spike and extraction were conducted same as Accuracy/Trueness. However, each sample was spiked with three different levels. Spike levels chosen were 20, 80 and 160 μg/100 g. Each level of spiked sample was analyzed twice. Recovery Same sample procedure as Precision test. Specificity The cross reactivity was evaluated by US FDA. Betsy Jean Yakes, Samantha M. Prezioso, Stacey L. DeGrasse. Developing improved immunoassays for paralytic shellfish toxins: The need for multiple, superior antibodies. Talanta (2012), 99, 668-676. Linearity/Limit of Detection/Limit of Quantitation/Sensitivity Sample type is shellfish tissue. Working range is 10 to 240 μg/100 g. Range of interest is 20 to 80 μg/100 g. Range in spiking levels used is 5 to 240 μg/100 g. For the linearity, STX standards were used (0, 0.01, 0.08 and 0.32ppb), and this range of calibrators covers the saxitoxin levels of 15 through 480 μg/100 g in sample when the dilution was performed as directed in the instructional booklet. For the LOD, LOQ and sensitivity, blue mussel, steamer and mahogany clam were used for spiking. Spike and extraction were conducted same as Accuracy/Trueness. However, each sample was spiked with six different levels including zero. Ten samples were prepared. Spike levels chosen for each sample were 0, 5, 20, 80, 160 and 240 μg/100 g. Each spike level of the samples except zero was analyzed in triplicate.
Proposal No. 13-110

7
Table 1. Accuracy/Trueness for blue mussel.
Mussel Saxitoxin (μg/100 g)
Sample Spike level Determined Blank Blank
subtracted Difference
A 5 5.86 1.72 4.14 0.86
B 10 11.19 1.64 9.55 0.45
C 20 20.73 1.56 19.17 0.83
D 30 31.85 1.89 29.96 0.04
E 40 41.88 1.71 40.17 -0.16
F 50 56.23 2.16 54.07 -4.07
G 55 63.23 2.16 61.07 -6.07
H 60 63.65 2.08 61.57 -1.57
I 65 70.6 2.18 68.42 -3.42
J 70 75.28 2.3 72.98 -2.98
K 75 83.61 2.12 81.49 -6.49
L 80 85.27 2.02 83.25 -3.25
M 90 90.82 2.05 88.77 1.23
N 100 122.34 2.27 120.07 -20.07
O 110 124.91 2.18 122.73 -12.73
P 120 138.26 2.35 135.91 -15.91
Q 130 151.76 2.31 149.45 -19.45
R 140 157.85 2.38 155.47 -15.47
S 150 180.79 2.64 178.15 -28.15
T 160 191.12 2.52 188.60 -28.60
Average 78 88.36 2.11 86.25 -8.25
Standard dev. 9.78
Accuracy/Trueness (%) 111
Measurement uncertainty (μg/100 g)
4.29
Proposal No. 13-110

8
Table 2. Accuracy/Trueness for steamer.
Steamer Saxitoxin (μg/100 g)
Sample Spike level Determined Blank Blank
subtracted Difference
A 5 5.56 1.01 4.55 0.45
B 10 10.61 0.89 9.72 0.28
C 20 19.74 0.67 19.07 0.93
D 30 29.68 0.81 28.87 1.13
E 40 41.02 0.91 40.11 -0.11
F 50 53.74 1.21 52.53 -2.53
G 55 59.27 0.86 58.41 -3.41
H 60 58.31 1.16 57.15 2.85
I 65 67.78 1.17 66.61 -1.61
J 70 73.17 1.17 72.00 -2.00
K 75 76.69 1.07 75.62 -0.62
L 80 70.02 1.29 68.73 11.27
M 90 93.12 1.11 92.01 -2.01
N 100 102.03 1.24 100.79 -0.79
O 110 115.1 1.69 113.41 -3.41
P 120 127.62 1.61 126.01 -6.01
Q 130 131.82 1.78 130.04 -0.04
R 140 146.65 1.73 144.92 -4.92
S 150 161.68 1.79 159.89 -9.89
T 160 179.26 1.79 177.47 -17.47
Average 78 81.14 1.25 79.90 -1.90
Standard dev. 5.48
Accuracy/Trueness (%) 102
Measurement uncertainty (μg/100 g)
2.40
Proposal No. 13-110

9
Table 3. Accuracy/Trueness for mahogany clam.
Mahogany clam Saxitoxin (μg/100 g)
Sample Spike level Determined Blank Blank
subtracted Difference
1 5 7.00 1.62 5.38 -0.38
2 10 11.72 1.62 10.10 -0.1
3 20 19.59 1.62 17.97 2.03
4 30 30.33 1.95 28.38 1.62
5 40 41.32 2.01 39.31 0.69
6 50 54.72 1.86 52.86 -2.86
7 55 60.24 1.84 58.40 -3.40
8 60 62.42 2.26 60.16 -0.16
9 65 64.70 2.27 62.43 2.57
10 70 70.83 2.38 68.45 1.55
11 75 76.86 2.55 74.31 0.69
12 80 81.45 2.29 79.16 0.84
13 90 92.70 2.64 90.06 -0.06
14 100 103.11 2.61 100.50 -0.50
15 110 113.75 2.29 111.46 -1.46
16 120 132.55 2.58 129.97 -9.97
17 130 137.53 2.56 134.97 -4.97
18 140 138.86 2.39 136.47 3.53
19 150 150.25 2.54 147.71 2.29
20 160 170.89 2.63 168.26 -8.26
Average 78 81.04 2.23 78.82 -0.82
Standard dev. 3.44
Accuracy/Trueness (%) 101
Measurement uncertainty (μg/100 g)
1.55
Proposal No. 13-110

10
Table 4. Ruggedness analysis.
Mussel (μg/100 g) Steamer (μg/100 g) Mahogany (μg/100 g)
Sample Lot #1 Lot #2 Lot #1 Lot #2 Lot #1 Lot #2
1 9.75 9.84 8.58 8.61 10.89 12.71
2 17.66 18.12 14.09 15.73 21.74 21.14
3 33.46 33.97 32.92 32.95 39.91 39.69
4 46.52 45.17 42.39 41.12 49.29 55.45
5 57.9 56.55 48.16 50.02 62.33 69.42
6 65.32 66.89 61.67 64.72 79.93 70.44
7 77.52 74.98 69.05 67.32 84.86 87.97
8 79.31 78.15 72.38 76.77 88.01 97.9
9 90.31 98.38 82.33 87.42 101.3 103.77
10 112.45 116.24 102.51 103.14 130.54 124.97
Skewness -0.04 0.10 -0.04 -0.05 0.06 -0.12
Variance 1064.05 1157.37 893.83 942.89 1378.60 1337.38
Ratio of variances 1.09 1.05 1.03
P-value
(Paired t-test) 0.43 0.09 0.45
Significant difference
NO NO NO
Proposal No. 13-110

11
Table 5. Precision for blue mussel.
Sample Concentration Determination STX
Sample Concentration Determination STX
Score Score
1 L* 1 20.32 6 L 1 15.54
1 L 2 24.59 6 L 2 21.30
1 M* 1 81.33 6 M 1 83.87
1 M 2 79.36 6 M 2 86.25
1 H* 1 162.73 6 H 1 175.71
1 H 2 152.45 6 H 2 168.75
2 L 1 19.77 7 L 1 16.99
2 L 2 14.40 7 L 2 19.75
2 M 1 78.70 7 M 1 86.41
2 M 2 79.60 7 M 2 85.06
2 H 1 149.92 7 H 1 172.50
2 H 2 158.63 7 H 2 167.14
3 L 1 25.15 8 L 1 21.48
3 L 2 18.34 8 L 2 21.10
3 M 1 72.79 8 M 1 85.97
3 M 2 76.45 8 M 2 86.22
3 H 1 152.89 8 H 1 166.83
3 H 2 152.19 8 H 2 170.77
4 L 1 23.05 9 L 1 23.24
4 L 2 18.48 9 L 2 24.06
4 M 1 73.24 9 M 1 84.01
4 M 2 74.61 9 M 2 92.05
4 H 1 149.37 9 H 1 170.87
4 H 2 141.79 9 H 2 171.03
5 L 1 20.60 10 L 1 20.16
5 L 2 16.54 10 L 2 17.87
5 M 1 75.65 10 M 1 84.29
5 M 2 78.27 10 M 2 86.37
5 H 1 152.04 10 H 1 175.94
5 H 2 158.34 10 H 2 170.48
*L; Low level spike (20 μg/100 g), M; Medium level spike (80 μg/100 g), H; High level spike (160 μg/100
g)
Table 6. Nested ANOVA for blue mussel sample. Source of variation DF SS MS F value
Samples 9 1384.16 153.80 0.02 Concentrations in samples 20 203507 10175 894.24 Determinations within concentrations 30 341.36 11.38 Total 59 205233 3478.52
Proposal No. 13-110

12
Table 7. Precision for steamer.
Sample Concentration Determination STX
Sample Concentration Determination STX
Score Score
1 L 1 18.68 6 L 1 16.87
1 L 2 23.16 6 L 2 21.63
1 M 1 77.46 6 M 1 81.76
1 M 2 76.23 6 M 2 82.96
1 H 1 154.04 6 H 1 167.80
1 H 2 154.51 6 H 2 163.75
2 L 1 20.14 7 L 1 18.73
2 L 2 21.66 7 L 2 24.59
2 M 1 85.17 7 M 1 83.62
2 M 2 79.32 7 M 2 80.45
2 H 1 160.30 7 H 1 155.48
2 H 2 165.08 7 H 2 165.04
3 L 1 23.13 8 L 1 23.69
3 L 2 19.95 8 L 2 20.61
3 M 1 79.99 8 M 1 87.19
3 M 2 80.85 8 M 2 87.25
3 H 1 153.02 8 H 1 169.35
3 H 2 151.95 8 H 2 166.76
4 L 1 26.14 9 L 1 23.20
4 L 2 23.63 9 L 2 26.76
4 M 1 82.59 9 M 1 85.59
4 M 2 84.22 9 M 2 92.55
4 H 1 163.35 9 H 1 174.61
4 H 2 155.64 9 H 2 167.74
5 L 1 21.51 10 L 1 20.71
5 L 2 23.76 10 L 2 22.71
5 M 1 78.95 10 M 1 88.30
5 M 2 81.70 10 M 2 88.46
5 H 1 168.83 10 H 1 171.01
5 H 2 160.60 10 H 2 169.67
Table 8. Nested ANOVA for steamer sample. Source of variation DF SS MS F value
Samples 9 666.39 74.04 0.01 Concentrations in samples 20 199960 9997.98 1093.56 Determinations within concentrations 30 274.28 9.14 Total 59 200900 3405.09
Proposal No. 13-110

13
Table 9. Precision for mahogany clam.
Sample Concentration Determination STX
Sample Concentration Determination STX
Score Score
1 L 1 16.52 6 L 1 22.28
1 L 2 23.15 6 L 2 22.54
1 M 1 81.58 6 M 1 78.12
1 M 2 78.26 6 M 2 79.69
1 H 1 155.89 6 H 1 171.77
1 H 2 158.16 6 H 2 162.53
2 L 1 20.78 7 L 1 21.89
2 L 2 19.63 7 L 2 27.09
2 M 1 80.07 7 M 1 89.17
2 M 2 74.56 7 M 2 89.24
2 H 1 161.16 7 H 1 168.43
2 H 2 152.61 7 H 2 161.55
3 L 1 26.17 8 L 1 29.98
3 L 2 21.59 8 L 2 26.59
3 M 1 76.65 8 M 1 96.99
3 M 2 77.17 8 M 2 83.19
3 H 1 152.00 8 H 1 164.97
3 H 2 159.93 8 H 2 165.68
4 L 1 22.83 9 L 1 24.67
4 L 2 23.56 9 L 2 25.65
4 M 1 80.57 9 M 1 83.07
4 M 2 80.61 9 M 2 86.46
4 H 1 162.48 9 H 1 169.98
4 H 2 155.49 9 H 2 156.82
5 L 1 21.18 10 L 1 22.74
5 L 2 26.06 10 L 2 28.91
5 M 1 82.48 10 M 1 88.31
5 M 2 85.91 10 M 2 89.45
5 H 1 165.33 10 H 1 165.92
5 H 2 156.10 10 H 2 162.24
Table 10. Nested ANOVA for mahogany clam sample. Source of variation DF SS MS F value
Samples 9 646.57 71.84 0.01 Concentrations in samples 20 191207 9560.33 561.00 Determinations within concentrations 30 511.25 17.04 Total 59 192364 3260.41
Proposal No. 13-110

14
Table 11. Recovery for blue mussel.
Spike (μg/100 g) Replicate 1 Replicate 2 Average Spike - Average
L (20) 20.32 24.59 22.46 -2.46
L (20) 19.77 14.40 17.09 2.92
L (20) 25.15 18.34 21.75 -1.75
L (20) 23.05 18.48 20.77 -0.77
L (20) 20.60 16.54 18.57 1.43
L (20) 15.54 21.30 18.42 1.58
L (20) 16.99 19.75 18.37 1.63
L (20) 21.48 21.10 21.29 -1.29
L (20) 23.24 24.06 23.65 -3.65
L (20) 20.16 17.87 19.02 0.99
M (80) 81.33 79.36 80.35 -0.35
M (80) 78.70 79.60 79.15 0.85
M (80) 72.79 76.45 74.62 5.38
M (80) 73.24 74.61 73.93 6.08
M (80) 75.65 78.27 76.96 3.04
M (80) 83.87 86.25 85.06 -5.06
M (80) 86.41 85.06 85.74 -5.74
M (80) 85.97 86.22 86.10 -6.10
M (80) 84.01 92.05 88.03 -8.03
M (80) 84.29 86.37 85.33 -5.33
H (160) 162.73 152.45 157.59 2.41
H (160) 149.92 158.63 154.28 5.73
H (160) 152.89 152.19 152.54 7.46
H (160) 149.37 141.79 145.58 14.42
H (160) 152.04 158.34 155.19 4.81
H (160) 175.71 168.75 172.23 -12.23
H (160) 172.50 167.14 169.82 -9.82
H (160) 166.83 170.77 168.80 -8.80
H (160) 170.87 171.03 170.95 -10.95
H (160) 175.94 170.48 173.21 -13.21
Table 12. One-way ANOVA for blue mussel sample. Source of variation
DF SS MS F P-value F critcal
Concentration 2 19.045 9.52 0.22 0.81 3.35 Error 27 1184.75 43.88 Total 29 1203.79
Proposal No. 13-110

15
Table 13. Recovery for steamer.
Spike (μg/100 g) Replicate 1 Replicate 2 Average Spike - Average
L (20) 18.68 23.16 20.92 -0.92
L (20) 20.14 21.66 20.90 -0.90
L (20) 23.13 19.95 21.54 -1.54
L (20) 24.14 23.63 24.89 -4.89
L (20) 21.51 23.76 22.64 -2.64
L (20) 16.87 21.63 19.25 0.76
L (20) 18.73 24.59 21.66 -1.66
L (20) 23.69 20.61 22.15 -2.15
L (20) 23.20 26.76 24.98 -4.98
L (20) 20.71 22.71 21.71 -1.71
M (80) 77.46 76.23 76.85 3.16
M (80) 85.17 79.32 82.24 -2.24
M (80) 79.99 80.85 80.42 -0.42
M (80) 82.59 84.22 83.41 -3.41
M (80) 78.95 81.70 80.33 -0.33
M (80) 81.76 82.96 82.36 -2.36
M (80) 83.62 80.45 82.04 -2.04
M (80) 87.19 87.25 87.22 -7.22
M (80) 85.59 92.55 89.07 -9.07
M (80) 88.30 88.46 88.38 -8.38
H (160) 154.04 154.51 154.28 5.73
H (160) 160.30 165.08 162.69 -2.69
H (160) 153.02 151.95 152.49 7.52
H (160) 163.35 155.64 159.50 0.51
H (160) 168.83 160.60 164.72 -4.72
H (160) 167.80 163.75 165.77 -5.77
H (160) 155.48 165.04 160.26 -0.26
H (160) 169.35 166.76 168.05 -8.05
H (160) 174.61 167.74 171.18 -11.18
H (160) 171.01 169.67 170.34 -10.34
Table 14. One-way ANOVA for steamer sample. Source of variation
DF SS MS F P-value F critcal
Concentration 2 7.34 3.67 0.19 0.83 3.35 Error 27 528.18 19.56 Total 29 535.51
Proposal No. 13-110

16
Table 15. Recovery for mahogany clam.
Spike (μg/100 g) Replicate 1 Replicate 2 Average Spike - Average
L (20) 16.52 23.15 19.84 0.17
L (20) 20.78 19.63 20.21 -0.21
L (20) 26.17 21.59 23.88 -3.88
L (20) 22.83 23.56 23.20 -3.20
L (20) 21.18 26.06 23.62 -3.62
L (20) 22.28 22.54 22.41 -2.41
L (20) 21.89 27.09 24.49 -4.49
L (20) 29.98 26.59 28.29 -8.29
L (20) 24.67 25.65 25.16 -5.16
L (20) 22.74 28.91 25.83 -5.83
M (80) 81.58 78.26 78.26 1.74
M (80) 80.07 74.56 74.56 5.44
M (80) 76.65 77.17 77.17 2.83
M (80) 80.57 80.61 80.61 -0.61
M (80) 82.48 85.91 85.91 -5.91
M (80) 78.12 79.69 78.91 1.10
M (80) 89.17 89.24 89.21 -9.21
M (80) 96.99 83.19 90.09 -10.09
M (80) 83.07 86.46 84.77 -4.77
M (80) 88.31 89.45 88.88 -8.88
H (160) 155.89 158.16 157.03 2.98
H (160) 161.16 152.61 156.89 3.12
H (160) 152.00 159.93 155.97 4.04
H (160) 162.48 155.49 158.99 1.02
H (160) 165.33 156.10 160.72 -0.72
H (160) 171.77 162.53 167.15 -7.15
H (160) 168.43 161.55 164.99 -4.99
H (160) 164.97 165.68 165.33 -5.33
H (160) 169.98 156.82 163.40 -3.40
H (160) 165.92 162.24 164.08 -4.08
Table 16. One-way ANOVA for steamer sample. Source of variation
DF SS MS F P-value F critcal
Concentration 2 25.52 12.76 0.70 0.50 3.35 Error 27 490.11 18.15 Total 29 515.63
Proposal No. 13-110
17
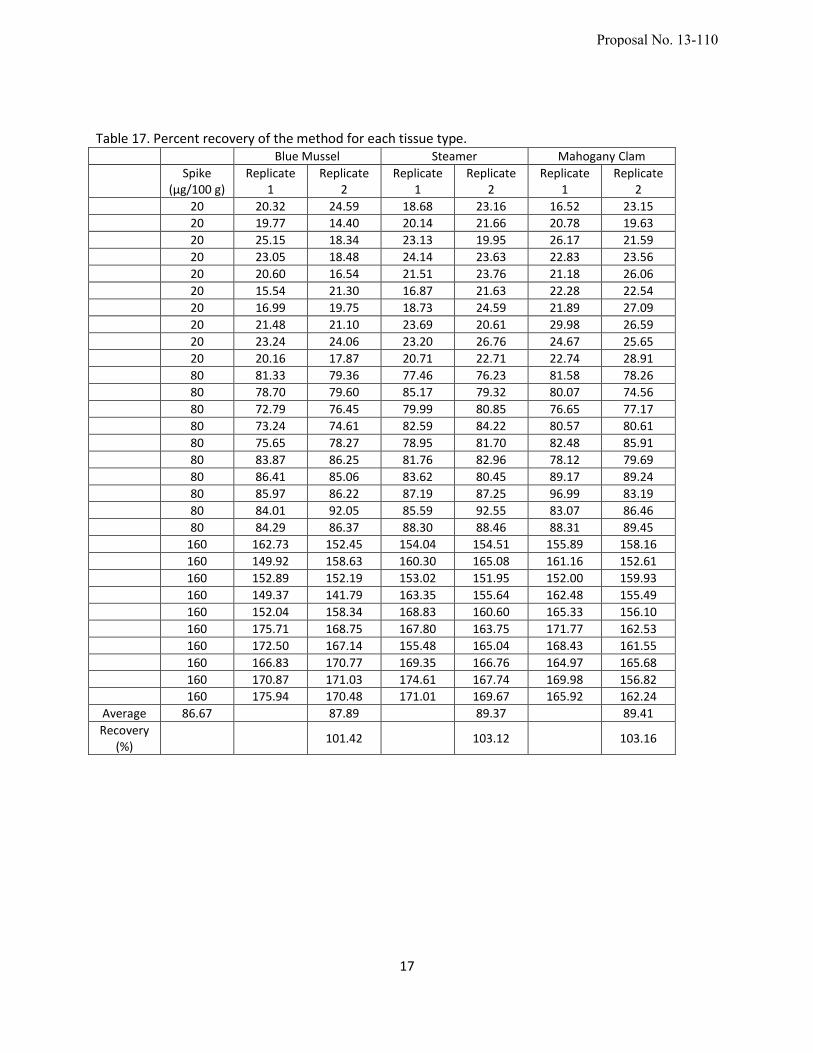
Table 17. Percent recovery of the method for each tissue type. Blue Mussel Steamer Mahogany Clam
Spike (μg/100 g)
Replicate 1
Replicate 2
Replicate 1
Replicate 2
Replicate 1
Replicate 2
20 20.32 24.59 18.68 23.16 16.52 23.15
20 19.77 14.40 20.14 21.66 20.78 19.63
20 25.15 18.34 23.13 19.95 26.17 21.59
20 23.05 18.48 24.14 23.63 22.83 23.56
20 20.60 16.54 21.51 23.76 21.18 26.06
20 15.54 21.30 16.87 21.63 22.28 22.54
20 16.99 19.75 18.73 24.59 21.89 27.09
20 21.48 21.10 23.69 20.61 29.98 26.59
20 23.24 24.06 23.20 26.76 24.67 25.65
20 20.16 17.87 20.71 22.71 22.74 28.91
80 81.33 79.36 77.46 76.23 81.58 78.26
80 78.70 79.60 85.17 79.32 80.07 74.56
80 72.79 76.45 79.99 80.85 76.65 77.17
80 73.24 74.61 82.59 84.22 80.57 80.61
80 75.65 78.27 78.95 81.70 82.48 85.91
80 83.87 86.25 81.76 82.96 78.12 79.69
80 86.41 85.06 83.62 80.45 89.17 89.24
80 85.97 86.22 87.19 87.25 96.99 83.19
80 84.01 92.05 85.59 92.55 83.07 86.46
80 84.29 86.37 88.30 88.46 88.31 89.45
160 162.73 152.45 154.04 154.51 155.89 158.16
160 149.92 158.63 160.30 165.08 161.16 152.61
160 152.89 152.19 153.02 151.95 152.00 159.93
160 149.37 141.79 163.35 155.64 162.48 155.49
160 152.04 158.34 168.83 160.60 165.33 156.10
160 175.71 168.75 167.80 163.75 171.77 162.53
160 172.50 167.14 155.48 165.04 168.43 161.55
160 166.83 170.77 169.35 166.76 164.97 165.68
160 170.87 171.03 174.61 167.74 169.98 156.82
160 175.94 170.48 171.01 169.67 165.92 162.24
Average 86.67 87.89 89.37 89.41
Recovery (%)
101.42 103.12 103.16
Proposal No. 13-110

18
Table 18. Cross reactivity of antibody to saxitoxin-related congeners.
Compound Cross reactivity (%)
Saxitoxin dihydrochloride 100.00
Neosaxitoxin 2.28
Decarbamoyl STX 42.30
GTX2 & 3 50.00
GTX1 & 4 0.48
Decarbamoyl GTX2 & 3 2.36
Decarbamoyl NeoSTX 1.50
B1 16.95
C1& 2 12.10
*The cross reactivity was evaluated by US FDA. Betsy Jean Yakes, Samantha M. Prezioso, Stacey L. DeGrasse.
Developing improved immunoassays for paralytic shellfish toxins: The need for multiple, superior antibodies.
Talanta (2012), 99, 668-676.
Figure 1. Calibration curve.
Conc
0.01 0.1 1
0.2
0.4
0.6
0.8
1
1.2
1.4
StandardCurve
Semi-Log Fit: y = A + B * Log(x): A B R^2
STD#1 (Standards: Conc vs AvgOD) -0.145 -0.733 1
Proposal No. 13-110

19
Table 19. LOD and LOQ for blue mussel.
Sample Replicate Spike (μg/100 g)
5 20 80 160 240
1
1 8.00 19.44 81.56 154.58 218.59
2 5.23 22.13 79.71 151.94 222.88
3 6.70 20.32 76.53 150.97 227.44
2
1 8.98 20.01 77.37 158.08 222.52
2 6.22 21.09 79.20 153.75 225.14
3 8.17 19.67 76.63 153.63 229.74
3
1 5.51 19.89 79.46 165.71 220.13
2 7.55 21.71 80.02 167.96 231.76
3 6.21 22.31 77.98 174.00 232.58
4
1 6.21 19.33 78.04 155.51 232.76
2 6.91 22.19 83.81 156.42 237.66
3 7.01 22.34 85.43 162.98 229.39
5
1 7.87 22.06 86.31 163.41 234.75
2 10.65 24.62 80.05 160.72 231.98
3 9.46 22.04 79.33 161.27 228.36
6
1 3.17 21.17 81.48 158.63 234.11
2 4.90 23.31 81.72 161.60 237.80
3 10.09 22.82 84.49 166.57 241.66
7
1 7.54 22.04 83.74 167.89 242.64
2 7.25 21.40 80.08 160.91 238.06
3 6.04 20.19 80.64 158.23 235.43
8
1 4.43 20.31 69.33 155.01 228.79
2 6.31 22.70 75.59 161.16 243.85
3 6.86 23.74 77.60 162.91 244.77
9
1 4.88 20.13 68.81 154.66 228.89
2 5.83 22.57 74.57 160.32 243.81
3 8.13 23.92 77.61 163.21 246.43
10
1 6.30 24.06 76.86 161.50 246.37
2 8.02 22.43 81.28 168.06 244.21
3 8.23 24.54 82.96 170.67 243.64
Average 6.89 22.16 79.47 162.47 236.66
Standard Deviation
1.76 1.47 4.40 4.98 7.03
CV (%) 25.48 6.63 5.54 3.06 2.97
Limit of quantitation (LOQ) is 13 μg/100 g and limit of detection (LOD) is 3.9 μg/100 g.
Proposal No. 13-110

20
Table 20. LOD and LOQ for steamer.
Sample Replicate Spike (μg/100 g)
5 20 80 160 240
1
1 5.89 19.23 74.16 154.92 228.85
2 4.93 20.26 75.06 155.50 235.79
3 5.84 21.23 76.36 154.92 233.99
2
1 4.92 18.49 72.48 153.03 228.16
2 4.24 18.74 73.04 153.62 233.76
3 5.25 20.56 75.21 154.07 235.08
3
1 5.26 15.70 70.34 142.34 225.09
2 5.68 19.10 75.49 147.96 221.74
3 5.94 18.87 76.12 150.07 228.19
4
1 4.46 19.77 75.80 147.91 234.36
2 2.53 21.12 77.35 152.37 229.56
3 3.16 22.37 79.89 156.60 238.98
5
1 4.91 20.53 82.73 154.60 237.12
2 4.33 21.12 84.16 165.37 244.30
3 6.82 21.95 85.43 161.95 244.16
6
1 5.93 22.43 84.55 160.50 240.98
2 2.43 20.55 82.53 162.05 239.87
3 3.93 19.76 81.05 153.58 233.75
7
1 6.80 22.04 78.88 161.82 249.64
2 4.74 19.42 87.73 169.54 258.67
3 7.70 21.53 84.61 170.70 250.27
8
1 5.37 21.95 82.42 167.55 246.71
2 3.99 17.22 82.09 164.19 247.66
3 5.13 18.27 78.32 161.26 243.13
9
1 8.23 20.57 76.89 150.28 240.76
2 7.65 19.04 74.81 148.37 235.24
3 9.36 19.46 76.15 156.55 243.71
10
1 6.86 22.15 77.17 152.94 242.10
2 7.05 23.59 76.91 155.44 244.50
3 8.62 22.69 83.93 157.17 249.33
Average 5.60 20.32 78.72 156.57 238.85
Standard Deviation
1.70 1.76 4.42 6.77 8.45
CV (%) 30.39 8.67 5.61 4.32 3.54
Limit of quantitation (LOQ) is 17 μg/100 g and limit of detection (LOD) is 5.2 μg/100 g.
Proposal No. 13-110

21
Table 21. LOD and LOQ for Mahogany clam.
Sample Replicate Spike (μg/100 g)
5 20 80 160 240
1
1 4.79 20.72 74.76 156.09 235.92
2 3.66 20.58 73.55 152.94 238.18
3 5.52 22.54 78.00 146.95 241.35
2
1 5.30 21.52 76.18 151.08 240.92
2 2.32 20.46 71.91 150.13 239.19
3 4.50 19.50 75.17 154.73 233.91
3
1 5.14 20.74 75.36 150.57 239.47
2 7.62 19.13 70.52 148.60 237.14
3 3.80 18.70 74.66 154.31 233.02
4
1 4.75 20.38 75.15 150.26 240.21
2 3.13 18.20 74.55 153.86 233.42
3 6.36 18.37 69.73 147.80 237.09
5
1 5.67 18.83 75.84 149.32 229.98
2 6.38 21.11 77.56 155.13 242.33
3 6.64 20.18 81.71 160.98 246.92
6
1 6.09 18.92 82.98 161.94 248.69
2 5.09 19.40 76.25 155.23 243.44
3 4.92 17.48 75.18 148.89 231.89
7
1 3.37 18.46 76.29 154.20 240.17
2 6.03 18.95 83.97 161.17 246.89
3 4.46 17.25 75.97 149.58 231.00
8
1 9.50 22.67 83.28 153.81 231.91
2 8.39 23.87 82.56 158.22 231.64
3 6.29 22.53 86.47 149.23 232.41
9
1 7.62 19.18 73.82 158.28 237.57
2 7.13 22.08 75.80 156.14 223.80
3 7.71 21.37 77.12 153.62 223.58
10
1 5.36 19.00 73.77 157.04 235.65
2 2.84 21.28 74.66 155.53 221.84
3 5.85 21.49 78.05 156.17 224.65
Average 5.54 20.16 76.69 153.73 235.81
Standard Deviation
1.69 1.66 3.98 4.08 6.93
CV (%) 30.45 8.24 5.19 2.66 2.94
Limit of quantitation (LOQ) is 16 μg/100 g and limit of detection (LOD) is 4.9 μg/100 g.
Proposal No. 13-110

22
Table 22. Comparison between ELISA and MBA for samples collected from same location over the seasons.
Date of collection ELISA (µg/100g) MBA (µg/100g) Result from ELISA Result from MBA
6/7/2010 35 45 Suspicious Below limit
6/9/2010 5 0 Negative Negative
6/14/2010 31 45 Suspicious Below limit
6/16/2010 18 0 Negative Negative
6/21/2010 66 59 Suspicious Below limit
6/23/2010 31 48 Suspicious Below limit
6/28/2010 133 274 Positive Positive
6/30/2010 433 567 Positive Positive
7/5/2010 1006 1204 Positive Positive
7/7/2010 115 163 Positive Positive
7/12/2010 276 264 Positive Positive
7/14/2010 11 0 Negative Negative
7/19/2010 10 0 Negative Negative
7/21/2010 6 0 Negative Negative
7/26/2010 0 0 Negative Negative
7/28/2010 1 0 Negative Negative
8/2/2010 0 0 Negative Negative
8/9/2010 0 0 Negative Negative
8/11/2010 12 0 Negative Negative
8/16/2010 8 0 Negative Negative
8/18/2010 8 0 Negative Negative
5/9/2011 42 54 Suspicious Below limit
5/16/2011 34 42 Suspicious Below limit
5/30/2011 25 0 Negative Negative
6/6/2011 184 124 Positive Positive
6/13/2011 288 382 Positive Positive
Table 23. Comparison between ELISA and MBA for samples collected from different locations.
Location of collection ELISA (µg/100g) MBA (µg/100g) Result from ELISA Result from MBA
Black Rock 101 121 Positive Positive
Lumbos Hole 124 156 Positive Positive
Ogunquit R. 24 48 Negative Below limit
Hermit Island East 120 136 Positive Positive
Long Point 72 67 Suspicious Below limit
Gurnet 264 156 Positive Positive
Head Beach 32 39 Suspicious Below limit
Little johns Bridge 52 52 Suspicious Below limit
Black Rock 32 50 Suspicious Below limit
Bangs Island 40 54 Suspicious Below limit
Ash Point 99 74 Suspicious Below limit
Basin Point 44 44 Suspicious Below limit
Ash Point 44 48 Suspicious Below limit
Lumbos Hole 36 49 Suspicious Below limit
CB 004 Youngs Point 64 55 Suspicious Below limit
Matthews Island 56 47 Suspicious Below limit
Proposal No. 13-110

23
Discussion The accuracy/trueness of the method for mussel, steamer and mahogany clam were 111%, 102%
and 101%, respectively. The measurement uncertainty for mussel, steamer and mahogany clam were 4.29, 2.40 and 1.55 μg/100 g, respectively. Based on these results, mahogany clam sample gives better accuracy/trueness and measurement uncertainty for the method (Table 1 – 3).
The skewness (within -2 to +2) and the ratio of variances (close to 1) indicate that this is a symmetric distribution and the variance is homogeneous, respectively. Therefore, the paired t-test was chosen for the analysis instead of Welch’s t-test in order to see the significant difference between two lots of each tissue type test. P-value below 0.05 is considered statistically significant at a significance level of 0.05, while one of 0.05 or greater indicates no significant difference between the groups. Therefore, all three tissue types had no significant differences between lots when tested with the method over the tested range of 10 – 120 μg/100 g. This indicates that the method is sufficiently rugged to be used routinely (Table 4).
For mussel sample, we obtained an F value of 0.02 for sample which is less than the critical value of 2.39 for 9 and 20 degrees of freedom at the 0.05 significance level (Table 6). This indicates that the mean values from the samples are not significantly different. The F value for concentration in sample is greater than the critical value of 1.93 for 20 and 30 degrees of freedom a the 0.05 significance level. This indicates that the mean values of each concentration within samples are significantly different. From this nested ANOVA table, we can conclude that the precision of the method is consistent over the samples. Each sample has three different levels of saxitoxin contamination. However, the precision of the method is not consistent for each spiked concentration when repeated with different samples. The other two samples, steamer and mahogany had the same results as mussel sample (Table 5 – 10).
From one-way ANOVA for recovery, since F value for each shellfish type is smaller than F critical (tabulated F value at 95% confidence level), there is no significance between groups (20, 80 and 160). Therefore, the recoveries for mussel, steamer and mahogany samples are consistent over the range tested by the method (20 through 160 μg/100 g) (Table 11 – 17).
Cross reactivity of the antibody used for the kit was evaluated by the third party (Table 18). The detailed information regarding the cross reactivity can be achieved from the reference 1 (Yakes et al., 2012). However, it is common that the results may vary depending on the assay formats used to evaluate the cross reactivity.
For the linearity of the method, calibrators were run by the method. OD (optical density) values at 450 nm were graphed on the y-axis, and log concentrations of calibrators (0.01 – 0.32 μg/L) were graphed on the x-axis. A linear curve fit was applied to the data. The curve in Figure 1 is very good with coefficient of determination of 1.0. This indicates the method can detect the levels of saxitoxin between 15 and 480 μg/100 g in sample with good linearity.
To determine the LOQ for each tissue type, coefficient of variation (%) was plotted on the y-axis and saxitoxin spike level was plotted on the x-axis. From this graph, LOQ was determined by finding the saxitoxin concentration where the CV (%) is 10%. LOQs for mussel, steamer and mahogany samples are 13, 17 and 16 μg/100 g, respectively. LOD was determined by dividing the LOQ by 3.3. LODs for mussel, steamer and mahogany samples are 3.9, 5.2 and 4.9 μg/100 g, respectively (Table 19 – 21).
ELISA and MBA methods were compared for the determination of PSP from naturally contaminated blue mussels (Table 22 – 23). All the suspicious results from ELISA (between 30 μg/100 g and 100 μg/100 g) agreed with the results from MBA (Detectable but below limit, < 80 μg/100 g). Therefore, these suspicious results from ELISA testing can be retested by MBA to confirm the PSP level. All the results either negative or positive from ELISA well matched with the results from MBA except one negative result from ELISA (Ogunquit R.). However, the result from MBA for the sample is quite below the legal limit (48 μg/100 g) as well. Therefore, all the naturally contaminated samples were correctly screened by the ELISA indicating this ELISA method can be used as a screening tool for PSP analysis in the laboratory.
Proposal No. 13-110

24
Summary Rapid screening method for saxitoxin (PSP) in blue mussels, steamers and mahogany clams was
developed and evaluated. This method can be used in the private, certified or state laboratories for the determination of PSP toxins in order to screen out negative samples (below 30 μg/100g of saxitoxin equivalent) prior to mouse bioassay (MBA) as a confirmation method. Suspicious samples with PSP levels between 30 μg/100g and 100 μg/100 g will need confirmation with MBA. However, PSP levels higher than 100 μg/100g would be considered as positive, and may not need further confirmation. Therefore, this screening method will dramatically reduce the volume of samples to be confirmed with MBA, and save time and resources for the laboratories.
Proposal No. 13-110

CALCULATE RESULTS
1. Semi-quantitative results can be derived by simple comparison of the sample absorbances to the absorbance of the calibrator wells. Samples containing less color than a calibrator will have a concentration of Saxitoxin greater than the concentration of the calibrator. Samples containing more color than a calibrator well have a concentration less than the concentration of the calibrator.
2. Quantitative interpretation requires graphing the absorbances of the calibrators (Y axis) versus the log of the calibrator concentration (X axis) on semi-log graph paper. A straight line is drawn through the calibrator points and the sample absorbances are located on the line. The corresponding point on the X axis is the concentration of the sample Alternatively, Beacon can supply a spreadsheet template which can be used for data reduction. Please contact Beacon for further details.
SAMPLE CALCULATIONS
Well
Contents OD
Average OD ± SD*
%RSD
%Bo** STX conc.
(ppb)
Negative 1.438 1.449 0.016 1.1 100 N/A
Control 1.461
0.01 ppb 1.312 1.321 0.012 0.9 91.2 N/A
Calibrator 1.330
0.08 ppb 0.669 0.661 0.011 1.7 45.6 N/A
Calibrator 0.653
0.32 ppb 0.217 0.217 0.001 0.4 15.0 N/A
Calibrator 0.216
Sample 0.491 0.501 0.014 2.8 34.6 0.119
0.511
Actual values may vary; this data is for example purposes only.
* standard deviation
** %Bo equals average sample absorbance divided by average negative control absorbance times 100%.
<Appendix> TECHNICAL ASSISTANCE
For questions regarding this kit or for additional information about Beacon products, call (207) 571-4302.
SAFETY
To receive complete safety information on this product, contact Beacon Analytical Systems, Inc. and request Material Safety Data Sheets. Stop Solution is 1N hydrochloric acid. Handle with care.
General Limited Warranty
Beacon Analytical Systems, Inc. (“Beacon”) warrants the products manufactured by it against defects in materials and workmanship when used in accordance with the applicable instructions for a period not to extend beyond a product’s printed expiration date. BEACON MAKES NO OTHER WARRANTY, EXPRESSED OR IMPLIED. THERE IS NO WARRANTY OF MERCHANTABILITY OR FITNESS FOR A PARTICULAR PURPOSE. The warranty provided herein and the data, specifications and descriptions of Beacon products appearing in published catalogues and product literature may not be altered except by express written agreement signed by an officer of Beacon. Representations, oral or written, which are inconsistent with this warranty or such publications are not authorized and, if given, should not be relied upon.
In the event of a breach of the foregoing warranty, Beacon’s sole obligation shall be to repair or replace, at its option, any product or part thereof that proves defective in materials or workmanship within the warranty period, provided the customer notifies Beacon promptly of any such defect. The exclusive remedy provided herein shall not be deemed to have failed of its essential purpose so long as Beacon is willing and able to repair or replace any nonconforming Beacon product or part. Beacon shall not be liable for consequential, incidental, special or any other indirect damages resulting from economic loss or property damage sustained by a customer from the use of its products. However, in some states the purchaser may have rights under state law in addition to those provided by this warranty.
BEACON ANALYTICAL SYSTEMS, INC.
82 Industrial Park Road
Saco, ME 04072
Tel. (207) 571-4302
Fax (207) 602-6502
www.beaconkits.com
Saxitoxin (PSP) Microtiter Plate Test Kit
Instructional Booklet
READ COMPLETELY BEFORE USE.
INTENDED USE
The Beacon Saxitoxin Plate Kit is a competitive ELISA for the quantitative analysis of Saxitoxin in contaminated samples
Proposal No. 13-110

26
USE PRINCIPLES
The Beacon Saxitoxin (PSP) Microtiter Plate Test Kit is a competitive enzyme-labeled immunoassay. The Saxitoxin HRP conjugate, sample extract and calibrators are pipetted into the test wells followed by Saxitoxin antibody into the test wells to initiate the reaction. During the 30 minute incubation period, PSP toxins from the sample and Saxitoxin HRP conjugate compete for binding to Saxitoxin antibody. The Saxitoxin antibody is captured on the walls of the test well. Following this 30 minute incubation, the contents of the well are removed and the wells are washed to remove any unbound PSP toxins, Saxitoxin HRP conjugate and free Saxitoxin antibody. After wash, a clear substrate is then added to the wells and any bound enzyme conjugate causes the conversion to a blue color. Following a 30 minute incubation, the reaction is stopped and the amount of color in each well is read. The color of the unknown samples is compared to the color of the calibrators and the Saxitoxin concentration of the samples is derived.
MATERIALS PROVIDED
The kit in its original packaging can be used until the end of the month indicated on the box label when stored at 2 – 8ºC.
1 plate containing 12 test strips of 8 wells each vacuum-packed in aluminized pouch with indicating desiccant.
1 vial of Negative control (Zero ppb Saxitoxin)
3 vials each containing 2 mL of Saxitoxin calibrators corresponding to 0.01, 0.08 and 0.32 µg/L (ppb) of Saxitoxin.
1 vial containing 7 mL Saxitoxin HRP Enzyme Conjugate.
1 vial containing 7 mL of Polyclonal anti-Saxitoxin antibody.
1 bottle containing 50 mL 10X Wash solution concentrate.
1 vial containing 14 mL of Substrate.
1 vial containing 14 mL of Stop Solution. (Caution! 1N HCl. Handle with care.)
1 Instructional Booklet
MATERIALS REQUIRED BUT NOT PROVIDED
Laboratory quality distilled or deionized water.
20 mM PBS (phosphate buffered saline).
Pipet with disposable tips capable of dispensing 50 µL.
Multi-channel pipet; 8-channel capable of dispensing 50 and 100 µL.
Paper towels or equivalent absorbent material.
Microwell plate or strip reader with 450nm filter.
Timer
Wash bottle
PERFORMANCE CHARACTERISTICS
SPECIFICITY
The following table shows the % cross reactivity of Saxitoxin.
Compound % CR
Saxitoxin dihydrochloride 100.00 %
Neosaxitoxin 2.28 %
Decarbamoyl STX 42.30 %
GTX 2& 3 50.00 %
GTX 1 & 4 0.48 %
Decarbamoyl GTX 2& 3 2.36 %
Decarbamoyl NeoSTX 1.50 %
B1 16.95 %
C1 and 2 12.10 %
PRECAUTIONS
Store all kit components at 4°C to 8°C (39°F to 46°F) when not in use.
Each reagent is optimized for use in the Beacon Saxitoxin (PSP) Microtiter Plate Test Kit. Do not substitute reagents from any other manufacturer into the test kit. Do not combine reagents from other Beacon Saxitoxin Plate Kits with different Lot numbers.
Dilution or adulteration of reagents or samples not called for in the procedure may result in inaccurate results.
Do not use reagents after expiration date.
Reagents should be brought to room temperature, 20 – 28ºC (62 – 82ºF) prior to use. Avoid prolonged (> 24 hours) storage at room temperature.
Saxitoxin is a toxin and should be treated with care.
The Stop Solution is 1N hydrochloric acid. Avoid contact with skin and mucous membranes. Immediately clean up any spills and wash area with copious amounts of water. If contact should occur, immediately flush with copious amounts of water.
Transfer of samples and reagents by pipette requires constant monitoring of technique. Pipetting errors are the major source of error in immunoassay methodology.
EXTRACTION SOLUTION AND DILUTION BUFFER
1. Prepare 70% Isopropanol by mixing 70 mL of Isopropanol with 30 mL of lab grade water.
2. Prepare 5% Acetic acid solution by mixing 5 mL of Acetic acid with 95 mL of lab grade water.
3. Mix 2 parts (100 mL) of 70% Isopropanol with 1 part (50 mL) of 5% Acetic acid. Use for sample extraction.
4. For sample dilution buffer, mix 10 mL of Methanol with 90 mL of 20 mM PBS buffer.
SAMPLE PREPARATION (MUSSELS)
1. Shellfish are shucked and rinsed with lab grade water.
2. Transfer 12 mussels to a sieve and gently shake the sieve to drain the excess liquid.
3. Put the drained tissue into a kitchen blender jar and homogenize to a soupy texture.
4. Tare a 50 mL conical tube and weigh 5 grams of homogenized tissue.
5. Add 10 mL of extraction solvent and vortex for 3 minutes.
6. Transfer approximately 1 mL of the extract into a microcentrifuge tube, and centrifuge for 5 minutes at 12,000 rpm.
7. Dilute the supernatant with 10% MeOH/20 mM PBS to 5000 folds before running in assay.
(e.g. 0.1 mL of the supernatant + 9.9 mL of buffer, and 0.1 mL of the diluted supernatant + 4.9 mL of buffrer)
ASSAY PROCEDURE
(Note: Running calibrators and samples in duplicate will improve assay precision and accuracy.)
1. Prepare the 1X wash solution by adding the contents of the 10X wash concentrate bottle to 450 mL Lab grade water in a wash bottle.
2. Allow reagents and sample extracts to reach room temperature prior to running the test.
3. Place the appropriate number of test wells into a micro well holder. Be sure to re-seal unused wells in the zip-lock bag with desiccant.
4. Using a pipet with disposable tips, add 50 μL enzyme conjugate to the appropriate test wells. Be sure to use a clean pipet tip for each. Add 50 µL of Calibrators or Sample extract to each well.
5. Dispense 50 µL of Antibody Solution into each test well.
6. Shake the plate gently for 30 seconds and incubate the test wells for 30 minutes.
7. Decant the contents of the wells into an appropriate waste container. Fill the wells to overflowing with wash solution and dump. Repeat 3X for a total of four washes.
8. Following the last wash tap the inverted wells onto absorbent paper to remove the last of the wash solution.
9. Dispense 100 µL of Substrate into each well.
10. Incubate the wells for 30 minutes.
11. Dispense 100 µL of Stop Solution into each test well.
12. Read and record the absorbance of the wells at 450nm using a strip or plate reader.
Proposal No. 13-110
______________________________________________________________________________________________________ ISSC (01/01/2008) Method Application & Single Lab Validation Page 1 of 4
Checklist For Acceptance of a Method for Use in the NSSP
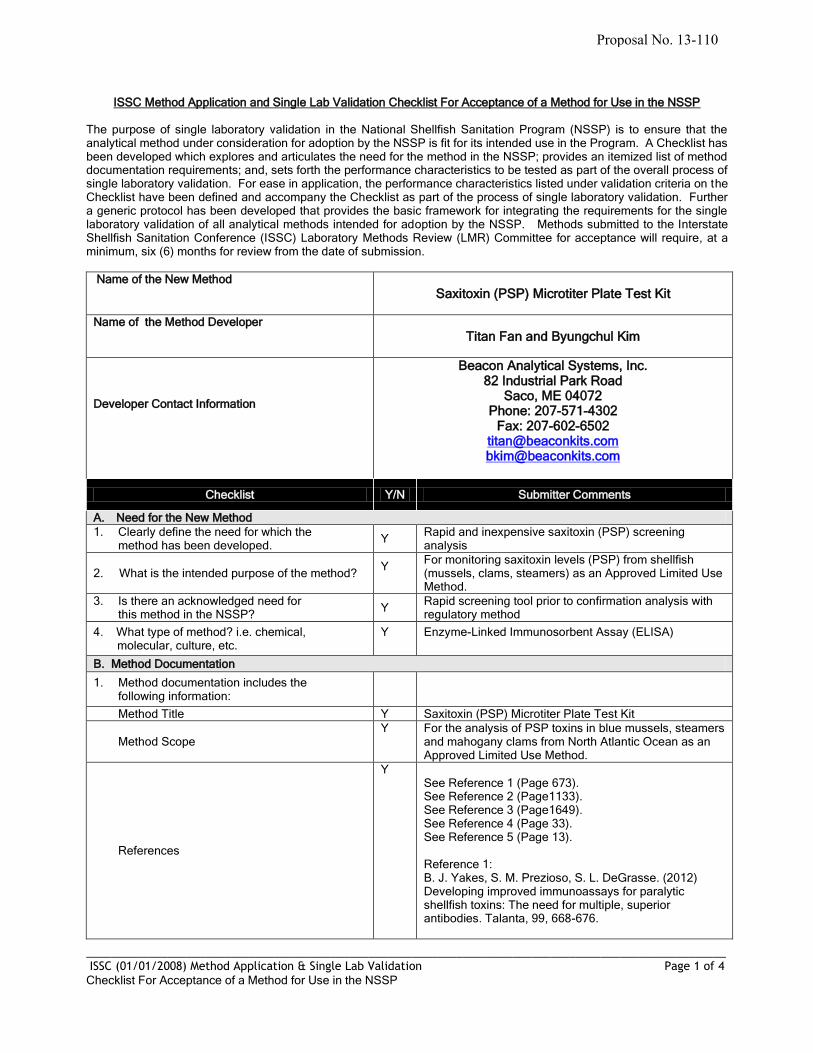
ISSC Method Application and Single Lab Validation Checklist For Acceptance of a Method for Use in the NSSP The purpose of single laboratory validation in the National Shellfish Sanitation Program (NSSP) is to ensure that the analytical method under consideration for adoption by the NSSP is fit for its intended use in the Program. A Checklist has been developed which explores and articulates the need for the method in the NSSP; provides an itemized list of method documentation requirements; and, sets forth the performance characteristics to be tested as part of the overall process of single laboratory validation. For ease in application, the performance characteristics listed under validation criteria on the Checklist have been defined and accompany the Checklist as part of the process of single laboratory validation. Further a generic protocol has been developed that provides the basic framework for integrating the requirements for the single laboratory validation of all analytical methods intended for adoption by the NSSP. Methods submitted to the Interstate Shellfish Sanitation Conference (ISSC) Laboratory Methods Review (LMR) Committee for acceptance will require, at a minimum, six (6) months for review from the date of submission.
Name of the New Method
Saxitoxin (PSP) Microtiter Plate Test Kit
Name of the Method Developer
Titan Fan and Byungchul Kim
Developer Contact Information
Beacon Analytical Systems, Inc. 82 Industrial Park Road
Saco, ME 04072 Phone: 207-571-4302
Fax: 207-602-6502 [email protected] [email protected]
Checklist Y/N Submitter Comments
A. Need for the New Method
1. Clearly define the need for which the method has been developed.
Y Rapid and inexpensive saxitoxin (PSP) screening analysis
2. What is the intended purpose of the method? Y
For monitoring saxitoxin levels (PSP) from shellfish (mussels, clams, steamers) as an Approved Limited Use Method.
3. Is there an acknowledged need for this method in the NSSP?
Y Rapid screening tool prior to confirmation analysis with regulatory method
4. What type of method? i.e. chemical, molecular, culture, etc.
Y
Enzyme-Linked Immunosorbent Assay (ELISA)
B. Method Documentation
1. Method documentation includes the following information:
Method Title Y Saxitoxin (PSP) Microtiter Plate Test Kit
Method Scope Y For the analysis of PSP toxins in blue mussels, steamers
and mahogany clams from North Atlantic Ocean as an Approved Limited Use Method.
References
Y See Reference 1 (Page 673). See Reference 2 (Page1133). See Reference 3 (Page1649). See Reference 4 (Page 33). See Reference 5 (Page 13). Reference 1: B. J. Yakes, S. M. Prezioso, S. L. DeGrasse. (2012) Developing improved immunoassays for paralytic shellfish toxins: The need for multiple, superior antibodies. Talanta, 99, 668-676.
Proposal No. 13-110

______________________________________________________________________________________________________ ISSC (01/01/2008) Method Application & Single Lab Validation Page 2 of 4
Checklist For Acceptance of a Method for Use in the NSSP
Reference 2: G. B. Inami, C. Crandall, D. Csuti, M. Oshiro, R. Brenden. (2004) Presence/Absence Screening for Saxitoxin in Frozen Acidified Mussel and Oyster Extracts from the Coast of California with In Vitro Methods, J AOAC. Int. 87 (5), 1133-1142. Reference 3: E. Usleber, R. Dietrich, C. Burk, E. Schneider, E. Martlbauer. (2001) Immunoassay Methods for Paralytic Shellfish Poisoning Toxins. J. AOAC. Int. 84 (5), 1649-1656. Reference 4: Anderson, D.M., P. Andersen, V. M. Bricelj, J. J. Cullen, and J. EE. Rensel, 2001. Monitoring and management strategies for harmful algal blooms in coastal waters, APEC #201-MR-01.1, Asia Pacific Economic Program and Intergovernmental Oceanographic Commission Technical Series No. 59, Paris. Reference 5: F. S. Chu, T. S. L. Fan. (1985) Indirect Enzyme-Linked Immunosorbent Assay for Saxitoxin in Shellfish. J. AOAC. 68 (1), 13-16.
Principle Y Competitive ELISA
Any Proprietary Aspects Y Antibody and STX-HRP conjugate
Equipment Required Y Listed in the protocol (Page 3)
Reagents Required Y Listed in the protocol (Page 3)
Sample Collection, Preservation and Storage Requirements
Y Described in the protocol (Page 3)
Safety Requirements
Y Personal safety items such as safety glasses, gloves and lab coat must be required. Calibrators and enzyme conjugate are toxic materials, and must be kept in the original vials when they are not used. Since stop solution is a strong acidic solution (1 N hydrochloric acid), skin or eye contact must be avoided. Lab items with contact of toxins (sample extract and calibrator) such as pipette tips and lab wares must be soaked in 50% of house bleach solution at least 1 hour before washing or disposal.
Clear and Easy to Follow Step-by-Step Procedure
Y Described in the protocol (Page 4)
Quality Control Steps Specific for this Method
Y Described in the protocol (Page 5)
C. Validation Criteria
1. Accuracy / Trueness Y Described in the protocol (Page 5, Table 1 - 3)
2. Measurement Uncertainty Y
3. Precision Characteristics (repeatability and reproducibility)
Y
The precision of the method is consistent for the three sample matrices. Each sample was tested with three different levels of saxitoxin. See the details on Page 23 and Table 5 – 10.
4. Recovery Y Described in the protocol (Table 11 – 17)
5. Specificity Y Described in the protocol (Page 6, Table 18)
6. Working and Linear Ranges Y Described in the protocol (Page 6, Figure 1)
7. Limit of Detection Y Described in the protocol (Page 6, Table 19 – 21)
8. Limit of Quantitation / Sensitivity Y Described in the protocol (page 6, Table 19 - 21)
9. Ruggedness Y Described in the protocol (Page 5, Table 4)
10. Matrix Effects Y There is no matrix effect observed due to the high degree of dilution (15000) of sample before the assay. The potential matrix effect from any shellfish species
Proposal No. 13-110

______________________________________________________________________________________________________ ISSC (01/01/2008) Method Application & Single Lab Validation Page 3 of 4
Checklist For Acceptance of a Method for Use in the NSSP
could be eliminated by this high dilution.
11. Comparability (if intended as a substitute for an established method accepted by the NSSP)
D. Other Information
1. Cost of the Method Y $325 per kit to test up to 44 samples (≈$7 per sample)
2. Special Technical Skills Required to Perform the Method
Y Some ELISA experience or basic training required
3. Special Equipment Required and Associated Cost
Y Described in the protocol (Page 3)
4. Abbreviations and Acronyms Defined Y Described in the protocol (Page 4)
5. Details of Turn Around Times (time involved to complete the method)
Y
One person may test 50 – 100 samples in a day including sample preparation time (shucking, grinding and extracting). Single assay can be done in 90 minutes testing up to 44 samples with duplicate.
6. Provide Brief Overview of the Quality Systems Used in the Lab
The manufacture of the kit was conducted in compliance with GMP (Good Manufacturing Practices) regulations.
Submitters Signature
Date: June 26, 2013
Submission of Validation Data and Draft Method to Committee
Date:
Reviewing Members
Date:
Accepted
Date:
Recommendations for Further Work
Date:
Comments:
Proposal No. 13-110

______________________________________________________________________________________________________ ISSC (01/01/2008) Method Application & Single Lab Validation Page 4 of 4
Checklist For Acceptance of a Method for Use in the NSSP
DEFINITIONS 1. Accuracy/Trueness - Closeness of agreement between a test result and the accepted reference value. 2. Analyte/measurand - The specific organism or chemical substance sought or determined in a sample. 3. Blank - Sample material containing no detectable level of the analyte or measurand of interest that is subjected to the
analytical process and monitors contamination during analysis. 4. Comparability – The acceptability of a new or modified method as a substitute for an established method in the NSSP. Comparability must be demonstrated for each substrate or tissue type by season and geographic area if applicable. 5. Fit for purpose – The analytical method is appropriate to the purpose for which the results are likely to be used. 6. HORRAT value – HORRAT values give a measure of the acceptability of the precision characteristics of a method.
4
7. Limit of Detection – the minimum concentration at which the analyte or measurand can be identified. Limit of detection is matrix and analyte/measurand dependent.
4
8. Limit of Quantitation/Sensitivity – the minimum concentration of the analyte or measurand that can be quantified with an acceptable level of precision and accuracy under the conditions of the test.
9. Linear Range – the range within the working range where the results are proportional to the concentration of the analyte or measurand present in the sample. 10. Measurement Uncertainty – A single parameter (usually a standard deviation or confidence interval) expressing the
possible range of values around the measured result within which the true value is expected to be with a stated degree of probability. It takes into account all recognized effects operating on the result including: overall precision of the complete method, the method and laboratory bias and matrix effects.
11. Matrix – The component or substrate of a test sample. 12. Method Validation – The process of verifying that a method is fit for purpose.
1
13. Precision – the closeness of agreement between independent test results obtained under stipulated conditions.1, 2
There are two components of precision: a. Repeatability – the measure of agreement of replicate tests carried out on the same sample in the same laboratory by the same analyst within short intervals of time. b. Reproducibility – the measure of agreement between tests carried out in different laboratories. In single
laboratory validation studies reproducibility is the closeness of agreement between results obtained with the same method on replicate analytical portions with different analysts or with the same analyst on different days.
14. Quality System - The laboratory’s quality system is the process by which the laboratory conducts its activities so as to provide data of known and documented quality with which to demonstrate regulatory compliance and for other decision–making purposes. This system includes a process by which appropriate analytical methods are selected, their capability is evaluated, and their performance is documented. The quality system shall be documented in the laboratory’s quality manual.
15. Recovery – The fraction or percentage of an analyte or measurand recovered following sample analysis. 16. Ruggedness – the ability of a particular method to withstand relatively minor changes in analytical technique, reagents, or environmental factors likely to arise in different test environments.
4
17. Specificity – the ability of a method to measure only what it is intended to measure.1
18. Working Range – the range of analyte or measurand concentration over which the method is applied. REFERENCES:
1. Eurachem Guide, 1998. The Fitness for Purpose of Analytical Methods. A Laboratory Guide to Method Validation and Related Topics. LGC Ltd. Teddington, Middlesex, United Kingdom.
2. IUPAC Technical Report, 2002. Harmonized Guidelines for Single-Laboratory Validation of Methods of Analysis, Pure Appl. Chem., Vol. 74, (5): 835-855.
3. Joint FAO/IAEA Expert Consultation, 1999. Guidelines for Single-Laboratory Validation of Anilytical Methods for Trace-Level Concentrations of Organic Chemicals.
4. MAF Food Assurance Authority, 2002. A Guide for the Validation and Approval of New Marine Biotoxin Test Methods. Wellington, New Zealand.
5. National Environmental Laboratory Accreditation. , 2003. Standards. June 5. 6. EPA. 2004. EPA Microbiological Alternate Procedure Test Procedure (ATP) Protocol for Drinking Water,
Ambient Water, and Wastewater Monitoring Methods: Guidance. U.S. Environmental Protection Agency (EPA), Office of Water Engineering and Analysis Division, 1200 Pennsylvania Avenue, NW, (4303T), Washington, DC 20460. April.
Proposal No. 13-110

Talanta 99 (2012) 668–676Proposal No. 13-110
Contents lists available at SciVerse ScienceDirect
Talanta
0039-91
http://d
n Corr
E-m1 Pr
Road, A
journal homepage: www.elsevier.com/locate/talanta
Developing improved immunoassays for paralytic shellfish toxins: The needfor multiple, superior antibodies
Betsy Jean Yakes a,n, Samantha M. Prezioso b,1, Stacey L. DeGrasse a
a U.S. Food and Drug Administration, Center for Food Safety and Applied Nutrition, 5100 Paint Branch Parkway, College Park, MD 20740, USAb Joint Institute for Food Safety and Applied Nutrition (JIFSAN), University of Maryland, College Park, MD 20742, USA
a r t i c l e i n f o
Article history:
Received 17 April 2012
Accepted 25 June 2012Available online 25 July 2012
Keywords:
Surface plasmon resonance
Paralytic shellfish poisoning
Saxitoxin
Lateral flow immuno-chromatography
Immunoassay
Cross-reactivity
40/$ - see front matter Published by Elsevier
x.doi.org/10.1016/j.talanta.2012.06.073
esponding author. Tel.: þ1 240 402 2720, fax
ail address: [email protected] (B.J. Yak
esent address: Centers for Disease Control a
tlanta, GA 30333, USA.
a b s t r a c t
Paralytic shellfish toxins (PSTs) are a risk to humans upon consumption of contaminated seafood.
The PST family is comprised of more than twenty congeners, with each form having a different potency.
In order to adequately protect consumers yet reduce unnecessary closures of non-contaminated
harvesting areas, a rapid method that allows for analysis of sample toxicity is needed. While a number
of PST immunoassays exist, the outstanding challenge is linking quantitative response to sample
toxicity, as no single antibody reacts to the PST congeners in a manner that correlates with potency. A
novel approach, then, is to combine multiple antibodies of varying reactivity to create a screening
assay. This research details our investigation of three currently available antibodies for their reactivity
profiles determined using a surface plasmon resonance biosensor assay. While our study shows
challenges with detection of the R1-hydroxylated PSTs, results indicate that using multiple antibodies may
provide more confidence in determining overall toxicity and the toxin profile. A multiplexed approach
would not only improve biosensor assays but could also be applied to lateral flow immuno-chromato-
graphic platforms, and such a theoretical device incorporating the three antibodies is presented. These
improved assays could reduce the number of animal bioassays and confirmatory analyses (e.g., LC/MS),
thereby improving food safety and economic use of shellfish resources.
Published by Elsevier B.V.
1. Introduction
Paralytic shellfish poisoning (PSP) is caused by a suite oftoxins, known collectively as paralytic shellfish toxins (PSTs) [1].Saxitoxin (STX) and its congeners originate from certain dino-flagellates and some cyanobacteria [2]. Filter feeding bivalves(e.g., mussels, clams, cockles, scallops and oysters), as well asother seafood species, can accumulate and metabolize thesetoxins which can then lead to potentially dangerous seafood[3,4]. Human consumption of toxic seafood can result in tingling,numbness, respiratory paralysis and potentially death [5], as thePSTs bind to site 1 and block the opening of voltage gated sodiumchannels [6]. These small molecule toxins are also quite robust,and typical preventative food safety measures (i.e., use of heat oracid during cooking) do not destroy the PSTs [1].
Proper monitoring and implementation of harvesting bans whentoxin concentrations exceed safe levels (typically 80 mg STX equiva-lents per 100 g tissue) have minimized PSP illnesses [1]. However,outbreaks still occur, especially in developing countries [7] and with
B.V.
: þ1 301 436 2624.
es).
nd Prevention, 1600 Clifton
an estimated worldwide mortality of 6% [8]. For example, a majorPSP epidemic occurred in Guatemala in 1987 that claimed the livesof 26 people out of the 187 affected [7,9]. A review of PSP cases andoutbreaks has been compiled by FAO, which reports PSP prevalencealong coastal European nations, parts of Africa, the West Coast andNortheast region of North America, South America, and parts of Asia[10]. Within the US, the majority of illnesses and outbreaks arereported from recreational harvests among fishermen and tribalcommunities. For example, during May and June of 2011, 21 cases ofPSP illness were reported in Southeast Alaska due to unprecedentedhigh levels of PSTs in surrounding waters [11].
Recent reviews on PST detection have focused on improvedanalysis of both coastal waters and seafood [1,2,12,13]. Themouse bioassay (MBA) is one of the AOAC approved and mostcommonly used testing methods for PSTs [14]. While simple, thisbioassay suffers performance related challenges (e.g., poor quan-titation and low dynamic range, interferences to detection, lowsample throughput, and lack of determination of the specific toxinassociated with death) as well as ethical concerns.
A second AOAC approved method for determining PSTs is highperformance liquid chromatography (HPLC) with fluorescencedetection (FD) [15,16]. This method is quite effective at identifyingand quantifying the toxins in a seafood sample. However, it requiresa lengthy sample clean-up and pre-column oxidation procedure to

B.J. Yakes et al. / Talanta 99 (2012) 668–676 669Proposal No. 13-110
create fluorescent derivatives of the toxins for detection as well asmultiple analytical runs for complete PST determination. The post-column HPLC-FD method created by Oshima [17] was refined [18]and is also now AOAC approved [19]. This post-column oxidationmethod has a simpler sample preparation procedure than pre-column HPLC-FD; however, multiple analytical runs under differentchromatographic conditions must be conducted in order to analyzeall potential PST congeners. Furthermore, both HPLC-FD approachescan be hindered by sample materials that have native fluorescence,requiring additional steps to ensure the presence of toxins [20].
Other analytical techniques that are advancing include liquidchromatography (LC) coupled with mass spectrometry (MS)[21,22], some in tandem with biosensors [23]. The major limita-tion of this analytical approach is matrix interference and ioniza-tion suppression, which restricts its ability to serve as a reliable,quantitative monitoring tool. Limited availability of internalreference standards (e.g., isotopically labeled toxins) currentlyhinders wider-spread implementation of monitoring by LC/MS.
In order to overcome the challenges associated with MBA and LCmethods, rapid screening techniques have been explored. Thesemethods can be simple, cost-effective, sensitive, and accurate forhigh-throughput detection needs. Such methods include receptorbinding assays (RBA) [24–27], lateral flow immuno-chromatography[28,29], enzyme-linked immunosorbent assays (ELISA) [30–32], andcell bioassays [33,34]. While these methods allow for high through-put and ease of use, they suffer from the use of difficult to procureradiolabeled materials for RBA, high probability of false-positive andpotential for false-negative results with current immuno-chromato-graphic PSP tests, large amounts of manual labor and limitedantibody cross-reactivity for ELISA, and nonspecific toxin recogni-tion for the cell bioassays.
An immunological technique that has been shown to providehigh throughput detection of PSTs is surface plasmon resonance(SPR) biosensors [35–38], though this method faces the samechallenges with respect to antibody reactivity. SPR immunoassaysare based on specific biosensor platforms that bind the molecule
Table 1PST structure, congener forms, and relative toxicities [
R1 R2 R3 Carbamate
H H H STXOH H H NEOOH H OSO3
� GTX1H H OSO3
� GTX2H OSO3
� H GTX3OH OSO3
� H GTX4
R4:
of interest at the surface. The change in mass due to binding isdetected as a change in refractive index (RI) at the dielectricinterface (i.e., gold immunoassay substrate and solution in theflow cell). This RI change causes a shift in the SPR band positionthat can be tracked in real-time using standard spectroscopyoptics [39]. This automated technique allows for real-time ana-lysis of PST-containing samples, requires minimal samplecleanup, no labeling of the analytes, and yields sub-ppb limitsof detection in less than ten min [40,41].
The SPR assay for the determination of PSTs currently imple-mented in our laboratory is robust and shows good repeatabilityand reproducibility; however, quantitative results do not alwayscorrelate with overall sample toxicity due to the many PSTcongeners having widely varying potency. The toxicities for com-mon PSTs are shown in Table 1, and the inability to correlate resultswith sample toxicity when using immunological assays couldlead to unsafe seafood harvested for consumers (false-negative) ordestruction of safe seafood and closure of non-contaminatedharvesting areas (false-positive). Clearly, there is a need forimproved assays to not only protect the public but also to improvethe economic viability of the industry and utilization of seafoodresources. Unfortunately, a single antibody that reacts to thecongeners with respect to their potency has yet to be produced.An advantage to the SPR assay is that while the response may notalways correlate with toxicity, the cross-reactivity of individualcongeners with an antibody can be calculated. A novel approach,then, would be to combine multiple antibodies of varying reactivityto the congeners, as screened via the SPR assay, to create amultiplexed immunoassay.
One disadvantage to SPR biosensors is the size of instrumenta-tion and cost of materials which could prohibit routine testing inthe field or dockside. Lateral flow immuno-chromatographic tests(LFIs) have been used for PST testing and could fulfill therequirements of an easy-to-use and cost-effective technique formonitoring potential toxicity of seafood when the quantitationand automation of the SPR instrumentation is not necessary.
17]. Toxins used in this study are listed in bold.
Toxin Relative Toxicity
STX 1.00
dcSTX 0.51
GTX2,3 0.36, 0.64
B1 (GTX5) 0.06
C1,2 0.01, 0.10
dcGTX2,3 0.15, 0.38
NEO 0.92
dcNEO –
GTX1,4 0.99, 0.73
Decarbamoyl N-sulfocarbamoyl
dcSTX B1 (GTX 5)dcNEO B2 (GTX 6)
dcGTX1 C3
dcGTX2 C1dcGTX3 C2dcGTX4 C4

B.J. Yakes et al. / Talanta 99 (2012) 668–676670Proposal No. 13-110
The challenge with these rapid tests also lies in the inability toaccurately measure sample toxicity, and the performance of suchdevices has been extensively studied [28,29,42]. To potentiallyenhance the reliability of the LFIs, multiple antibodies that havedistinct reactivity patterns as determined in the SPR assay couldbe employed.
This manuscript details our work that evaluated three anti-bodies for their reactivity to nine commonly occurring PSTs. Thedata indicate that a multiplexed approach may not only improveSPR biosensor assays but could also be incorporated into LFIplatforms for more reliable, rapid, inexpensive screening options.Such approaches could then allow for more successful assessment ofoverall sample toxicity and better use of confirmatory (e.g., LC-MS orMBA) techniques. The research introduced herein sets the stage forthese multi-antibody devices and discusses the potential challengeswhen using the antibodies profiled in this study.
2. Materials and methods
2.1. Reagents
Saxitoxin (STX) dihydrochloride used in this research is the FDAreference standard, now available from the National Institute ofStandards and Technology (81.0 mg/mL free base in 20% ethanol/80%water). N-sulfocarbamoyl-gonyautoxin-2 and -3 (C1,2, 70.8 mg/mL),decarbamoylgonyautoxin-2 and -3 (dcGTX2,3, 51.4 mg/mL), decar-bamoylneosaxitoxin dihydrochloride (dcNEO, 7.93 mg/mL free base),decarbamoylsaxitoxin dihydrochloride (dcSTX, 16.0 mg/mL freebase), gonyautoxin-1 and -4 (GTX1,4, 58.0 mg/mL), gonyautoxin-2and -3 (GTX2,3, 62.1 mg/mL), gonyautoxin-5 (B1, 24.7 mg/mL), andneosaxitoxin dihydrochloride (NEO, 20.6 mg/mL free base) werepurchased from NRC Certified Reference Materials Program, Insti-tute for Marine Biosciences (Halifax, Nova Scotia, Canada).
Standard laboratory reagents were procured from Sigma-Aldrich(St. Louis, MO), Pharmaco AAPER (Shelbyville, KY), and J.T. Baker(Phillipsburg, NJ). Millipore Milli-Q 18.2 MO cm water (Billerica,MA) was used to prepare buffers. Sensor chips, amine coupling kit(1-ethyl-3-(3-dimethylaminopropyl)-carbodiimide (EDC), N-hydro-xysuccinimide (NHS), and ethanolamine), and buffer (10 mMHEPES, 150 mM NaCl, 3 mM EDTA, and 0.05% (v/v) surfactant P20buffer (HBS-EPþ)) were obtained from GE Healthcare, Biacore(Piscataway, NJ).
2.2. Clam matrix
Control clam extract was prepared following a standard shell-fish extraction procedure for PSTs (see [15] for procedure). A totalof 100 g of clam was homogenized, from which a 5.0 g (70.1 g)aliquot was thoroughly mixed with 3.0 mL of 1% acetic acid inwater. This was heated at 95 1C for 5 min. The sample was thenremoved and placed on ice until cool enough to handle. Thesample was vortexed and then centrifuged at 3600g for 10 min.The supernatant was collected into a 15 mL glass centrifuge tube.Another 3.0 mL, 1% acetic acid aliquot was added to the homo-genate; the solution was vortexed and centrifuged at 3600g for10 min. Following collection of the supernatant in the same 15 mLcentrifuge tube, the extract volume was brought up to 10 mL with0.1 N HCl with a final pH of 4.0. The clam extract was then filteredthrough a Supelco Supelclean LC-18, 3 mL solid phase extraction(SPE) cartridge (Sigma-Aldrich). The cartridge was conditionedwith 6 mL methanol followed by 6 mL of water. Clam extract(1 mL) was added to the cartridge followed by 2 mL of water, andthe cartridge was run dry. This extraction procedure produced 5 gof clam tissue per 40 mL and at the action level (i.e., 80 mg STXequivalents per 100 g tissue), equates to 100 ng STX eq./mL in the
SPR biosensor assay. Standards were prepared by spiking thecontrol clam matrix with the PSTs followed by serial dilution ofthese stock concentrations using the control clam matrix. Blanksolutions containing no PSTs (0 ng/mL) were performed withcontrol clam matrix for each PST calibration curve.
2.3. Mixed PST standards
Stock solutions of 90% STX with 10% NEO, 77% B1 with 23%STX, and 80% GTX1,4 with 20% STX were prepared and thenserially diluted in clam matrix. The stock solutions were designedto have overall toxicity of 160 mg STX eq./100 g tissue for thosestandards containing NEO and GTX1,4, while the B1 standard hada stock concentration of 80 mg STX eq./100 g.
2.4. Antibodies
Two antibodies used in this research are commercially avail-able in ELISA kits. The first antibody (Ab1) was used as receivedfrom the kit (Ridascreen Fast PSP SC, R-Biopharm AG, Darmstadt,Germany). Standard antibody dilutions were run on the STX chip;the 1:5 dilution in HBS-EPþ used throughout these studies had aresponse similar to that obtained from the 8 mg/mL burro anti-STX also used in this study as described below (see [41]).
The second antibody (polyclonal anti-STX, Ab2) was gener-ously supplied in a purified form (ammonium sulfate precipita-tion followed by dialysis against 10 mM PBS, pH 7.3) from BeaconAnalytical Systems (Saco, ME). The concentration that gave thesame signal (�150 RU) as 8 mg/mL burro anti-STX was 25 mg/mL,and this concentration was used for all PST immunoassays.
The third antibody (polyclonal, protein G purified burro anti-STX, Ab3) was obtained from the U.S. Army Medical ResearchInstitute of Infectious Diseases (Fort Detrick, MD). Antibodydilutions were run to determine the appropriate concentrationfor immunoassay, and 8 mg/mL was used for all studies herein.
2.5. Instrumentation
A Biacore T100 (GE Healthcare) surface plasmon resonancebiosensor was used for all SPR immunoassays. The instrumentwas run via the Biacore T100 Controller Software v. 2.0, and dataevaluation was performed with the Biacore T100 EvaluationSoftware v. 2.0. The instrument and sensor chips were normalizedfollowing the manufacturer procedures prior to performing thePST immunoassays. The SPR response (Resonance Unit, RU) is ameasure of the angle of minimum reflected intensity that occursupon changes in refractive index where 1 RU corresponds to a10�6 change in refractive index (�10�4 degree angle shift).
2.6. Sensor chip
The STX biosensor surface was prepared on a Series S CM5sensor chip and has been previously described [41]. Briefly, allflow cells were activated to succinimidyl esters using the instru-ment amine immobilization wizard and EDC/NHS from the aminecoupling kit. Flow cell one was then deactivated with ethanola-mine to create a reference surface, while flow cells two throughfour were activated with jeffamine, and unreacted sites wereblocked with ethanolamine. The chip was removed from theinstrument, and STX was conjugated to the chip surface via15 h, 37 1C reaction with formaldehyde in 100 mM phosphatebuffer. The chip was then rinsed with water, dried with N2(g), anddocked into the SPR instrument. The fluidics and sensor chip wereprimed with HBS-EPþ , and three startup cycles with 50 mMNaOH were performed prior to running the standards.

B.J. Yakes et al. / Talanta 99 (2012) 668–676 671Proposal No. 13-110
2.7. Immunoassay
Immunoassays were performed using the Biacore T100 opticalbiosensor with HBS-EPþ as the running buffer. The samplecompartment temperature was set at 10 1C while the analysistemperature was held constant at 25 1C. The antibodies werediluted as noted above and then mixed in the instrumentautosampler (90% Ab to 10% standard, 600 s mix time) prior toinjection. This mixture was injected over the STX sensor chip at aflow rate of 20 mL/min for 120 s followed by a 60 s dissociationperiod and then a 240 s regeneration with 50 mM NaOH. STXcontrols (0.3, 3, 30, and 300 ng/mL in HBS-EPþ with 8 mg/mLAb3) were run with every cycle to ensure chip stability.
2.8. Data processing
The response (RUPST) for each sample was obtained by sub-tracting the baseline (10 s prior to injection) from the stabilitypoint (15 s after sample injection completion). These values werethen normalized to the blank (0 ng/mL PST for associated anti-body, RU0), and the results multiplied by 100 to achieve percentbinding for each antibody/PST combination: % binding¼(RUPST/RU0)�100.
Each flow cell was normalized separately, and the data fromflow cells 2, 3, and 4 were averaged together. Due to nonspecificbinding and bulk effects for Ab1, the background from the blankmeasurement (0.45 normalized response) was subtracted fromeach data point for this antibody. The average response was thenplotted versus the original solution concentration for each PST inng/mL. Curve fitting was performed using a variable slope, fourparameter model for log(inhibitor) vs. response in GraphPadPrism (v. 5.02, La Jolla, CA). GraphPad Prism was then used tocalculate the values at inhibitory concentrations (IC): IC20 (80%binding), IC50 (50% binding), and IC80 (20% binding). Additionally,the response at 100 ng/mL for each PST based on the generatedcurves was determined. For concentrations where full inhibitionwas not seen (e.g., C1,2 with Ab3 where the highest standard gave49.8% binding without flattening of the curve), the softwareextrapolates the curve fit to determine the 20% binding point.
Cross-reactivities (CR) for each PST were calculated from theIC50 values of each toxin with respect to the IC50 of STX:% CR¼(IC50, STX/IC50, PST)�100. The 100 ng/mL level is definedas the response at the action level (RAL) and is equivalent to asample containing only STX at 80 mg/100 g tissue based onextraction dilution.
For the theoretical lateral flow immuno-chromatography, thereactivity for each antibody-PST congener was translated to aband in the device. For Fig. 3, the RALs (100 ng/mL from Table 3)were used, while in Fig. 4 the response at 80 mg STX eq./100 gtissue were translated to band patterns. To account for differingsensor chips and nonspecific binding in Fig. 3, the values werecorrected for each antibody by subtracting the background(Ab1¼12.45, Ab2¼8.60, Ab3¼3.43) from each response. UsingPowerPoint, the color of the band was defined by the RGBparameters 128 red, 0 green, 0 blue with the transparency ofthe band equal to (100—Response).
Fig. 1. Antibody reactivity with nine common PSTs. N¼3 with error bars smaller
than the data points. The vertical grey line at 100 ng/mL represents the action
level for a sample containing only STX (80 mg STX/100 g tissue).
3. Results and discussion
3.1. Cross-reactivity (CR) of antibodies
Previous research has focused on developing rapid, sensitiveSPR assays that are capable of detecting PSTs in buffer [41] andcommon shellfish matrices [36]. The challenge to correctly esti-mating sample potency lies in the current inability of antibodies to
react with the congeners according to their toxicities (Table 1). ThePSTs can be classified into three major categories with theirtoxicities generally following the R4 substituent groupings: carba-mate4decarbamoyl4N-sulfocarbamoyl. It has been shown that

Fig. 2. Cross-reactivity for each antibody (from Table 3) in comparison to the toxin equivalency factors (from [17]) for each PST. For PST congeners where epimers are
reported in pairs (e.g., GTX1,4) the value of the epimer with the higher TEF is used. No TEF value for dcNEO is reported by Oshima.
Blank(Negative)
B1
GTX1,4NEOSTX(Positive)
C1,2dcGTX2,3dcNEO
dcSTXGTX2,3
Fig. 3. Conceptual lateral flow immunochromatographic devices for samples containing a single PST at 100 ng/mL. Each strip corresponds to an individual antibody
(left to right: Ab1, Ab2, Ab3) in which a competition assay is performed with the analyte.
Table 2IC50 and dynamic range (DR¼IC20 to IC80) for each antibody. All values in ng/mL.
PST Ab1: RidaScreen Ab2: Beacon Ab3: Burro
IC50 DR IC50 DR IC50 DR
STX 11.9 2.7–54.3 3.0 1.4–7.7 3.4 1.6–6.9
NEO 1834.9 530.5–9986.0 131.7 23.1–793.1 116.0 17.5–726.4
GTX1,4 2346.7 324.9–16197.1 630.3 260.9–1955.7 470.3 79.2–3438.4
GTX2,3 10.1 3.1–41.4 6.0 3.0–14.3 2.1 0.4–24.6
dcSTX 58.6 16.2–290.7 7.1 2.6–24.7 22.0 0.8–442.4
dcNEO 2369.6 964.5–3724.2 199.3 100.5–593.0 642.5 43.2–39711.6
dcGTX2,3 20.1 4.2–165.9 126.9 30.7–606.1 426.6 15.9–5851.5
B1 236.4 58.1–920.7 17.7 8.8–40.8 167.4 5.5–2673.5
C1,2 266.4 56.1–1716.3 24.8 4.6–190.7 9983.5 75.1–2091542
B.J. Yakes et al. / Talanta 99 (2012) 668–676672Proposal No. 13-110
different antibodies can have different cross-reactivities to the PSTcongeners [43]. To take advantage of this characteristic, the cross-reactivity of three available antibodies are examined herein usingSPR biosensor evaluation to determine the feasibility and merits ofusing a multi-antibody approach for both SPR biosensors and LFIs.
Fig. 1 shows the cross-reactivity curves of the binding ofeach antibody with STX, NEO, GTX1,4, GTX2,3, dcSTX, dcNEO,dcGTX2,3, B1 and C1,2. These assays were designed to havenearly-complete inhibition with STX at the action level (indicatedby a vertical grey line in the graphs). Qualitatively, it is clear that

Table 3SPR-determined antibody cross-reactivities (CR in %), reported ELISA cross-reactivities,
and responses at the action level (RAL in normalized RU, at 100 ng STX/mL).
PST Ab1 Ab2 Ab3
CR ELISAa RAL CR ELISAa RAL CR RAL
STX 100.0 100 12.5 100.0 100.0 8.6 100.0 3.4
NEO 0.7 12 96.5 2.3 0.8 55.4 2.9 52.8
GTX1,4 0.5 89.6 0.5 o0.1 94.9 0.7 76.9
GTX2,3 118.3 70 12.5 49.4 12.0 10.2 158.5 14.1
dcSTX 20.4 20 37.0 42.0 18.0 11.5 15.2 34.4
dcNEO 0.5 97.1 1.5 0.7 80.2 0.5 71.1
dcGTX2,3 59.2 24.3 2.3 0.4 55.7 0.8 65.0
B1 5.0 70.1 16.8 10.8 2.0 55.3
C1,2 4.5 70.2 12.0 26.9 0.03 78.5
a Values for the ELISA cross-reactivities obtained from pamphlet information
contained in the kits.
B.J. Yakes et al. / Talanta 99 (2012) 668–676 673Proposal No. 13-110
the antibodies have distinct reactivity with the nine PST con-geners, as the calibration curve patterns for each antibody aredissimilar. This can be further seen in the individual congenerplots (Supplementary materials A) where it is visually easy tocompare the similarities (e.g., the three antibody curves for STXare similar with Ab2 and Ab3 responses nearly overlapping) anddifferences (e.g., the curve shapes for the three antibodies react-ing with B1 are quite dissimilar). The data can also be quantita-tively evaluated via IC50 and dynamic range (Table 2) as well aspercent cross-reactivities and responses at the action level (RAL)(Table 3). When these results are considered together, it is clearthat no antibody profile accurately reflects potency; however,each antibody has a distinct profile with advantages and dis-advantages as discussed below.
For RidaScreen (Ab1), high reactivity (4100% CR) with STXand GTX2,3 is seen while low reactivity (o5% CR) with manycongeners is observed. When used in an assay alone, Ab1 wouldbe expected to yield false-negative results when the highly toxicNEO and GTX1,4 are present. Beacon (Ab2) has high reactivitywith STX but low reactivity with NEO, GTX1,4, dcNEO, anddcGTX2,3. In this case, samples high in GTX1,4 and/or NEO mayalso result in false-negatives. Additionally, the moderate reactiv-ity (�15% CR) with low potency B1 and C1,2 may result in false-positive results if these toxins dominated the profile. Finally, theBurro (Ab3) has high reactivity with STX and GTX2,3 and to alesser extent with all congeners tested. In this scenario, a samplewith a toxin profile dominated by GTX1,4, and/or NEO may bescreened as negative when toxin levels may be above the actionlevel, whereas a false-positive may occur if GTX2,3 dominated thesample.
When comparing the profiles based on substitution groups(R1 to R4 as shown in Table 1, Supplementary materials B1–B3),all antibodies show limited reactivity with OH modification at theR1 group potentially due to steric hindrance, charge, or hydro-philicity imparted by this group. Indeed, weak reactivity with theR1-hydroxylated PSTs is frequently found with antibodies [43].Antibody cross-reactivity for the non-hydroxylated compounds ismainly driven by the R4 functionality with highest reactivity seenin the carbamate modified PSTs followed by decarbamoyl PSTforms and N-sulfocarbamoyl conjugations.
The two antibodies used for this work that were obtainedfrom commercial ELISA kits have been previously evaluated forcross-reactivities (Table 3). For Ab1, the published cross-reactivityorder (STX4GTX2,34dcSTX4NEO) is similar to the SPR results(GTX2,34STX4dcGTX2,34dcSTX4B14C1,24NEO4GTX1,4¼dc-NEO) except for the exchange of STX with GTX2,3. This discrepancymay not be significant due to the very similar reactivity of the
antibody to these PSTs as seen in the SPR curves in Fig. 1. For Ab2,the published results are STX4dcSTX4GTX2,34NEO4dcNEO4dcGTX2,34GTX1,4; however, the SPR analysis showed STX4GTX2,34dcSTX4B14C1,24NEO¼dcGTX2,34dcNEO4GTX1,4.The order differences of GTX2,3/dcSTX as well as NEO/dcNEO/dcGT2,3could be expected due to the very similar curve shapes and, withthe error in measurements, these values may not be significantlydifferent.
One further and important consideration is how cross-reactiv-ity corresponds to toxin-equivalency factors (TEFs) for each PST(Fig. 2). The values for STX are set at 100%, based on thedefinitions for TEF and CR, and therefore show no differencesbetween potency and cross-reactivity with each antibody. Ideally,the best antibody profile would have CRs to each congener thatmatch their TEFs. However, it is clear that antibodies performpoorly at matching the TEF values, especially for R1-hydroxylatedtoxins (e.g., NEO and GTX1,4) and with varied success for the non-hydroxylated congeners. For example, Ab2 cross-reactivities cor-respond reasonably well with the TEF for GTX2,3, dcSTX and C1,2,while Ab1 and Ab3 cross-reactivities correlate closely with theTEF for B1. These distinctions in reactivity between the antibodiescould be exploited for use in a multiplexed format to create anassay that would yield more information regarding the toxinprofile and thus more confidence in sample potency.
3.2. Theoretical lateral flow immuno-chromatography
In general, the format of the LFI used to detect PSTs is acompetitive displacement assay. In this assay, sample extract isadded to the sample well of the pad and is drawn up through themembrane. The toxin first interacts with the conjugate padcontaining antitoxin-coated gold particles. The antibody and toxininteract and remaining antitoxin-coated gold particles bind to thetest line coated with toxin conjugated protein. The higher thetoxin concentration in solution the fainter the red line at the testline position. A control line is also present and should alwaysyield a strong red response. In this way, two red bands indicatethat a sample contains little to no toxin, whereas a single band atthe control position indicates the sample contains toxin.
By using the antibodies screened via SPR, combinations ofantibodies that create a unique pattern could be incorporated intoan LFI for higher confidence in sample toxicity. Prior to under-taking extensive studies in incorporating multiple antibodies intoan LFI, a theoretical model was designed and is shown in Fig. 3with each strip in the three-strip system containing a singleantibody-gold colloid. In envisioning the LFI functionality, onlysingle toxin solutions at 100 ng/mL (e.g., equivalent to the actionlevel for a toxin containing only STX, per extraction procedureused) are applied to each three-strip system. As can be seen in theSTX LFI and Blank LFI, a positive sample would have only thethree control bands while a negative result would show controlbands as well as three strong bands at the test line position beloweach control band.
The theoretical LFIs for the other PST congeners show that,indeed, more confidence in sample toxicity could be gained byusing multiple antibodies. For example, the pattern for B1 (whichhas low toxicity) with only Ab2 indicates an unsafe sample(a false-positive result), but when used in combination with theinformation from the Ab1 and Ab3 strips the pattern and strengthof the bands could allow a user to realize the sample is safe forharvest and consumption. Unfortunately, false-negative resultswere still not eliminated. This is demonstrated in the NEO andGTX1,4 conceptual tests in which these two LFIs demonstratevery little discernible difference from the blank (negative), yethave concentrations equivalent to toxicity near the action level.

Ab3Ab2
Ab1
Ab3Ab2
Ab1
80% GTX1,4 and 20% STX
Ab3Ab2
Ab1
77% B1 and 23% STX
0.8 8 20 40 80 160Ab3
Ab2Ab10
102030405060708090
100
Nor
mal
ized
Res
pons
e
0102030405060708090
100
Nor
mal
ized
Res
pons
e
0102030405060708090
100
Nor
mal
ized
Res
pons
e
Toxicity (µµg STX eq/100 g tissue)
0.8 8 20 40 80 160Toxicity (µg STX eq/100 g tissue)
0.8 8 20 40 80 160Toxicity (µg STX eq/100 g tissue)
90% STX and 10% NEO
Ab3Ab2
Ab1
Ab3Ab2
Ab1
77% B1
80% GTX1,4
10% NEO
Fig. 4. Reactivity of antibodies to PST mixtures using the SPR biosensor and corresponding theoretical LFI device for mixtures containing 80 mg STX eq. per 100 g tissue for
(A) 90% STX and 10% NEO, (B) 80% GTX1,4 and 20% STX, and (C) 77% B1 and 23% STX.
B.J. Yakes et al. / Talanta 99 (2012) 668–676674Proposal No. 13-110
3.3. PST mixtures
PST congeners commonly exist as mixtures in naturally con-taminated shellfish which could complicate such a simplistic‘‘pattern matching’’ approach of the LFIs. To investigate this,experiments were performed with the antibodies and mixtures
of PST compounds. Differing toxicity PST mixtures were tested todetermine if the antibodies would perform well in situations thatchallenged high and low cross-reactors that do not correlate withtoxicity (i.e., the potential for false-positive or false-negativeresults, respectively). The selected mixtures represented exam-ples encountered in natural waters: 90% STX with 10% NEO

B.J. Yakes et al. / Talanta 99 (2012) 668–676 675Proposal No. 13-110
(e.g., Alexandrium sp. and shellfish in Alaska [anticipated accuratetest performance]), 80% GTX1,4 with 20% STX (e.g., shellfish inScotland [anticipated potential false-negative]), and 77% B1 with23% STX (e.g., Pyrodinium sp. in Florida [anticipated potentialfalse-positive]). Results from these SPR assays, and correspondingtheoretical LFIs, are shown in Fig. 4 where the toxicity at 80 mgSTX eq. per 100 g tissue is the action level in the United States.
For all mixtures, the antibodies respond well for samples inwhich there is high toxicity, with all SPR biosensor data showingthe desired inhibition at the 80 mg STX eq./100 g tissue actionlevel. If these were naturally contaminated samples, the SPRscreening technique would indicate that further, confirmatorytesting is required. With the mixture of 90% STX with 10% NEO,the curves nearly follow that predicted from a sample of STXalone, thus yielding a representative, accurate test. From this, anarbitrary cut-off level of all antibodies having an SPR responsebelow 50 could be set for the level at which further confirmatorytesting would be required. For the 90% STX with 10% NEO, thislevel corresponds to samples of approx. 8 mg STX eq./100 g tissueand would allow for adequate screening without over burdeningconfirmatory testing techniques. As expected, the potential false-negative system (80% GTX1,4 with 20% STX) would only havefurther testing indicated for samples containing more than 20 mgSTX eq./100 g tissue. While this is below the action level, anypotential systematic errors could lead to a false-negative result.Finally, for the potential false-positive mixture of 77% B1 with23% STX, samples very low in toxicity (o8 mg STX eq./100 gtissue) would be indicated for further testing. In this case, false-positive results could still be common.
With regard to the theoretical LFI devices for these mixtures,all conceptual LFIs with the three antibody system show patternswhich indicate further testing would be required based on thefaint-red response of the test lines for all three antibodies. In thecase of the 80% GTX1,4 with 20% STX, the red line from Ab3 isclearly visible and a faint line from Ab1 can be seen. If a patternmatching approach was used, the pattern for this toxic samplecould mimic that of the nontoxic B1 sample in Fig. 3. Thus, whilethe pattern matching and intensity approach could enhancereliability, the current antibody combination does not fullyalleviate the challenges associated with false-negative and false-positive results.
While this three antibody system could increase the knowledgeof a sample composition and potential toxicity, the antibodies andLFI format used herein do not allow for full resolution of the false-negative and false-positive challenges that currently plague PSTimmunoassays. Furthermore, the SPR results will also suffer fromsimilar challenges but could allow for more confidence in resultsdue to the quantitative nature of the immunoassay versus relianceon visual readout of minor hue variations from the LFI device. Ourresearch studies continue to focus on the generation and screeningof antibodies with differing cross-reactivities, especially withimproved reactivity to the hydroxylated toxins, and to determineif a mixture of multiple antibodies [44] or spatially separateantibodies (as shown in the conceptual LFIs) will be best forrapid tests.
4. Conclusions
Rapidly screening seafood samples for potential contaminationby PSTs remains an analytical challenge. Sensitive, real-time SPRassays for PSTs have been developed and were used to evaluatethe reactivity of three antibodies. The results show that eachantibody has a unique reactivity for the PST congeners. Thishighlights the potential for developing antibodies that could havea higher correlation of response with sample potency. While the
production of such antibodies continues, techniques employingthe current antibodies for higher-confidence screening wereevaluated and a conceptual model was created. This modelindicated that while false-positive and false-negative results werenot completely eliminated, there is potential to improve immu-noassays and reduce the use of MBA and confirmatory analyticaltests. Current research is focusing on the development of PSTbinders (i.e., antibodies, aptamers, receptors) that have bettercross-reactivity with the congeners. Once candidate binders areevaluated by the SPR biosensor, they will be incorporated into amulti-binder, rapid test to fully realize the potential of a potency-based screening technique.
Acknowledgments
The authors express their gratitude to Mark Poli and hiscolleagues at USAMRIID for providing the burro anti-STX usedin this work. We also thank Titan Fan from Beacon Analytical forproviding purified anti-STX. Thank you to Katrina Campbell,Christopher Elliott, and Simon Haughey for valuable discussionsand their contributions to the field of PST biosensors.
Appendix A. Supporting information
Supplementary data associated with this article can be found inthe online version at http://dx.doi.org/10.1016/j.talanta.2012.06.073.
References
[1] S.M. Etheridge, Toxicon 56 (2010) 108–122.[2] A.R. Humpage, V.F. Magalhaes, S.M. Froscio, Anal. Bioanal. Chem. 397 (2010)
1655–1671.[3] M. Kodama, S. Sato, in: L.M. Botana (Ed.), Seafood and Freshwater Toxins:
Pharmacology, Physiology, and Detection, CRC Press, Taylor and FrancisGroup, Boca Raton, FL, 2008, pp. 165–175.
[4] S.E. Shumway, Rev. Fish. Sci. 3 (1995) 1–31.[5] C.Y. Kao, in: I.R. Falconer (Ed.), Algal Toxins in Seafood and Drinking Water,
Academic Press, San Diego, CA, 1993, pp. 75–86.[6] G.M. Lipkind, H.A. Fozzard, Biophys. J. 66 (1994) 1–13.[7] J.A. Kalaitzis, R. Chau, G.S. Kohli, S.A. Murray, B.A. Neilan, Toxicon 56 (2009)
244–258.[8] G.K. Isbister, M.C. Kiernan, Lancet Neurol. 4 (2005) 219–228.[9] D.C. Rodrigue, R.A. Etzel, S. Hall, E. Deporras, O.H. Velasquez, R.V. Tauxe,
E.M. Kilbourne, P.A. Blake, Am. J. Trop. Med. Hyg. 42 (1990) 267–271.[10] FAO, in, Food and Agriculture Organization of the United Nations (FAO) Food
and Nutrition Paper 80, Rome, 2004.[11] Bulletin, in, June 23, 2011.[12] N. Vilarino, E.S. Fonfria, M.C. Louzao, L.M. Botana, Sensors 9 (2009)
9414–9443.[13] B. Ben-Gigirey, A. Villar-Gonzalez, in: L.M. Botana (Ed.), Seafood and Fresh-
water Toxins: Pharmacology, Physiology, and Detection, CRC Press, Taylorand Francis Group, Boca Raton, FL, 2008, pp. 177–196.
[14] AOAC, in: K. Helrich (Ed.), Official Methods of Analysis, Association of OfficialAnalytical Chemists (AOAC), Arlington, VA, 1990, pp. 881–882.
[15] AOAC, Paralytic shellfish poisoning toxins in shellfish: Prechromatographicoxidation and liquid chromatography with fluorescence detection. Method2005.06, in: Official Methods of Analysis, Association of Official AnalyticalChemists (AOAC), Arlington, VA, 2005.
[16] J.F. Lawrence, B. Niedzwiadek, C. Menard, J. AOAC Int. 88 (2005) 1714–1732.[17] Y. Oshima, J. AOAC Int. 78 (1995) 528–532.[18] J.M. van de Riet, R.S. Gibbs, F.W. Chou, P.M. Muggah, W.A. Rourke, G. Burns,
K. Thomas, M.A. Quilliam, J. AOAC Int. 92 (2009) 1690–1704.[19] AOAC, Paralytic shellfish toxins in mussels, clams, oysters, and scallops post-
column oxidation (PCOX). First Action, Method 2011.02, in: Official Methodsof Analysis, Association of Official Analytical Chemists (AOAC), Arlington, VA,2011.
[20] S. Etheridge, J. Deeds, S. Hall, K. White, L. Flewelling, J. Abbott, J. Landsberg,S. Conrad, D. Bodager, G. Jackow, Afr. J. Mar. Sci. 28 (2006) 383–387.
[21] C. Dell’Aversano, P. Hess, M.A. Quilliam, J. Chromatogr. A 1081 (2005)190–201.
[22] E. Turrell, L. Stobo, J.P. Lacaze, S. Piletsky, E. Piletska, J. AOAC Int. 91 (2008)1372–1386.

B.J. Yakes et al. / Talanta 99 (2012) 668–676676Proposal No. 13-110
[23] G.R. Marchesini, H. Hooijerink, W. Haasnoot, J. Buijs, K. Campbell, C.T. Elliott,M.W.F. Nielen, TrAC, Trends Anal. Chem. 28 (2009) 792–803.
[24] G.J. Doucette, M.M. Logan, J.S. Ramsdell, F.M. VanDolah, Toxicon 35 (1997)625–636.
[25] C.L. Powell, G.J. Doucette, Nat. Toxins 7 (1999) 393–400.[26] G. Usup, C.P. Leaw, M.Y. Cheah, A. Ahmad, B.K. Ng, Toxicon 44 (2004) 37–43.[27] F.M. van Dolah, T.A. Leighfield, G.J. Doucette, L. Bean, B. Niedzwiadek,
D.F.K. Rawn, J. AOAC Int. 92 (2009) 1705–1713.[28] M.V. Laycock, M.A. Donovan, D.J. Easy, Toxicon 55 (2010) 597–605.[29] C.-K. Wong, P. Hung, E.A.L. Ng, K.L.H. Lee, G.T.C. Wong, K.-M. Kam, Harmful
Algae 9 (2010) 636–646.[30] E. Garet, A. Gonzalez-Fernandez, J. Lago, J.M. Vieites, A.G. Cabado, J. Agric.
Food Chem. 58 (2010) 1410–1415.[31] F. Kasuga, Y. HaraKudo, K. Machii, J. Food Hyg. Soc. Jpn. 37 (1996) 407–410.[32] E. Usleber, R. Dietrich, C. Burk, E. Schneider, E. Martlbauer, J. AOAC Int. 84
(2001) 1649–1656.[33] R.L. Manger, L.S. Leja, S.Y. Lee, J.M. Hungerford, M.A. Kirkpatrick, T. Yasumoto,
M.M. Wekell, J. AOAC Int. 86 (2003) 540–543.[34] M. Okumura, H. Tsuzuki, B. Tomita, Toxicon 46 (2005) 93–98.[35] H.X. Chen, Y.S. Kim, S.R. Keum, S.H. Kim, H.J. Choi, J.B. Lee, W.G. An, K. Koh,
Sensors 7 (2007) 1216–1223.
[36] K. Campbell, S.A. Haughey, H. van den Top, H. van Egmond, N. Vilarino,L.M. Botana, C.T. Elliott, Anal. Chem. 82 (2010) 2977–2988.
[37] E.S. Fonfria, N. Vilarino, K. Campbell, C. Elliott, S.A. Haughey, B. Ben-Gigirey,
J.M. Vieites, K. Kawatsu, L.M. Botana, Anal. Chem. 79 (2007) 6303–6311.[38] S.A. Haughey, K. Campbell, B.J. Yakes, S.M. Prezioso, S.L. DeGrasse,
K. Kawatsu, C.T. Elliott, Talanta 85 (2011) 519–526.[39] B.J. Yakes, M.M. Mossoba, in: S. Carnazza (Ed.), New Research Trends in
Protein Chip Technology, Transworld Research Network, Kerala, India, 2010,pp. 55–73.
[40] H.J. van den Top, C.T. Elliott, S.A. Haughey, N. Vilarin�leo, H.P. van Egmond,L.M. Botana, K. Campbell, Anal. Chem. 83 (2011) 4206–4213.
[41] B.J. Yakes, S. Prezioso, S.A. Haughey, K. Campbell, C.T. Elliott, S.L. DeGrasse,Sens. Actuators, B 156 (2011) 805–811.
[42] A. Komano, H. Maruko, H. Sekiguchi, Y. Seto, Forensic Toxicol. 29 (2011)38–43.
[43] K. Campbell, L.D. Stewart, G.J. Doucette, T.L. Fodey, S.A. Haughey, N. Vilarino,K. Kawatsu, C.T. Elliott, Anal. Chem. 79 (2007) 5906–5914.
[44] K. Campbell, D.F.K. Rawn, B. Niedzwiadek, C. Elliott, Food Addit. Contam., PartA 28 (2011) 711–725.

Proposal No. 13-110

Proposal No. 13-110

Proposal No. 13-110

Proposal No. 13-110
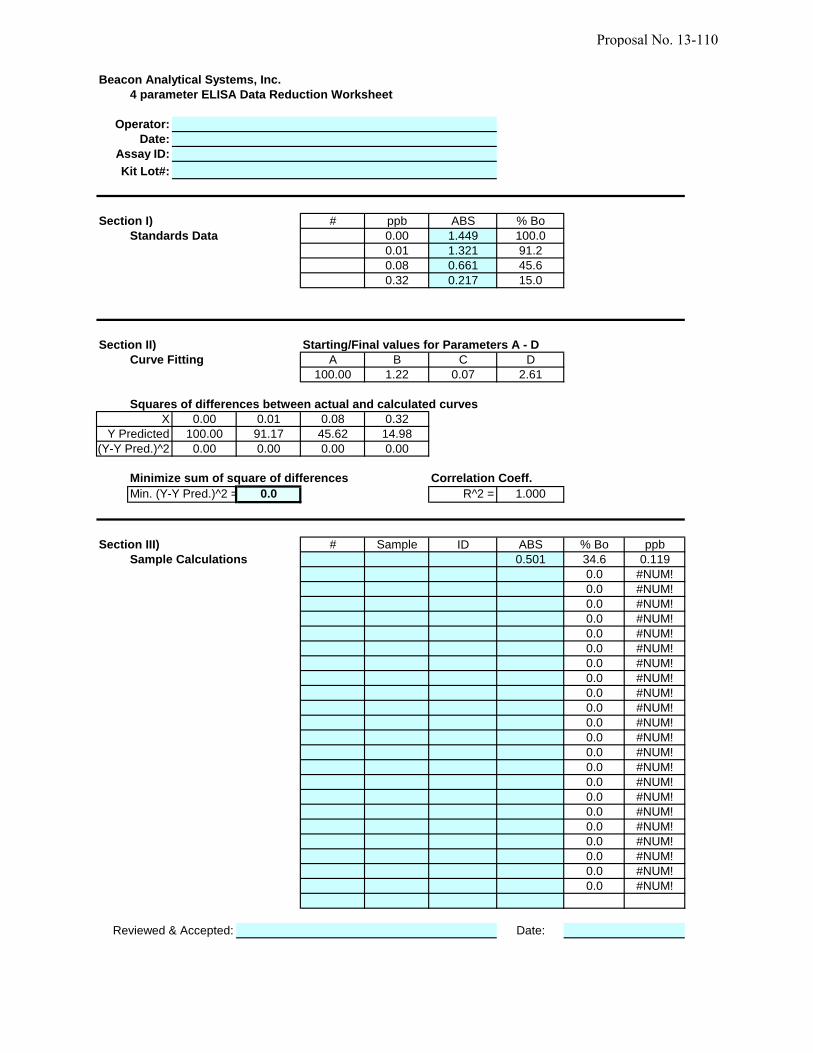
Beacon Analytical Systems, Inc.
4 parameter ELISA Data Reduction Worksheet
Operator:
Date:
Assay ID:
Kit Lot#:
Section I) # ppb ABS % Bo
Standards Data 0.00 1.449 100.0
0.01 1.321 91.2
0.08 0.661 45.6
0.32 0.217 15.0
Section II) Starting/Final values for Parameters A - D
Curve Fitting A B C D
100.00 1.22 0.07 2.61
Squares of differences between actual and calculated curves
X 0.00 0.01 0.08 0.32
Y Predicted 100.00 91.17 45.62 14.98
(Y-Y Pred.)^2 0.00 0.00 0.00 0.00
Minimize sum of square of differences Correlation Coeff.
Min. (Y-Y Pred.)^2 = 0.0 R^2 = 1.000
Section III) # Sample ID ABS % Bo ppb
Sample Calculations 0.501 34.6 0.119
0.0 #NUM!
0.0 #NUM!
0.0 #NUM!
0.0 #NUM!
0.0 #NUM!
0.0 #NUM!
0.0 #NUM!
0.0 #NUM!
0.0 #NUM!
0.0 #NUM!
0.0 #NUM!
0.0 #NUM!
0.0 #NUM!
0.0 #NUM!
0.0 #NUM!
0.0 #NUM!
0.0 #NUM!
0.0 #NUM!
0.0 #NUM!
0.0 #NUM!
0.0 #NUM!
0.0 #NUM!
Reviewed & Accepted: Date:
Proposal No. 13-110

1
Checklist for Saxitoxin (PSP) Microtiter Plate Test Kit
Operator:
Date:
Sample:
Assay ID:
Kit name:
Kit Lot#:
Kit expiration date:
Laboratory equipment
The kitchen blender and its accessories are clean. YES NO
The balance provides a sensitivity of at least 0.1 g. YES NO
The balance calibration is checked monthly. YES NO
Microcentrifuge has a maximum speed of ≥ 12,000 rpm. YES NO
Single-channel (200 and 1000 μL) and multi-channel micropipette (200 μL) are calibrated every six months.
YES NO
Microwell plate or strip reader has a filter for 450 nm wavelength. YES NO
Reagents and chemicals
Kit components are stored at 4 – 8 °C and equilibrated to room temperature for 1 hr before use.
YES NO
Make up water is distilled or deionized. YES NO
Isopropanol (2-Propanol) and Methanol are laboratory grade. YES NO
Acetic acid, Sodium Phosphate Monobasic Monohydrate (NaH2PO4·H2O) and Sodium Phosphate Dibasic Anhydrous (Na2HPO4) are ACS grade.
YES NO
Extraction solution
1. 70% Isopropanol
70 mL of Isopropyl alcohol + 30 mL of water 2. 5% Acetic acid
5 mL of Acetic acid + 95 mL of water 3. A mixture of 70% Isopropanol and 5% Acetic acid
100 mL of 70% Isopropyl alcohol + 50 mL of 5% Acetic acid
YES NO
Dilution buffer solution
1. 20 mM PBS (pH 7.2)
Sodium Phosphate Monobasic Monohydrate (NaH2PO4·H2O): 0.77g
Sodium Phosphate Dibasic Anhydrous (Na2HPO4): 2.04g
Sodium Chloride (NaCl): 8.5g
Distilled or deionized water: 1L 2. 10% Methanol/20mM PBS
10 mL of Methanol + 90 mL of 20 mM PBS
YES NO
Proposal No. 13-110

2
Sample preparation
1. At least 12 shellfish are used per sample. YES NO
2. The inside of each shell is rinsed with laboratory grade water.
3. Shellfish are shucked and strained through a #10 mesh sieve (or equivalent).
4. Strained meats are blended at high speed until homogenous.
5. 5 g of sample and 10 mL of extract solution are accurately measured in a 50 mL centrifuge tube and vortexed for 3 minutes.
6. Approximately 1 mL of the extract is transferred to a microcentrifuge tube and centrifuged for 5 minutes at 12,000 rpm.
7. The supernatant is diluted with dilution buffer 5000 fold.
e.g. 0.1 mL of supernatant + 9.9 mL of dilution buffer -> 0.1 mL of the diluted supernatant + 4.9 mL of dilution buffer
Assay
1. Prepare the 1X wash solution YES NO
2. Allow reagents and sample extracts to reach room temperature prior to running the test.
3. Dispense 50 μL enzyme conjugate to the appropriate test wells. Be sure to use a clean pipet tip for each.
4. Add 50 µL of Calibrators or sample extract to each well.
5. Dispense 50 µL of antibody solution into each test well.
6. Shake the plate gently for 30 seconds and incubate the test wells for 30 minutes.
7. Decant the contents of the wells into an appropriate waste container. Fill the wells to overflowing with wash solution and dump. Repeat 3X for a total of four washes.
8. Tap the inverted wells onto absorbent paper to remove the last of the wash solution.
9. Dispense 100 µL of substrate, and incubate for 30 minutes.
10. Dispense 100 µL of stop solution into each test well.
11. Read and record the absorbance of the wells at 450nm.
Calculation
1. Use a 4-parameter curve fit for calculation. YES NO
2. When the data reduction spreadsheet is used for calculation, type in absorbance values for both calibrator and sample. Follow the instruction in the spreadsheet to calculate the concentration in ppb.
3. Multiply the results in ppb by dilution factor (15000).
4. The unit (ppb) of the result can be converted to μg/100 g by dividing the result by 10.
Proposal No. 13-110

3
5. Any samples below 30 μg/100 g are considered negative, and no further testing is needed. Samples falling between 30 and 100 μg/100 g are considered as suspicious, and confirmation test (MBA) is followed. Samples above 100 μg/100 g are considered positive, and may not require further tests to confirm.
Operator Signature: Date: f
Supervisor Signature: Date: f
Proposal No. 13-110