Embed Size (px)
Citation preview
Single-molecule force spectroscopy: optical tweezers, magnetic tweezers and atomic force microscopyKeir C Neuman1 & Attila Nagy2
Single-molecule force spectroscopy has emerged as a powerful tool to investigate the forces and motions associated with biological molecules and enzymatic activity. The most common force spectroscopy techniques are optical tweezers, magnetic tweezers and atomic force microscopy. Here we describe these techniques and illustrate them with examples highlighting current capabilities and limitations.
Force has a fundamental role in biological processes. All biological motion, from cellular motility to replica-tion and segregation of DNA, is driven by molecular-scale forces. Conversely, the elimination or reduction of motion through the binding of ligands to their cognate receptors or through the folding of a polypeptide estab-lishing a stable three-dimensional structure involves the formation of bonds that overcome thermal and other forces. The ability to study these fundamental processes has been revolutionized over the last 20 years by the development of techniques that permit measurement of force and displacement generated by single molecules ranging from cells to proteins.
Although there is an ever-expanding repertoire of sin-gle-molecule manipulation techniques, including optical tweezers, magnetic tweezers, atomic force microscopy (AFM), micro-needle manipulation1, biomembrane force probe2 and flow-induced stretching3,4, the first three are the most commonly used and are the focus of this review (Table 1). We begin with an overview high-lighting areas of investigation opened up by the ability to apply force and to measure displacement at the single-molecule level. Then we describe the operating princi-ples and practical implementation of optical tweezers, magnetic tweezers and AFM. Many excellent reviews and detailed technical reports on the design, fabrication and use of these instruments are available5–11.
We intend this review as an aid in choosing the tech-nique best suited for a particular application: we describe what is now feasible with each technique as well as their strengths, limitations and practical considerations. The
enormous potential of these techniques is just beginning to be fully realized, and continuing developments will provide additional opportunities to probe fundamental biological processes.
The power and breadth of these techniques is high-lighted by the wide variety of measurements and sys-tems investigated. Current single-molecule manipula-tion capacity spans six orders of magnitude in length (10−10–10−4 m) and force (10−14–10−8 N). Applications range from the manipulation of cells (~100 µm) to the measurement of RNA polymerase advancing a single base pair (0.34 nm) along DNA12 and from the mechani-cal disruption of covalent bonds13 (nanonewton forces) to assaying nucleic acid folding kinetics14 (~0.1 pN). Single cells can be manipulated to probe the strength and location of receptor binding15 and adhesion or to mea-sure traction and adhesion forces16. Viscoelastic proper-ties can be measured on short length scales and in small volumes17, such as within cells18. Early applications of single-molecule force and displacement measurements included the characterization of conventional motor proteins such as kinesins19,20 and myosins21. The step size, stall-force force and processivity of these motors were established, paving the way to probe fundamental questions concerning the coupling between chemical and mechanical cycles22.
More generally, the application of force provides a means to selectively modify the steps in a biochemical reaction cycle that involves motion. Detailed measure-ments of the force-extension relationship (elasticity) of individual polymers, in particular of nucleic acids1,3,
1Laboratory of Molecular Biophysics and 2Laboratory of Molecular Physiology, National Heart, Lung, and Blood Institute, National Institutes of Health, Building 50, 50 South Drive, Bethesda, Maryland 20892, USA. Correspondence should be addressed to K.C.N. ([email protected]).
PUBLISHED ONLINE 29 MAY 2008; DOI:10.1038/NMETH.1218
NATURE METHODS | VOL.5 NO.6 | JUNE 2008 | 491
REVIEW©
2008
Nat
ure
Pub
lishi
ng G
roup
ht
tp://
ww
w.n
atur
e.co
m/n
atur
emet
ho
ds
opened up the possibility of investigating unconventional nucleic-acid molecular motors that translocate or otherwise modify DNA or RNA. In parallel with these developments in single-molecule enzy-mology, similar techniques were developed to mechanically rup-ture molecular bonds23–25. The analysis of rupture force, or force spectra, provides a measure of bond energies, lifetimes, and more recently, entire energy landscapes26,27. Force spectroscopy is used as a tool to characterize ligand and antibody binding28 and has been extended to study the complex and multistate unfolding of single proteins and nucleic acid structures29. Force spectroscopy in turn spurred the development of, and benefited greatly from, theoretical approaches that permit the extraction of detailed equilibrium ther-modynamic parameters from inherently non-equilibrium pulling experiments26,30,31.
An important advantage of single-molecule techniques is that they do not suffer from problems associated with population averaging inherent in ensemble measurements. Rare or transient phenomena that would otherwise be obscured by averaging can be resolved pro-vided that the measurement technique has the required resolution and that the events can be captured often enough to ensure that they are not artifactual. Likewise, multistate or multispecies distributions can be directly measured along with static and dynamic enzymatic heterogeneity32. In some instances, kinetic rates can be directly mea-sured from single-molecule recordings or determined by analyzing the distribution of event times33–35. For the specific case of enzymes, single-molecule measurements are intrinsically synchronized, and properties such as processivity can be readily determined.
GENERAL CONSIDERATIONSMolecule attachmentTypically, one end of the molecule under study is attached to a sur-face, and the free end is attached to a probean optically trapped bead, magnetic bead or AFM tipthrough which force is applied. Ideally, the bonds at the surface and at the probe should specifically bind the ends of the molecule, support infinite loads and not affect the mechanical or biological properties of the attached molecule. These ideals are approximated by a variety of attachment schemes
ranging from nonspecific adsorption to spe-cific covalent attachments.
Covalently modified nucleotides con-taining a carbon spacer arm terminated in a reactive moiety provide a convenient means of labeling nucleic acids at their ends with small molecules. Also, ligand-receptor pairs such as biotin-avidin or antibody-antigen pairs such as digoxigenin and anti-digoxi-genin are commonly used to provide spe-cific and relatively tight binding to the sur-face and to the probe36. Proteins are more challenging to modify, but purification tags such as biotin and hexahistidine provide a convenient means of attachment, as do reactive cysteine residues that may be either naturally occurring and solvent exposed or specifically introduced within the protein of interest. Nonspecific adsorption remains the simplest and most common attachment method for AFM-based force spectroscopy measurements, but more sophisticated spe-
cific attachment schemes have been developed37. Direct attachment of the molecule to the probe handle and attachment of intermediate antibodies and ligands is facilitated by commercially available func-tionalized polystyrene and magnetic beads and AFM tips.
Prevention of nonspecific binding interactions between the probe handle, the molecule of interest and the surfaces of the flow cell or experimental chamber is equally if not more important than ensuring specific binding interactions to the molecule of interest. Nonspecific binding can introduce artifacts and uncertainty in the data and in some instances can prevent the collection of any mean-ingful data. To prevent nonspecific interactions, inert proteins such as bovine serum albumin and non-ionic surfactants are used to pas-sivate surfaces and probes.
Measurement concernsFor all three techniques, the extension of the molecule is determined from the position of the probe relative to the surface. For optical tweezers and AFM, force is also derived from the deviation of the probe from its equilibrium position. The precision and accuracy of the measurements therefore depend critically on the ability to mea-sure the position of the probe. Whereas the three techniques differ in the method used to measure position, they have in common many issues related to position measurement.
The environment in which the measurements are made can pro-foundly influence the quality of the results. Temperature stability is the single largest concern as the thermal expansion resulting from a 1 °C temperature gradient can be hundreds of nanometers or more. Mechanical vibrations, air currents, acoustic and electrical noise are some of the other environmental factors that adversely affect single-molecule manipulation measurements. High-precision and high-stability measurements typically require instruments housed in acoustically isolated, temperature-controlled environments. That said, the details of the system under study should dictate the neces-sary environmental conditions. For example, measurements of a fast process will be more susceptible to noise than to slow temperature drifts, whereas the opposite would hold true when measuring a slow process.
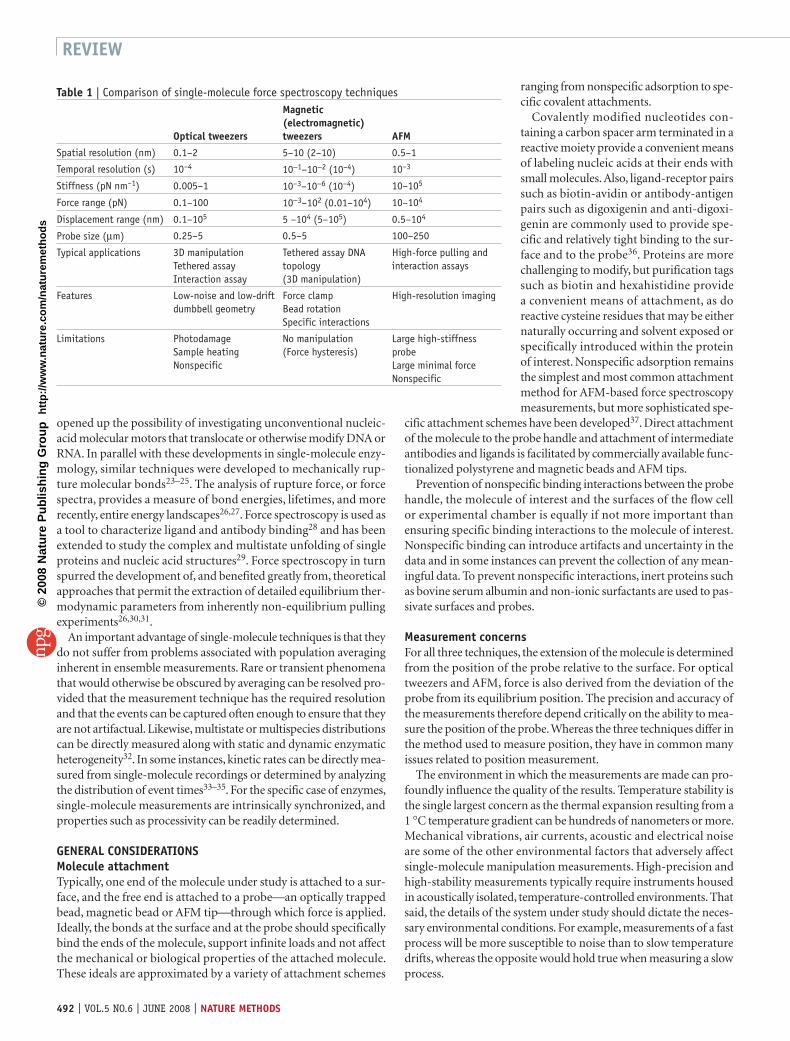
Table 1 | Comparison of single-molecule force spectroscopy techniques
Optical tweezers
Magnetic (electromagnetic) tweezers AFM
Spatial resolution (nm) 0.1–2 5–10 (2–10) 0.5–1
Temporal resolution (s) 10–4 10−1–10−2 (10–4) 10–3
Stiffness (pN nm–1) 0.005–1 10–3–10−6 (10–4) 10–105
Force range (pN) 0.1–100 10−3–102 (0.01–104) 10–104
Displacement range (nm) 0.1–105 5 –104 (5–105) 0.5–104
Probe size (µm) 0.25–5 0.5–5 100–250
Typical applications 3D manipulation Tethered assay Interaction assay
Tethered assay DNA topology (3D manipulation)
High-force pulling and interaction assays
Features Low-noise and low-drift dumbbell geometry
Force clamp Bead rotation Specific interactions
High-resolution imaging
Limitations Photodamage Sample heating Nonspecific
No manipulation (Force hysteresis)
Large high-stiffness probe Large minimal force Nonspecific
492 | VOL.5 NO.6 | JUNE 2008 | NATURE METHODS
REVIEW©
2008
Nat
ure
Pub
lishi
ng G
roup
ht
tp://
ww
w.n
atur
e.co
m/n
atur
emet
ho
ds
OPTICAL TWEEZERSOptical tweezers (Fig. 1), also known as an optical trap, are arguably the most versatile single-molecule manipulation technique. It can be used to exert forces in excess of 100 pN on particles ranging in size from nanometers to micrometers while simultaneously mea-suring the three-dimensional displacement of the trapped particle with sub-nanometer accuracy and sub-millisecond time resolution. These properties make optical tweezers extremely well suited for the measurement of force and motion.
An optical trap is created by focusing a laser to a diffraction-lim-ited spot with a high numerical aperture (NA) microscope objec-tive38. Dielectric particles in the vicinity of the focus experience a three-dimensional restoring force directed toward the focus. The dielectric particle is polarized by the optical field, and the interac-tion of this optically induced dipole with the steep gradient near the focus of the laser results in a force directed along the gradient. In addition to the gradient force, there is what has been termed a scat-tering force directed along the beam propagation direction, which results in a shift of the equilibrium trapping position slightly past the focus. To form a stable trap with optical tweezers, the gradi-ent force along the optical axis must overcome this scattering force, which necessitates the very steep gradient obtained with a high NA objective. For small displacements (~150 nm) of the trapped object from its equilibrium position the force is linearly proportional to the displacement, and the optical trap can be well approximated as a linear spring. The spring constant, or stiffness, depends on the steepness of the optical gradient (how tightly the laser is focused), the laser power and the polarizability of the trapped object. Particles ranging in size from ~20 nm to several micrometers can be stably trapped. These include single cells39, organelles within cells40, lipid vesicles41 and polystyrene or silica microspheres used alone or as probes linked to a molecule of interest.
Technical requirementsOptical tweezers run the gamut from simple-manipulation to sophisticated, custom-built instruments with sensitive position detectors and dynamic position control. The core elements shared by all optical tweezers are a trapping laser and a high NA microscope objective.
Trapping lasers should have a Gaussian output intensity profile to achieve the smallest focal spot producing the largest optical gradient.
High-precision optical trapping measurements require a trap-ping laser with superior pointing and power stability. Fluctuations in beam pointing result in spurious motions of the optical trap, and power fluctuations result in force fluctuations, both of which increase measurement noise. Trapping lasers operating in the near-infrared wavelengths (800–1,100 nm) minimize optically induced damage in biological specimens39. For most biological applications the trapping laser of choice is the diode-pumped neodymium yttri-um aluminum garnet (Nd:YAG) with a wavelength of 1,064 nm. These lasers have exceptional power and pointing stability, and are available with output powers in excess of 10 W. Single-mode diode lasers and high-power near-infrared fiber lasers42 have also been used for optical trapping.
The NA of the trapping objective should be at least 1.2 to achieve the steep focus needed to create a stable optical trap. This neces-sitates the use of a water or oil immersion objective. Whereas oil immersion objectives offer the highest NA, they introduce spherical aberrations that degrade optical trap performance deep in solu-tion43,44. Water immersion objectives do not suffer from spherical aberrations and permit trapping deep in solution. The other fac-tor to consider in the choice of microscope objective is the optical transmission characteristics at the trapping wavelength. High NA objectives are typically optimized for use with visible light, and their transmission can vary greatly in the near-infrared wavelengths39. Some objective manufacturers provide transmission curves in the near-infrared wavelengths, but if these are not available or if the transmission has to be accurately known, it can be measured by
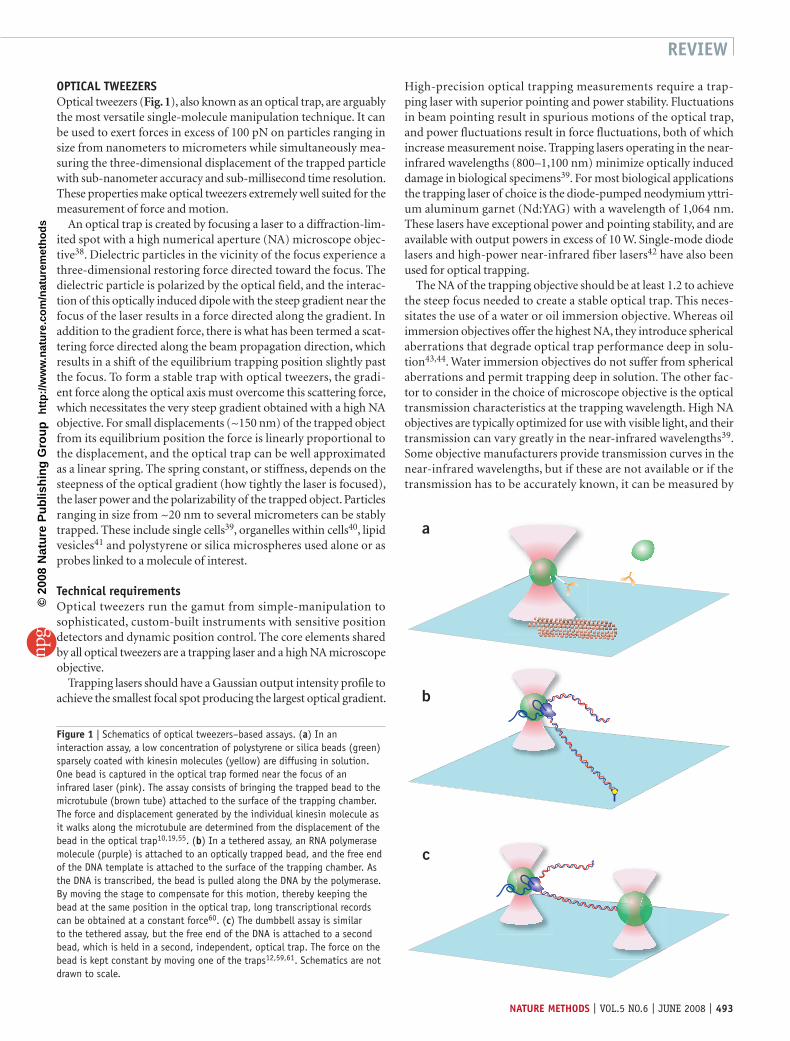
a
b
c
Figure 1 | Schematics of optical tweezers–based assays. (a) In an interaction assay, a low concentration of polystyrene or silica beads (green) sparsely coated with kinesin molecules (yellow) are diffusing in solution. One bead is captured in the optical trap formed near the focus of an infrared laser (pink). The assay consists of bringing the trapped bead to the microtubule (brown tube) attached to the surface of the trapping chamber. The force and displacement generated by the individual kinesin molecule as it walks along the microtubule are determined from the displacement of the bead in the optical trap10,19,55. (b) In a tethered assay, an RNA polymerase molecule (purple) is attached to an optically trapped bead, and the free end of the DNA template is attached to the surface of the trapping chamber. As the DNA is transcribed, the bead is pulled along the DNA by the polymerase. By moving the stage to compensate for this motion, thereby keeping the bead at the same position in the optical trap, long transcriptional records can be obtained at a constant force60. (c) The dumbbell assay is similar to the tethered assay, but the free end of the DNA is attached to a second bead, which is held in a second, independent, optical trap. The force on the bead is kept constant by moving one of the traps12,59,61. Schematics are not drawn to scale.
NATURE METHODS | VOL.5 NO.6 | JUNE 2008 | 493
REVIEW©
2008
Nat
ure
Pub
lishi
ng G
roup
ht
tp://
ww
w.n
atur
e.co
m/n
atur
emet
ho
ds
the dual-objective technique45,46. In our experience, fluorescence objectives and objectives specifically designed for use in the near-infrared wavelengths have the highest near-infrared wavelength transmission, whereas highly corrected objectives have the lowest transmission.
Basic optical tweezers provide a means of non-invasively manipu-lating objects in solution. Adding the capacity to detect the trapped particle permits the simultaneous measurement of displacement and force, greatly enhancing the capabilities of the instrument. Whereas several methods of position detection have been devel-oped, the most versatile and sensitive is back-focal plane (BFP) interferometry47,48, which relies on the interference between light scattered by the trapped bead and unscattered light to measure the three-dimensional position of the bead relative to its equilibrium position. The interference is measured with a quadrant photodiode or position-sensitive detector placed in a plane optically conjugate to the BFP of the condenser, that is, the BFP of the condenser is imaged onto the quadrant photodiode or position-sensitive detec-tor. The detectors are sensitive to minute intensity asymmetries in the interference pattern.
A trapped bead at its equilibrium position produces a symmetric interference pattern and a null detector signal. Displacement of the bead results in an asymmetric interference profile, which generates a detector signal proportional to the bead displacement. Axial motion of the trapped particle also changes the interference pattern result-ing in changes in the total intensity at the detector. Sub-nanometer spatial resolution and bandwidths in excess of 100 kHz have been achieved with this detection scheme47,49. The most straightforward implementation of BFP interferometry relies on the interference from the scattered trapping laser, but it is sometimes more conve-nient to use a second low-power detection laser10. By splitting one laser into two beams based on polarization, or by using two different detection lasers, it is possible to track simultaneously the position of two trapped beads50. BFP detection has also been implemented with light backscattered from the trapped bead51, which simplifies posi-tion detection and may improve measurement stability and noise performance.
The full potential of an optical tweezers instrument can be real-ized with the addition of dynamic control of the trap position in the specimen plane and the position of the trapping chamber. Dynamic position control can be incorporated into a feedback loop to main-tain a constant force on the trapped bead10 or to actively compensate for thermal drift52. Moving the trap by deflecting the laser beam with galvanometer or piezoelectric actuated mirrors or an acousto-optic deflector can be very fast (~10 µs for the latter), but the range of motion is typically limited to a few micrometers in a single axial plane. Alternatively, a piezoelectric stage can be used to move the trapping chamber with nanometer accuracy while keeping the trap position fixed. Although this approach is slower (~10 ms response time), full three-dimensional control is possible over a large range of motion (~100 µm).
Optical tweezers calibrationPosition and force calibration for all three techniquesoptical twee-zers, magnetic tweezers and atomic force microscopyis accom-plished by similar means: the probe is treated as a linear spring, the Brownian motion of which is related to the spring stiffness (see Box 1 and Fig. 2), and force is determined from Hooke’s law (F = –kx). Position is typically calibrated by moving the probe
through a known distance while recording the position signal. To provide an illustration of the calibration process, we describe the techniques used to calibrate optical tweezers in detail. For the other techniques we will highlight differences or describe additional con-siderations.
Accurate determination of displacement and force requires cali-brating the position detector and measuring the stiffness of the opti-cal trap. The position detector is calibrated by moving the trapped bead through a known distance while recording the position signal. A bead, stuck to the surface of the trapping chamber, is moved with a calibrated piezoelectric stage or by scanning the trapping laser faster than the trapped bead can respond (see Box 1), thereby moving the laser with respect to the effectively stationary bead53. If an indepen-dent detection laser is used, calibration can be performed by moving the bead through the detection laser by scanning the trap position10. Because of variation among beads of nominally the same size, the best practice is to calibrate each bead before acquiring data.
A well calibrated position detector is helpful but not essential for calibrating trap stiffness. The simplest stiffness calibration method relies on the thermal fluctuations of the trapped bead, which is equivalent to the Brownian motion of an over-damped spring. The power spectrum of the fluctuations is a Lorentzian (see equation 3 in Box 1) with roll-off frequency f0 = α(2πβ)–1, where α is the trap stiffness, and β is the hydrodynamic drag on the bead. The roll-off frequency can be obtained by fitting the power spectrum, which need not be calibrated, and the drag can be calculated for simple shapes. A related stiffness calibration technique makes use of the equipartition theorem, which states that each degree of freedom has 0.5kBT of thermal energy where kB is the Boltzmann constant and T is the absolute temperature. Equating this with the energy associated with fluctuations of the trapped particle, 0.5α<x2>, where <x2> is the positional variance, gives an expression for the trap stiffness: α = kBT < x2>–1. Unlike the power spectrum method, the variance meth-od requires a calibrated position detector, but information about neither the drag coefficient of the trapped object nor the viscosity of the medium is required. Because these two calibration methods rely on thermal fluctuations, they provide a measure of trap stiff-ness near the equilibrium position of the trap. Measuring the trap stiffness for greater displacements and determining the region over which the stiffness is constant requires an external force to displace the trapped bead. Rapidly moving the trapping chamberfor example, with a piezoelectric stageexerts a large calculable drag force on the trapped bead and provides a measure of trap stiffness at large displacements.
It is good practice to measure the stiffness as a function of laser power using all three methods described above because subtle prob-lems with the trap or the position-detection system can be uncov-ered. There are many variants6 of these stiffness calibration methods. One elegant method permits simultaneous calibration of stiffness and position by recording the power spectrum of a trapped bead while the trapping chamber is oscillated54. This technique has the advantage of not requiring knowledge of the hydrodynamic drag on the bead, thus information about neither the particle size nor the sample viscosity is required.
Applications of optical tweezersIn one class of optical tweezers assays, the three-dimensional manip-ulation capabilities are exploited to impose a specific interaction between the trapped object and a fixed partner and to measure the
494 | VOL.5 NO.6 | JUNE 2008 | NATURE METHODS
REVIEW©
2008
Nat
ure
Pub
lishi
ng G
roup
ht
tp://
ww
w.n
atur
e.co
m/n
atur
emet
ho
ds
Single-molecule force spectroscopy techniques use a micrometer-sized probe to apply force and measure displacement. Because of their small size, these probes are subject to thermal fluctuations that impose fundamental limits on displacement, force and time resolution. To a good approximation, the single-molecule probe can be considered to be attached to a linear spring with stiffness α. This stiffness can be the intrinsic stiffness of the probe, as is the case for an optically trapped bead or an AFM cantilever, or it may be dominated by the stiffness of the molecule to which the probe is attached, as is the case for a magnetic bead in magnetic tweezers and in many pulling experiments regardless of the technique used to apply force. Spatial resolution is determined by the thermal noise of the probe, which is given by:
δx = kBTα ,
(1)
where δx is the magnitude of the position noise, kBT is the thermal energy. From Hooke’s law (F = –αx), the corresponding force resolution is:
δF = kBTα . (2)
The magnitude of the noise can be reduced by filtering the position data. The effect of filtering can be determined by considering the power spectrum of the thermal motion, which is a Lorentzian:
=kBTS(f)
π2 (f2 + f02)β , (3)
where S(f) is the power per unit frequency, expressed as displacement2 Hz–1, f is the frequency, β is the hydrodynamic drag on the probe (for a sphere of radius a in a medium of viscosity η, β = 6πηa), and the roll-off frequency f0 = α (2πβ)–1 is the characteristic roll-off frequency of the motion (see Fig. 2). The area under the power spectrum is the position variance (δx)2, which is the square of the position noise amplitude. The effect of filtering the position signal can be approximated by calculating the area under the power spectrum over the frequency range from 0 Hz to the filter cut-off frequency, ∆f. If ∆f is much less than f0 of the power spectrum, the position noise amplitude is approximately:
βδx =
4 kBT∆f
α 2. (4)
Spatial resolution can therefore be improved by increasing the stiffness, reducing the bandwidth (∆f) or decreasing the drag, which is proportional to the size of the probe and the viscosity of the medium. Stiffness has the greatest impact on spatial resolution, whereas bandwidth and hydrodynamic drag have lesser effects (see Fig. 2). Filtering the signal also improves the force resolution:
δF = 4 kBT∆fβ, (5)
which can only be improved by decreasing the drag or the bandwidth. Decreasing the bandwidth, however, reduces the temporal resolution of the measurement. Temporal resolution is inversely proportional to the bandwidth if the signal is filtered or to f0 of the Lorentzian if it is not. Temporal resolution can therefore be improved by increasing the stiffness or decreasing the drag. Maximal resolution of displacement, force and time is achieved by minimizing hydrodynamic drag on the probe. This can be accomplished by reducing the size of the probe or by reducing the viscosity of the medium.
Temporal resolution and measurement bandwidth are crucially important considerations in calibration techniques that rely on thermal motion. Both power spectrum and variance stiffness calibrations rely on measuring the entirety of the noise, and errors are introduced if the position signal is inappropriately filtered or if the measurement technique does not have sufficient bandwidth to capture high-frequency motion. Berg-Sorensen and co-workers provide an excellent treatment of these and other issues encountered in fitting power spectra to obtain stiffness148.
BOX 1 FUNDAMENTAL RESOLUTION LIMITS
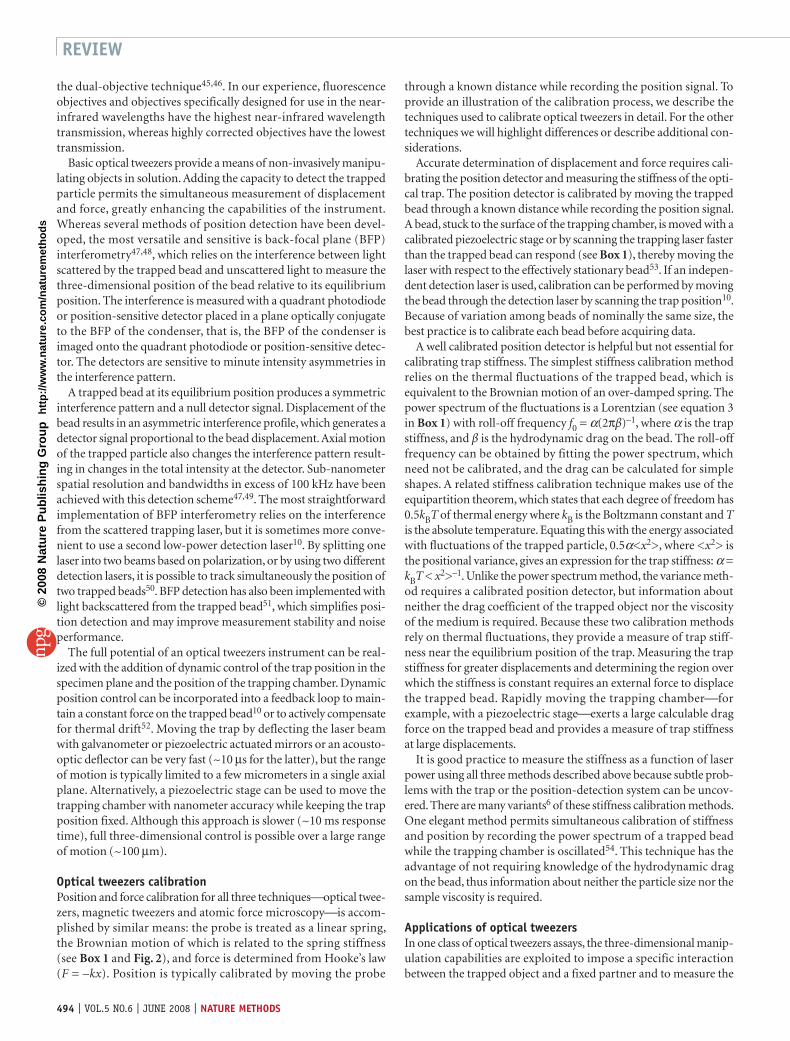
10–4
10–3
10–2
Noi
se p
ower
(nm
2 /H
z)
101 102 103 104
Frequency (Hz)
Figure 2 | Influence of probe size, stiffness and measurement bandwidth on spatial resolution. Shown are power spectra (equation 3, Box 1) for a 1-µm probe particle (attached to a spring undergoing Brownian motion) with a roll-off frequency of 2 kHz (red), for the same particle with half the drag coefficient (blue) and for a twofold increase in stiffness (green). Both of these changes increase the roll-off frequency while simultaneously decreasing the low frequency amplitude of the power spectrum. However, the area under the curve (spatial resolution is given by the square root of the area under the curve), and hence the position noise, is reduced only by increasing the stiffness (equation 1). The decrease in low frequency amplitude is compensated by the extended roll-off frequency when the drag is halved (blue); consequently the noise is equivalent for the red and blue curves. This is no longer the case if the signals are filtered: the reduction in noise achieved by limiting the measurement bandwidth to 100 Hz (gray region) results in a large difference in noise for the three experimental conditions (see equation 4).
NATURE METHODS | VOL.5 NO.6 | JUNE 2008 | 495
REVIEW©
2008
Nat
ure
Pub
lishi
ng G
roup
ht
tp://
ww
w.n
atur
e.co
m/n
atur
emet
ho
ds
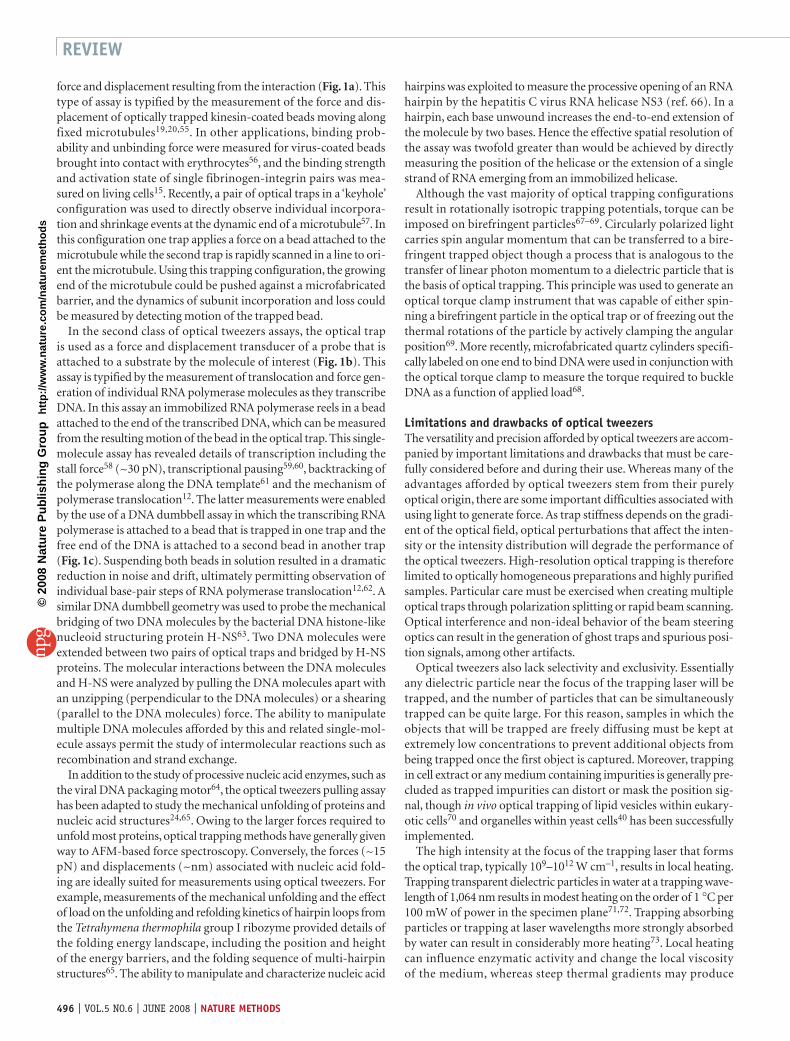
force and displacement resulting from the interaction (Fig. 1a). This type of assay is typified by the measurement of the force and dis-placement of optically trapped kinesin-coated beads moving along fixed microtubules19,20,55. In other applications, binding prob-ability and unbinding force were measured for virus-coated beads brought into contact with erythrocytes56, and the binding strength and activation state of single fibrinogen-integrin pairs was mea-sured on living cells15. Recently, a pair of optical traps in a ‘keyhole’ configuration was used to directly observe individual incorpora-tion and shrinkage events at the dynamic end of a microtubule57. In this configuration one trap applies a force on a bead attached to the microtubule while the second trap is rapidly scanned in a line to ori-ent the microtubule. Using this trapping configuration, the growing end of the microtubule could be pushed against a microfabricated barrier, and the dynamics of subunit incorporation and loss could be measured by detecting motion of the trapped bead.
In the second class of optical tweezers assays, the optical trap is used as a force and displacement transducer of a probe that is attached to a substrate by the molecule of interest (Fig. 1b). This assay is typified by the measurement of translocation and force gen-eration of individual RNA polymerase molecules as they transcribe DNA. In this assay an immobilized RNA polymerase reels in a bead attached to the end of the transcribed DNA, which can be measured from the resulting motion of the bead in the optical trap. This single-molecule assay has revealed details of transcription including the stall force58 (~30 pN), transcriptional pausing59,60, backtracking of the polymerase along the DNA template61 and the mechanism of polymerase translocation12. The latter measurements were enabled by the use of a DNA dumbbell assay in which the transcribing RNA polymerase is attached to a bead that is trapped in one trap and the free end of the DNA is attached to a second bead in another trap (Fig. 1c). Suspending both beads in solution resulted in a dramatic reduction in noise and drift, ultimately permitting observation of individual base-pair steps of RNA polymerase translocation12,62. A similar DNA dumbbell geometry was used to probe the mechanical bridging of two DNA molecules by the bacterial DNA histone-like nucleoid structuring protein H-NS63. Two DNA molecules were extended between two pairs of optical traps and bridged by H-NS proteins. The molecular interactions between the DNA molecules and H-NS were analyzed by pulling the DNA molecules apart with an unzipping (perpendicular to the DNA molecules) or a shearing (parallel to the DNA molecules) force. The ability to manipulate multiple DNA molecules afforded by this and related single-mol-ecule assays permit the study of intermolecular reactions such as recombination and strand exchange.
In addition to the study of processive nucleic acid enzymes, such as the viral DNA packaging motor64, the optical tweezers pulling assay has been adapted to study the mechanical unfolding of proteins and nucleic acid structures24,65. Owing to the larger forces required to unfold most proteins, optical trapping methods have generally given way to AFM-based force spectroscopy. Conversely, the forces (~15 pN) and displacements (~nm) associated with nucleic acid fold-ing are ideally suited for measurements using optical tweezers. For example, measurements of the mechanical unfolding and the effect of load on the unfolding and refolding kinetics of hairpin loops from the Tetrahymena thermophila group I ribozyme provided details of the folding energy landscape, including the position and height of the energy barriers, and the folding sequence of multi-hairpin structures65. The ability to manipulate and characterize nucleic acid
hairpins was exploited to measure the processive opening of an RNA hairpin by the hepatitis C virus RNA helicase NS3 (ref. 66). In a hairpin, each base unwound increases the end-to-end extension of the molecule by two bases. Hence the effective spatial resolution of the assay was twofold greater than would be achieved by directly measuring the position of the helicase or the extension of a single strand of RNA emerging from an immobilized helicase.
Although the vast majority of optical trapping configurations result in rotationally isotropic trapping potentials, torque can be imposed on birefringent particles67–69. Circularly polarized light carries spin angular momentum that can be transferred to a bire-fringent trapped object though a process that is analogous to the transfer of linear photon momentum to a dielectric particle that is the basis of optical trapping. This principle was used to generate an optical torque clamp instrument that was capable of either spin-ning a birefringent particle in the optical trap or of freezing out the thermal rotations of the particle by actively clamping the angular position69. More recently, microfabricated quartz cylinders specifi-cally labeled on one end to bind DNA were used in conjunction with the optical torque clamp to measure the torque required to buckle DNA as a function of applied load68.
Limitations and drawbacks of optical tweezersThe versatility and precision afforded by optical tweezers are accom-panied by important limitations and drawbacks that must be care-fully considered before and during their use. Whereas many of the advantages afforded by optical tweezers stem from their purely optical origin, there are some important difficulties associated with using light to generate force. As trap stiffness depends on the gradi-ent of the optical field, optical perturbations that affect the inten-sity or the intensity distribution will degrade the performance of the optical tweezers. High-resolution optical trapping is therefore limited to optically homogeneous preparations and highly purified samples. Particular care must be exercised when creating multiple optical traps through polarization splitting or rapid beam scanning. Optical interference and non-ideal behavior of the beam steering optics can result in the generation of ghost traps and spurious posi-tion signals, among other artifacts.
Optical tweezers also lack selectivity and exclusivity. Essentially any dielectric particle near the focus of the trapping laser will be trapped, and the number of particles that can be simultaneously trapped can be quite large. For this reason, samples in which the objects that will be trapped are freely diffusing must be kept at extremely low concentrations to prevent additional objects from being trapped once the first object is captured. Moreover, trapping in cell extract or any medium containing impurities is generally pre-cluded as trapped impurities can distort or mask the position sig-nal, though in vivo optical trapping of lipid vesicles within eukary-otic cells70 and organelles within yeast cells40 has been successfully implemented.
The high intensity at the focus of the trapping laser that forms the optical trap, typically 109–1012 W cm–1, results in local heating. Trapping transparent dielectric particles in water at a trapping wave-length of 1,064 nm results in modest heating on the order of 1 °C per 100 mW of power in the specimen plane71,72. Trapping absorbing particles or trapping at laser wavelengths more strongly absorbed by water can result in considerably more heating73. Local heating can influence enzymatic activity and change the local viscosity of the medium, whereas steep thermal gradients may produce
496 | VOL.5 NO.6 | JUNE 2008 | NATURE METHODS
REVIEW©
2008
Nat
ure
Pub
lishi
ng G
roup
ht
tp://
ww
w.n
atur
e.co
m/n
atur
emet
ho
ds
convection currents that can adversely affect the measurements. Local heating in the vicinity of the optical trap can be calculated71, and several techniques have been developed to measure the tem-perature directly71,73.
Optical damage induced in trapped specimens is less well understood. Trapping with laser wavelengths in the near-infrared wavelengths minimizes photodamage, but an oxygen-mediated photodamage process, likely involving singlet oxygen or other reac-tive oxygen species, persists throughout this wavelength range39. Removing molecular oxygen from the trapping medium with an enzymatic scavenging system or by exchanging the oxygen with an inert gas substantially reduces photodamage39. For optical trapping involving living organisms, 830-nm and 970-nm trapping wave-lengths have been found to minimize photodamage in bacterial (Escherichia coli)39 and eukaryotic (Chinese hamster ovary) cells74.
In addition to the technical concerns when using optical tweezers, several practi-cal matters also must be taken into account. With this technique, the range of applied forces is 0.1–100 pN. The low end of the range is set by the lowest stiffness needed to ensure trap stability. The upper limit is set by the maximum power in the speci-men plane. The range of motion that can be measured with a fixed optical trap is limited to ~400 nm or less, whereas the range over which the stiffness is constant is consider-ably smaller (~150 nm). Range of motion can be increased almost without limit by incorporating dynamic position control of the trap, the stage or both, but these changes necessarily increase the complexity of the optical tweezers instrument. Optical twee-zers capable of applying well-controlled loads and accurately measuring displace-ments are complex, delicate and expensive instruments. Optical tweezers with a variety of features and capabilities are commercially available, but they do not currently include the position detection and dynamic posi-tion control required to make sensitive single-molecule measurements of force and displacement described above. Adapting a commercially available optical tweezers instrument or custom-building an instru-ment to meet the requirements of a given set of experiments is challenging and time-consuming, but it is possible, as evidenced by the increasing number of laboratories around the world pursing high-resolution optical trapping measurements.
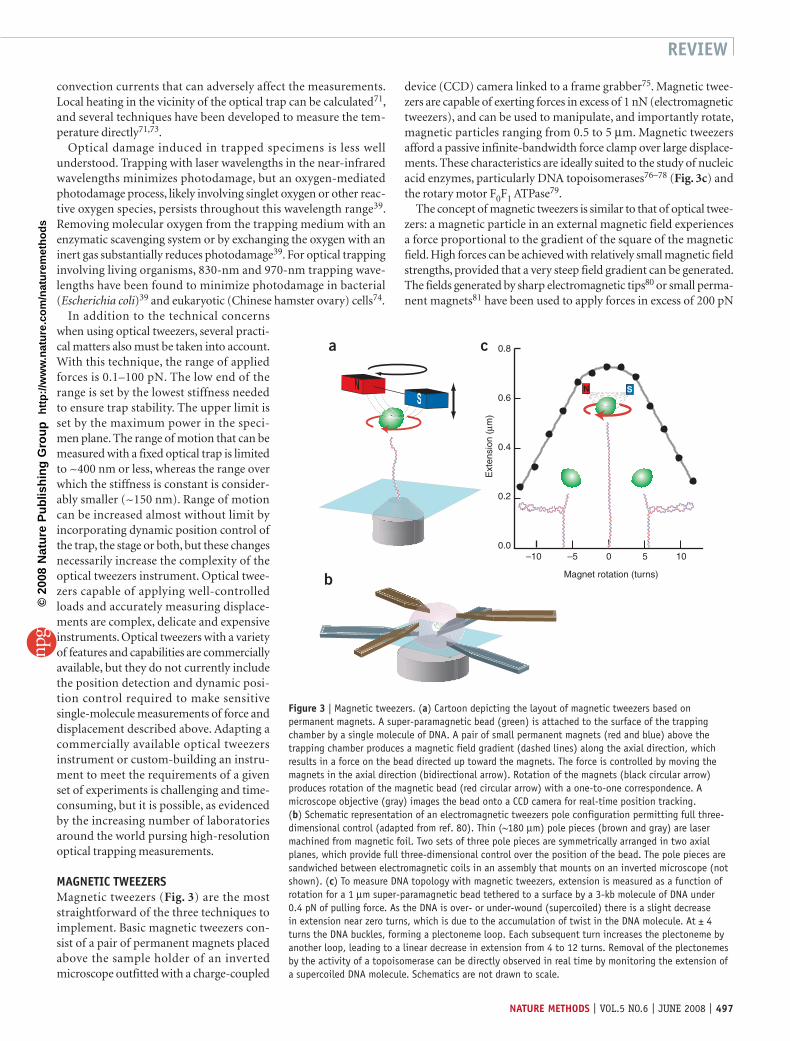
MAGNETIC TWEEZERSMagnetic tweezers (Fig. 3) are the most straightforward of the three techniques to implement. Basic magnetic tweezers con-sist of a pair of permanent magnets placed above the sample holder of an inverted microscope outfitted with a charge-coupled
device (CCD) camera linked to a frame grabber75. Magnetic twee-zers are capable of exerting forces in excess of 1 nN (electromagnetic tweezers), and can be used to manipulate, and importantly rotate, magnetic particles ranging from 0.5 to 5 µm. Magnetic tweezers afford a passive infinite-bandwidth force clamp over large displace-ments. These characteristics are ideally suited to the study of nucleic acid enzymes, particularly DNA topoisomerases76–78 (Fig. 3c) and the rotary motor F0F1 ATPase79.
The concept of magnetic tweezers is similar to that of optical twee-zers: a magnetic particle in an external magnetic field experiences a force proportional to the gradient of the square of the magnetic field. High forces can be achieved with relatively small magnetic field strengths, provided that a very steep field gradient can be generated. The fields generated by sharp electromagnetic tips80 or small perma-nent magnets81 have been used to apply forces in excess of 200 pN
Ext
ensi
on (
µm)
SN
a c
b
0.8
0.6
0.4
0.2
0.0–10 –5 0 5 10
Magnet rotation (turns)
Figure 3 | Magnetic tweezers. (a) Cartoon depicting the layout of magnetic tweezers based on permanent magnets. A super-paramagnetic bead (green) is attached to the surface of the trapping chamber by a single molecule of DNA. A pair of small permanent magnets (red and blue) above the trapping chamber produces a magnetic field gradient (dashed lines) along the axial direction, which results in a force on the bead directed up toward the magnets. The force is controlled by moving the magnets in the axial direction (bidirectional arrow). Rotation of the magnets (black circular arrow) produces rotation of the magnetic bead (red circular arrow) with a one-to-one correspondence. A microscope objective (gray) images the bead onto a CCD camera for real-time position tracking. (b) Schematic representation of an electromagnetic tweezers pole configuration permitting full three-dimensional control (adapted from ref. 80). Thin (~180 µm) pole pieces (brown and gray) are laser machined from magnetic foil. Two sets of three pole pieces are symmetrically arranged in two axial planes, which provide full three-dimensional control over the position of the bead. The pole pieces are sandwiched between electromagnetic coils in an assembly that mounts on an inverted microscope (not shown). (c) To measure DNA topology with magnetic tweezers, extension is measured as a function of rotation for a 1 µm super-paramagnetic bead tethered to a surface by a 3-kb molecule of DNA under 0.4 pN of pulling force. As the DNA is over- or under-wound (supercoiled) there is a slight decrease in extension near zero turns, which is due to the accumulation of twist in the DNA molecule. At ± 4 turns the DNA buckles, forming a plectoneme loop. Each subsequent turn increases the plectoneme by another loop, leading to a linear decrease in extension from 4 to 12 turns. Removal of the plectonemes by the activity of a topoisomerase can be directly observed in real time by monitoring the extension of a supercoiled DNA molecule. Schematics are not drawn to scale.
NATURE METHODS | VOL.5 NO.6 | JUNE 2008 | 497
REVIEW©
2008
Nat
ure
Pub
lishi
ng G
roup
ht
tp://
ww
w.n
atur
e.co
m/n
atur
emet
ho
ds
on micrometer-sized magnetic particles. Owing to the steep gradi-ent, however, the force falls off rapidly with displacement away from the magnet. Consequently, appreciable force can only be applied on a particle in close proximity to the magnet, and the force is not con-stant for small displacements of the magnetic particle in the vicin-ity of the magnet. Larger magnets provide a higher magnetic field strength and a shallower field gradient, resulting in forces that vary more slowly over a larger area. A single magnet can be used to supply an attractive pulling force on a magnetic particle, but a minimum of two magnets are required to generate torque and apply force. For the most common case in which a super-paramagnetic bead is manipu-lated, the external field induces a magnetic moment in the bead; the bead experiences a force in the direction of and proportional to the field gradient11.
Super-paramagnetic beads are available from a number of sup-pliers (Dynal/Invitrogen, Bangs Laboratories, New England Biolabs and Polysciences) with a variety of chemical and ligand modifica-tions, as they are commonly used in biological separation applica-tions. Available super-paramagnetic beads are typically composed of ~10–20 nm magnetic particles embedded in a porous matrix sphere enclosed in a protective polymer shell. In the absence of an exter-nal magnetic field, the magnetic domains are thermally disordered, and there is no residual magnetization, which prevents aggregation. The application of an external magnetic field orients the magnetic domains resulting in a large magnetic moment aligned with the magnetic field. In practice, the alignment is not perfect as some of the domains are constrained within the bead resulting in a fixed preferential polarization axis with respect to the bead11. In an exter-nal field the bead experiences a torque aligning this preferential axis along the direction of the field. Rotating the external field therefore results in bead rotation. Estimates of the applied torque for a 1-µm magnetic bead are in excess of 103 pN nm, which is much larger than biologically relevant torques. Magnetic tweezers based on perma-nent magnets and electromagnets have been developed and used for single-molecule force spectroscopy.
Technical requirements and calibrationPermanent magnet configuration. The simplest magnetic tweezers use a pair of permanent rare earth magnets to generate the mag-netic field (Fig. 3a). Neodymium iron boron (Nd2Fe14B) magnets, also called NIB or simply neodymium magnets, are the strongest available permanent magnets with magnetic fields in excess of 1.3 tesla. They are classified by the magnetic energy density in units of megagauss-oersteds. The highest energy density magnets avail-able are in the range of N45–N50. Typically the magnets measure a few millimeters on each side and are configured with the north pole of one magnet facing the south pole of the other, separated by a ~1 mm gap. An iron ring surrounding the two magnets pro-vides a return path for the magnetic flux and reduces stray fields. In this configuration the magnetic field strength decreases roughly exponentially with a characteristic length scale comparable to the separation between the magnets. Consequently, the force on the magnetic particle changes in proportion to displacement with a characteristic length scale of 1 mm, resulting in an effective stiff-ness on the order of 10−6 pN nm–1. As a result of this negligible stiffness, magnetic tweezers afford an infinite-bandwidth, passive force clamp. The change in force on a magnetic particle that moves a full 10 µm is only 0.01 pN. It is possible to perform experiments at constant force with optical tweezers or AFM, but this requires
sophisticated active feedback or, for the recently described passive optical force clamp, is limited to a relatively small range of motion (~50 nm)50.
As a consequence of the force-clamp properties of the magnetic tweezers, they are insensitive to drift and noise in the position of the magnets, which considerably relaxes the design constraints on the magnet translation and rotation mechanisms. Magnetic twee-zers based on permanent magnets are well-suited for constant force experiments, but they cannot be used to manipulate magnetic par-ticles in three dimensions. Instead, they provide a constant one-dimensional pulling force without a local minimum. Experiments must therefore be carried out with magnetic particles attached to a surface of the microscope chamber, most commonly by a single molecule of DNA.
In a configuration developed by Bensimon and Croquette, the microscope chamber is mounted on an inverted microscope, and the magnets are held above the chamber, providing an upward pulling force on the magnetic beads75 (Fig. 3a). Rotation of the magnets, accomplished by coupling them to a rotary motor under computer control, permits rotating tethered super-paramagnetic beads. The sample is illuminated through the gap in the magnets with a collimated light emitting diode. Interference between light scattered off the bead and unscattered light produces a well-defined pattern of concentric rings around the image of the bead captured on a CCD camera. The lateral position of the bead is determined from the centroid of the interference pattern, and the axial posi-tion of the bead is determined from the intensity distribution of the interference pattern, which is a strong function of the position of the bead with respect to the focus of the objective82. Calibration of the axial interference signal involves recording the interference pattern at a series of focal positions, accomplished by moving the objective with a piezoelectric focusing element. Axial motion of the bead can then be determined in real-time by correlating the instantaneous diffraction pattern to the calibration pattern. This tracking technique, related to digital holography83, permits real-time three-dimensional video–based tracking with an accuracy of ~2–4 nm laterally and 10 nm axially82.
Sample drift artifacts can be reduced by tracking the position of the mobile bead relative to a reference bead stuck to the surface of the microscope chamber. The force on the magnetic beads is con-trolled by adjusting the position of the magnets above the micro-scope chamber, usually with a motorized platform under computer control. Calibration of the force as a function of magnet distance relies on a variance-based equipartition method similar to that used for the calibration of optical tweezers. A magnetic bead tethered to the surface of the microscope chamber by a DNA molecule and subjected to an upward force can be treated as an inverted pen-dulum with lateral stiffness αx = Fz L
–1, where Fz is the axial force and L is the length of the tether. The lateral stiffness is determined from the transverse fluctuations through the equipartition rela-tion, 0.5αx<x2> = 0.5kBT, and the tether length is measured direct-ly. The maximum force depends on the magnetic moment of the beads, which scales with the volume, and on how close the magnets approach the sample. By using thin sample chambers (~100 µm), thereby reducing the minimum magnet separation, forces in excess of 20 pN can be applied on 1 µm super-paramagnetic beads84. This configuration of magnetic tweezers has been used extensively to measure the topology of individual DNA molecules85,86 and to study topoisomerases76,87,88.
498 | VOL.5 NO.6 | JUNE 2008 | NATURE METHODS
REVIEW©
2008
Nat
ure
Pub
lishi
ng G
roup
ht
tp://
ww
w.n
atur
e.co
m/n
atur
emet
ho
ds
Electromagnet configuration. Magnetic tweezers have also been designed with electromagnets80,82 (Fig. 3b). Electromagnets have the advantage that force and rotation can be controlled by changing the current rather than moving the magnets, which permits faster and simpler control of these parameters. However, to increase the magnetic field the electromagnet coils are typically wrapped around soft iron or mu-metal pole pieces89, which introduce considerable hysteresis in the magnetic field as a function of current. Moreover, the high current required to generate substantial force also generates substantial heat, necessitating the implementation of active cooling in some electromagnetic configurations. Generally speaking, elec-tromagnets produce lower magnetic fields and hence lower forces when configured in a similar manner as permanent magnets82. However, as both force and rotation can be controlled by adjusting the amplitude or phase of the coil current rather than mechanically moving the magnets, electromagnets can be placed in close proxim-ity to the magnetic beads.
Simple, single-pole electromagnetic tweezers have been developed that can apply up to 10 nN of pulling force on a 4.5-µm magnetic bead ~10 µm away from the pole piece90. More recently, Fisher and co-workers developed a microfabricated electromagnetic system in which they used 6 thin-foil electromagnetic pole pieces to achieve three-dimensional position control (Fig. 3b), combined with laser-based particle tracking to achieve position feedback with 100 kHz bandwidth80. High forces and multidimensional control have been achieved with other microfabricated or micromachined electromag-netic tweezers91.
Unlike optical tweezers, electromagnetic tweezers do not cre-ate a stable three-dimensional trapping potential, rather an effec-tive potential is created through active control of the applied force. As a result, properties of the feedback loop determine the effec-tive stiffness82, which can nevertheless be measured with the same techniques used to determine the stiffness of optical tweezers. For laser-based tracking, position calibration is accomplished in a simi-lar manner to optical tweezers80, whereas for video-based position tracking, calibration techniques developed for the permanent mag-netic configuration are used82.
Applications of magnet tweezersMagnetic tweezers offer some advantages over other force spectros-copy techniques and are particularly well-suited for certain mea-surements. They do not suffer from the problems of sample heating and photodamage that plague optical tweezers. Moreover, magnetic manipulation is exquisitely selective for the magnetic beads used as probes, and is generally insensitive to the sample and microscope chamber preparation. These features permit noninvasive force and displacement measurements in complex, heterogeneous environ-ments, including the interior of cells92 and within entangled bio-polymer networks93. Because of the properties of the magnetic field used to impose force, magnetic tweezers offer the prospect of highly parallel single-molecule measurements, which would be difficult or impossible to achieve with other single-molecule force spectroscopy techniques94.
Permanent magnet configurations are relatively simple to assem-ble, and they combine force clamp properties with the ability to impose rotation. This combination makes magnetic tweezers ide-ally suited for the study of DNA topology and topoisomerases76,77. Tethering the DNA molecule to the sample chamber and to the bead through multiple bonds produces rotationally constrained attach-
ments that permit the DNA molecule to be over- or underwound by rotating the magnets (Fig. 3c). Unprecedented control over the topological state of the DNA can be achieved with magnetic twee-zers, permitting sensitive measurements of topoisomerase activity at the single-molecule level. For example, by measuring the relax-ation of supercoiled DNA by topoisomerase IB as a function of load, Koster and co-workers demonstrated that rotation of the DNA around the single strand of DNA across from the transiently gener-ated nick is hindered by rotational friction within the enzyme95. In follow up experiments on topoisomerase IB bound to camptothecin they determined how this potent anti-tumor chemotherapy agent affects supercoil relaxation, which has in vivo implications96. In another series of experiments, Revyakin and co-workers used mag-netic tweezers to dissect the dependence of transcription initiation on DNA supercoiling density97, and more recently, they were able to demonstrate that RNA polymerase ‘scrunches’ the DNA template during abortive initiation98.
Limitations and drawbacksDespite their many unique features, magnetic tweezers are not nearly as versatile as optical tweezers or AFM. The robust perma-nent magnet configuration lacks the manipulation ability of other techniques. Although the ability to rotate magnetic beads has proved useful, the large applied torque precludes the direct measure of rota-tion or torque generation. Furthermore, the bandwidth and sen-sitivity are limited by the video-based detection, which prevents the direct measurement of very fast or very small displacements. Electromagnetic tweezers permit full three-dimensional manipula-tion, but this requires cumbersome feedback control in addition to sophisticated custom-machined pole pieces, and this technique has not yet achieved the sensitivity of some other force spectros-copy techniques. Moreover, producing the large magnetic field and field gradient requires high-current electromagnets that can pro-duce substantial heating or small, closely spaced pole pieces that no longer preserve the constant-force benefit of magnetic tweezers. Nevertheless, electromagnetic manipulation has a great deal of potential, which is being realized through continuing technological and theoretical developments.
ATOMIC FORCE MICROSCOPYAFM (Fig. 4a) is perhaps the most familiar of the three force spec-troscopy techniques covered in this review and is by far the simplest in concept. The atomic force microscope99,100 is a version of the scanning probe microscope in which the properties of the surface are investigated with a proximal probe. This technique allows map-ping of the surface characteristics at sub-nanometer resolution. The atomic force microscope was initially developed to overcome limita-tions of the scanning tunneling microscope in imaging nonconduc-tive samples101,102. However, the possibility of modifying the surface and manipulating individual molecules made AFM an ideal tool for biological applications103–107. One important advantage of the tech-nique is simple and rapid sample preparation. Another important feature of AFM is the ability to conduct measurements of biological samples under near-physiological conditions108,109.
Although the atomic force microscope is primarily an imag-ing tool, it also allows measurement of inter- and intramolecular interaction forces with piconewton resolution. When used for one-dimensional force measurements this specialized version of an atomic force microscope is called a molecular force probe (MFP) and
NATURE METHODS | VOL.5 NO.6 | JUNE 2008 | 499
REVIEW©
2008
Nat
ure
Pub
lishi
ng G
roup
ht
tp://
ww
w.n
atur
e.co
m/n
atur
emet
ho
ds
its use is fundamentally distinct from imaging AFM. When used in an imaging mode, the AFM cantilever scans the surface of the speci-men line after line, whereas in an MFP the cantilever is moved only in the vertical direction, perpendicular to the specimen plane25,110. The vertical motion of the cantilever is controlled by piezoelectric actuators affording sub-nanometer resolution. The displacement of the cantilever is monitored directly with either a capacitor or a linear voltage differential transformer. As a result, high-resolution force-versus-extension curves of single molecules can be recorded using an MFP.
Technical requirements and calibrationWith an MFP measurement two types of characteristic data can be obtained while pulling on the protein or other molecule of interest: force and extension. Proteins can be described as springs that gener-ate a restoring force when mechanically stretched. The extension is the distance between the anchoring points at which the two ends of the protein are attached, such as the surface of a coverslip and the cantilever tip. It is important to note that neither force nor extension data are recorded directly but rather through ‘handles’ that can be manipulated using an MFP.
Force is generally calculated from the bending of a cantilever of known spring constant. The cantilever stiffness depends on the material properties and shape of the cantilever, with typical values of 101–105 pN/nm. To obtain precise force data, each cantilever
must be properly calibrated before use. Cantilevers from the same lot manufactured from the same source may have very different spring constants, especially if they have a sophisticated shape or if they are coated with functionalized or reflecting layers to improve their performance.
The most commonly used calibration methods can be divided into four principal groups111. The stiffness of the cantilever can be obtained (i) through comparison with a reference cantilever of known stiffness, (ii) through calibration using thermal vibrations, (iii) by the method of added particle masses, or (iv) by combining measurements of the resonant frequency with the cantilever physi-cal dimensions and material properties. In general, if the cantilever is compared with a reference cantilever the stiffness accuracy will be ~10%, but the positioning and the calibration of the load can be troublesome and potentially destructive. The accuracy of calibrating cantilevers with the thermal fluctuation method varies between 10 and 20%, but precise control of thermal fluctuations is essential. This method is commonly used to calibrate soft cantilevers, and it requires mathematical analysis of the resonance curve acquired for each can-tilever. Calibration by the method of static deflection with added mass is conceptually straightforward, but the positioning and exact determination of the additional load is challenging. Furthermore, the calibration process can potentially destroy the cantilever. The accu-racy of this method is ~15%. Cantilever stiffness is most accurately determined with the method of scaling from the resonance frequency, which gives results with 5–10% error. Accurate measurements of the cantilever dimensions and determination of effective mass is crucial when this method of calibration is applied111.
The extension data are obtained by measuring the change in dis-placement between the handles that are attached at the ends of the protein or other molecule of interest. The accuracy of this data is determined by the quality of the piezoelectric stage. Piezoelectric stages used in MFPs provide angstrom-level resolution, and with the advent of closed-loop position feedback control these devices are accurate and not susceptible to the drift and hysteresis commonly associated with piezoelectric actuators. Data must be corrected for the deflection of the cantilever associated with the measured force. The exact extension of the stretched protein can be obtained only if the attachment points can be precisely located, for example, by using microfabricated cantilevers. The exact position of the tip of the soft cantilever relative to the fixed surface, such as a coverslip, can also be determined directly with the use of a calibrated evanescent field112.
To facilitate mechanically strong and specific interactions between the sample molecule and the handles (cantilever tips and surfaces)
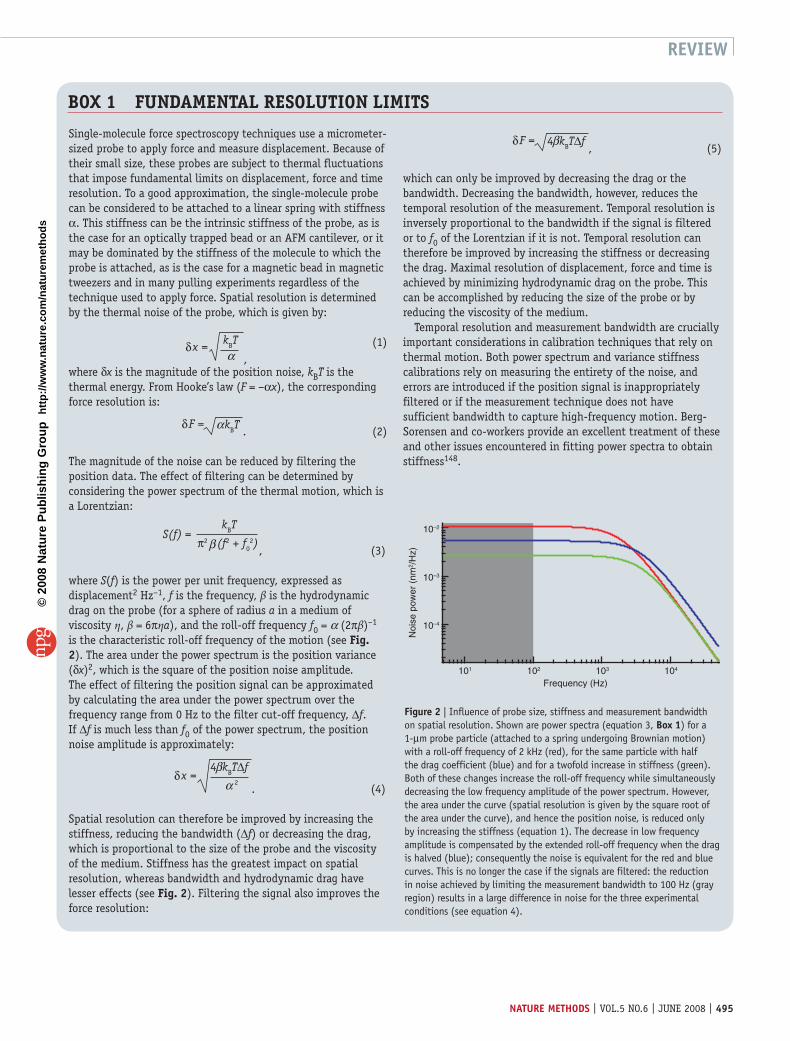
Piezoelectric scanner
Cantilever
PSD
Detection laser
0 25 50 75 100 125
0
400
300
200
100
Extension (nm)
For
ce (
pN)
a
b
∆Lc = ~15 nm
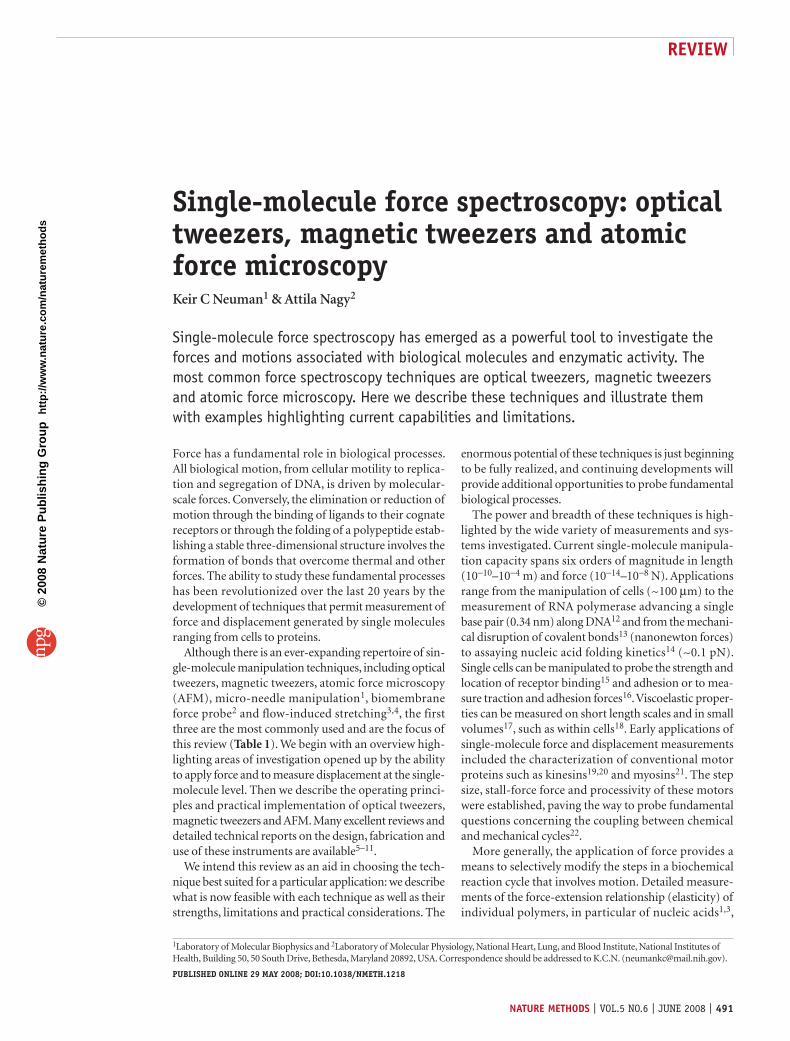
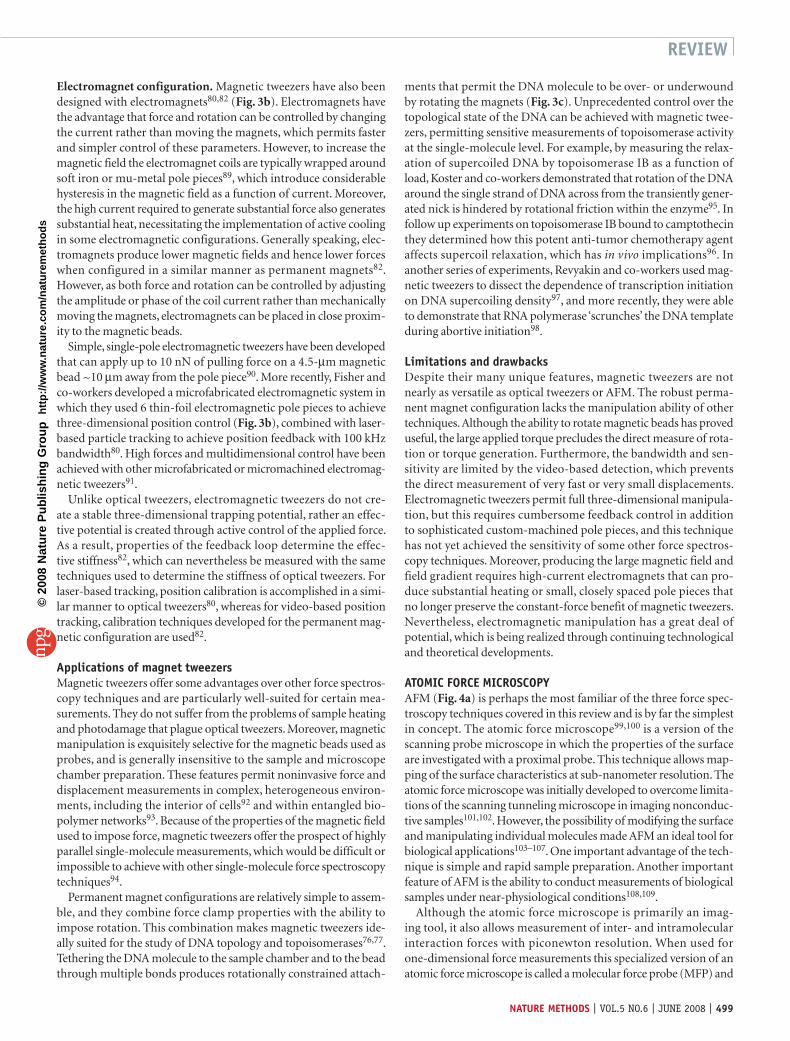
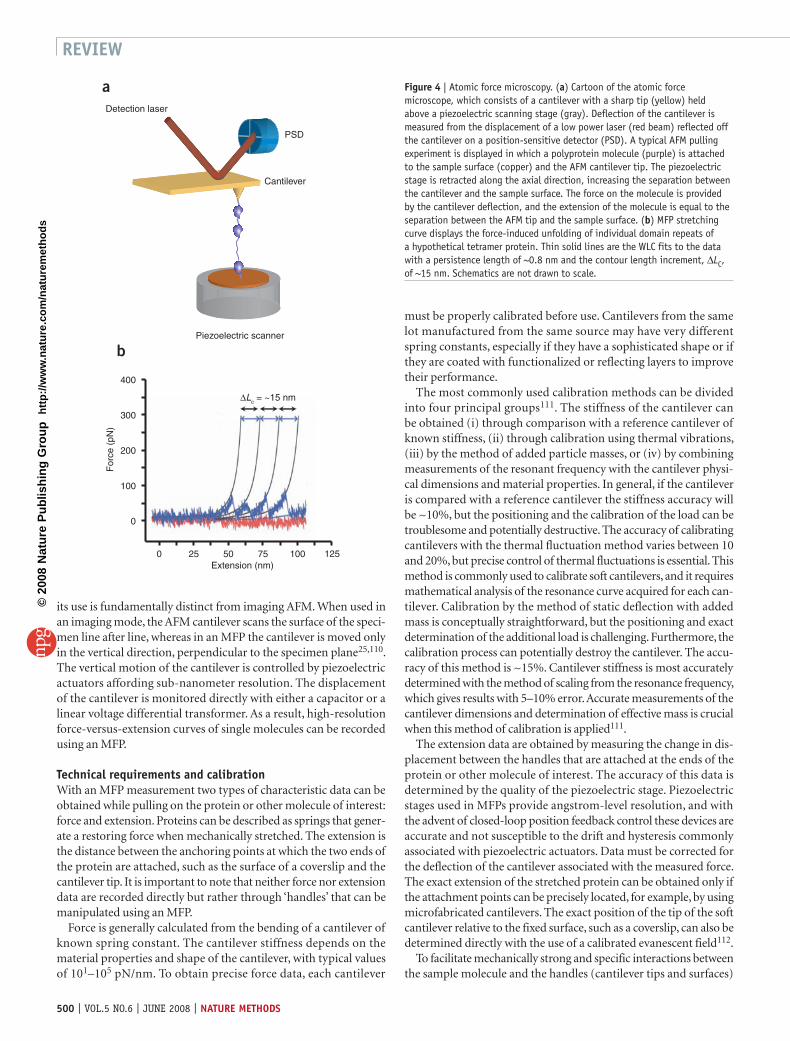
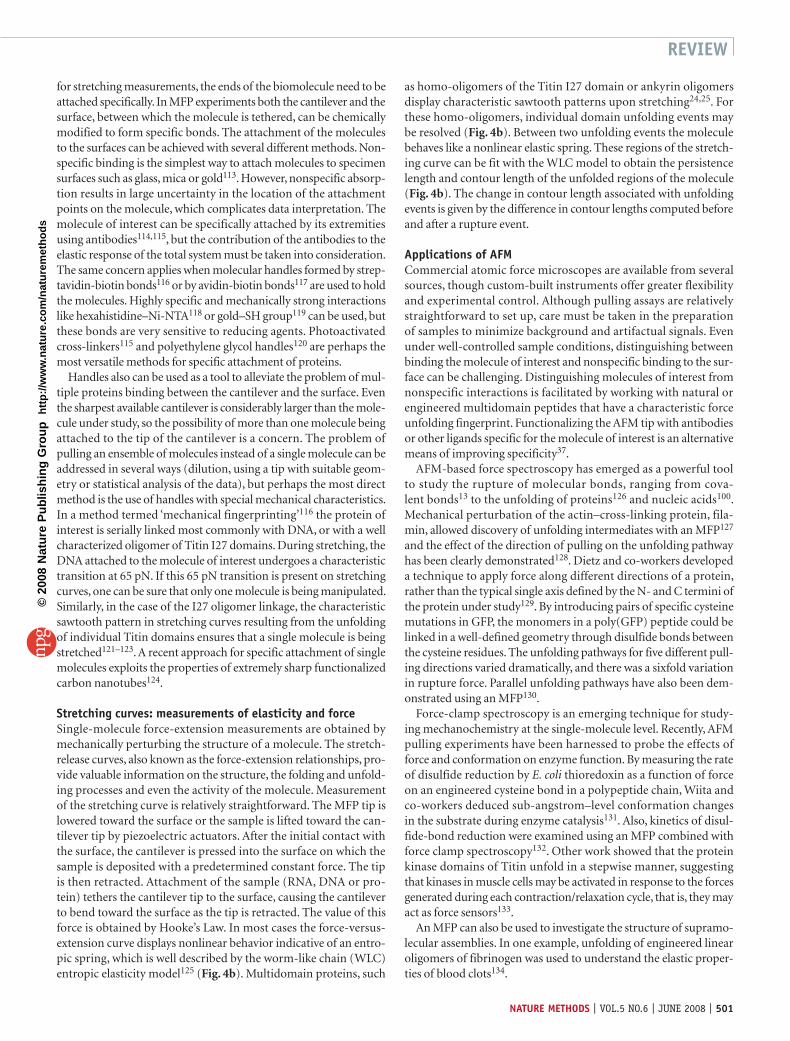
Figure 4 | Atomic force microscopy. (a) Cartoon of the atomic force microscope, which consists of a cantilever with a sharp tip (yellow) held above a piezoelectric scanning stage (gray). Deflection of the cantilever is measured from the displacement of a low power laser (red beam) reflected off the cantilever on a position-sensitive detector (PSD). A typical AFM pulling experiment is displayed in which a polyprotein molecule (purple) is attached to the sample surface (copper) and the AFM cantilever tip. The piezoelectric stage is retracted along the axial direction, increasing the separation between the cantilever and the sample surface. The force on the molecule is provided by the cantilever deflection, and the extension of the molecule is equal to the separation between the AFM tip and the sample surface. (b) MFP stretching curve displays the force-induced unfolding of individual domain repeats of a hypothetical tetramer protein. Thin solid lines are the WLC fits to the data with a persistence length of ~0.8 nm and the contour length increment, ∆LC, of ~15 nm. Schematics are not drawn to scale.
500 | VOL.5 NO.6 | JUNE 2008 | NATURE METHODS
REVIEW©
2008
Nat
ure
Pub
lishi
ng G
roup
ht
tp://
ww
w.n
atur
e.co
m/n
atur
emet
ho
ds
for stretching measurements, the ends of the biomolecule need to be attached specifically. In MFP experiments both the cantilever and the surface, between which the molecule is tethered, can be chemically modified to form specific bonds. The attachment of the molecules to the surfaces can be achieved with several different methods. Non-specific binding is the simplest way to attach molecules to specimen surfaces such as glass, mica or gold113. However, nonspecific absorp-tion results in large uncertainty in the location of the attachment points on the molecule, which complicates data interpretation. The molecule of interest can be specifically attached by its extremities using antibodies114,115, but the contribution of the antibodies to the elastic response of the total system must be taken into consideration. The same concern applies when molecular handles formed by strep-tavidin-biotin bonds116 or by avidin-biotin bonds117 are used to hold the molecules. Highly specific and mechanically strong interactions like hexahistidine–Ni-NTA118 or gold–SH group119 can be used, but these bonds are very sensitive to reducing agents. Photoactivated cross-linkers115 and polyethylene glycol handles120 are perhaps the most versatile methods for specific attachment of proteins.
Handles also can be used as a tool to alleviate the problem of mul-tiple proteins binding between the cantilever and the surface. Even the sharpest available cantilever is considerably larger than the mole-cule under study, so the possibility of more than one molecule being attached to the tip of the cantilever is a concern. The problem of pulling an ensemble of molecules instead of a single molecule can be addressed in several ways (dilution, using a tip with suitable geom-etry or statistical analysis of the data), but perhaps the most direct method is the use of handles with special mechanical characteristics. In a method termed ‘mechanical fingerprinting’116 the protein of interest is serially linked most commonly with DNA, or with a well characterized oligomer of Titin I27 domains. During stretching, the DNA attached to the molecule of interest undergoes a characteristic transition at 65 pN. If this 65 pN transition is present on stretching curves, one can be sure that only one molecule is being manipulated. Similarly, in the case of the I27 oligomer linkage, the characteristic sawtooth pattern in stretching curves resulting from the unfolding of individual Titin domains ensures that a single molecule is being stretched121–123. A recent approach for specific attachment of single molecules exploits the properties of extremely sharp functionalized carbon nanotubes124.
Stretching curves: measurements of elasticity and forceSingle-molecule force-extension measurements are obtained by mechanically perturbing the structure of a molecule. The stretch-release curves, also known as the force-extension relationships, pro-vide valuable information on the structure, the folding and unfold-ing processes and even the activity of the molecule. Measurement of the stretching curve is relatively straightforward. The MFP tip is lowered toward the surface or the sample is lifted toward the can-tilever tip by piezoelectric actuators. After the initial contact with the surface, the cantilever is pressed into the surface on which the sample is deposited with a predetermined constant force. The tip is then retracted. Attachment of the sample (RNA, DNA or pro-tein) tethers the cantilever tip to the surface, causing the cantilever to bend toward the surface as the tip is retracted. The value of this force is obtained by Hooke’s Law. In most cases the force-versus-extension curve displays nonlinear behavior indicative of an entro-pic spring, which is well described by the worm-like chain (WLC) entropic elasticity model125 (Fig. 4b). Multidomain proteins, such
as homo-oligomers of the Titin I27 domain or ankyrin oligomers display characteristic sawtooth patterns upon stretching24,25. For these homo-oligomers, individual domain unfolding events may be resolved (Fig. 4b). Between two unfolding events the molecule behaves like a nonlinear elastic spring. These regions of the stretch-ing curve can be fit with the WLC model to obtain the persistence length and contour length of the unfolded regions of the molecule (Fig. 4b). The change in contour length associated with unfolding events is given by the difference in contour lengths computed before and after a rupture event.
Applications of AFMCommercial atomic force microscopes are available from several sources, though custom-built instruments offer greater flexibility and experimental control. Although pulling assays are relatively straightforward to set up, care must be taken in the preparation of samples to minimize background and artifactual signals. Even under well-controlled sample conditions, distinguishing between binding the molecule of interest and nonspecific binding to the sur-face can be challenging. Distinguishing molecules of interest from nonspecific interactions is facilitated by working with natural or engineered multidomain peptides that have a characteristic force unfolding fingerprint. Functionalizing the AFM tip with antibodies or other ligands specific for the molecule of interest is an alternative means of improving specificity37.
AFM-based force spectroscopy has emerged as a powerful tool to study the rupture of molecular bonds, ranging from cova-lent bonds13 to the unfolding of proteins126 and nucleic acids100. Mechanical perturbation of the actin–cross-linking protein, fila-min, allowed discovery of unfolding intermediates with an MFP127 and the effect of the direction of pulling on the unfolding pathway has been clearly demonstrated128. Dietz and co-workers developed a technique to apply force along different directions of a protein, rather than the typical single axis defined by the N- and C termini of the protein under study129. By introducing pairs of specific cysteine mutations in GFP, the monomers in a poly(GFP) peptide could be linked in a well-defined geometry through disulfide bonds between the cysteine residues. The unfolding pathways for five different pull-ing directions varied dramatically, and there was a sixfold variation in rupture force. Parallel unfolding pathways have also been dem-onstrated using an MFP130.
Force-clamp spectroscopy is an emerging technique for study-ing mechanochemistry at the single-molecule level. Recently, AFM pulling experiments have been harnessed to probe the effects of force and conformation on enzyme function. By measuring the rate of disulfide reduction by E. coli thioredoxin as a function of force on an engineered cysteine bond in a polypeptide chain, Wiita and co-workers deduced sub-angstrom–level conformation changes in the substrate during enzyme catalysis131. Also, kinetics of disul-fide-bond reduction were examined using an MFP combined with force clamp spectroscopy132. Other work showed that the protein kinase domains of Titin unfold in a stepwise manner, suggesting that kinases in muscle cells may be activated in response to the forces generated during each contraction/relaxation cycle, that is, they may act as force sensors133.
An MFP can also be used to investigate the structure of supramo-lecular assemblies. In one example, unfolding of engineered linear oligomers of fibrinogen was used to understand the elastic proper-ties of blood clots134.
NATURE METHODS | VOL.5 NO.6 | JUNE 2008 | 501
REVIEW©
2008
Nat
ure
Pub
lishi
ng G
roup
ht
tp://
ww
w.n
atur
e.co
m/n
atur
emet
ho
ds
An interesting new development is the combination of AFM imag-ing with force mapping and spectroscopy135. This technique allows the investigator to perform an image scan of the surface and sub-sequently target specific topological structures for stretching mea-surements with sub-nanometer accuracy. In one example, purple membrane patches were imaged with the atomic force microscope to find the location of an individual bacteriorhodopsin molecule, which was then extracted with the same AFM tip so the unbinding forces and force spectrum of removal could be measured136. These experiments highlight the unique capability of AFM instruments to both image the surface topology at high resolution and measure the unbinding or unfolding forces at well-defined locations.
Force spectroscopy measurements of ligand binding, antibody-antigen interactions and protein unfolding are well established and widely used. MFP instruments are now routinely used to probe the affinity, mechanics and recognition properties of biomolecular interactions.
Drawbacks, limitations and future perspectivesThe main drawbacks and limitations of AFM stem from the large size and relatively high stiffness of the cantilevers, which impose a lower bound on the useful force range and a reduced bandwidth, particularly in aqueous conditions (Box 1). The forces associated with many biological processes and structures are therefore difficult to study with AFM. Specificity is a second major concern in many AFM pulling experiments. It can be difficult to discriminate interac-tions of the AFM tip with the molecule of interest from nonspecific interactions or inappropriate contacts with the molecule of interest, such as binding at an intermediate position rather than at one of the ends.
Current cutting-edge AFM techniques are highly sophisticated. Considerable steps have been made toward technological improve-ments of data acquisition speed. One of the most interesting and scientifically potent improvements to the field is high-speed AFM137, which makes it possible to follow molecular events in real time. Another promising direction of development is the combination of different single-molecule techniques. Some of these techniques already exist, such as the combination of AFM imaging with force mapping and spectroscopy, the combination of AFM with fluorescent imaging and the combination of an MFP with total internal reflection fluorescence microscopy. The last technique can be used to follow the process of protein unfolding or refolding via changes in force and emission of a fluorophore for a fluorophore-labeled sample.
PROSPECTS AND OUTLOOKOver the past two decades there have been remarkable developments and refinements in single-molecule force spectroscopy techniques that have opened up new avenues of biophysical and biological research. The power and success of these techniques are illustrated by the rapidly growing number of applications and systems to which they are being applied, and by the fact that these once cutting-edge techniques are becoming more commonplace, some even commer-cialized.
With this strong foundation to build on, the field will be able to address harder problems and bigger challenges. Primary among these is the need to develop single-molecule force spectroscopy techniques that can be applied in living cells. With a few notable exceptions40,91, single-molecule manipulation has been primar-ily concerned with in vitro measurements of purified proteins or
with probes attached to cell membranes. Performing the same or similar experiments in vivo will provide an unparalleled view of how individual enzymes function in their native environment, and how cells generate and respond to forces at the molecular level. Although these measurements are beginning to be undertaken, a great deal of work remains to overcome the many difficulties associated with attempting to bring single-molecule techniques to the interior of the cell. Improvements in specific and efficient labeling of intra-cellular proteins with appropriate manipulation ‘handles’ will be required, in addition to less damaging and less invasive manipula-tion techniques that are insensitive to the crowded, inhomogeneous conditions found within a cell. Along the same lines, improvements in single-molecule force spectroscopy methods are required to per-mit the study of macromolecular protein machines138 and multi-enzyme complexes139–142. The combination of force-spectroscopy techniques with other single-molecule methods, in particular single-molecule fluorescence detection modalities143–145, is an important development that will grow in importance as the complexity of the questions addressed increases. At the other extreme, increasing par-allelism146 and throughput in single-molecule force spectroscopy measurements will be important developments. Finally, the abil-ity to manipulate and control unlabeled proteins has recently been described147, but this and other emerging techniques have yet to be fully realized. In addition to these developments, new technologies will enable the continuing development of novel single-molecule force spectroscopy techniques.
ACKNOWLEDGMENTSK.C.N. and A.N. are supported by the Intramural Program of the National Heart, Lung, and Blood Institute, National Institutes of Health. We thank G. Liou, R. Neuman and Y. Takagi for critical reading of the manuscript. K.C.N. acknowledges D. Bensimon, V. Croquette and S. Block, in addition to members of their labs.
Published online at http://www.nature.com/naturemethods/ Reprints and permissions information is available online at http://npg.nature.com/reprintsandpermissions/
1. Cluzel, P. et al. DNA: An extensible molecule. Science 271, 792–794 (1996).2. Evans, E., Ritchie, K. & Merkel, R. Sensitive force technique to probe
molecular adhesion and structural linkages at biological interfaces. Biophys. J. 68, 2580–2587 (1995).
3. Smith, S.B., Finzi, L. & Bustamante, C. Direct mechanical measurements of the elasticity of single DNA molecules by using magnetic beads. Science 258, 1122–1126 (1992).
4. Kim, S.J., Blainey, P.C., Schroeder, C.M. & Xie, X.S. Multiplexed single-molecule assay for enzymatic activity on flow-stretched DNA. Nat. Methods 4, 397–399 (2007).
5. Greenleaf, W.J., Woodside, M.T. & Block, S.M. High-resolution, single-molecule measurements of biomolecular motion. Annu. Rev. Biophys. Biomol. Struct. 36, 171–190 (2007).
6. Neuman, K.C. & Block, S.M. Optical trapping. Rev. Sci. Instrum. 75, 2787–2809 (2004).
A detailed and thorough technical review of optical trapping.7. Tanase, M., Biais, N. & Sheetz, M. Magnetic tweezers in cell biology. Methods
Cell Biol. 83, 473–493 (2007).8. Zlatanova, J., Lindsay, S.M. & Leuba, S.H. Single molecule force spectroscopy
in biology using the atomic force microscope. Prog. Biophys. Mol. Biol. 74, 37–61 (2000).
9. Lee, C.K., Wang, Y.M., Huang, L.S. & Lin, S. Atomic force microscopy: determination of unbinding force, off rate and energy barrier for protein-ligand interaction. Micron 38, 446–461 (2007).
10. Lang, M.J., Asbury, C.L., Shaevitz, J.W. & Block, S.M. An automated two-dimensional optical force clamp for single molecule studies. Biophys. J. 83, 491–501 (2002).
11. Neuman, K.C., Lionnet, T. & Allemand, J.F. Single-molecule micromanipulation techniques. Annu. Rev. Mater. Res. 37, 33–67 (2007).
12. Abbondanzieri, E.A., Greenleaf, W.J., Shaevitz, J.W., Landick, R. & Block, S.M. Direct observation of base-pair stepping by RNA polymerase. Nature
502 | VOL.5 NO.6 | JUNE 2008 | NATURE METHODS
REVIEW©
2008
Nat
ure
Pub
lishi
ng G
roup
ht
tp://
ww
w.n
atur
e.co
m/n
atur
emet
ho
ds
438, 460–465 (2005). This is an experimental tour de force in which individual 0.34 nm base-
pair steps of transcribing RNA polymerases were directly measured with optical tweezers.
13. Grandbois, M., Beyer, M., Rief, M., Clausen-Schaumann, H. & Gaub, H.E. How strong is a covalent bond? Science 283, 1727–1730 (1999).
14. Hohng, S. et al. Fluorescence-force spectroscopy maps two-dimensional reaction landscape of the holliday junction. Science 318, 279–283 (2007).
15. Litvinov, R.I., Shuman, H., Bennett, J.S. & Weisel, J.W. Binding strength and activation state of single fibrinogen-integrin pairs on living cells. Proc. Natl. Acad. Sci. USA 99, 7426–7431 (2002).
16. Prass, M., Jacobson, K., Mogilner, A. & Radmacher, M. Direct measurement of the lamellipodial protrusive force in a migrating cell. J. Cell Biol. 174, 767–772 (2006).
17. MacKintosh, F.C. & Schmidt, C.F. Microrheology. Curr. Opin. Colloid Interface Sci. 4, 300–307 (1999).
18. Daniels, B.R., Masi, B.C. & Wirtz, D. Probing single-cell micromechanics in vivo: the microrheology of C. elegans developing embryos. Biophys. J. 90, 4712–4719 (2006).
19. Block, S.M., Goldstein, L.S. & Schnapp, B.J. Bead movement by single kinesin molecules studied with optical tweezers. Nature 348, 348–352 (1990).
20. Svoboda, K. & Block, S.M. Force and velocity measured for single kinesin molecules. Cell 77, 773–784 (1994).
21. Simmons, R.M. et al. Force on single actin filaments in a motility assay measured with an optical trap. Adv. Exp. Med. Biol. 332, 331–336 (1993).
22. Tinoco, I. Jr & Bustamante, C. The effect of force on thermodynamics and kinetics of single molecule reactions. Biophys. Chem. 101–102, 513–533 (2002).
A detailed and comprehensive treatment of the effects of force on single-molecule reactions; the concepts and analysis presented form the underpinning of single-molecule force spectroscopy.
23. Tskhovrebova, L., Trinick, J., Sleep, J.A. & Simmons, R.M. Elasticity and unfolding of single molecules of the giant muscle protein titin. Nature 387, 308–312 (1997).
24. Kellermayer, M.S.Z., Smith, S.B., Granzier, H.L. & Bustamante, C. Folding-unfolding transitions in single titin molecules characterized with laser tweezers. Science 276, 1112–1116 (1997).
25. Rief, M., Gautel, M., Oesterhelt, F., Fernandez, J.M. & Gaub, H.E. Reversible unfolding of individual titin immunoglobulin domains by AFM. Science 276, 1109–1112 (1997).
This paper and the one above (ref. 24) appeared together and described the first demonstrations of the mechanical unfolding of an individual protein.
26. Hummer, G. & Szabo, A. Free energy surfaces from single-molecule force spectroscopy. Acc. Chem. Res. 38, 504–513 (2005).
27. Woodside, M.T. et al. Nanomechanical measurements of the sequence-dependent folding landscapes of single nucleic acid hairpins. Proc. Natl. Acad. Sci. USA 103, 6190–6195 (2006).
28. Lim, C.T., Zhou, E.H., Li, A., Vedula, S.R.K. & Fu, H.X. Experimental techniques for single cell and single molecule biomechanics. Mater. Sci. Eng. C-Biomimetic Supramol. Syst. 26, 1278–1288 (2006).
29. Zhuang, X.W. & Rief, M. Single-molecule folding. Curr. Opin. Struct. Biol. 13, 88–97 (2003).
30. Evans, E. Probing the relation between force–lifetime–and chemistry in single molecular bonds. Annu. Rev. Biophys. Biomol. Struct. 30, 105–128 (2001).
31. Jarzynski, C. Nonequilibrium equality for free energy differences. Phys. Rev. Lett. 78, 2690–2693 (1997).
This seminal paper presents the remarkable Jarzynski equality that relates the equilibrium free energy difference to non-equilibrium measurements of work. The Jarzynski equality and subsequent relations based on the equality permit the extraction of folding free energies from out-of-equilibrium mechanical unfolding experiments.
32. Lu, H.P., Xun, L. & Xie, X.S. Single-molecule enzymatic dynamics. Science 282, 1877–1882 (1998).
33. Xie, X.S. & Lu, H.P. Single-molecule enzymology. J. Biol. Chem. 274, 15967–15970 (1999).
34. Hua, W., Young, E.C., Fleming, M.L. & Gelles, J. Coupling of kinesin steps to ATP hydrolysis. Nature 388, 390–393 (1997).
35. Schnitzer, M.J. & Block, S.M. Kinesin hydrolyses one ATP per 8-nm step. Nature 388, 386–390 (1997).
36. Hermanson, G. Bioconjugate Techniques. (Academic Press, San Diego 1996).37. Hinterdorfer, P. & Dufrene, Y.F. Detection and localization of single molecular
recognition events using atomic force microscopy. Nat. Methods 3, 347–355
(2006).38. Ashkin, A., Dziedzic, J.M., Bjorkholm, J.E. & Chu, S. Observation of a single-
beam gradient force optical trap for dielectric particles. Opt. Lett. 11, 288–290 (1986).
This classic paper is the first experimental demonstration of the single-beam gradient trap, or optical tweezers.
39. Neuman, K.C., Chadd, E.H., Liou, G.F., Bergman, K. & Block, S.M. Characterization of photodamage to Escherichia coli in optical traps. Biophys. J. 77, 2856–2863 (1999).
40. Sacconi, L., Tolic-Norrelykke, I.M., Stringari, C., Antolini, R. & Pavone, F.S. Optical micromanipulations inside yeast cells. Appl. Opt. 44, 2001–2007 (2005).
41. Cherney, D.P., Bridges, T.E. & Harris, J.M. Optical trapping of unilamellar phospholipid vesicles: Investigation of the effect of optical forces on the lipid membrane shape by confocal-raman microscopy. Anal. Chem. 76, 4920–4928 (2004).
42. Lee, W.M., Reece, P.J., Marchington, R.F., Metzger, N.K. & Dholakia, K. Construction and calibration of an optical trap on a fluorescence optical microscope. Nat. Protocols 2, 3226–3238 (2007).
43. Neuman, K.C., Abbondanzieri, E.A. & Block, S.M. Measurement of the effective focal shift in an optical trap. Opt. Lett. 30, 1318–1320 (2005).
44. Fallman, E. & Axner, O. Influence of a glass-water interface on the on-axis trapping of micrometer-sized spherical objects by optical tweezers. Appl. Opt. 42, 3915–3926 (2003).
45. Viana, N.B., Rocha, M.S., Mesquita, O.N., Mazolli, A. & Neto, P.A.M. Characterization of objective transmittance for optical tweezers. Appl. Opt. 45, 4263–4269 (2006).
46. Misawa, H., Koshioka, M., Sasaki, K., Kitamura, N. & Masuhara, H. Three-dimensional optical trapping and laser ablation of a single polymer latex particle in water. J. Appl. Phys. 70, 3829–3836 (1991).
47. Rohrbach, A. & Stelzer, E.H.K. Three-dimensional position detection of optically trapped dielectric particles. J. Appl. Phys. 91, 5474–5488 (2002).
48. Gittes, F. & Schmidt, C.F. Interference model for back-focal-plane displacement detection in optical tweezers. Opt. Lett. 23, 7–9 (1998).
49. Peterman, E.J.G., van Dijk, M.A., Kapitein, L.C. & Schmidt, C.F. Extending the bandwidth of optical-tweezers interferometry. Rev. Sci. Instrum. 74, 3246–3249 (2003).
50. Greenleaf, W.J., Woodside, M.T., Abbondanzieri, E.A. & Block, S.M. Passive all-optical force clamp for high-resolution laser trapping. Phys. Rev. Lett. 95, 208102 (2005).
51. Carter, A.R., King, G.M. & Perkins, T.T. Back-scattered detection provides atomic-scale localization precision, stability, and registration in 3D. Opt. Express 15, 13434–13445 (2007).
52. Carter, A.R. et al. Stabilization of an optical microscope to 0.1 nm in three dimensions. Appl. Opt. 46, 421–427 (2007).
53. Vermeulen, K.C. et al. Calibrating bead displacements in optical tweezers using acousto-optic deflectors. Rev. Sci. Instrum. 77, 013704 (2006).
54. Tolic-Norrelykke, S.F. et al. Calibration of optical tweezers with positional detection in the back focal plane. Rev. Sci. Instrum. 77, 103101 (2006).
55. Svoboda, K., Schmidt, C.F., Schnapp, B.J. & Block, S.M. Direct observation of kinesin stepping by optical trapping interferometry. Nature 365, 721–727 (1993).
The first direct measurement of the steps taken by individual kinesin.56. Mammen, M. et al. Optically controlled collisions of biological objects to
evaluate potent polyvalent inhibitors of virus-cell adhesion. Chem. Biol. 3, 757–763 (1996).
57. Kerssemakers, J.W.J. et al. Assembly dynamics of microtubules at molecular resolution. Nature 442, 709–712 (2006).
58. Wang, M.D. et al. Force and velocity measured for single molecules of RNA polymerase. Science 282, 902–907 (1998).
59. Herbert, K.M. et al. Sequence-resolved detecton of pausing by single RNA polymerase molecules. Cell 125, 1083–1094 (2006).
60. Neuman, K.C., Abbondanzieri, E.A., Landick, R., Gelles, J. & Block, S.M. Ubiquitous transcriptional pausing is independent of RNA polymerase backtracking. Cell 115, 437–447 (2003).
61. Shaevitz, J.W., Abbondanzieri, E.A., Landick, R. & Block, S.M. Backtracking by single RNA polymerase molecules observed at near-base-pair resolution. Nature 426, 684–687 (2003).
62. Moffitt, J.R., Chemla, Y.R., Izhaky, D. & Bustamante, C. Differential detection of dual traps improves the spatial resolution of optical tweezers. Proc. Natl. Acad. Sci. USA 103, 9006–9011 (2006).
63. Dame, R.T., Noom, M.C. & Wuite, G.J. Bacterial chromatin organization by H-NS protein unravelled using dual DNA manipulation. Nature 444, 387–390 (2006).
64. Smith, D.E. et al. The bacteriophage phi 29 portal motor can package DNA
NATURE METHODS | VOL.5 NO.6 | JUNE 2008 | 503
REVIEW©
2008
Nat
ure
Pub
lishi
ng G
roup
ht
tp://
ww
w.n
atur
e.co
m/n
atur
emet
ho
ds
against a large internal force. Nature 413, 748–752 (2001).65. Liphardt, J., Onoa, B., Smith, S.B., Tinoco, I. & Bustamante, C. Reversible
unfolding of single RNA molecules by mechanical force. Science 292, 733–737 (2001).
This paper was the first to show the mechanical unfolding of RNA structures, and it laid the groundwork for subsequent measurements of enzymatic unfolding of nucleic acid structures.
66. Dumont, S. et al. RNA translocation and unwinding mechanism of HCV NS3 helicase and its coordination by ATP. Nature 439, 105–108 (2006).
67. Friese, M.E.J., Nieminen, T.A., Heckenberg, N.R. & Rubinsztein-Dunlop, H. Optical alignment and spinning of laser-trapped microscopic particles. Nature 394, 348–350 (1998).
68. Deufel, C., Forth, S., Simmons, C.R., Dejgosha, S. & Wang, M.D. Nanofabricated quartz cylinders for angular trapping: DNA supercoiling torque detection. Nat. Methods 4, 223–225 (2007).
69. La Porta, A. & Wang, M.D. Optical torque wrench: angular trapping, rotation, and torque detection of quartz microparticles. Phys. Rev. Lett. 92, 190801 (2004).
70. Gross, S.P. Application of optical traps in vivo. Methods Enzymol. 361, 162–174 (2003).
71. Peterman, E.J.G., Gittes, F. & Schmidt, C.F. Laser-induced heating in optical traps. Biophys. J. 84, 1308–1316 (2003).
72. Abbondanzieri, E.A., Shaevitz, J.W. & Block, S.M. Picocalorimetry of transcription by RNA polymerase. Biophys. J. 89, L61–L63 (2005).
73. Seol, Y., Carpenter, A.E. & Perkins, T.T. Gold nanoparticles: enhanced optical trapping and sensitivity coupled with significant heating. Opt. Lett. 31, 2429–2431 (2006).
74. Liang, H. et al. Wavelength dependence of cell cloning efficiency after optical trapping. Biophys. J. 70, 1529–1533 (1996).
75. Strick, T., Allemand, J., Croquette, V. & Bensimon, D. Twisting and stretching single DNA molecules. Prog. Biophys. Mol. Biol. 74, 115–140 (2000).
76. Charvin, G., Strick, T.R., Bensimon, D. & Croquette, V. Tracking topoisomerase activity at the single-molecule level. Annu. Rev. Biophys. Biomol. Struct. 34, 201–219 (2005).
77. Strick, T.R., Croquette, V. & Bensimon, D. Single-molecule analysis of DNA uncoiling by a type II topoisomerase. Nature 404, 901–904 (2000).
This was the first single-molecule measurement of topoisomerase activity using magnetic tweezers.
78. Gore, J. et al. Mechanochemical analysis of DNA gyrase using rotor bead tracking. Nature 439, 100–104 (2006).
79. Itoh, H. et al. Mechanically driven ATP synthesis by F-1-ATPase. Nature 427, 465–468 (2004).
80. Fisher, J.K. et al. Thin-foil magnetic force system for high-numerical-aperture microscopy. Rev. Sci. Instrum. 77, 023702 (2006).
81. Yan, J., Skoko, D. & Marko, J.F. Near-field-magnetic-tweezer manipulation of single DNA molecules. Phys. Rev. E 70, 011905 (2004).
82. Gosse, C. & Croquette, V. Magnetic tweezers: micromanipulation and force measurement at the molecular level. Biophys. J. 82, 3314–3329 (2002).
83. Lee, S.H. et al. Characterizing and tracking single colloidal particles with video holographic microscopy. Opt. Express 15, 18275–18282 (2007).
84. Lionnet, T., Spiering, M.M., Benkovic, S.J., Bensimon, D. & Croquette, V. Real-time observation of bacteriophage T4 gp41 helicase reveals an unwinding mechanism. Proc. Natl. Acad. Sci. USA 104, 19790–19795 (2007).
85. Strick, T.R., Allemand, J.F., Bensimon, D., Bensimon, A. & Croquette, V. The elasticity of a single supercoiled DNA molecule. Science 271, 1835–1837 (1996).
86. Strick, T.R., Allemand, J.F., Bensimon, D. & Croquette, V. Behavior of supercoiled DNA. Biophys. J. 74, 2016–2028 (1998).
87. Dekker, N.H. et al. The mechanism of type IA topoisomerases. Proc. Natl. Acad. Sci. USA 99, 12126–12131 (2002).
88. Charvin, G., Bensimon, D. & Croquette, V. Single-molecule study of DNA unlinking by eukaryotic and prokaryotic type-II topoisomerases. Proc. Natl. Acad. Sci. USA 100, 9820–9825 (2003).
89. Conroy, R.S. Force spectroscopy with optical and magnetic tweezers. in Handbook of Molecular Force Spectroscopy (ed. Noy, A.) 23–96 (Springer US, New York, 2008).
90. Bausch, A.R., Ziemann, F., Boulbitch, A.A., Jacobson, K. & Sackmann, E. Local measurements of viscoelastic parameters of adherent cell surfaces by magnetic bead microrheometry. Biophys. J. 75, 2038–2049 (1998).
91. de Vries, A.H., Krenn, B.E., van Driel, R. & Kanger, J.S. Micro magnetic tweezers for nanomanipulation inside live cells. Biophys. J. 88, 2137–2144 (2005).
92. Bausch, A.R., Moller, W. & Sackmann, E. Measurement of local viscoelasticity and forces in living cells by magnetic tweezers. Biophys. J. 76, 573–579 (1999).
93. Keller, M., Schilling, J. & Sackmann, E. Oscillatory magnetic bead rheometer for complex fluid microrheometry. Rev. Sci. Instrum. 72, 3626–3634 (2001).
94. Danilowicz, C., Greenfield, D. & Prentiss, M. Dissociation of ligand-receptor complexes using magnetic tweezers. Anal. Chem. 77, 3023–3028 (2005).
95. Koster, D.A., Croquette, V., Dekker, C., Shuman, S. & Dekker, N.H. Friction and torque govern the relaxation of DNA supercoils by eukaryotic topoisomerase IB. Nature 434, 671–674 (2005).
96. Koster, D.A., Palle, K., Bot, E.S., Bjornsti, M.A. & Dekker, N.H. Antitumour drugs impede DNA uncoiling by topoisomerase I. Nature 448, 213–217 (2007).
The mechanism of action of a type I topoisomerase inhibitor measured at the single-molecule level was shown to be directly related to its effects in vivo.
97. Revyakin, A., Ebright, R.H. & Strick, T.R. Single-molecule DNA nanomanipulation: improved resolution through use of shorter DNA fragments. Nat. Methods 2, 127–138 (2005).
98. Revyakin, A., Liu, C., Ebright, R.H. & Strick, T.R. Abortive initiation and productive initiation by RNA polymerase involve DNA scrunching. Science 314, 1139–1143 (2006).
99. Binnig, G., Quate, C.F. & Gerber, C. Atomic force microscope. Phys. Rev. Lett. 56, 930–933 (1986).
100. Lee, G.U., Chrisey, L.A. & Colton, R.J. Direct measurement of the forces between complementary strands of DNA. Science 266, 771–773 (1994).
101. Dai, P. et al. X-ray-diffraction and scanning-tunneling-microscopy studies of a liquid-crystal film adsorbed on single-crystal graphite. Phys. Rev. B Condens. Matter 47, 7401–7407 (1993).
102. Binnig, G., Garcia, N. & Rohrer, H. Conductivity sensitivity of inelastic scanning tunneling microscopy. Phys. Rev. B Condens. Matter 32, 1336–1338 (1985).
103. Marti, O. et al. Scanning probe microscopy of biological samples and other surfaces. J. Microsc. 152, 803–809 (1988).
104. Engel, A. Biological applications of scanning probe microscopes. Annu. Rev. Biophys. Biophys. Chem. 20, 79–108 (1991).
105. Lindsay, S.M. Biological scanning probe microscopy comes of age. Biophys. J. 67, 2134–2135 (1994).
106. Bustamante, J.O., Liepins, A., Prendergast, R.A., Hanover, J.A. & Oberleithner, H. Patch clamp and atomic force microscopy demonstrate TATA-binding protein (TBP) interactions with the nuclear pore complex. J. Membr. Biol. 146, 263–272 (1995).
107. Shao, Z., Yang, J. & Somlyo, A.P. Biological atomic force microscopy: from microns to nanometers and beyond. Annu. Rev. Cell Dev. Biol. 11, 241–265 (1995).
108. Drake, B. et al. Imaging crystals, polymers, and processes in water with the atomic force microscope. Science 243, 1586–1589 (1989).
109. Bustamante, C., Rivetti, C. & Keller, D.J. Scanning force microscopy under aqueous solutions. Curr. Opin. Struct. Biol. 7, 709–716 (1997).
110. Rief, M., Oesterhelt, F., Heymann, B. & Gaub, H.E. Single molecule force spectroscopy on polysaccharides by atomic force microscopy. Science 275, 1295–1297 (1997).
111. Cumpson, P.J., Zhdan, P. & Hedley, J. Calibration of AFM cantilever stiffness: a microfabricated array of reflective springs. Ultramicroscopy 100, 241–251 (2004).
112. Sarkar, A., Robertson, R.B. & Fernandez, J.M. Simultaneous atomic force microscope and fluorescence measurements of protein unfolding using a calibrated evanescent wave. Proc. Natl. Acad. Sci. USA 101, 12882–12886 (2004).
113. Rief, M., Gautel, M., Oesterhelt, F., Fernandez, J.M. & Gaub, H.E. Reversible unfolding of individual titin immunoglobulin domains by AFM. Science 276, 1109–1112 (1997).
114. Leake, M.C., Wilson, D., Gautel, M. & Simmons, R.M. The elasticity of single titin molecules using a two-bead optical tweezers assay. Biophys. J. 87, 1112–1135 (2004).
115. Kellermayer, M.S. Delayed dissociation of in vitro moving actin filaments from heavy meromyosin induced by low concentrations of Triton X-100. Biophys. Chem. 67, 199–210 (1997).
116. Smith, S.B., Cui, Y. & Bustamante, C. Overstretching B-DNA: the elastic response of individual double-stranded and single-stranded DNA molecules. Science 271, 795–799 (1996).
117. Florin, E.L., Moy, V.T. & Gaub, H.E. Adhesion forces between individual ligand-receptor pairs. Science 264, 415–417 (1994).
118. Yasuda, R., Noji, H., Kinosita, K. Jr & Yoshida, M. F1-ATPase is a highly efficient molecular motor that rotates with discrete 120 degree steps. Cell 93, 1117–1124 (1998).
119. Rief, M., Gautel, M., Schemmel, A. & Gaub, H.E. The mechanical stability of immunoglobulin and fibronectin III domains in the muscle protein titin
504 | VOL.5 NO.6 | JUNE 2008 | NATURE METHODS
REVIEW©
2008
Nat
ure
Pub
lishi
ng G
roup
ht
tp://
ww
w.n
atur
e.co
m/n
atur
emet
ho
ds
measured by atomic force microscopy. Biophys. J. 75, 3008–3014 (1998).120. Baumgartner, W. et al. Cadherin interaction probed by atomic force
microscopy. Proc. Natl. Acad. Sci. USA 97, 4005–4010 (2000).121. Marszalek, P.E. et al. Mechanical unfolding intermediates in titin modules.
Nature 402, 100–103 (1999).122. Carrion-Vazquez, M. et al. Mechanical design of proteins studied by single-
molecule force spectroscopy and protein engineering. Prog. Biophys. Mol. Biol. 74, 63–91 (2000).
123. Steward, A., Toca-Herrera, J.L. & Clarke, J. Versatile cloning system for construction of multimeric proteins for use in atomic force microscopy. Protein Sci. 11, 2179–2183 (2002).
124. Katz, E. & Willner, I. Biomolecule-functionalized carbon nanotubes: applications in nanobioelectronics. ChemPhysChem 5, 1084–1104 (2004).
125. Bustamante, C., Marko, J.F., Siggia, E.D. & Smith, S. Entropic elasticity of lambda-phage DNA. Science 265, 1599–1600 (1994).
In this work the non-linear elasticity of DNA was measured and fit with an analytical expression. These results underpin the subsequent single-molecule force spectroscopy measurements of DNA and DNA processing enzymes.
126. Fernandez, J.M. & Li, H.B. Force-clamp spectroscopy monitors the folding trajectory of a single protein. Science 303, 1674–1678 (2004).
127. Schwaiger, I., Kardinal, A., Schleicher, M., Noegel, A.A. & Rief, M. A mechanical unfolding intermediate in an actin-crosslinking protein. Nat. Struct. Mol. Biol. 11, 81–85 (2004).
128. Carrion-Vazquez, M. et al. The mechanical stability of ubiquitin is linkage dependent. Nat. Struct. Biol. 10, 738–743 (2003).
129. Dietz, H., Berkemeier, F., Bertz, M. & Rief, M. Anisotropic deformation response of single protein molecules. Proc. Natl. Acad. Sci. USA 103, 12724–12728 (2006).
130. Wright, C.F., Lindorff-Larsen, K., Randles, L.G. & Clarke, J. Parallel protein-unfolding pathways revealed and mapped. Nat. Struct. Biol. 10, 658–662 (2003).
131. Wiita, A.P. et al. Probing the chemistry of thioredoxin catalysis with force. Nature 450, 124–127 (2007).
132. Szoszkiewicz, R. et al. Dwell time analysis of a single-molecule mechanochemical reaction. Langmuir 24, 1356–1364 (2008).
133. Greene, D. et al. Single-molecule force spectroscopy reveals a stepwise unfolding of C. elegans giant protein kinase domains. Biophys. J. (in the
press) (2008).134. Brown, A.E., Litvinov, R.I., Discher, D.E. & Weisel, J.W. Forced unfolding of
coiled-coils in fibrinogen by single-molecule AFM. Biophys. J. 92, L39–L41 (2007).
135. Kellermayer, M.S. et al. Reversible mechanical unzipping of amyloid beta-fibrils. J. Biol. Chem. 280, 8464–8470 (2005).
136. Oesterhelt, F. et al. Unfolding pathways of individual bacteriorhodopsins. Science 288, 143–146 (2000).
137. Ando, T. et al. A high-speed atomic force microscope for studying biological macromolecules. Proc. Natl. Acad. Sci. USA 98, 12468–12472 (2001).
138. Wen, J.D. et al. Following translation by single ribosomes one codon at a time. Nature 452, 598–603 (2008).
139. Tanner, N.A. et al. Single-molecule studies of fork dynamics in Escherichia coli DNA replication. Nat. Struct. Mol. Biol. 15, 170–176 (2008).
140. Hamdan, S.M. et al. Dynamic DNA helicase-DNA polymerase interactions assure processive replication fork movement. Mol. Cell 27, 539–549 (2007).
141. van Oijen, A.M. Single-molecule studies of complex systems: the replisome. Mol. Biosyst. 3, 117–125 (2007).
142. Lee, J.B. et al. DNA primase acts as a molecular brake in DNA replication. Nature 439, 621–624 (2006).
143. Ishijima, A. et al. Simultaneous observation of individual ATPase and mechanical events by a single myosin molecule during interaction with actin. Cell 92, 161–171 (1998).
144. Lang, M.J., Fordyce, P.M., Engh, A.M., Neuman, K.C. & Block, S.M. Simultaneous, coincident optical trapping and single-molecule fluorescence. Nat. Methods 1, 133–139 (2004).
145. Li, P.T., Bustamante, C. & Tinoco, I. Jr. Real-time control of the energy landscape by force directs the folding of RNA molecules. Proc. Natl. Acad. Sci. USA 104, 7039–7044 (2007).
146. Chiou, P.Y., Ohta, A.T. & Wu, M.C. Massively parallel manipulation of single cells and microparticles using optical images. Nature 436, 370–372 (2005).
147. Cohen, A.E. & Moerner, W.E. Suppressing Brownian motion of individual biomolecules in solution. Proc. Natl. Acad. Sci. USA 103, 4362–4365 (2006).
148. Berg-Sorensen, K. & Flyvbjerg, H. Power spectrum analysis for optical tweezers. Rev. Sci. Instrum. 75, 594–612 (2004).
This is an invaluable reference for the treatment and fitting of Brownian noise and power spectra in single-molecule force spectroscopy measurements.
NATURE METHODS | VOL.5 NO.6 | JUNE 2008 | 505
REVIEW©
2008
Nat
ure
Pub
lishi
ng G
roup
ht
tp://
ww
w.n
atur
e.co
m/n
atur
emet
ho
ds