Embed Size (px)
Citation preview
Single Oversight
FrameworkReporting Period: Quarter 1
2021/22
Home, Community, Hospital
2
Single Oversight Framework – Q1 Overview (1)
Domain Overview & risks Lead
Quality Care (exception reports pages)
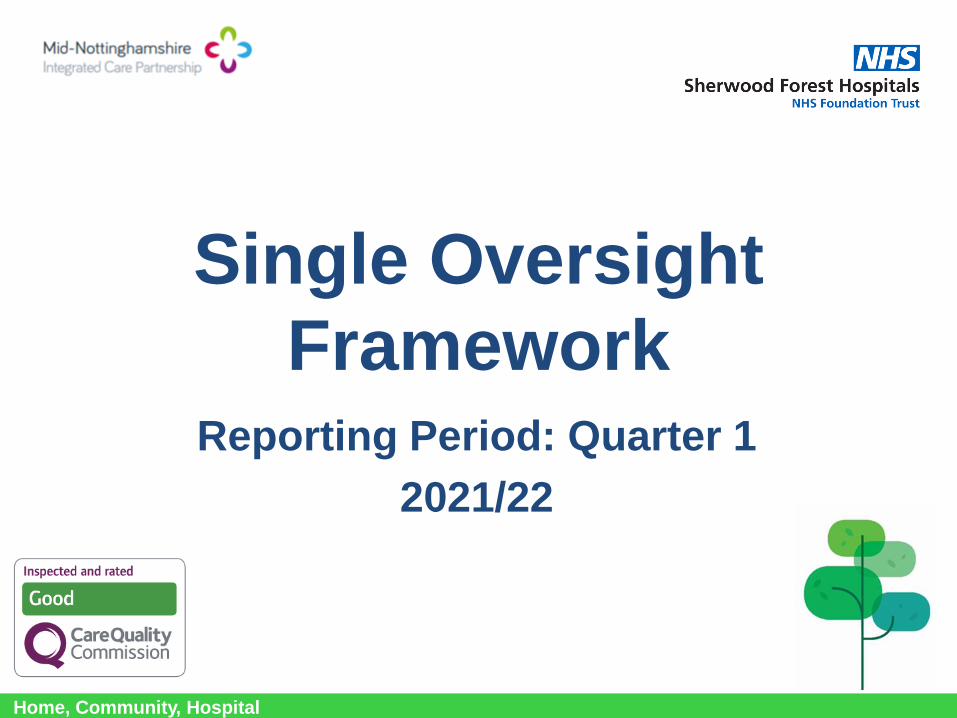
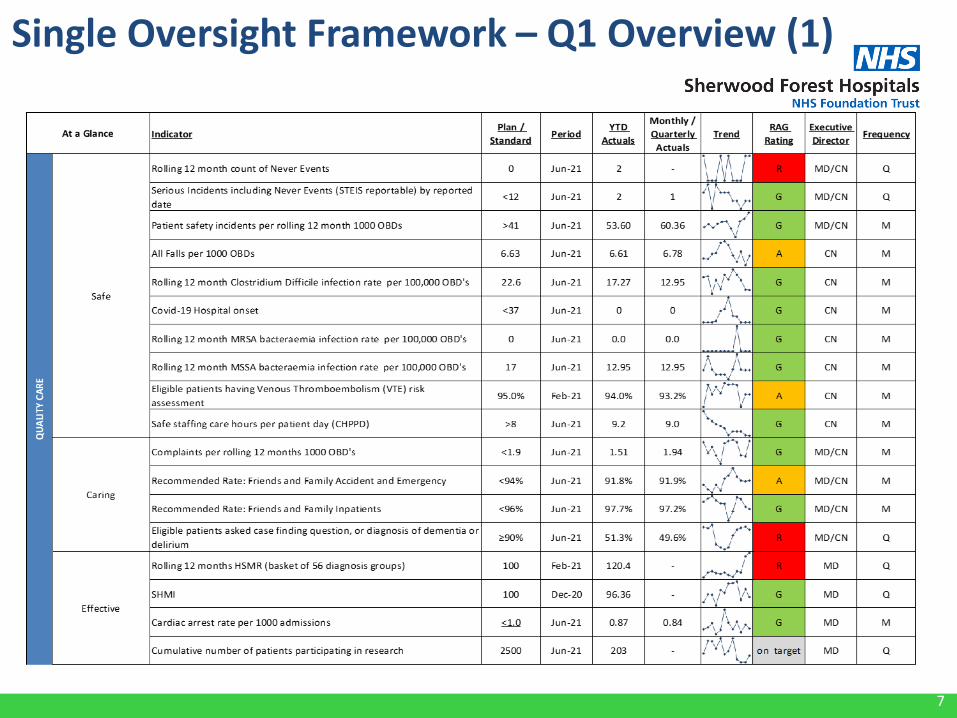
During quarter 1 the care delivered to our patients has remained safe and of a high quality. We have had no serious incidents declared that were attributed to staffing levels. Falls reduction work remains high on the agenda with a continued focus on reducing deconditioning through mobility awareness to promote patient independence. The falls team presented at the Global PJ Paralysis summit. Hospital acquired pressure ulcers remain consistently low, there have been no category 3 PUs since Nov 18 and no category 4s since August 2017 and just four category 2s reported during May. All these have been reviewed and action plans put in place to address identified issues.
There are 6 exception reports: Never events: 2 never events declared during quarter 1 which are under investion: • May 2021: Wrong site block – investigation on-going/nearing completion.• June 2021: Bone marrow trephine performed on wrong patient – investigation on-going
Falls: The rate of falls per 1000 occupied bed days (OBD) nationally has increased during the pandemic and the SFH figures are comparable but above the RCP indicative figure of 6.63. Falls prevention work continues as already described and this represents an improving picture.
VTE risk assessments: performance 93.2% (YTD 94.0%) target 95%, manual data collection recommenced. It is anticipated when EPMA is implemented data accuracy and capture issues will be resolved.
ED friends and family recommendation: performance 91.9% (YTD 91.8%) against a target of 94%. Work with IQVIA and PET is on-going to address key themes and improve the overall response rate. Our recommendation rate is significantly better than the national average.
Dementia screening: 49.6% performance against a target of 90%. Action plan in place to improve compliance.
Rolling 12 moths HSMR: HSMR: 120.4% against a target of 100. Working with Dr Foster, the observed spikes is being replicated nationally and is resultant from Covid. It can be seen to align with our Covid waves. The mortality effect is still being clarified as to whether this is disease specific, deprivation and co-morbidity associated or related to patients being seen later in their normal pathway or other currently unknown effects. When Dr Foster remove Covid activity from the analysis, our HSMR reverts to ‘as expected’ and the trend no longer climbs. Understanding this Covid impact is subject to national interrogation and Board will be updated as this becomes available. SHMI remains within the expected range.
MD, CN
3
Domain Overview & risks Lead
People & Culture(exception reports )
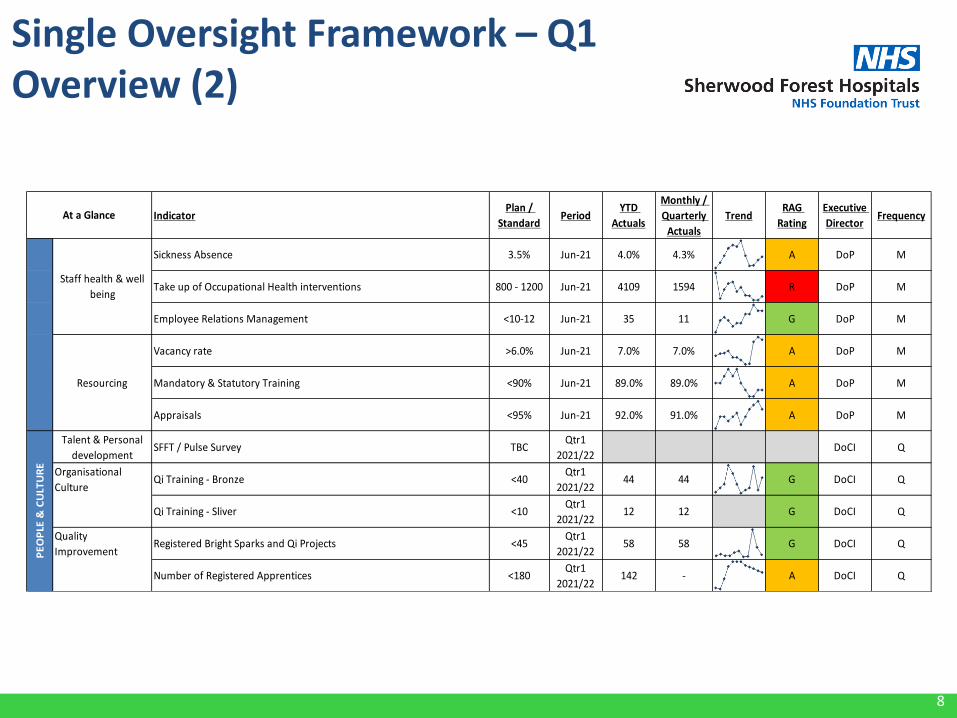
Overall, from Q1 COVID-19 has impacted on Staff Health and Wellbeing at the Trust. Sickness Absence levels have shown a increase from the lastmonth (May 21 – 4.0%) to 4.3%, and sits higher to the Trust target, this is as a result of the regional/national trend and impact of COVID19.
Additional activity is evidenced through the services provided from the Trust Occupational Health Service as expected but presents capacitychallenges.
Overall resourcing indicators for Q1 are positive with levels of vacancy's and turnover remaining low however compliance against Mandatory andStatutory Training along with Appraisals have been impacted due to Covid-19 across Q1 but shows a gradual improvement.
There has been a focus on increasing access for colleagues staff Covid-19 vaccine. This has resulted in 5016 (93%) of substantive staff, with 4855(96%) receiving their second dose. We have vaccinated 91% of BAME staff, 98% of our over 60 and 93% of CEV staff
The Continuous Improvement at SFH paper was approved and mandated by the Executive Team, with an additional request to scope ‘SCORE’ – anorganisation-wide Patient Safety Culture survey - as part of Year 1 deliverables. Year 1 actions will now be reported via the Culture andImprovement Cabinet .
Improvement training numbers for both bronze and silver level were achieved this quarter. ICS-wide silver level QI training re-started in July.
The ‘Bright Sparks’ initiative for colleagues to share improvement ideas has received over 45 ideas in Q1, many of which have been taken forwardto fruition, for example, a monthly SFH ‘Book Club’. The ‘Bright Sparks QI Hub’ has also been launched in the Library at KMH; a creative space whereteams can meet to discuss ideas and access QI advice.
The Corporate Matron for User Involvement and the QI team met with Healthwatch North Nottinghamshire in July to agree opportunities tooptimise citizen engagement.
System level work to agree a QI approach with ICS partners continues to take shape and is a key objective for the system transformation group.
Over 90 ‘Wellbeing Roadshows’ have been held directly at service/ward level, with positive feedback received. The demand for this service hasbeen consistent since November 2020, with new requests daily.
A ‘Coping with Bereavement’ webinar hosted by the Clinical Psychology team was held on 11th June with over 40 colleagues joining the livewebinar, and 91 colleagues accessing the recording, post event.
DOP, DCI
Single Oversight Framework – Q1 Overview (2)
4
Domain Overview & risks Lead
People & Culture(exception reports )
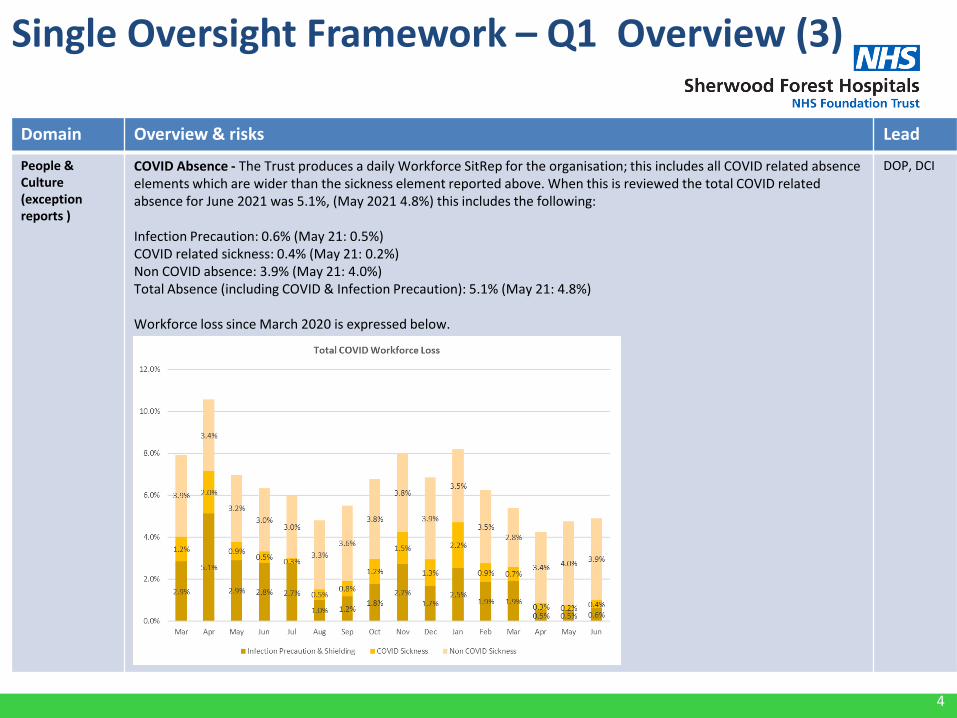
COVID Absence - The Trust produces a daily Workforce SitRep for the organisation; this includes all COVID related absence elements which are wider than the sickness element reported above. When this is reviewed the total COVID related absence for June 2021 was 5.1%, (May 2021 4.8%) this includes the following:
Infection Precaution: 0.6% (May 21: 0.5%)COVID related sickness: 0.4% (May 21: 0.2%)Non COVID absence: 3.9% (May 21: 4.0%)Total Absence (including COVID & Infection Precaution): 5.1% (May 21: 4.8%)
Workforce loss since March 2020 is expressed below.
DOP, DCI
Single Oversight Framework – Q1 Overview (3)
5
Domain Overview & risks Lead
Timely care (exception reports pages)
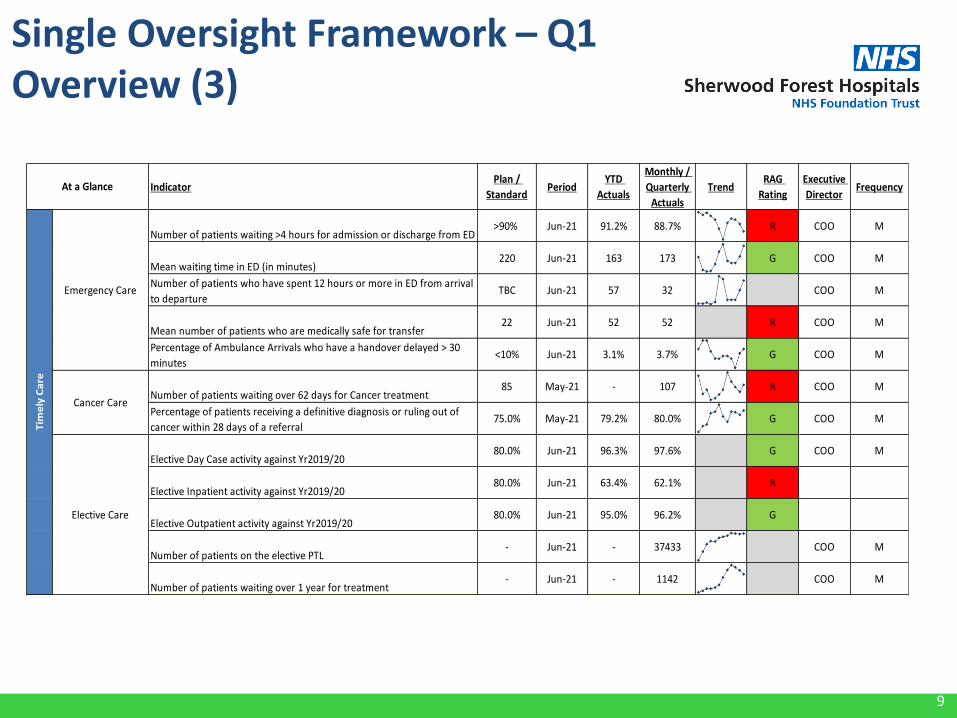
Emergency access despite seeing a deterioration in the levels of wait, access remained comparatively positive, ranked 12th in theNHS. Demand continues to be high in June and has been even higher in July. PC24 felt a lot of this increasing demand as well.The number of MSFT patients remains consistently above the ICS agreed threshold, mainly for home care (pathway 1) packages.To manage this additional beds have been opened as well as additional staffing for ED, notably in the evenings, although fillrates are variable.
For Cancer services the number of patients waiting more than 62 days for treatment at the end of June 2021 is behind plan with107 patients waiting against a trajectory of 85. An exception report detailing the root cause and actions being taken is included.For the Faster diagnosis standard (FDS) national data remains unpublished. Delivery for the Trust against the 75% standard hasbeen relatively consistent with May at 82.7%. 62 day performance for May was 70.2% giving a ranking of 92nd/128 (rank 98th inMarch). System performance for May was 71.3%. Average waits for first definitive treatment in May have reduced to 54 days(55 in March 21 / 50 days in March 2020). The number of patients waiting 104+ day waits at the end of May was 22, this is thelowest volume since November 2020.
For Elective Care, despite the pressures from emergency care and Wave 3 of Covid starting in July elective activity has continuedso far and in line with clinical priority. at the end of June the waiting list remains stable at 37,400. The number of patientswaiting over 52 weeks has reduced by 29% since March 1,142 (March 1,618). The published national median wait for RTTIncomplete pathways at the end of May was 11 weeks (92nd percentile 45 weeks); for the Trust it was 11 weeks and 42 weeksand for June it is 10 and 42 weeks. Pre Pandemic the median wait for the Trust was 7 weeks and 92nd percentile 22 weeks. ForQuarter 1 2021/22 the Trust has delivered 95% of 19/20 elective activity levels and 112% of the activity plan. For June 2021(working day adjusted) it is 96% when compared to June 2019. An exception report for elective inpatient activity is included.Progress has been made against key elective accelerator schemes including securing mobile endoscopy and CT capacity,weekend operating and outpatient clinics plus validation of the waiting list. By the end of July the schemes are forecast to haveseen and/or treated in excess of an additional 8,500 patients. In response to the letter sent to over 17,000 patients giving anindication of the average wait time by specialty. Approximately 2% of patients have responded with the vast majority requiringreassurance only. 90 patients have been forwarded for clinical review of which, half reported a deterioration in their conditionand the remaining half discharged.
Diagnostics continue to perform relatively well, the significant contributor to the >6 week backlog is ECHO equating to over 50%of the breaches. Demand for CT has been increasing, with the service under significant pressure from both the emergency andelective pathways. Both modalities have secured additional insourcing capacity as part of the accelerator programme.
COO
Single Oversight Framework – Q1 Overview (4)
6
Domain Overview & risks Lead
Best Value care (exception reports pages)
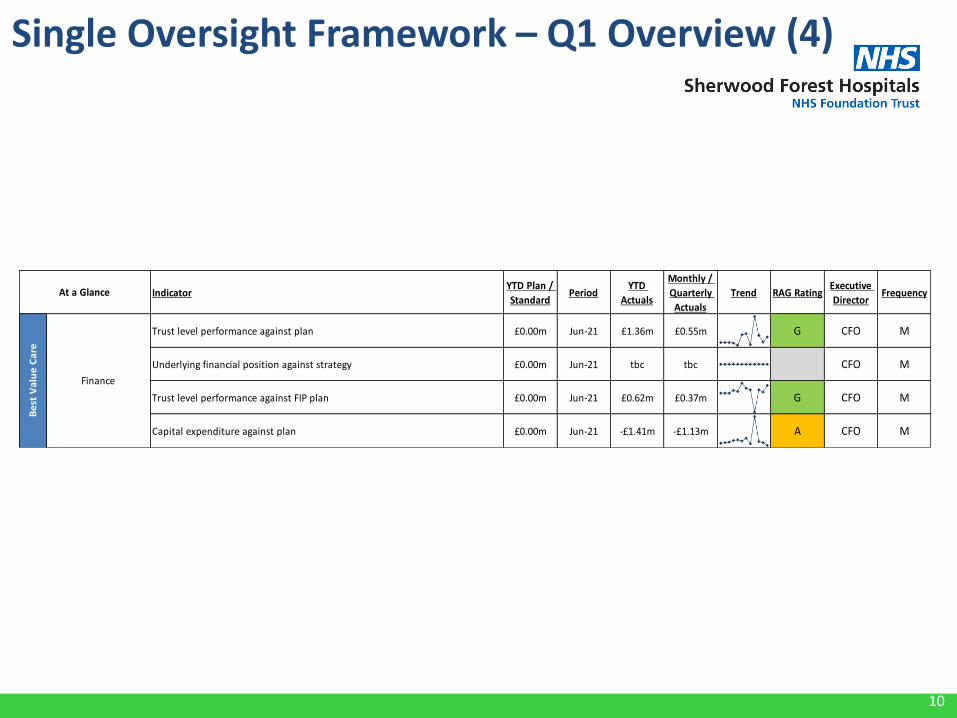
For Q1 2021/22 the Trust has reported a deficit of £0.05m, which is £1.36m better than the H1 Financial plan.
Q1 2021/22 expenditure totalled £110.0m, which includes:- Covid-19 expenditure totalling £2.3m- Covid-19 vaccination programme costs of £7.6m, with offsetting income of £7.6m assumed
Q1 income includes £3.4m Elective Recovery Fund (ERF) as per plan. Confirmation of actual income value is to confirmed.
The capital programme is behind plan by £1.4m (total spend in Q1 is £1.6m) due to ED/Resus and Mansfield Community Hospitalschemes.
Cash held at the end of the quarter is £6m. This is £7m below plan due to timing of receipt of Vaccination and ERF income.
CFO
Single Oversight Framework – Q1 Overview (5)
7
Single Oversight Framework – Q1 Overview (1)
8
Single Oversight Framework – Q1Overview (2)
IndicatorPlan /
StandardPeriod
YTD
Actuals
Monthly /
Quarterly
Actuals
TrendRAG
Rating
Executive
DirectorFrequency
Sickness Absence 3.5% Jun-21 4.0% 4.3% A DoP M
Take up of Occupational Health interventions 800 - 1200 Jun-21 4109 1594 R DoP M
Employee Relations Management <10-12 Jun-21 35 11 G DoP M
Vacancy rate >6.0% Jun-21 7.0% 7.0% A DoP M
Mandatory & Statutory Training <90% Jun-21 89.0% 89.0% A DoP M
Appraisals <95% Jun-21 92.0% 91.0% A DoP M
Talent & Personal
developmentSFFT / Pulse Survey TBC
Qtr1
2021/22DoCI Q
Organisational
CultureQi Training - Bronze <40
Qtr1
2021/2244 44 G DoCI Q
Qi Training - Sliver <10Qtr1
2021/2212 12 G DoCI Q
Quality
ImprovementRegistered Bright Sparks and Qi Projects <45
Qtr1
2021/2258 58 G DoCI Q
Number of Registered Apprentices <180Qtr1
2021/22142 - A DoCI Q
At a Glance
Staff health & well
being
Resourcing
PE
OP
LE &
CU
LTU
RE
9
Single Oversight Framework – Q1Overview (3)
IndicatorPlan /
StandardPeriod
YTD
Actuals
Monthly /
Quarterly
Actuals
TrendRAG
Rating
Executive
DirectorFrequency
Number of patients waiting >4 hours for admission or discharge from ED >90% Jun-21 91.2% 88.7% R COO M
Mean waiting time in ED (in minutes)220 Jun-21 163 173 G COO M
Number of patients who have spent 12 hours or more in ED from arrival
to departureTBC Jun-21 57 32 COO M
Mean number of patients who are medically safe for transfer22 Jun-21 52 52 R COO M
Percentage of Ambulance Arrivals who have a handover delayed > 30
minutes<10% Jun-21 3.1% 3.7% G COO M
Number of patients waiting over 62 days for Cancer treatment 85 May-21 - 107 R COO M
Percentage of patients receiving a definitive diagnosis or ruling out of
cancer within 28 days of a referral75.0% May-21 79.2% 80.0% G COO M
Elective Day Case activity against Yr2019/2080.0% Jun-21 96.3% 97.6% G COO M
Elective Inpatient activity against Yr2019/2080.0% Jun-21 63.4% 62.1% R
Elective Outpatient activity against Yr2019/2080.0% Jun-21 95.0% 96.2% G
Number of patients on the elective PTL - Jun-21 - 37433 COO M
Number of patients waiting over 1 year for treatment- Jun-21 - 1142 COO M
Tim
ely
Ca
re
At a Glance
Elective Care
Cancer Care
Emergency Care
10
Single Oversight Framework – Q1 Overview (4)
IndicatorYTD Plan /
StandardPeriod
YTD
Actuals
Monthly /
Quarterly
Actuals
Trend RAG RatingExecutive
DirectorFrequency
Trust level performance against plan £0.00m Jun-21 £1.36m £0.55m G CFO M
Underlying financial position against strategy £0.00m Jun-21 tbc tbc CFO M
Trust level performance against FIP plan £0.00m Jun-21 £0.62m £0.37m G CFO M
Capital expenditure against plan £0.00m Jun-21 -£1.41m -£1.13m A CFO M
Be
st V
alu
e C
are
Finance
At a Glance
11
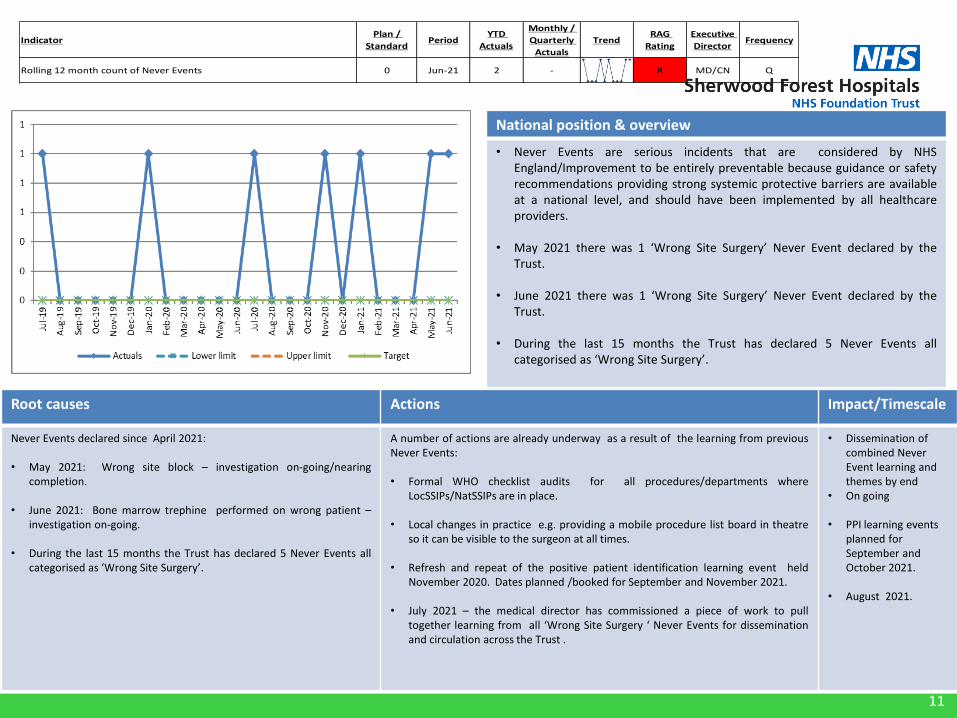
National position & overview
• Never Events are serious incidents that are considered by NHSEngland/Improvement to be entirely preventable because guidance or safetyrecommendations providing strong systemic protective barriers are availableat a national level, and should have been implemented by all healthcareproviders.
• May 2021 there was 1 ‘Wrong Site Surgery’ Never Event declared by theTrust.
• June 2021 there was 1 ‘Wrong Site Surgery’ Never Event declared by theTrust.
• During the last 15 months the Trust has declared 5 Never Events allcategorised as ‘Wrong Site Surgery’.
Root causes Actions Impact/Timescale
Never Events declared since April 2021:
• May 2021: Wrong site block – investigation on-going/nearingcompletion.
• June 2021: Bone marrow trephine performed on wrong patient –investigation on-going.
• During the last 15 months the Trust has declared 5 Never Events allcategorised as ‘Wrong Site Surgery’.
A number of actions are already underway as a result of the learning from previousNever Events:
• Formal WHO checklist audits for all procedures/departments whereLocSSIPs/NatSSIPs are in place.
• Local changes in practice e.g. providing a mobile procedure list board in theatreso it can be visible to the surgeon at all times.
• Refresh and repeat of the positive patient identification learning event heldNovember 2020. Dates planned /booked for September and November 2021.
• July 2021 – the medical director has commissioned a piece of work to pulltogether learning from all ‘Wrong Site Surgery ‘ Never Events for disseminationand circulation across the Trust .
• Dissemination of combined Never Event learning and themes by end
• On going
• PPI learning events planned for September and October 2021.
• August 2021.
IndicatorPlan /
StandardPeriod
YTD
Actuals
Monthly /
Quarterly
Actuals
TrendRAG
Rating
Executive
DirectorFrequency
Rolling 12 month count of Never Events 0 Jun-21 2 - R MD/CN Q
12
National position & overview
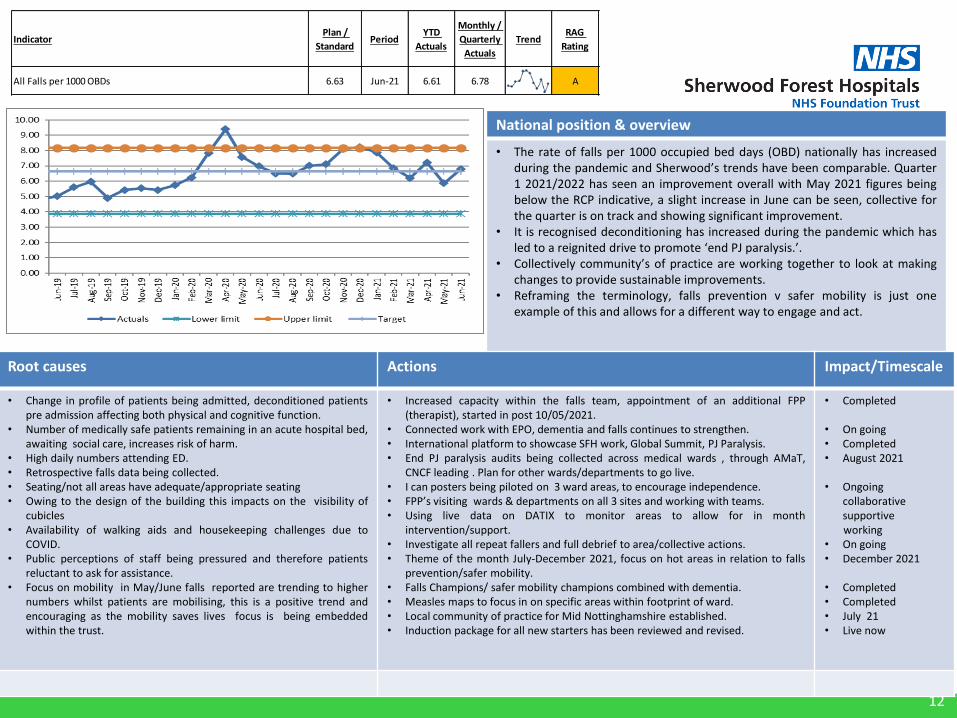
• The rate of falls per 1000 occupied bed days (OBD) nationally has increasedduring the pandemic and Sherwood’s trends have been comparable. Quarter1 2021/2022 has seen an improvement overall with May 2021 figures beingbelow the RCP indicative, a slight increase in June can be seen, collective forthe quarter is on track and showing significant improvement.
• It is recognised deconditioning has increased during the pandemic which hasled to a reignited drive to promote ‘end PJ paralysis.’.
• Collectively community’s of practice are working together to look at makingchanges to provide sustainable improvements.
• Reframing the terminology, falls prevention v safer mobility is just oneexample of this and allows for a different way to engage and act.
Root causes Actions Impact/Timescale
• Change in profile of patients being admitted, deconditioned patientspre admission affecting both physical and cognitive function.
• Number of medically safe patients remaining in an acute hospital bed,awaiting social care, increases risk of harm.
• High daily numbers attending ED.• Retrospective falls data being collected.• Seating/not all areas have adequate/appropriate seating• Owing to the design of the building this impacts on the visibility of
cubicles• Availability of walking aids and housekeeping challenges due to
COVID.• Public perceptions of staff being pressured and therefore patients
reluctant to ask for assistance.• Focus on mobility in May/June falls reported are trending to higher
numbers whilst patients are mobilising, this is a positive trend andencouraging as the mobility saves lives focus is being embeddedwithin the trust.
• Increased capacity within the falls team, appointment of an additional FPP(therapist), started in post 10/05/2021.
• Connected work with EPO, dementia and falls continues to strengthen.• International platform to showcase SFH work, Global Summit, PJ Paralysis.• End PJ paralysis audits being collected across medical wards , through AMaT,
CNCF leading . Plan for other wards/departments to go live.• I can posters being piloted on 3 ward areas, to encourage independence.• FPP’s visiting wards & departments on all 3 sites and working with teams.• Using live data on DATIX to monitor areas to allow for in month
intervention/support.• Investigate all repeat fallers and full debrief to area/collective actions.• Theme of the month July-December 2021, focus on hot areas in relation to falls
prevention/safer mobility.• Falls Champions/ safer mobility champions combined with dementia.• Measles maps to focus in on specific areas within footprint of ward.• Local community of practice for Mid Nottinghamshire established.• Induction package for all new starters has been reviewed and revised.
• Completed
• On going• Completed• August 2021
• Ongoingcollaborativesupportiveworking
• On going• December 2021
• Completed• Completed• July 21• Live now
0.00
1.00
2.00
3.00
4.00
5.00
6.00
7.00
8.00
9.00
10.00
Jul-
19
Au
g-1
9
Sep
-19
Oct
-19
No
v-1
9
Dec
-19
Jan
-20
Feb
-20
Mar
-20
Ap
r-2
0
May
-20
Jun
-20
Jul-
20
Au
g-2
0
Sep
-20
Oct
-20
No
v-2
0
Dec
-20
Jan
-21
Feb
-21
Mar
-21
Ap
r-2
1
May
-21
Jun
-21
Actuals Lower limit Upper limit Target
IndicatorPlan /
StandardPeriod
YTD
Actuals
Monthly /
Quarterly
Actuals
TrendRAG
Rating
Executive
DirectorFrequency
All Falls per 1000 OBDs 6.63 Jun-21 6.61 6.78 A CN M
13
National position & overview
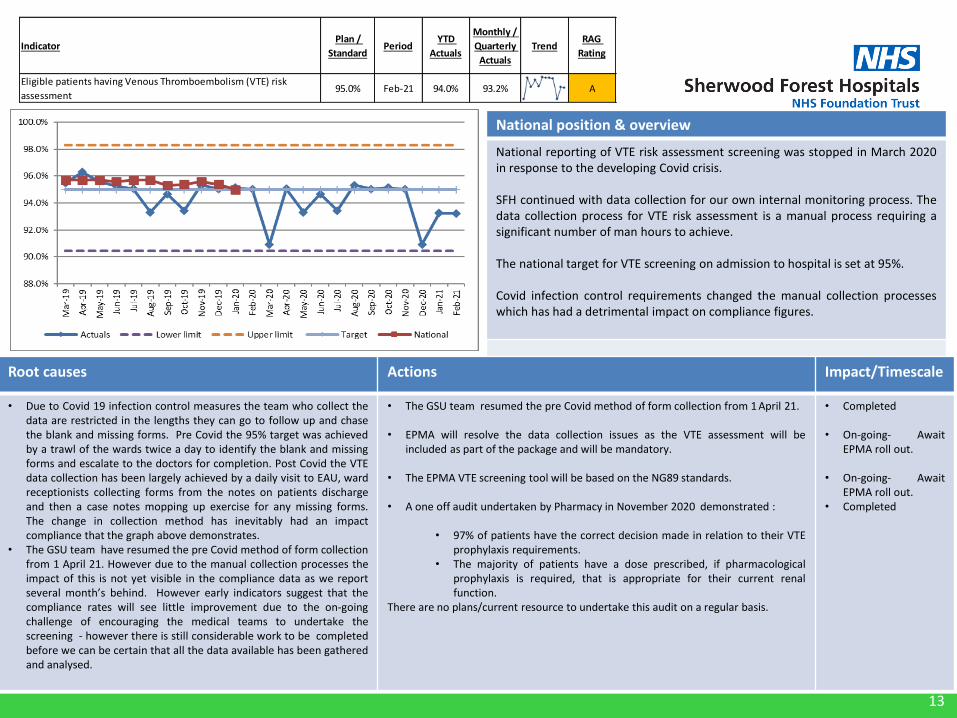
National reporting of VTE risk assessment screening was stopped in March 2020in response to the developing Covid crisis.
SFH continued with data collection for our own internal monitoring process. Thedata collection process for VTE risk assessment is a manual process requiring asignificant number of man hours to achieve.
The national target for VTE screening on admission to hospital is set at 95%.
Covid infection control requirements changed the manual collection processeswhich has had a detrimental impact on compliance figures.
Root causes Actions Impact/Timescale
• Due to Covid 19 infection control measures the team who collect thedata are restricted in the lengths they can go to follow up and chasethe blank and missing forms. Pre Covid the 95% target was achievedby a trawl of the wards twice a day to identify the blank and missingforms and escalate to the doctors for completion. Post Covid the VTEdata collection has been largely achieved by a daily visit to EAU, wardreceptionists collecting forms from the notes on patients dischargeand then a case notes mopping up exercise for any missing forms.The change in collection method has inevitably had an impactcompliance that the graph above demonstrates.
• The GSU team have resumed the pre Covid method of form collectionfrom 1 April 21. However due to the manual collection processes theimpact of this is not yet visible in the compliance data as we reportseveral month’s behind. However early indicators suggest that thecompliance rates will see little improvement due to the on-goingchallenge of encouraging the medical teams to undertake thescreening - however there is still considerable work to be completedbefore we can be certain that all the data available has been gatheredand analysed.
• The GSU team resumed the pre Covid method of form collection from 1 April 21.
• EPMA will resolve the data collection issues as the VTE assessment will beincluded as part of the package and will be mandatory.
• The EPMA VTE screening tool will be based on the NG89 standards.
• A one off audit undertaken by Pharmacy in November 2020 demonstrated :
• 97% of patients have the correct decision made in relation to their VTEprophylaxis requirements.
• The majority of patients have a dose prescribed, if pharmacologicalprophylaxis is required, that is appropriate for their current renalfunction.
There are no plans/current resource to undertake this audit on a regular basis.
• Completed
• On-going- AwaitEPMA roll out.
• On-going- AwaitEPMA roll out.
• Completed
IndicatorPlan /
StandardPeriod
YTD
Actuals
Monthly /
Quarterly
Actuals
TrendRAG
Rating
Eligible patients having Venous Thromboembolism (VTE) risk
assessment95.0% Feb-21 94.0% 93.2% A
14
National position & overview
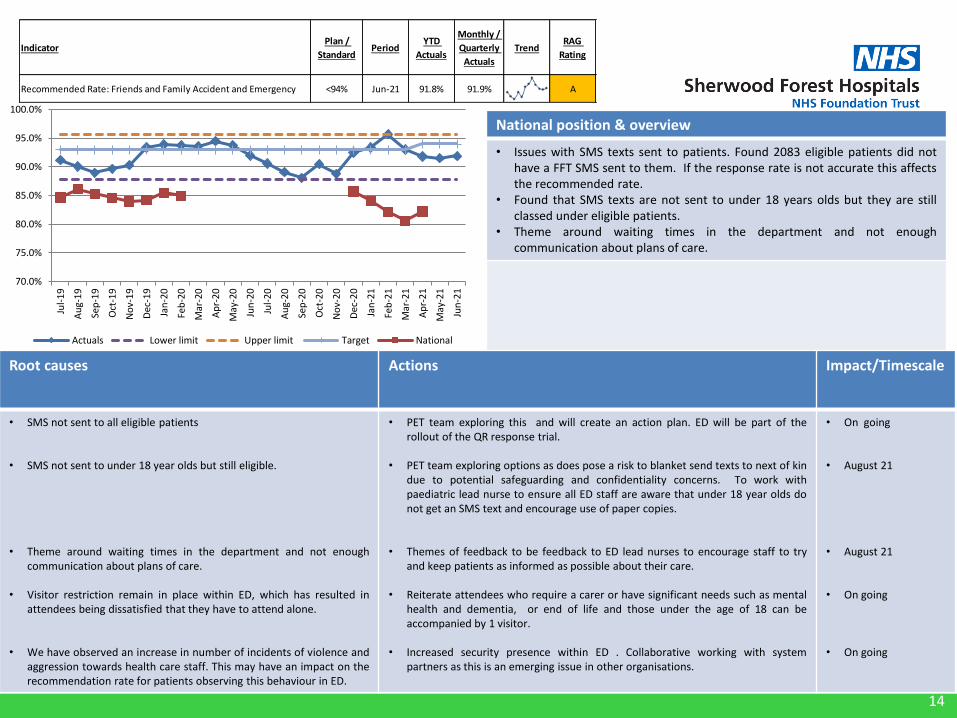
• Issues with SMS texts sent to patients. Found 2083 eligible patients did nothave a FFT SMS sent to them. If the response rate is not accurate this affectsthe recommended rate.
• Found that SMS texts are not sent to under 18 years olds but they are stillclassed under eligible patients.
• Theme around waiting times in the department and not enoughcommunication about plans of care.
Root causes Actions Impact/Timescale
• SMS not sent to all eligible patients
• SMS not sent to under 18 year olds but still eligible.
• Theme around waiting times in the department and not enoughcommunication about plans of care.
• Visitor restriction remain in place within ED, which has resulted inattendees being dissatisfied that they have to attend alone.
• We have observed an increase in number of incidents of violence andaggression towards health care staff. This may have an impact on therecommendation rate for patients observing this behaviour in ED.
• PET team exploring this and will create an action plan. ED will be part of therollout of the QR response trial.
• PET team exploring options as does pose a risk to blanket send texts to next of kindue to potential safeguarding and confidentiality concerns. To work withpaediatric lead nurse to ensure all ED staff are aware that under 18 year olds donot get an SMS text and encourage use of paper copies.
• Themes of feedback to be feedback to ED lead nurses to encourage staff to tryand keep patients as informed as possible about their care.
• Reiterate attendees who require a carer or have significant needs such as mentalhealth and dementia, or end of life and those under the age of 18 can beaccompanied by 1 visitor.
• Increased security presence within ED . Collaborative working with systempartners as this is an emerging issue in other organisations.
• On going
• August 21
• August 21
• On going
• On going
70.0%
75.0%
80.0%
85.0%
90.0%
95.0%
100.0%
Jul-
19
Au
g-1
9
Sep
-19
Oct
-19
No
v-1
9
Dec
-19
Jan
-20
Feb
-20
Mar
-20
Ap
r-2
0
May
-20
Jun
-20
Jul-
20
Au
g-2
0
Sep
-20
Oct
-20
No
v-2
0
Dec
-20
Jan
-21
Feb
-21
Mar
-21
Ap
r-2
1
May
-21
Jun
-21
Actuals Lower limit Upper limit Target National
IndicatorPlan /
StandardPeriod
YTD
Actuals
Monthly /
Quarterly
Actuals
TrendRAG
Rating
Recommended Rate: Friends and Family Accident and Emergency <94% Jun-21 91.8% 91.9% A
15
National position & overview
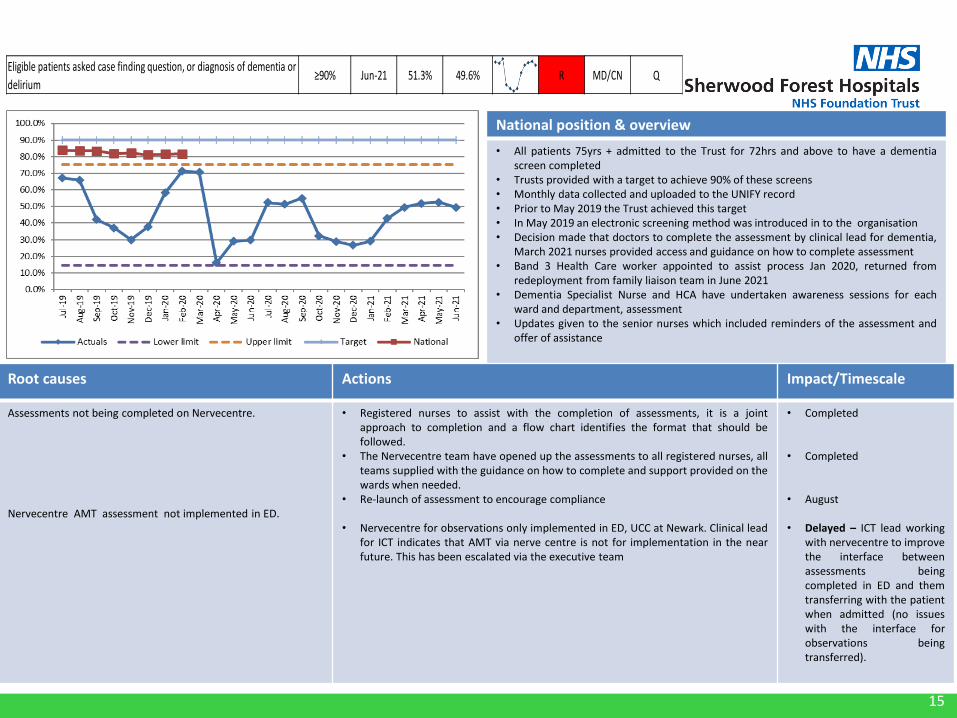
• All patients 75yrs + admitted to the Trust for 72hrs and above to have a dementiascreen completed
• Trusts provided with a target to achieve 90% of these screens• Monthly data collected and uploaded to the UNIFY record• Prior to May 2019 the Trust achieved this target• In May 2019 an electronic screening method was introduced in to the organisation• Decision made that doctors to complete the assessment by clinical lead for dementia,
March 2021 nurses provided access and guidance on how to complete assessment• Band 3 Health Care worker appointed to assist process Jan 2020, returned from
redeployment from family liaison team in June 2021• Dementia Specialist Nurse and HCA have undertaken awareness sessions for each
ward and department, assessment• Updates given to the senior nurses which included reminders of the assessment and
offer of assistance
Root causes Actions Impact/Timescale
Assessments not being completed on Nervecentre.
Nervecentre AMT assessment not implemented in ED.
• Registered nurses to assist with the completion of assessments, it is a jointapproach to completion and a flow chart identifies the format that should befollowed.
• The Nervecentre team have opened up the assessments to all registered nurses, allteams supplied with the guidance on how to complete and support provided on thewards when needed.
• Re-launch of assessment to encourage compliance
• Nervecentre for observations only implemented in ED, UCC at Newark. Clinical leadfor ICT indicates that AMT via nerve centre is not for implementation in the nearfuture. This has been escalated via the executive team
• Completed
• Completed
• August
• Delayed – ICT lead workingwith nervecentre to improvethe interface betweenassessments beingcompleted in ED and themtransferring with the patientwhen admitted (no issueswith the interface forobservations beingtransferred).
Eligible patients asked case finding question, or diagnosis of dementia or
delirium≥90% Jun-21 51.3% 49.6% R MD/CN Q

16
National position & overview
• Secondary Covid activity is having a adverse affect on HSMR data. The spike inthe graph aligns with the 1st and 2nd waves of covid and subsequent spikes inobserved volumes.
• Dr Foster have reviewed the HSMR data and provided the detail below.• The SHMI remains within the expected range.
Root causes Actions Impact/Timescale
• The observed spikes is thought to be as a result ofcovid, and again align with the covid waves, along withseeing patients arriving later in their pathway. Theexpected has declined due to the decline in hospitalactivity, simultaneously these two effects haveinflated the HSMR
• Review data for HSMR rolling 12 months fromthe Dr Foster tools for the same period and aremoving secondary covid from the HSMR data
Outcome• There is quite a difference when removing secondary covid activity,
the ‘banding’ changes to as expected for the last 6 months of data andthe trend no longer climbs
Rolling 12 months HSMR (basket of 56 diagnosis groups) 100 Feb-21 120.4 - R MD Q

17
National position & overview
Local intelligence suggests the Trust is not an anomaly due to national increase in the requirements for Occupational Health services and support.
The Trust benchmarks favourably against a national sickness figure.
Root causes Actions Impact/Timescale
The key cause of above trajectory performance on the take up ofOccupational Health interventions is mainly associated with the enhancednational increase with the pandemic.
This was additional achieved through:
• New ways of working (Telephone /virtual consultations)• Paper screening for work health assessments instead of face to face• Smart working• All substantive OH staff working overtime• Bank admin support
This elevated level is expected tocontinue with additional expectationsaround IPC and COVID.
Pre COVID-19 pandemic, theOccupational Health service hadalready experienced a substantialincrease in utilisation of the servicewith a 51% increase in overall activityseen over the last 5 years
Take up of Occupational Health interventions 800 - 1200 Jun-21 4109 1594 R DoP M
18
National position & overview
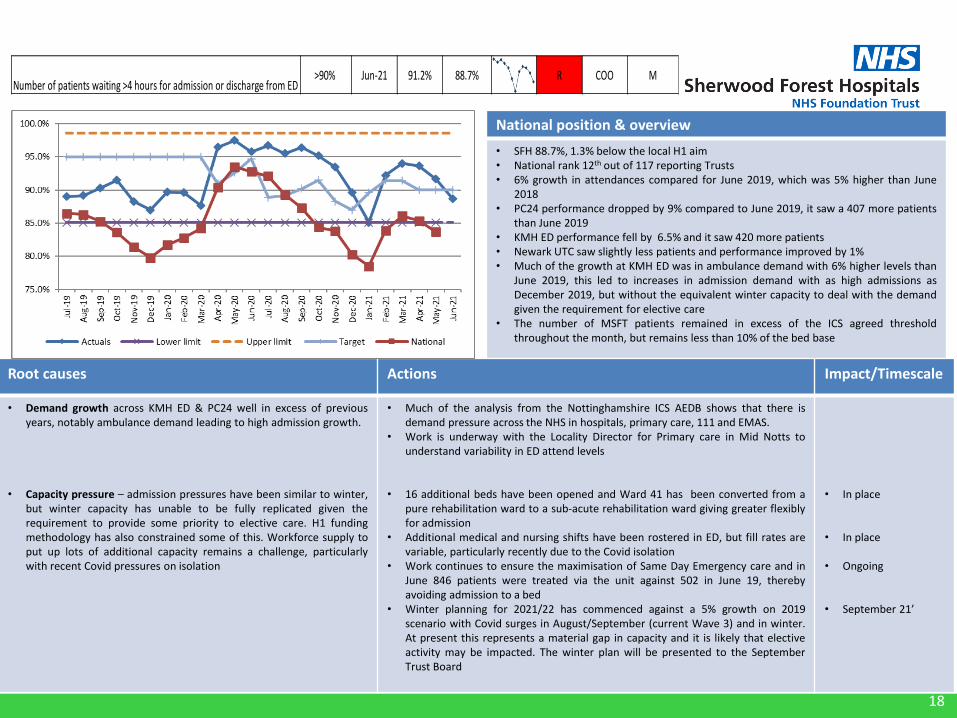
• SFH 88.7%, 1.3% below the local H1 aim• National rank 12th out of 117 reporting Trusts• 6% growth in attendances compared for June 2019, which was 5% higher than June
2018• PC24 performance dropped by 9% compared to June 2019, it saw a 407 more patients
than June 2019• KMH ED performance fell by 6.5% and it saw 420 more patients• Newark UTC saw slightly less patients and performance improved by 1%• Much of the growth at KMH ED was in ambulance demand with 6% higher levels than
June 2019, this led to increases in admission demand with as high admissions asDecember 2019, but without the equivalent winter capacity to deal with the demandgiven the requirement for elective care
• The number of MSFT patients remained in excess of the ICS agreed thresholdthroughout the month, but remains less than 10% of the bed base
Root causes Actions Impact/Timescale
• Demand growth across KMH ED & PC24 well in excess of previousyears, notably ambulance demand leading to high admission growth.
• Capacity pressure – admission pressures have been similar to winter,but winter capacity has unable to be fully replicated given therequirement to provide some priority to elective care. H1 fundingmethodology has also constrained some of this. Workforce supply toput up lots of additional capacity remains a challenge, particularlywith recent Covid pressures on isolation
• Much of the analysis from the Nottinghamshire ICS AEDB shows that there isdemand pressure across the NHS in hospitals, primary care, 111 and EMAS.
• Work is underway with the Locality Director for Primary care in Mid Notts tounderstand variability in ED attend levels
• 16 additional beds have been opened and Ward 41 has been converted from apure rehabilitation ward to a sub-acute rehabilitation ward giving greater flexiblyfor admission
• Additional medical and nursing shifts have been rostered in ED, but fill rates arevariable, particularly recently due to the Covid isolation
• Work continues to ensure the maximisation of Same Day Emergency care and inJune 846 patients were treated via the unit against 502 in June 19, therebyavoiding admission to a bed
• Winter planning for 2021/22 has commenced against a 5% growth on 2019scenario with Covid surges in August/September (current Wave 3) and in winter.At present this represents a material gap in capacity and it is likely that electiveactivity may be impacted. The winter plan will be presented to the SeptemberTrust Board
• In place
• In place
• Ongoing
• September 21’
Number of patients waiting >4 hours for admission or discharge from ED >90% Jun-21 91.2% 88.7% R COO M

19
National position & overview
• The local position has improved slightly in June although still not at the agreedthreshold of 22 ( red line)
• The improvement reflects an additional therapist added to the dischargescreening team and CCG spot purchase of care home beds
• Additional bed capacity remains open at Ashmere care homes (26) and 16beds at SFH to offset the impact
• There have been up to 25 delayed patients in an acute bed impacting uponthe non elective patient pathway
Root causes Actions Impact/Timescale
• Pathway 1 demand and the available capacity to meet the variation indemand. This reflects the lack of available care agencies ( on theframework) to meet the demand and in particular for double up careQDS and TDS. Recruitment to the care agency and social sector isproving difficult with posts unfilled. Covid isolation is exacerbatingthis further.
• Internal process issues contributing to referrals made into D2A sameday or outside of the 48hr window. This gives social care less time torespond to the discharge.
• Process improvements for early pre noon discharge- golden patients, transportand medication preparation continue
• Internal work to improve the information available on Nerve Centre to allow atimely referral (within48hrs ) to the D2A hub.
• Focus on improving same day discharge once MSFT• Re instated > 14 >21 weekly review lead by HOO• Learning from ECIST event and continuing to take 10-15 discharges home first per
week• Planned transformational change to support the national discharge policy
recommendations- integrated workforce in discussion with staff side• Multiple partner discussions to support both process and resource within Mid
notts• Social care recruiting 16 more are workers through Tuvida (EDASS)• Escalated actions required from system in support of covid and managing
demand
Escalation• Escalated delays and issues through CCG and also via the Mid Notts ICP
Discharge Group, CEO group• Covid impact and preparedness to support delayed discharges• Exacerbation of P1 capacity availability due to covid impact
August 2021-result
August 2021-resultJuly 2021-in place90% same day discharge
August 2021-completeplan
On going actionSeptember 21On going action
Mean number of patients who are medically safe for transfer22 Jun-21 52 52 R COO M

20
National position & overview
• In the 2021/22 operational planning guidance, NHS England (NHSE) set out a key objective to return the number of people waiting for longer than 62 days (“the backlog”) to the level observed in February 20 (45 patients for SFH). Latest national data available ranks SFH as 54th / 128 Trusts for size of backlog.
• In June, the paper to Board outlined the trajectory to deliver the February 2020 position. At time of writing there were 5 key risks to delivery:
1. Demand2. Diagnostic Capacity3. Lower GI4. Dependency on Tertiary Provider5. Residual Impact of COVID
• Risks 1 and 2 are the main cause for the adverse position to trajectory. • The latest wait data shows average waits at 54 days for May 21 against 46 days for
May 20, with 85th percentile waits at 82 days and 86 days respectively
Root causes Actions Impact/Timescale
• Referrals in March (1,600), April (1400) and May (1360) against a 19/20 average of 1,250. Increases mainly in Breast, Lower GI and Skin.
• Impact of increased referrals on diagnostic capacity, notably on CT colon with waits reaching up to 42 days; compounded by a high volume of DNA/patient cancellations. Lower GI are most effected by these waits with over two thirds of the current backlog having required this procedure.
• Other diagnostic delays including Lung (EGFR) and PET scan provided by the tertiary centre.
• LGI virtual results clinics have been increased to daily to supportimproved FDS turnaround times. New CSW triage and support rolenow in place.
• Specialist nurses to follow up their appointment with the patientwith a CT Colon leaflet, highlighting key information and theimportance of attending.
• Radiology has shadowed another centre who run an increased list (9patients) by utilising an imaging assistant to support cannulationand preparation of patients. The service is now exploring recruitingthis type of role.
• Radiology is trialling reduced prep which would support betterutilisation of short notice cancellations
• LGI virtual review clinics now in place (July). CSW triage to be implemented in August.
• Letter drafted and will commence by August.
• Radiology are now finalising plans as a number of supporting actions have been identified, including recruitment.
• Reduced prep trial commenced mid-July.
Number of patients waiting over 62 days for Cancer treatment 85 May-21 - 110 R COO M
21
National position & overview
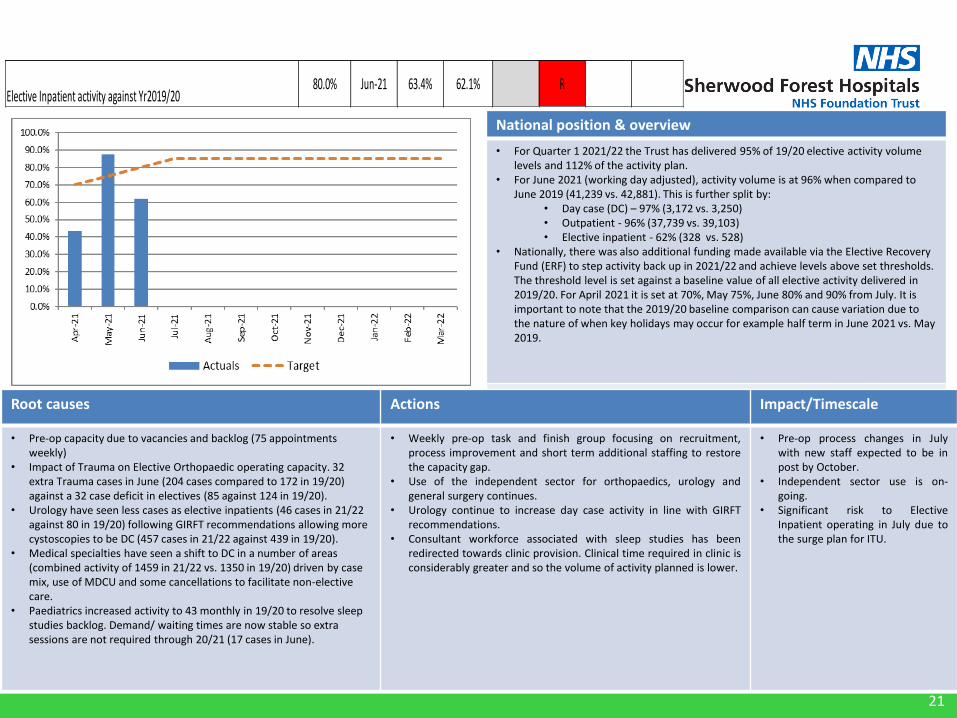
• For Quarter 1 2021/22 the Trust has delivered 95% of 19/20 elective activity volumelevels and 112% of the activity plan.
• For June 2021 (working day adjusted), activity volume is at 96% when compared to June 2019 (41,239 vs. 42,881). This is further split by:
• Day case (DC) – 97% (3,172 vs. 3,250)• Outpatient - 96% (37,739 vs. 39,103)• Elective inpatient - 62% (328 vs. 528)
• Nationally, there was also additional funding made available via the Elective Recovery Fund (ERF) to step activity back up in 2021/22 and achieve levels above set thresholds. The threshold level is set against a baseline value of all elective activity delivered in 2019/20. For April 2021 it is set at 70%, May 75%, June 80% and 90% from July. It is important to note that the 2019/20 baseline comparison can cause variation due to the nature of when key holidays may occur for example half term in June 2021 vs. May 2019.
Root causes Actions Impact/Timescale
• Pre-op capacity due to vacancies and backlog (75 appointments weekly)
• Impact of Trauma on Elective Orthopaedic operating capacity. 32 extra Trauma cases in June (204 cases compared to 172 in 19/20) against a 32 case deficit in electives (85 against 124 in 19/20).
• Urology have seen less cases as elective inpatients (46 cases in 21/22 against 80 in 19/20) following GIRFT recommendations allowing more cystoscopies to be DC (457 cases in 21/22 against 439 in 19/20).
• Medical specialties have seen a shift to DC in a number of areas (combined activity of 1459 in 21/22 vs. 1350 in 19/20) driven by case mix, use of MDCU and some cancellations to facilitate non-elective care.
• Paediatrics increased activity to 43 monthly in 19/20 to resolve sleep studies backlog. Demand/ waiting times are now stable so extra sessions are not required through 20/21 (17 cases in June).
• Weekly pre-op task and finish group focusing on recruitment,process improvement and short term additional staffing to restorethe capacity gap.
• Use of the independent sector for orthopaedics, urology andgeneral surgery continues.
• Urology continue to increase day case activity in line with GIRFTrecommendations.
• Consultant workforce associated with sleep studies has beenredirected towards clinic provision. Clinical time required in clinic isconsiderably greater and so the volume of activity planned is lower.
• Pre-op process changes in Julywith new staff expected to be inpost by October.
• Independent sector use is on-going.
• Significant risk to ElectiveInpatient operating in July due tothe surge plan for ITU.
Elective Inpatient activity against Yr2019/2080.0% Jun-21 63.4% 62.1% R
22
Best Value Care
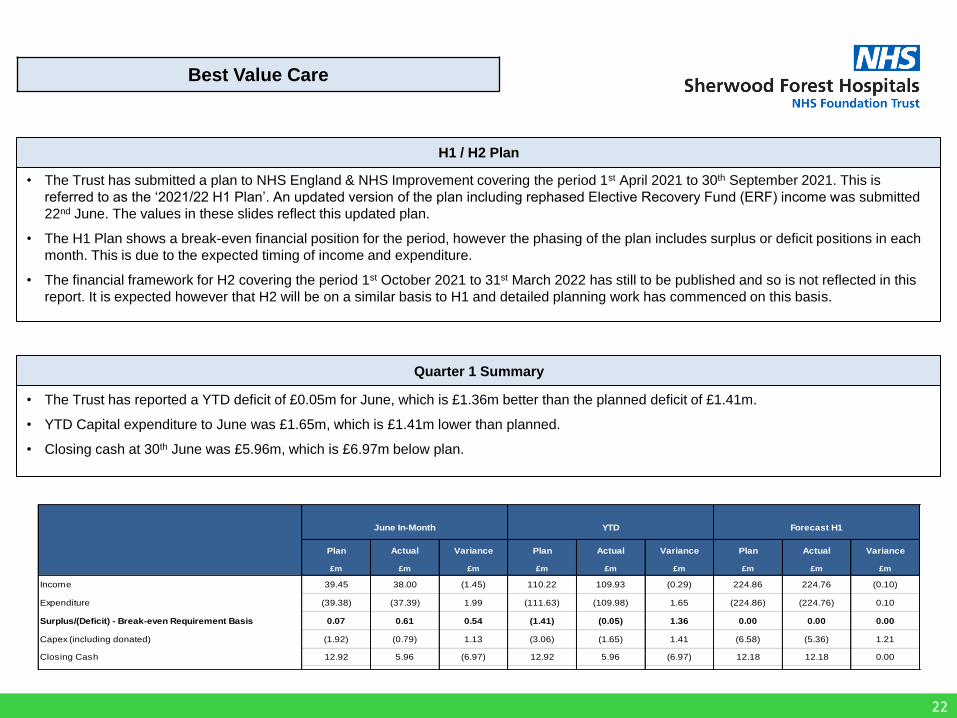
• The Trust has submitted a plan to NHS England & NHS Improvement covering the period 1st April 2021 to 30th September 2021. This is
referred to as the ‘2021/22 H1 Plan’. An updated version of the plan including rephased Elective Recovery Fund (ERF) income was submitted
22nd June. The values in these slides reflect this updated plan.
• The H1 Plan shows a break-even financial position for the period, however the phasing of the plan includes surplus or deficit positions in each
month. This is due to the expected timing of income and expenditure.
• The financial framework for H2 covering the period 1st October 2021 to 31st March 2022 has still to be published and so is not reflected in this
report. It is expected however that H2 will be on a similar basis to H1 and detailed planning work has commenced on this basis.
H1 / H2 Plan
Quarter 1 Summary
• The Trust has reported a YTD deficit of £0.05m for June, which is £1.36m better than the planned deficit of £1.41m.
• YTD Capital expenditure to June was £1.65m, which is £1.41m lower than planned.
• Closing cash at 30th June was £5.96m, which is £6.97m below plan.
Plan Actual Variance Plan Actual Variance Plan Actual Variance
£m £m £m £m £m £m £m £m £m
Income 39.45 38.00 (1.45) 110.22 109.93 (0.29) 224.86 224.76 (0.10)
Expenditure (39.38) (37.39) 1.99 (111.63) (109.98) 1.65 (224.86) (224.76) 0.10
Surplus/(Deficit) - Break-even Requirement Basis 0.07 0.61 0.54 (1.41) (0.05) 1.36 0.00 0.00 0.00
Capex (including donated) (1.92) (0.79) 1.13 (3.06) (1.65) 1.41 (6.58) (5.36) 1.21
Closing Cash 12.92 5.96 (6.97) 12.92 5.96 (6.97) 12.18 12.18 0.00
June In-Month YTD Forecast H1
23
Best Value Care
Break-even Requirement All values £'m
PlanNon-Covid
Actual
Covid
Actual
Total
ActualVariance Plan
Non-Covid
Actual
Covid
Actual
Total
ActualVariance Plan
Non-Covid
Forecast
Covid
Forecast
Total
ForecastVariance
Income:
Block Contract 23.85 23.87 0.00 23.87 0.02 71.55 71.64 0.00 71.64 0.09 143.10 143.19 0.00 143.19 0.09
Top-Up System 3.71 3.71 0.00 3.71 0.00 11.13 11.13 0.00 11.13 0.00 22.27 22.27 0.00 22.27 0.00
ERF 0.00 (0.72) 0.00 (0.72) (0.72) 0.00 0.00 0.00 0.00 0.00 0.00 0.00 0.00 0.00 0.00
COVID Income 1.73 1.05 0.68 1.73 (0.00) 5.20 3.15 2.05 5.20 (0.00) 10.39 6.29 4.10 10.39 (0.00)
Growth and SDF 0.60 0.60 0.00 0.60 0.00 1.79 1.79 0.00 1.79 0.00 3.57 3.57 0.00 3.57 0.00
Other Income 9.53 8.79 0.00 8.79 (0.75) 20.48 20.09 0.00 20.09 (0.39) 45.37 45.18 0.00 45.18 (0.19)
Total Income 39.42 37.29 0.68 37.98 (1.45) 110.14 107.79 2.05 109.84 (0.30) 224.71 220.50 4.10 224.60 (0.11)
Expenditure:
Pay - Substantive (18.73) (17.71) (0.11) (17.81) 0.92 (54.81) (52.54) (0.41) (52.96) 1.85 (109.73) (107.86) (0.75) (108.61) 1.11
Pay - Bank (5.60) (4.44) (0.35) (4.79) 0.81 (13.13) (12.16) (0.98) (13.13) 0.00 (27.47) (25.22) (1.67) (26.90) 0.57
Pay - Agency (1.02) (0.93) (0.05) (0.98) 0.05 (3.16) (3.14) (0.27) (3.41) (0.25) (6.24) (6.29) (0.27) (6.56) (0.33)
Pay - Other (Apprentice Levy and Non Execs) (0.09) (0.13) 0.00 (0.13) (0.04) (0.28) (0.40) 0.00 (0.40) (0.12) (0.56) (0.80) 0.00 (0.80) (0.24)
Total Pay (25.44) (23.21) (0.50) (23.71) 1.73 (71.39) (68.24) (1.66) (69.90) 1.49 (144.00) (140.18) (2.70) (142.88) 1.12
Non-Pay (11.58) (11.09) (0.25) (11.34) 0.25 (33.13) (32.37) (0.68) (33.05) 0.08 (66.60) (66.19) (1.51) (67.71) (1.11)
Depreciation (1.11) (1.10) 0.00 (1.10) 0.02 (3.34) (3.24) 0.00 (3.24) 0.10 (6.68) (6.58) 0.00 (6.58) 0.10
Interest Expense (1.22) (1.22) 0.00 (1.22) (0.00) (3.70) (3.71) 0.00 (3.71) (0.01) (7.43) (7.44) 0.00 (7.44) (0.01)
PDC Dividend Expense 0.00 0.00 0.00 0.00 0.00 0.00 0.00 0.00 0.00 0.00 0.00 0.00 0.00 0.00 0.00
Total Non-Pay (13.91) (13.41) (0.25) (13.65) 0.26 (40.17) (39.31) (0.68) (39.99) 0.17 (80.71) (80.21) (1.51) (81.73) (1.02)
Total Expenditure (39.36) (36.62) (0.75) (37.37) 1.99 (111.55) (107.55) (2.34) (109.89) 1.66 (224.71) (220.39) (4.21) (224.60) 0.11
Surplus/(Deficit) 0.07 0.68 (0.07) 0.61 0.54 (1.41) 0.24 (0.29) (0.05) 1.36 0.00 0.11 (0.11) 0.00 0.00
Year-to-DateIn Month H1 Forecast
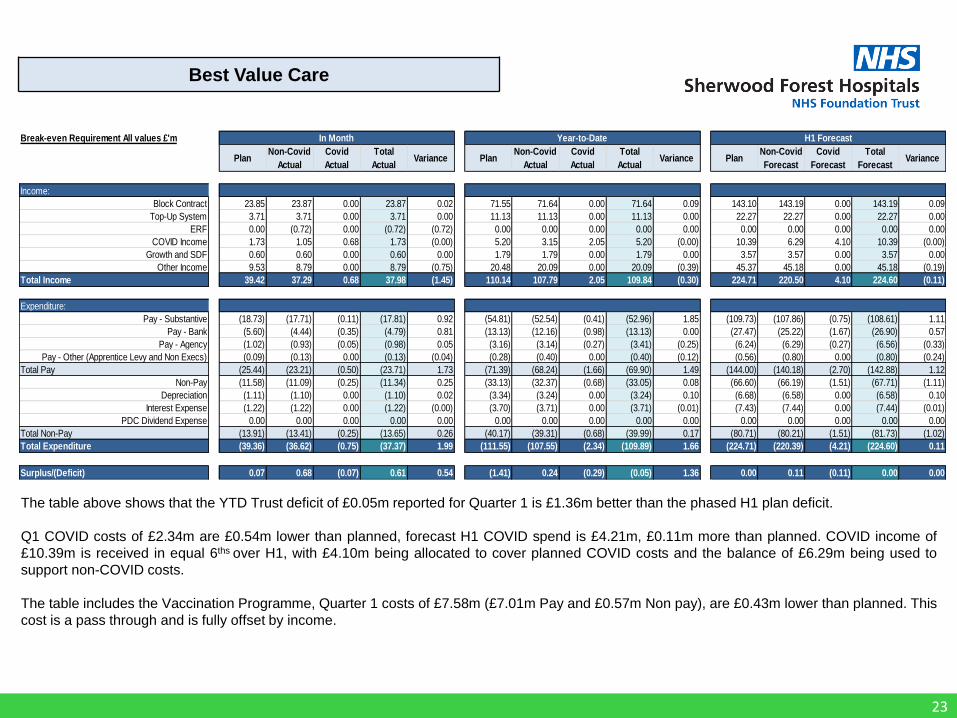
The table above shows that the YTD Trust deficit of £0.05m reported for Quarter 1 is £1.36m better than the phased H1 plan deficit.
Q1 COVID costs of £2.34m are £0.54m lower than planned, forecast H1 COVID spend is £4.21m, £0.11m more than planned. COVID income of
£10.39m is received in equal 6ths over H1, with £4.10m being allocated to cover planned COVID costs and the balance of £6.29m being used to
support non-COVID costs.
The table includes the Vaccination Programme, Quarter 1 costs of £7.58m (£7.01m Pay and £0.57m Non pay), are £0.43m lower than planned. This
cost is a pass through and is fully offset by income.