Embed Size (px)
Citation preview
This journal is©The Royal Society of Chemistry 2018 Mol. Omics, 2018, 14, 307--319 | 307
Cite this:Mol. Omics, 2018,
14, 307
Single-platform ‘multi-omic’ profiling: unifiedmass spectrometry and computational workflowsfor integrative proteomics–metabolomics analysis
Benjamin C. Blum, †ab Fatemeh Mousavic and Andrew Emili *abcd
The objective of omics studies is to globally measure the different classes of cellular biomolecules
present in a biological specimen (e.g. proteins, metabolites) as accurately as possible in order to
investigate the corresponding ‘states’ of biological systems. High throughput omics technologies are
emerging as an increasingly powerful toolkit in the rapidly advancing field of systems biology, enabling
the systematic study of dynamic molecular processes that drive core cell functions like growth, sensing,
and environmental adaptation. Advances in high resolution mass spectrometry, in particular, now allow
for the near comprehensive study of cellular proteins and metabolites that underlie physiological
homeostasis and disease pathogenesis. Yet while the expression levels, modification states, and functional
associations of diverse molecular species are now measurable, existing proteomic and metabolomic data
generation and analysis workflows are often specialized and incompatible. Hence, while there are now
many reports of ad hoc combinations of unimolecular proteomic and metabolomic workflows, only a
limited number of multi-omic profiling approaches have been reported for obtaining different molecular
measurements (proteins, metabolites, nucleic acids) in parallel from a single biological sample. Moreover,
elucidating how the myriad of measured cellular components are linked together functionally within the
metabolic processes, signal transduction pathways, and macromolecular interaction networks central
to living systems remains a massive, complicated, and uncertain endeavor. Presented here is a review
of convergent mass spectrometry-based multi-omic methodologies, with a focus on notable recent
advances and remaining challenges in terms of efficient sample preparation, biochemical separations,
data acquisition, and integrative computational strategies. We outline a unifying network-based
integrative framework to better derive biological knowledge from integrated profiling studies with the
goal of realizing the full potential of multi-omic data sets.
Introduction
The omics revolution is helping to advance discovery scienceand basic mechanistic understanding of biological systems,starting with the major sequencing-based omics technologies,genomics and transcriptomics, and continuing with proteomicsand metabolomics. These include steady advances in precisionmass spectrometry that allow for highly sensitive, rapid, andaccurate identification and quantification of thousands of cellularproteins, post-translational modifications (e.g. phosphorylation
sites, glycosylation) and metabolites in a single analysis. Yetwhile progress continues inexorably in each of these domains,the throughput, community adoption, and utility of proteomicsand metabolomics techniques has lagged behind that ofnucleic-acid-based molecular profiling methods. In part, thisreflects the inability to amplify relevant molecules in a manneranalogous to polymerase chain reaction amplification, but alsoto experimental inefficiencies and the lack of standardizationof extant analytical workflows.
In principle, mass spectrometry-based proteomics and meta-bolomics studies are capable of generating near-comprehensivemeasurements of proteins and metabolites in parallel, providingvaluable insights into the molecular mechanisms and dynamicsof biological processes that could only otherwise be inferred inan indirect and error-prone manner from mRNA transcriptlevels.1 Multi-omics have the potential to reveal the fundamentalmolecular logic coupling signal transduction, cellular metabolism,and phenotype determination.2 Mass spectrometry is exceptionally
a Center for Network Systems Biology, Boston University School of Medicine, Boston,
Massachusetts, USA. E-mail: [email protected]; Tel: +1-617-358-4511b Department of Biochemistry, Boston University School of Medicine, Boston,
Massachusetts, USAc Donnelly Centre, Department of Molecular Genetics, University of Toronto,
Toronto, Ontario, Canadad Department of Biology, Boston University, Boston, Massachusetts, USA
† These authors contributed equally.
Received 13th June 2018,Accepted 13th August 2018
DOI: 10.1039/c8mo00136g
rsc.li/molomics
MolecularOmics
REVIEW
Ope
n A
cces
s A
rtic
le. P
ublis
hed
on 1
3 Se
ptem
ber
2018
. Dow
nloa
ded
on 3
/16/
2022
7:0
8:27
AM
. T
his
artic
le is
lice
nsed
und
er a
Cre
ativ
e C
omm
ons
Attr
ibut
ion-
Non
Com
mer
cial
3.0
Unp
orte
d L
icen
ce.
View Article OnlineView Journal | View Issue
308 | Mol. Omics, 2018, 14, 307--319 This journal is©The Royal Society of Chemistry 2018
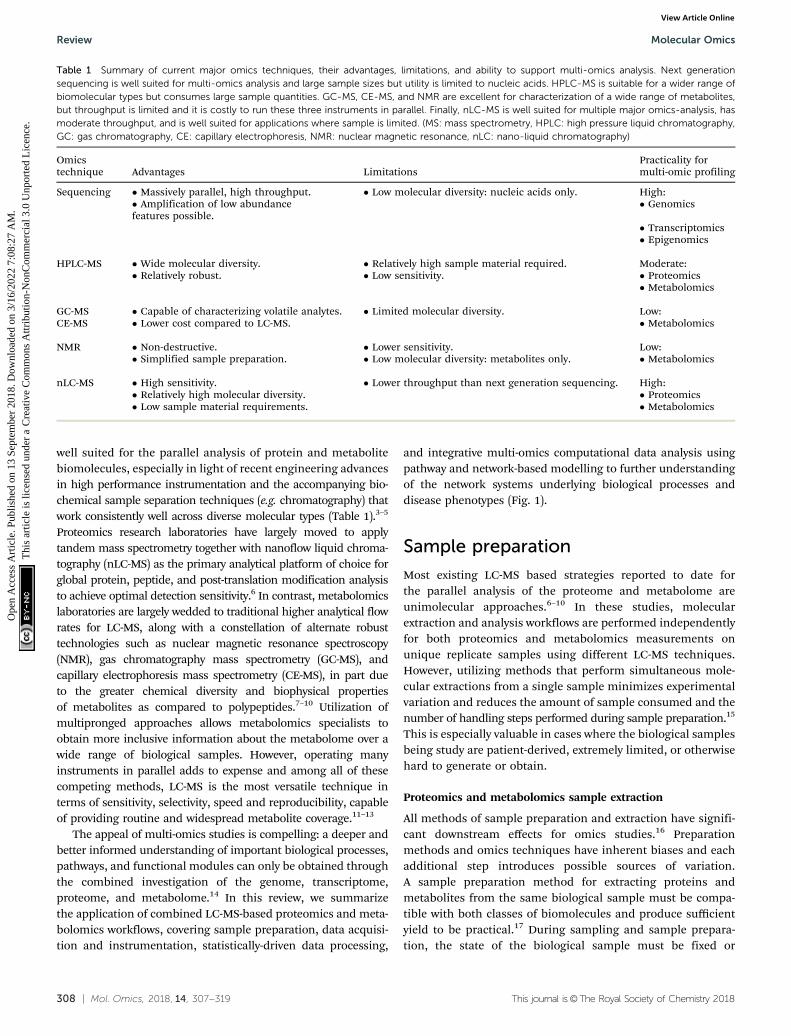
well suited for the parallel analysis of protein and metabolitebiomolecules, especially in light of recent engineering advancesin high performance instrumentation and the accompanying bio-chemical sample separation techniques (e.g. chromatography) thatwork consistently well across diverse molecular types (Table 1).3–5
Proteomics research laboratories have largely moved to applytandem mass spectrometry together with nanoflow liquid chroma-tography (nLC-MS) as the primary analytical platform of choice forglobal protein, peptide, and post-translation modification analysisto achieve optimal detection sensitivity.6 In contrast, metabolomicslaboratories are largely wedded to traditional higher analytical flowrates for LC-MS, along with a constellation of alternate robusttechnologies such as nuclear magnetic resonance spectroscopy(NMR), gas chromatography mass spectrometry (GC-MS), andcapillary electrophoresis mass spectrometry (CE-MS), in part dueto the greater chemical diversity and biophysical propertiesof metabolites as compared to polypeptides.7–10 Utilization ofmultipronged approaches allows metabolomics specialists toobtain more inclusive information about the metabolome over awide range of biological samples. However, operating manyinstruments in parallel adds to expense and among all of thesecompeting methods, LC-MS is the most versatile technique interms of sensitivity, selectivity, speed and reproducibility, capableof providing routine and widespread metabolite coverage.11–13
The appeal of multi-omics studies is compelling: a deeper andbetter informed understanding of important biological processes,pathways, and functional modules can only be obtained throughthe combined investigation of the genome, transcriptome,proteome, and metabolome.14 In this review, we summarizethe application of combined LC-MS-based proteomics and meta-bolomics workflows, covering sample preparation, data acquisi-tion and instrumentation, statistically-driven data processing,
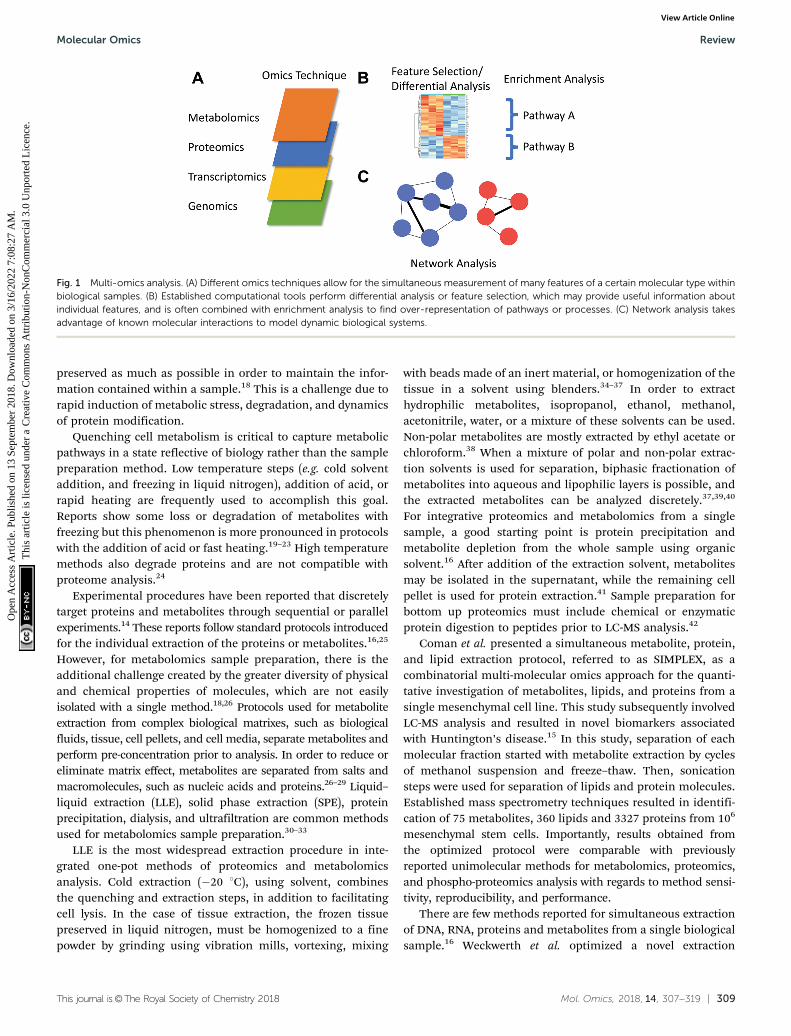
and integrative multi-omics computational data analysis usingpathway and network-based modelling to further understandingof the network systems underlying biological processes anddisease phenotypes (Fig. 1).
Sample preparation
Most existing LC-MS based strategies reported to date forthe parallel analysis of the proteome and metabolome areunimolecular approaches.6–10 In these studies, molecularextraction and analysis workflows are performed independentlyfor both proteomics and metabolomics measurements onunique replicate samples using different LC-MS techniques.However, utilizing methods that perform simultaneous mole-cular extractions from a single sample minimizes experimentalvariation and reduces the amount of sample consumed and thenumber of handling steps performed during sample preparation.15
This is especially valuable in cases where the biological samplesbeing study are patient-derived, extremely limited, or otherwisehard to generate or obtain.
Proteomics and metabolomics sample extraction
All methods of sample preparation and extraction have signifi-cant downstream effects for omics studies.16 Preparationmethods and omics techniques have inherent biases and eachadditional step introduces possible sources of variation.A sample preparation method for extracting proteins andmetabolites from the same biological sample must be compa-tible with both classes of biomolecules and produce sufficientyield to be practical.17 During sampling and sample prepara-tion, the state of the biological sample must be fixed or
Table 1 Summary of current major omics techniques, their advantages, limitations, and ability to support multi-omics analysis. Next generationsequencing is well suited for multi-omics analysis and large sample sizes but utility is limited to nucleic acids. HPLC-MS is suitable for a wider range ofbiomolecular types but consumes large sample quantities. GC-MS, CE-MS, and NMR are excellent for characterization of a wide range of metabolites,but throughput is limited and it is costly to run these three instruments in parallel. Finally, nLC-MS is well suited for multiple major omics-analysis, hasmoderate throughput, and is well suited for applications where sample is limited. (MS: mass spectrometry, HPLC: high pressure liquid chromatography,GC: gas chromatography, CE: capillary electrophoresis, NMR: nuclear magnetic resonance, nLC: nano-liquid chromatography)
Omicstechnique Advantages Limitations
Practicality formulti-omic profiling
Sequencing � Massively parallel, high throughput. � Low molecular diversity: nucleic acids only. High:� Amplification of low abundancefeatures possible.
� Genomics
� Transcriptomics� Epigenomics
HPLC-MS � Wide molecular diversity. � Relatively high sample material required. Moderate:� Relatively robust. � Low sensitivity. � Proteomics
� Metabolomics
GC-MS � Capable of characterizing volatile analytes. � Limited molecular diversity. Low:CE-MS � Lower cost compared to LC-MS. � Metabolomics
NMR � Non-destructive. � Lower sensitivity. Low:� Simplified sample preparation. � Low molecular diversity: metabolites only. � Metabolomics
nLC-MS � High sensitivity. � Lower throughput than next generation sequencing. High:� Relatively high molecular diversity. � Proteomics� Low sample material requirements. � Metabolomics
Review Molecular Omics
Ope
n A
cces
s A
rtic
le. P
ublis
hed
on 1
3 Se
ptem
ber
2018
. Dow
nloa
ded
on 3
/16/
2022
7:0
8:27
AM
. T
his
artic
le is
lice
nsed
und
er a
Cre
ativ
e C
omm
ons
Attr
ibut
ion-
Non
Com
mer
cial
3.0
Unp
orte
d L
icen
ce.
View Article Online
This journal is©The Royal Society of Chemistry 2018 Mol. Omics, 2018, 14, 307--319 | 309
preserved as much as possible in order to maintain the infor-mation contained within a sample.18 This is a challenge due torapid induction of metabolic stress, degradation, and dynamicsof protein modification.
Quenching cell metabolism is critical to capture metabolicpathways in a state reflective of biology rather than the samplepreparation method. Low temperature steps (e.g. cold solventaddition, and freezing in liquid nitrogen), addition of acid, orrapid heating are frequently used to accomplish this goal.Reports show some loss or degradation of metabolites withfreezing but this phenomenon is more pronounced in protocolswith the addition of acid or fast heating.19–23 High temperaturemethods also degrade proteins and are not compatible withproteome analysis.24
Experimental procedures have been reported that discretelytarget proteins and metabolites through sequential or parallelexperiments.14 These reports follow standard protocols introducedfor the individual extraction of the proteins or metabolites.16,25
However, for metabolomics sample preparation, there is theadditional challenge created by the greater diversity of physicaland chemical properties of molecules, which are not easilyisolated with a single method.18,26 Protocols used for metaboliteextraction from complex biological matrixes, such as biologicalfluids, tissue, cell pellets, and cell media, separate metabolites andperform pre-concentration prior to analysis. In order to reduce oreliminate matrix effect, metabolites are separated from salts andmacromolecules, such as nucleic acids and proteins.26–29 Liquid–liquid extraction (LLE), solid phase extraction (SPE), proteinprecipitation, dialysis, and ultrafiltration are common methodsused for metabolomics sample preparation.30–33
LLE is the most widespread extraction procedure in inte-grated one-pot methods of proteomics and metabolomicsanalysis. Cold extraction (�20 1C), using solvent, combinesthe quenching and extraction steps, in addition to facilitatingcell lysis. In the case of tissue extraction, the frozen tissuepreserved in liquid nitrogen, must be homogenized to a finepowder by grinding using vibration mills, vortexing, mixing
with beads made of an inert material, or homogenization of thetissue in a solvent using blenders.34–37 In order to extracthydrophilic metabolites, isopropanol, ethanol, methanol,acetonitrile, water, or a mixture of these solvents can be used.Non-polar metabolites are mostly extracted by ethyl acetate orchloroform.38 When a mixture of polar and non-polar extrac-tion solvents is used for separation, biphasic fractionation ofmetabolites into aqueous and lipophilic layers is possible, andthe extracted metabolites can be analyzed discretely.37,39,40
For integrative proteomics and metabolomics from a singlesample, a good starting point is protein precipitation andmetabolite depletion from the whole sample using organicsolvent.16 After addition of the extraction solvent, metabolitesmay be isolated in the supernatant, while the remaining cellpellet is used for protein extraction.41 Sample preparation forbottom up proteomics must include chemical or enzymaticprotein digestion to peptides prior to LC-MS analysis.42
Coman et al. presented a simultaneous metabolite, protein,and lipid extraction protocol, referred to as SIMPLEX, as acombinatorial multi-molecular omics approach for the quanti-tative investigation of metabolites, lipids, and proteins from asingle mesenchymal cell line. This study subsequently involvedLC-MS analysis and resulted in novel biomarkers associatedwith Huntington’s disease.15 In this study, separation of eachmolecular fraction started with metabolite extraction by cyclesof methanol suspension and freeze–thaw. Then, sonicationsteps were used for separation of lipids and protein molecules.Established mass spectrometry techniques resulted in identifi-cation of 75 metabolites, 360 lipids and 3327 proteins from 106
mesenchymal stem cells. Importantly, results obtained fromthe optimized protocol were comparable with previouslyreported unimolecular methods for metabolomics, proteomics,and phospho-proteomics analysis with regards to method sensi-tivity, reproducibility, and performance.
There are few methods reported for simultaneous extractionof DNA, RNA, proteins and metabolites from a single biologicalsample.16 Weckwerth et al. optimized a novel extraction
Fig. 1 Multi-omics analysis. (A) Different omics techniques allow for the simultaneous measurement of many features of a certain molecular type withinbiological samples. (B) Established computational tools perform differential analysis or feature selection, which may provide useful information aboutindividual features, and is often combined with enrichment analysis to find over-representation of pathways or processes. (C) Network analysis takesadvantage of known molecular interactions to model dynamic biological systems.
Molecular Omics Review
Ope
n A
cces
s A
rtic
le. P
ublis
hed
on 1
3 Se
ptem
ber
2018
. Dow
nloa
ded
on 3
/16/
2022
7:0
8:27
AM
. T
his
artic
le is
lice
nsed
und
er a
Cre
ativ
e C
omm
ons
Attr
ibut
ion-
Non
Com
mer
cial
3.0
Unp
orte
d L
icen
ce.
View Article Online
310 | Mol. Omics, 2018, 14, 307--319 This journal is©The Royal Society of Chemistry 2018
protocol for sequential extraction of metabolites, proteins, andRNA from the same plant tissue for subsequent GC-ToFMSanalysis for metabolites, and LC� LC coupled to MS for proteinanalysis. Plant tissue was homogenized under liquid nitrogenby grinding. Metabolites were extracted with a cold solventmixture of methanol, water, and chloroform, which resulted inidentification of 652 metabolites after precipitating DNA/RNA,and 297 proteins.35
Vorreiter et al. optimized a method for simultaneousextraction of nucleic acids, proteins, and metabolites fromJurkat E6-1 cells and Hepa 1c1c7 cells and compared the resultswith those obtained with unimolecular extraction methods.43
The study examined DNA and RNA quality and quantity,proteome coverage, and identification of hydrophilic meta-bolites involved in central carbon and nitrogen metabolism.The sample procedure that provided the best coverage forall four omics studies involved extraction of mainly polarmetabolites using a solvent mixture of water, methanol, andchloroform. The resulting pellet was treated by water saturatedphenol for RNA, DNA, and protein extraction. The RNA andDNA phases were separated using chloroform and proteinprecipitation was performed. Proteins were re-suspended inurea and enzymatic digestion was used for subsequent peptideanalysis. The best results showed 35 metabolites and 870proteins from 107 Jurkat E6-1 cells, and 23 metabolitesand 1023 proteins detected for Hepa 1c1c7 cells. One of theimportant advantages of this method was the RNA and DNAseparation from proteins that reduced complexity of proteinmass spectra and permitted integration with transcriptomicsand genomics studies.
Sample enrichment and fractionation
Selective protein enrichment from complex proteomics fractionsis possible and particularly useful depending on the questionsbeing addressed in a study. For example, affinity capture ofphosphoproteins is commonly performed using metal chelate(e.g. TiO2) beads to selectively explore the differential activationstate of protein kinases, enzymes and other regulatory proteinsin signaling pathways.44,45 Biochemical fractionation methodshave also been devised for the enrichment of protein glycosyla-tion, ubiquitination, and other post-translational modifications,or the isolation of protein subcellular compartments to defineorganelle functional associations.46,47 All of these layers areimportant determinants of cell signaling, disease pathogenesis,and other biological processes. In some cases, advances in highresolution mass-spectrometry are reducing the need for furtherextensive enrichment to achieve deep proteome coverage.48
One of the most important considerations for an integratedworkflow based on nLC-MS is susceptibility of microborecolumns to blockage, particularly during metabolomics analysis,which can degrade column performance and lifetime due topresence of particulates and insoluble salts.41 Mobile phaseoptimization to account for hydrophobic molecules may bebeneficial and high concentration sample extracts show increasedreproducibility and wider metabolome coverage when exten-sive sample cleanup and fractionation is performed prior to
nLC-MS analysis. For example, solid-phase microextraction(SPME) can help remove particularly challenging components,such as phospholipids. Lyophilization conjugated with SPE hasbeen applied for yeast metabolomics analysis.49 Commerciallipid depletion kits for the selective removal of phospholipidscan also increase chromatographic column lifetime whilereducing ion suppression prior to nLC.41,50 Column trapping isanother method applied for metabolomics analysis in order toload a larger volume of sample while removing salts and othercontaminants.51
Sample pre-fractionation and labeling
Proteomics studies frequently involve sample pre-fractionationsteps to increase proteome coverage by nLC-MS.45 Proteinseparation and/or enrichment using offline fractionationtechniques, such as gel electrophoresis, HPLC, and affinitycapture are common. Where analytical chromatography isused, an orthogonal method is usually performed to comple-ment the standard (reverse phase) separations used in LC-MS.While high resolution can be achieved under denaturing con-ditions using hydrophilic interaction chromatography (HILIC)and high pH reverse phase chromatography, non-denaturingion-exchange and mixed mode chromatography can also beeffective depending on study goals, such as the isolation andcharacterization of intact native macromolecular complexes.42
To improve instrument time efficiency to offset the addednumber of samples originating from pre-fractionation, stableisotope chemical labeling may be used for fraction multiplexingprior to LC-MS. Metabolic labeling can also be performed toimprove relative proteome quantification and multiplexinganalysis. It is also possible to perform flux analysis usingmetabolic labels, for example in a pulse-chase experimentaldesign.51,52
Data acquisition and featureidentificationMass spectrometry data acquisition
Given nLC-MS is widely and successfully applied in proteomicsresearch labs, there is significant interest in adapting the sametechnology for metabolomics analyses to enable combinedproteomic and metabolomic studies using the same platform.17
Recently, nLC-MS workflows have been reported for use in moretargeted metabolite and small molecule analyses, including thedetection and quantification of amino acids, fatty acids, lipids,prostaglandins, di/tripeptides, steroids, vitamins, nucleic acids,xenobiotics and, less frequently, in global metabolomics surveysof urine, plasma and cell samples.53,54 Nanoflow techniques dopose challenges beyond column blockage; for example, electro-spray ionization in negative mode is complicated by reducedsolvent desolvation and electrical discharge.11
While HPLC-MS is widely used for high-throughput untargetedmetabolomics analysis, matrix effects and poor ionizationefficiency due to ion suppression may produce lower sensitivityand restrict detection to highly abundant metabolites.55,56
Review Molecular Omics
Ope
n A
cces
s A
rtic
le. P
ublis
hed
on 1
3 Se
ptem
ber
2018
. Dow
nloa
ded
on 3
/16/
2022
7:0
8:27
AM
. T
his
artic
le is
lice
nsed
und
er a
Cre
ativ
e C
omm
ons
Attr
ibut
ion-
Non
Com
mer
cial
3.0
Unp
orte
d L
icen
ce.
View Article Online
This journal is©The Royal Society of Chemistry 2018 Mol. Omics, 2018, 14, 307--319 | 311
This limitation has motivated the use of nLC-MS for meta-bolomics, too. Nanoflow HPLC columns with internal diametersbetween 10 to 75 mm and flow rates of 10 to 500 nL min�1
offer lower chromatographic dilution, enhanced peak capacity,resolution and detection sensitivity.57,58 Nanoflow also pro-vides improved analyte pre-concentration and more efficientintroduction of biomolecules via electrospray ionization (ESI)to the MS system as compared to conventional high flow LC-MSsystems.59–62 Compared to conventional HPLC-MS, nLC-MSsystems are up to 2000 times more sensitive, while achieving upto a 300-fold lower limit of detection and limit of quantification.63,64
In cases where specimens are limited, nLC-MS is also beneficialbecause it requires less sample, though reproducibility and speedmay be compromised as compared to HPLC. It is possible touse both HILIC and RP chromatography for nLC-MS basedmetabolomics profiling; however, running samples in negativeionization mode is more difficult for metabolomics studiesusing nanoflow ESI.11,65
There are several methods used to produce consistent nano-flow rates, including split flow, direct infusion, and direct flow.Split flow was the first introduction of nLC, which utilized dualHPLC pumps with a diverter that split the higher flow fluidicsto deliver nano-scale flow rates to the mass spectrometer.56
This results in about 99% of the sample and most of solventbeing lost to waste.66
Nanoflow direct infusion mass spectrometry has long beensuccessfully applied for metabolomics sample analysis frommany sample types, such as liver extracts, plasma, urine,embryos, and Daphnia.57,67–74 These studies take advantage ofthe high-throughput offered by direct infusion. However, theabsence of chromatography before MS enhances the matrixeffect and makes differentiation between isobars or isomersimpossible using this method.75–77
Nanoflow direct flow mass spectrometry analysis methodsmay use nanoflow reciprocal or syringe pumps and micro-fluidic flow.78,79 These methods improve compound retentionand spray characteristics of the nanoflow platform. Applicationhas been reported in metabolomics analysis of complexsamples such as plasma, tissue, urine, breath, sweat, cerebro-spinal fluids and cell extracts.49,50,52,80–86 Deviation in backpressure and surface tension due to variability in mobile phaseviscosities can create challenges in obtaining stable analyteretention times, especially with gradient separations.87,88 Directflow is not as high-throughput as direct infusion, however,direct flow does provide increased resolution via pre-massspectrometry separations without waste inherent with samplesplit-flow. Nano-columns, up to 0.01 mm internal diameter, canprovide stable low flow gradients, reducing chromatographicdilution while requiring low sample and mobile phaseconsumption.89–91
There are many different types of commercial nano-columns,including BEH C18, HSS T3, Acclaim PepMax C18, and ZIC-HILIC. Different columns are often better suited to specificmolecular classes and column optimization is an importantstep. In order to provide consistent separations of polarmetabolites, HILIC chromatography is often most effective.85
Different case studies evaluating distinct nano-columns formetabolomics surveys have shown that the performance of theanalytical system increases by decreasing pore size even morethan is evident in proteomics applications. In comparison toconventional HPLC with the same stationary phase, nLC showshigher sensitivity and enhanced chromatographic resolution fora wider range of small molecule metabolites, while co-elutionand ion suppression drop significantly.92,93
Two other parameters influencing the quality of the recordedmetabolomics data are retention time drift and peak intensity.Methods and techniques should be optimized to improve reten-tion time stability and minimize the coefficient of variation(CV) between replicate analyses. Variation in peak intensity byreplicate nLC-MS analyses may be as high as 30%,94 and CVsconsistently less than 20% for targeted and untargeted meta-bolomics analyses are difficult but not impossible to achieve bynLC-MS.95 For example, a study using nLC-MS for yeast meta-bolomics reported an average CV of less than 14%.69 The use ofinternal standards may decrease CVs below 0.2%.41,50
Electrospray ionization (ESI) is the most common soft ioniza-tion technique employed for proteomics.96 Nano ESI (nESI)produces droplets up to 1000 times smaller than generated byhigh flow ESI, which leads to improved evaporation, moreefficient sample transfer and potentially more ions detected.75
The best performing nESI sources use a smaller internal dia-meter for higher ionization efficiency. Utilization of non-taperedemitters with an internal diameter in the range of 10–30 mmprovides an adequate compromise between sensitivity, systemrobustness, and sample consumption.97–101 Wider internaldiameters reduce potential clogging and facilitate more stableionization spray, resulting in more reproducible mass spectraand ion chromatograms.
Both proteomics and metabolomics benefit greatly fromcontinued progress in LC-MS instrument engineering. Highresolution mass-spectrometers, with higher mass accuracy andfaster scan speeds provide more accurate, in-depth raw data.Improving ion resolution and throughput facilitates betterfeature identification and makes the analysis larger numbersof sample feasible.102,103 While there remains a fundamentaltrade-off between throughput and analysis depth and coverage,high-resolutions systems enable acquisition of high qualitydata from complex mixtures with even relatively short gradientseparations.
The sensitivity and throughput of mass-spectrometry-basedomics studies does lag considerably behind genomic andtranscriptomic sequencing technologies. This challenge makesstudies with large sample sizes difficult. While some large-scaleefforts, such as the Clinical Proteomic Tumor Analysis Con-sortium (CPTAC), are addressing this shortcoming, proteomicsand metabolomics is still catching up to the massively parallelnucleic acid profiling approaches in terms of ease of datageneration, standardization, and accessibility.104–106 Furtherimprovements in multiplexing, more rapid and standardizedseparations, and improved mass-spectrometry scan speed andautomation will be important criteria for continuing to advancethe field.
Molecular Omics Review
Ope
n A
cces
s A
rtic
le. P
ublis
hed
on 1
3 Se
ptem
ber
2018
. Dow
nloa
ded
on 3
/16/
2022
7:0
8:27
AM
. T
his
artic
le is
lice
nsed
und
er a
Cre
ativ
e C
omm
ons
Attr
ibut
ion-
Non
Com
mer
cial
3.0
Unp
orte
d L
icen
ce.
View Article Online
312 | Mol. Omics, 2018, 14, 307--319 This journal is©The Royal Society of Chemistry 2018
Proteomics and metabolomics raw data processing and featureidentification
Identifying features (cognate proteins/peptides and metabolites)and abundance (relative intensities) from raw mass spectrometrydata files are fundamental steps in the analysis pipeline. Theprocess of converting MS precursor ion scans and associatedMS/MS fragmentation spectra into identified proteins andmetabolites is different for each data type and is addressedusing different software tools. For proteomics, the peptide/protein search space is inherently limited by biology (genome ofthe particular species) and chemistry (peptide bond constraints).Peptide database files for many species are available for downloadfrom sources such as Uniprot, and have well defined rules forpolymeric structure and fragmentation patterns.107 MaxQuant is apopular and relatively easy to use full-featured tool, which runsthe Andromeda search engine as well as associated quantificationtools. Other powerful software tools for searching MS/MS spectradata to identify peptides include the popular search enginesMS-GF+, Comet, SpectraST, Mascot, XTandem, MyriMatch,Sequest, and Tide.108–114 Validation of peptide identificationis often estimated through empirical false discovery rate (FDR)using a reverse ‘decoy’ database search.115,116 Many additionaltools are used to interface with these search engines, to assignintensity values, and to format data for subsequent statisticalanalysis.117–121 Several community tools, such as the Trans-Proteomic Pipeline, Peptide Shaker, and OpenMS, offer addedfunctionality that improve overall performance, including per-mitting running multiple search engines to compare andcompile results.114 Open-source software, such as OpenMS,also provide powerful configurable features, while retaininga simplified user interface even when running complicatedanalysis pipelines.118
Metabolomics feature identification is a more difficult chal-lenge in that the search space for identifications is muchgreater due to the increased structural diversity. This is furtherconfounded by the detection of multiple alternately adductedion species by LC-MS, and the lack of constrained MS/MSfragmentation rules, compared to polypeptides, which tend tocleave in a more predictable manner. To address this gap, thereare efforts to compile compound spectral libraries containingempirically derived or simulated metabolite spectra, along withmatching information regarding chemical composition, struc-ture, and other annotations. Most notable of these databasesare PubChem, HMDB, and METLIN.122,123 METLIN has anextensive library of experimentally defined MS2 spectra, whileHMDB features extensive compound annotation informationand, as of the most recent release, has made all curateddata, including spectral libraries, downloadable in open-source formats. Unfortunately, the community still lacks acommon identification nomenclature for conversion betweenresources, limiting their utility.
In principle, metabolite identifications may also be performedthrough comparing MS/MS fragmentation patterns, isotope patternsand retention times for reference standard compounds, though thiscan be expensive and time-consuming. Surprisingly, many
putative human metabolites are not readily verifiable usingsynthetic standards, suggesting a potentially major gap inLC-MS assay design and detection reliability. Metabolomicsdata can be noisy, leading to spurious compound assignments,which heightens the need for confident metabolite identifica-tions from features of interest.124,125 In order to achieve reliablemetabolite feature matching, planning the overall experimentaldesign, data analysis pipeline, and validation strategy in astringent manner early on in the project lifecycle is crucial.
Many open-source and commercial software tools are avail-able for performing metabolomics spectral filtering, peakdetection, retention time alignment, and normalization. Theseinclude MZmine, MS-DIAL, and R packages and associated withthe mzR parser, and other tools, like MAIT, that provideadditional functionality for routine detection of differentialmetabolites from LC/MS-based metabolomics data.126–129
XCMS and MetaboAnalyst are also popular, user friendlytools associated with the METLIN and HMDB databases,respectively. Although available as stand-alone R packages,powerful features like raw data file processing and pathwayenrichment analysis are only or most easily accessed via onlineweb-based versions of these tools, providing a hurdle forintegration into more advanced computational workflows.130–132
OpenMS likewise offers plugins for metabolite feature identifi-cation that use advanced signal processing techniques to identifyfeatures in raw data and permit the querying of public data-bases to find matches based on exact mass and structuralfragmentation patterns.133
Despite these powerful resources, metabolomics featureidentification and quantification remain a challenge. Comparedto the thriving ecosystem of robust open-source sequencinganalysis tools, metabolomics and proteomics search tools tendto be more closed and different algorithms often do not convergeto similar results with the same degree of confidence. Hopefully,more robust, user-friendly, and open-source solutions will con-tinue to advance this area of research.
Integrative multi-omics analysisNormalization and feature selection
Proteomics and metabolomics generate a large amount ofcomplementary data that is potentially informative of theactivity of biological pathways but requires specialized mathe-matical, statistical, and bioinformatics analysis strategies.134
In order to best leverage these overlapping signals to achieve amore comprehensive understanding of biological systems,integration of the omics data is an important and often under-appreciated step. While there are now numerous omics dataanalysis and integration tools for this purpose, each has variousstrengths and limitations.
Processed raw LC-MS data usually is structured as amatrix of features (i.e. proteins, peptides, or metabolites) andbiological samples, with their corresponding intensity values.Tools and processes developed for interpreting other complexdata types, such as transcriptomics, have been adapted
Review Molecular Omics
Ope
n A
cces
s A
rtic
le. P
ublis
hed
on 1
3 Se
ptem
ber
2018
. Dow
nloa
ded
on 3
/16/
2022
7:0
8:27
AM
. T
his
artic
le is
lice
nsed
und
er a
Cre
ativ
e C
omm
ons
Attr
ibut
ion-
Non
Com
mer
cial
3.0
Unp
orte
d L
icen
ce.
View Article Online
This journal is©The Royal Society of Chemistry 2018 Mol. Omics, 2018, 14, 307--319 | 313
successfully for transformation and normalization of raw inten-sity values.135 Feature selection is an important early step andmost often is performed by analyzing differences between twoor more groups (e.g. case versus control samples). R packages,such as limma, have been well established for the use ofdifferential analysis for datasets with known phenotypes basedon linear models and other statistical criteria.136 Innovativenew tools are also rapidly advancing that are based on theapplication of more advanced machine learning algorithms,which are effective in cases with sufficient sample size, with thecaret R package and scikit-learn Python modules being amongthe most commonly used.137,138
Enrichment analysis and pathway-centered visualization
More automated tools are also emerging that can integratefeature selection with subsequent functional enrichment ana-lysis. Gene Set Enrichment Analysis (GSEA), the Database forAnnotation, Visualization, and Integrated Discovery (DAVID),and Enrichr are three widely used computational tools forperforming routine pathway enrichment analysis on omicsdatasets. In the case of proteomics data, protein accessionsmust be mapped to corresponding gene symbols.139,140 GSEArequires java and is downloadable as both a desktop applica-tion and for command line usage, DAVID is accessible as a web-based tool, while Enrichr is available both as an online tool andthrough an R interface package and python module to interfacewith public pathway databases. Tools like the EnrichmentMapapp for Cytoscape can help simplify and visualize overall trendsamong occasionally overwhelming enrichment results.141
Other computational tools have been developed to integratemetabolomics data into the enrichment analysis. MetaboAnalystand XCMS Online both incorporate basic enrichment analysisand omics integration tools along with their metabolomics searchsoftware. The online versions of the software are not open-sourceand pose challenges to incorporate into more extensive data miningpipelines. MixOmics is an R package that includes functionsexpressly optimized for the statistical analysis and visualization ofmulti-omics data sets.142 3Omics is a web-based platform thatperforms integration and joint visualization of parallel transcrip-tomics, proteomics, and metabolomics datasets. Preprocessedand normalized data can be submitted using a standardcomma-delimited.csv file format. Kuo et al. showed the utility of3Omics for the integrative analysis of multi-omic human data.143
InCroMAP is another tool for the integration of disparateomics-data sets144 that was successfully used for characteriza-tion of biological pathways perturbed in a mouse liver tumormodel setting.145
Interaction-based network meta-analysis
While grouping features together based on available functionalannotations is a valuable and important analysis step, it does notconsider the relationships, or interactions, between differentmolecules that are often necessary for executing biologicalprocesses. Many public curation databases aggregate informationreported in the literature on molecular interactions, particularlyprotein–protein and protein–metabolite interactions.123,146,147
iRefindex, for example, provides a comprehensive database ofprotein–protein interactions aggregated from a number ofprimary databases.148 Likewise, HMDB, STITCH, and Reconall strive to provide protein–metabolite interaction informationin addition to charting metabolic pathways.
Omics integrator is an open source python tool that enables theselection of ‘active’ network modules that show differential featuresin overlays of omics data onto curated interactions from publicdatabases.149 The modules are selected from the larger interactionnetwork using a machine learning algorithm. In this way, the toolaccounts for changes in sets of interacting molecules with a reason-able level of confidence even if not all of the partner components aredetected in the omics data sets. Pirhaji et al. described a more recentextension called PIUmet, which uses protein–protein and protein–metabolite interaction networks gleaned from public database toinform the process of feature identification from metabolomicsdata, in addition to the identification of relevant molecular inter-action subnetworks.150 Unfortunately, PIUmet is proprietary andaccess is currently only available online.
Currently, most enrichment and interaction-based analysesheavily rely on annotation databases, which comprise another areawhere advances may be made. The most complete and best-annotated databases are determined based on genes, whichare useful in proteomics only after mapping identified proteinproducts to their corresponding cognate genes. As a result, theunderlying models tend to lose information regarding specificprotein isoforms, post-translational modification sites, and mole-cular functions and associations. Continuing to build out andimprove the quality and breadth of integrative omics analysis toolsthat exploit user defined protein–protein interactions, proteinmodification sites, and protein–metabolite interaction informationwill be an important endeavor to enhance the informativeness ofintegrative studies. Where some analysis tools are currently capableof incorporating known (curated) interactions into the multi-omicpipeline, these models still represent an over-simplification ofcomplex biological network topologies. Details known to be impor-tant for driving biological processes, such as macromolecularstructure, interaction binding kinetics, equilibrium states, andspatiotemporal control, are not incorporated into most analyses.Borrowing from the fields of Bioengineering and Physics, there ishope for more advanced models of dynamical systems and theirapplication to omics data analysis to drive better understanding ofthe molecular mechanisms driving cell biology.151,152 Developinginnovative computational tools to make the application of suchintegrative models more accessible to more biological researchersand robust enough for a variety of use cases will remain achallenge. However, the potential exists to be able to more accu-rately describe changes in biological systems and to better predictcellular responses to genetic and interventional perturbations, forexample in the case of combinatorial therapeutics.
Conclusion
Advances in sample preparation techniques, instrumentation,analysis software, and public annotation databases have
Molecular Omics Review
Ope
n A
cces
s A
rtic
le. P
ublis
hed
on 1
3 Se
ptem
ber
2018
. Dow
nloa
ded
on 3
/16/
2022
7:0
8:27
AM
. T
his
artic
le is
lice
nsed
und
er a
Cre
ativ
e C
omm
ons
Attr
ibut
ion-
Non
Com
mer
cial
3.0
Unp
orte
d L
icen
ce.
View Article Online
314 | Mol. Omics, 2018, 14, 307--319 This journal is©The Royal Society of Chemistry 2018
succeeded in permitting researchers to gain important insightsinto biological processes from combined proteomics and meta-bolomics studies. The closer integration of proteomics andmetabolomics workflows, from sample preparation to dataacquisition and network-based computational analysis, offersthe potential of elucidating a more comprehensive understandingof complex biological systems and their dynamical responses todiverse stimuli. Using a unified nLC-MS-based platform facilitatesjoint multi-omic analyses of complex biological specimenswith a streamlined instrumentation requirement, as well asmore consistent sample preparation, quantitative and qualitativeidentification of biomolecules, and integration of the resultingdata using pathway and network-based methods. Parallelproteomic and metabolomic-based multi-omic studies holdexciting promise for the near future of network systems biology.
Conflicts of interest
There are no conflicts of interest to declare.
Acknowledgements
The authors acknowledge constructive input from members ofthe Emili Lab (University of Toronto and Boston University) fortheir assistance in compiling supporting information. We alsothank Carl White, Ruth Isserlin and Sadhna Phanse (Universityof Toronto), as well as Indranil Paul, Kieran Wynne and WeiweiLin (Boston University) for sharing their expertise, sage adviceand critical insights that greatly improved the manuscript. Thiswork was supported in part by a Foundation Grant (FDN-148399)from the Canadian Institutes of Health Research of Canadato A. E., and by generous startup funds from Boston University.
References
1 F. Edfors, F. Danielsson and B. M. Hallstrom, et al., Gene-specific correlation of RNA and protein levels in humancells and tissues, Mol. Syst. Biol., 2016, 12(10), 883, DOI:10.15252/msb.20167144.
2 M. Mayr, B. Madhu and Q. Xu, Proteomics and meta-bolomics combined in cardiovascular research, TrendsCardiovasc. Med., 2007, 17(2), 43–48, DOI: 10.1016/j.tcm.2006.11.004.
3 J. R. Yates, C. I. Ruse and A. Nakorchevsky, Proteomics by massspectrometry: approaches, advances, and applications, Annu.Rev. Biomed. Eng., 2009, 11(1), 49–79, DOI: 10.1146/annurev-bioeng-061008-124934.
4 A. Bensimon, A. J. R. Heck and R. Aebersold, Massspectrometry-based proteomics and network biology,Annu. Rev. Biochem., 2012, 81(1), 379–405, DOI: 10.1146/annurev-biochem-072909-100424.
5 Y. V. Karpievitch, A. D. Polpitiya, G. A. Anderson, R. D.Smith and A. R. Dabney, Liquid Chromatography MassSpectrometry-Based Proteomics: Biological and Technological
Aspects, Ann. Appl. Stat., 2010, 4(4), 1797–1823, DOI: 10.1214/10-AOAS341.
6 Y. Zhao and O. N. Jensen, Modification-specific proteo-mics: strategies for characterization of post-translationalmodifications using enrichment techniques, Proteomics,2009, 9(20), 4632–4641, DOI: 10.1002/pmic.200900398.
7 J. E. Peironcely, T. Reijmers, L. Coulier, A. Bender andT. Hankemeier, Understanding and classifying metabolitespace and metabolite-likeness, PLoS One, 2011, 6(12), e28966,DOI: 10.1371/journal.pone.0028966.
8 M. Schrader and P. Schulz-Knappe, Peptidomics technolo-gies for human body fluids, Trends Biotechnol., 2001, 19(10suppl), S55–S60, DOI: 10.1016/S0167-7799(01)01800-5.
9 P. Schulz-Knappe, M. Schrader and H.-D. Zucht,The peptidomics concept, Comb. Chem. High ThroughputScreening, 2005, 8(8), 697–704.
10 M. M. Jost, P. Budde and H. Tammen, et al., The conceptof functional peptidomics for the discovery of bioactivepeptides in cell culture models, Comb. Chem. HighThroughput Screening, 2005, 8(8), 767–773.
11 B. Zhou, J. F. Xiao, L. Tuli and H. W. Ressom, LC-MS-basedmetabolomics, Mol. BioSyst., 2012, 8(2), 470–481, DOI:10.1039/c1mb05350g.
12 G. A. Theodoridis, H. G. Gika, E. J. Want and I. D. Wilson,Liquid chromatography-mass spectrometry based globalmetabolite profiling: a review, Anal. Chim. Acta, 2012, 711,7–16, DOI: 10.1016/j.aca.2011.09.042.
13 D. Vuckovic, Current trends and challenges in sample prepara-tion for global metabolomics using liquid chromatography-mass spectrometry, Anal. Bioanal. Chem., 2012, 403(6),1523–1548, DOI: 10.1007/s00216-012-6039-y.
14 B.-S. Chen and C.-C. Wu, Systems biology as an integratedplatform for bioinformatics, systems synthetic biology,and systems metabolic engineering, Cells, 2013, 2(4),635–688, DOI: 10.3390/cells2040635.
15 C. Coman, F. A. Solari, A. Hentschel, A. Sickmann, R. P. Zahediand R. Ahrends, Simultaneous Metabolite, Protein, LipidExtraction (SIMPLEX): A Combinatorial Multimolecular OmicsApproach for Systems Biology, Mol. Cell. Proteomics, 2016,15(4), 1453–1466, DOI: 10.1074/mcp.M115.053702.
16 S. C. Sapcariu, T. Kanashova, D. Weindl, J. Ghelfi,G. Dittmar and K. Hiller, Simultaneous extraction ofproteins and metabolites from cells in culture, MethodsX,2014, 1, 74–80, DOI: 10.1016/j.mex.2014.07.002.
17 R. Fischer, P. Bowness and B. M. Kessler, Two birds withone stone: doing metabolomics with your proteomics kit,Proteomics, 2013, 13(23–24), 3371–3386, DOI: 10.1002/pmic.201300192.
18 K. Dettmer, P. A. Aronov and B. D. Hammock, Massspectrometry-based metabolomics, Mass Spectrom. Rev.,2007, 26(1), 51–78, DOI: 10.1002/mas.20108.
19 W. B. Dunn and D. I. Ellis, Metabolomics: current analyticalplatforms and methodologies, TrAC, Trends Anal. Chem.,2005, 24(4), 285–294, DOI: 10.1016/j.trac.2004.11.021.
20 H. Cheng, G. Sun, K. Yang, R. W. Gross and X. Han,Selective desorption/ionization of sulfatides by MALDI-MS
Review Molecular Omics
Ope
n A
cces
s A
rtic
le. P
ublis
hed
on 1
3 Se
ptem
ber
2018
. Dow
nloa
ded
on 3
/16/
2022
7:0
8:27
AM
. T
his
artic
le is
lice
nsed
und
er a
Cre
ativ
e C
omm
ons
Attr
ibut
ion-
Non
Com
mer
cial
3.0
Unp
orte
d L
icen
ce.
View Article Online
This journal is©The Royal Society of Chemistry 2018 Mol. Omics, 2018, 14, 307--319 | 315
facilitated using 9-aminoacridine as matrix, J. Lipid Res.,2010, 51(6), 1599–1609, DOI: 10.1194/jlr.D004077.
21 J. M. Buscher, D. Czernik, J. C. Ewald, U. Sauer andN. Zamboni, Cross-platform comparison of methods forquantitative metabolomics of primary metabolism, Anal.Chem., 2009, 81(6), 2135–2143, DOI: 10.1021/ac8022857.
22 H. John, F. Breyer, J. O. Thumfart, H. Hochstetter andH. Thiermann, Matrix-assisted laser desorption/ionizationtime-of-flight mass spectrometry (MALDI-TOF MS) fordetection and identification of albumin phosphylation byorganophosphorus pesticides and G- and V-type nerveagents, Anal. Bioanal. Chem., 2010, 398(6), 2677–2691,DOI: 10.1007/s00216-010-4076-y.
23 C. J. Bolten, P. Kiefer, F. Letisse, J.-C. Portais and C. Wittmann,Sampling for metabolome analysis of microorganisms, Anal.Chem., 2007, 79(10), 3843–3849, DOI: 10.1021/ac0623888.
24 M. Rosa, C. J. Roberts and M. A. Rodrigues, Connectinghigh-temperature and low-temperature protein stabilityand aggregation, PLoS One, 2017, 12(5), e0176748, DOI:10.1371/journal.pone.0176748.
25 R. L. Gundry, M. Y. White and C. I. Murray, et al., Prepara-tion of proteins and peptides for mass spectrometry ana-lysis in a bottom-up proteomics workflow, Curr. Protoc.Mol. Biol., 2009, ch. 10(1), Unit 10.25–10.25.23, DOI:10.1002/0471142727.mb1025s88.
26 D. G. Sitnikov, C. S. Monnin and D. Vuckovic, SystematicAssessment of Seven Solvent and Solid-Phase ExtractionMethods for Metabolomics Analysis of Human Plasma byLC-MS, Sci. Rep., 2016, 6(1), 38885, DOI: 10.1038/srep38885.
27 E. Rogatsky and D. Stein, Evaluation of matrix effect andchromatography efficiency: new parameters for validationof method development, J. Am. Soc. Mass Spectrom, 2005,16(11), 1757–1759, DOI: 10.1016/j.jasms.2005.07.012.
28 B. K. Matuszewski, M. L. Constanzer and C. M. Chavez-Eng, Matrix effect in quantitative LC/MS/MS analyses ofbiological fluids: a method for determination of finasteridein human plasma at picogram per milliliter concentrations,Anal. Chem., 1998, 70(5), 882–889.
29 M. S. Chang, Q. Ji, J. Zhang and T. A. El-Shourbagy,Historical review of sample preparation for chromato-graphic bioanalysis: pros and cons, Drug Dev. Res., 2007,68(3), 107–133, DOI: 10.1002/ddr.20173.
30 H. Stahnke, S. Kittlaus, G. Kempe and L. Alder, Reductionof matrix effects in liquid chromatography-electrosprayionization-mass spectrometry by dilution of the sampleextracts: how much dilution is needed?, Anal. Chem., 2012,84(3), 1474–1482, DOI: 10.1021/ac202661j.
31 G. Theodoridis, H. G. Gika and I. D. Wilson, LC-MS-basedmethodology for global metabolite profiling in metabo-nomics/metabolomics, TrAC, Trends Anal. Chem., 2008,27(3), 251–260, DOI: 10.1016/j.trac.2008.01.008.
32 L. Wang, Z. Pi, S. Liu, Z. Liu and F. Song, Targetedmetabolome profiling by dual-probe microdialysissampling and treatment using Gardenia jasminoides forrats with type 2 diabetes, Sci. Rep., 2017, 7(1), 10105, DOI:10.1038/s41598-017-10172-w.
33 S. Tiziani, A.-H. Emwas and A. Lodi, et al., Optimizedmetabolite extraction from blood serum for 1H nuclearmagnetic resonance spectroscopy, Anal. Biochem., 2008,377(1), 16–23, DOI: 10.1016/j.ab.2008.01.037.
34 P. Jonsson, J. Gullberg and A. Nordstrom, et al., A strategyfor identifying differences in large series of metabolomicsamples analyzed by GC/MS, Anal. Chem., 2004, 76(6),1738–1745, DOI: 10.1021/ac0352427.
35 W. Weckwerth, K. Wenzel and O. Fiehn, Process for theintegrated extraction identification, and quantification ofmetabolites, proteins and RNA to reveal their co-regulationin biochemical networks, Proteomics, 2004, 4(1), 78–83,DOI: 10.1002/pmic.200200500.
36 U. Roessner, C. Wagner, J. Kopka, R. N. Trethewey andL. Willmitzer, Technical advance: simultaneous analysis ofmetabolites in potato tuber by gas chromatography-massspectrometry, Plant J., 2000, 23(1), 131–142.
37 G. Colebatch, G. Desbrosses and T. Ott, et al., Global changesin transcription orchestrate metabolic differentiation duringsymbiotic nitrogen fixation in Lotus japonicus, Plant J., 2004,39(4), 487–512, DOI: 10.1111/j.1365-313X.2004.02150.x.
38 A. Aharoni, C. H. Ric de Vos and H. A. Verhoeven, et al.,Nontargeted Metabolome Analysis by use of Fourier Trans-form Ion Cyclotron Mass Spectrometry, OMICS, 2002, 6(3),217–234, DOI: 10.1089/15362310260256882.
39 O. Fiehn, J. Kopka, R. N. Trethewey and L. Willmitzer,Identification of uncommon plant metabolites based oncalculation of elemental compositions using gas chroma-tography and quadrupole mass spectrometry, Anal. Chem.,2000, 72(15), 3573–3580.
40 J. Gullberg, P. Jonsson, A. Nordstrom, M. Sjostrom andT. Moritz, Design of experiments: an efficient strategy toidentify factors influencing extraction and derivatization ofArabidopsis thaliana samples in metabolomic studies withgas chromatography/mass spectrometry, Anal. Biochem.,2004, 331(2), 283–295, DOI: 10.1016/j.ab.2004.04.037.
41 A. David, A. Abdul-Sada, A. Lange, C. R. Tyler andE. M. Hill, A new approach for plasma (xeno)metabolomicsbased on solid-phase extraction and nanoflow liquidchromatography-nanoelectrospray ionisation mass spectro-metry, J. Chromatogr. A, 2014, 1365, 72–85, DOI: 10.1016/j.chroma.2014.09.001.
42 Y. Zhang, B. R. Fonslow, B. Shan, M.-C. Baek andJ. R. Yates, Protein analysis by shotgun/bottom-up proteo-mics, Chem. Rev., 2013, 113(4), 2343–2394, DOI: 10.1021/cr3003533.
43 F. Vorreiter, S. Richter, M. Peter, S. Baumann, M. Bergenvon and J. M. Tomm, Comparison and optimization ofmethods for the simultaneous extraction of DNA, RNA,proteins, and metabolites, Anal. Biochem., 2016, 508,25–33, DOI: 10.1016/j.ab.2016.05.011.
44 T. S. Batth, M. Papetti, A. Pfeiffer, M. A. X. Tollenaere,C. Francavilla and J. V. Olsen, Large-Scale PhosphoproteomicsReveals Shp-2 Phosphatase-Dependent Regulators of PdgfReceptor Signaling, Cell Rep., 2018, 22(10), 2784–2796, DOI:10.1016/j.celrep.2018.02.038.
Molecular Omics Review
Ope
n A
cces
s A
rtic
le. P
ublis
hed
on 1
3 Se
ptem
ber
2018
. Dow
nloa
ded
on 3
/16/
2022
7:0
8:27
AM
. T
his
artic
le is
lice
nsed
und
er a
Cre
ativ
e C
omm
ons
Attr
ibut
ion-
Non
Com
mer
cial
3.0
Unp
orte
d L
icen
ce.
View Article Online
316 | Mol. Omics, 2018, 14, 307--319 This journal is©The Royal Society of Chemistry 2018
45 B. Bai, H. Tan and V. R. Pagala, et al., Deep Profiling ofProteome and Phosphoproteome by Isobaric Labeling,Extensive Liquid Chromatography, and Mass Spectrometry,Elsevier Inc., 1st edn, 2017, vol. 585, pp. 377–395, DOI:10.1016/bs.mie.2016.10.007.
46 J.-M. Ahn, H.-J. Sung and Y.-H. Yoon, et al., Integratedglycoproteomics demonstrates fucosylated serum paraoxonase1 alterations in small cell lung cancer, Mol. Cell. Proteomics,2014, 13(1), 30–48, DOI: 10.1074/mcp.M113.028621.
47 W. Kim, E. J. Bennett and E. L. Huttlin, et al., Systematicand Quantitative Assessment of the Ubiquitin-ModifiedProteome, Mol. Cell, 2011, 44(2), 325–340, DOI: 10.1016/j.molcel.2011.08.025.
48 Y. Hu, P. Shah, D. J. Clark, M. Ao and H. Zhang, Reanalysisof global proteomic and phosphoproteomic data identifieda large number of glycopeptides, Anal. Chem., 2018, 90(13),8065–8071, DOI: 10.1101/233247.
49 D. R. Jones, Z. Wu, D. Chauhan, K. C. Anderson and J. Peng,A nano ultra-performance liquid chromatography-high reso-lution mass spectrometry approach for global metabolomicprofiling and case study on drug-resistant multiple myeloma,Anal. Chem., 2014, 86(7), 3667–3675, DOI: 10.1021/ac500476a.
50 A. J. Chetwynd, A. Abdul-Sada and E. M. Hill, Solid-Phase Extraction and Nanoflow Liquid Chromatography-Nanoelectrospray Ionization Mass Spectrometry forImproved Global Urine Metabolomics, Anal. Chem., 2014,87(2), 1158–1165, DOI: 10.1021/ac503769q.
51 X. Luo and L. Li, Metabolomics of Small Numbers of Cells:Metabolomic Profiling of 100, 1000, and 10000 Human BreastCancer Cells, Anal. Chem., 2017, 89(21), 11664–11671, DOI:10.1021/acs.analchem.7b03100.
52 Z. Li, J. Tatlay and L. Li, Nanoflow LC-MS for High-Performance Chemical Isotope Labeling QuantitativeMetabolomics, Anal. Chem., 2015, 87(22), 11468–11474,DOI: 10.1021/acs.analchem.5b03209.
53 R. Fischer, D. C. Trudgian and C. Wright, et al., Discoveryof candidate serum proteomic and metabolomic biomar-kers in ankylosing spondylitis, Mol. Cell. Proteomics, 2012,11(2), M111.013904, DOI: 10.1074/mcp.M111.013904.
54 S. Becker, L. Kortz, C. Helmschrodt, J. Thiery andU. Ceglarek, LC-MS-based metabolomics in the clinicallaboratory, J. Chromatogr. B: Anal. Technol. Biomed. Life Sci.,2012, 883–884, 68–75, DOI: 10.1016/j.jchromb.2011.10.018.
55 J.-P. Antignac, K. de Wasch, F. Monteau, H. De Brabander,F. Andre and B. Le Bizec, The ion suppression phenomenonin liquid chromatography–mass spectrometry and its con-sequences in the field of residue analysis, Anal. Chim. Acta,2005, 529(1–2), 129–136, DOI: 10.1016/j.aca.2004.08.055.
56 T. O. Metz, J. S. Page and E. S. Baker, et al., High-resolutionseparations and improved ion production and transmis-sion in metabolomics, TrAC, Trends Anal. Chem., 2008,27(3), 205–214, DOI: 10.1016/j.trac.2007.11.003.
57 E. R. Wickremsinhe, G. Singh, B. L. Ackermann, T. A.Gillespie and A. K. Chaudhary, A review of nanoelectro-spray ionization applications for drug metabolism andpharmacokinetics, Curr. Drug Metab., 2006, 7(8), 913–928.
58 J. P. Chervet, M. Ursem and J. P. Salzmann, Instrumentalrequirements for nanoscale liquid chromatography, Anal.Chem., 1996, 68(9), 1507–1512, DOI: 10.1021/ac9508964.
59 M. Wilm and M. Mann, Analytical properties of the nano-electrospray ion source, Anal. Chem., 1996, 68(1), 1–8.
60 I. Marginean, K. Tang, R. D. Smith and R. T. Kelly, Pico-electrospray ionization mass spectrometry using narrow-bore chemically etched emitters, J. Am. Soc. Mass Spectrom,2014, 25(1), 30–36, DOI: 10.1007/s13361-013-0749-z.
61 M. Karas, U. Bahr and T. Dulcks, Nano-electrospray ioniza-tion mass spectrometry: addressing analytical problemsbeyond routine, Fresenius’ J. Anal. Chem., 2000, 366(6–7),669–676.
62 I. Marginean, R. T. Kelly, D. C. Prior, B. L. LaMarche,K. Tang and R. D. Smith, Analytical characterization of theelectrospray ion source in the nanoflow regime, Anal.Chem., 2008, 80(17), 6573–6579, DOI: 10.1021/ac800683s.
63 A. J. Chetwynd, A. David, E. M. Hill and A. Abdul-Sada,Evaluation of analytical performance and reliability ofdirect nanoLC-nanoESI-high resolution mass spectrometryfor profiling the (xeno)metabolome, J. Mass Spectrom.,2014, 49(10), 1063–1069, DOI: 10.1002/jms.3426.
64 R. Garcıa-Villalba, A. Carrasco-Pancorbo and G. Zurek, et al.,Nano and rapid resolution liquid chromatography-electrosprayionization-time of flight mass spectrometry to identify andquantify phenolic compounds in olive oil, J. Sep. Sci., 2010,33(14), 2069–2078, DOI: 10.1002/jssc.201000184.
65 W. Lu, B. D. Bennett and J. D. Rabinowitz, Analyticalstrategies for LC-MS-based targeted metabolomics,J. Chromatogr. B: Anal. Technol. Biomed. Life Sci., 2008,871(2), 236–242, DOI: 10.1016/j.jchromb.2008.04.031.
66 R. D. Smith, Y. Shen and K. Tang, Ultrasensitive andquantitative analyses from combined separations-massspectrometry for the characterization of proteomes, Acc.Chem. Res., 2004, 37(4), 269–278, DOI: 10.1021/ar0301330.
67 J. S. Page, R. T. Kelly, K. Tang and R. D. Smith, Ionizationand transmission efficiency in an electrospray ionization-mass spectrometry interface, J. Am. Soc. Mass Spectrom,2007, 18(9), 1582–1590, DOI: 10.1016/j.jasms.2007.05.018.
68 X. Shi, B. Wahlang and X. Wei, et al., Metabolomic Analysisof the Effects of Polychlorinated Biphenyls in NonalcoholicFatty Liver Disease, J. Proteome Res., 2012, 11(7), 3805–3815,DOI: 10.1021/pr300297z.
69 A. D. Southam, T. G. Payne, H. J. Cooper, T. N. Arvanitis andM. R. Viant, Dynamic range and mass accuracy of wide-scandirect infusion nanoelectrospray fourier transform ion cyclo-tron resonance mass spectrometry-based metabolomicsincreased by the spectral stitching method, Anal. Chem.,2007, 79(12), 4595–4602, DOI: 10.1021/ac062446p.
70 H. Wu, A. D. Southam, A. Hines and M. R. Viant,High-throughput tissue extraction protocol for NMR- andMS-based metabolomics, Anal. Biochem., 2008, 372(2),204–212, DOI: 10.1016/j.ab.2007.10.002.
71 K. O. Boernsen, S. Gatzek and G. Imbert, Controlledprotein precipitation in combination with chip-basednanospray infusion mass spectrometry. An approach for
Review Molecular Omics
Ope
n A
cces
s A
rtic
le. P
ublis
hed
on 1
3 Se
ptem
ber
2018
. Dow
nloa
ded
on 3
/16/
2022
7:0
8:27
AM
. T
his
artic
le is
lice
nsed
und
er a
Cre
ativ
e C
omm
ons
Attr
ibut
ion-
Non
Com
mer
cial
3.0
Unp
orte
d L
icen
ce.
View Article Online
This journal is©The Royal Society of Chemistry 2018 Mol. Omics, 2018, 14, 307--319 | 317
metabolomics profiling of plasma, Anal. Chem., 2005,77(22), 7255–7264, DOI: 10.1021/ac0508604.
72 E. Chekmeneva, G. D. S. Correia and Q. Chan, et al., Optimiza-tion and Application of Direct Infusion NanoelectrosprayHRMS Method for Large-Scale Urinary Metabolic Phenotypingin Molecular Epidemiology, J. Proteome Res., 2017, 16(4),1646–1658, DOI: 10.1021/acs.jproteome.6601003.
73 R.-J. Raterink, F. M. van der Kloet and J. Li, et al., Rapidmetabolic screening of early zebrafish embryogenesisbased on direct infusion-nanoESI-FTMS, Metabolomics,2013, 9(4), 864–873, DOI: 10.1007/s11306-012-0493-6.
74 N. S. Taylor, R. J. M. Weber and A. D. Southam, et al.,A new approach to toxicity testing in Daphnia magna:application of high throughput FT-ICR mass spectrometrymetabolomics, Metabolomics, 2009, 5(1), 44–58, DOI:10.1007/s11306-008-0133-3.
75 J.-M. Dethy, B. L. Ackermann, C. Delatour, J. D. Henionand G. A. Schultz, Demonstration of direct bioanalysis ofdrugs in plasma using nanoelectrospray infusion from asilicon chip coupled with tandem mass spectrometry, Anal.Chem., 2003, 75(4), 805–811.
76 C. E. C. A. Hop, Y. Chen and L. J. Yu, Uniformity ofionization response of structurally diverse analytes usinga chip-based nanoelectrospray ionization source, RapidCommun. Mass Spectrom., 2005, 19(21), 3139–3142, DOI:10.1002/rcm.2182.
77 E. Chekmeneva, G. Correia and J. Denes, et al., Develop-ment of nanoelectrospray high resolution isotope dilutionmass spectrometry for targeted quantitative analysis ofurinary metabolites: application to population profiling andclinical studies, Anal. Methods, 2015, 7(12), 5122–5133, DOI:10.1039/c5ay00850f.
78 J. Sestak, D. Moravcova and V. Kahle, Instrument plat-forms for nano liquid chromatography, J. Chromatogr. A,2015, 1421, 2–17, DOI: 10.1016/j.chroma.2015.07.090.
79 M. Noga, F. Sucharski, P. Suder and J. Silberring, A practicalguide to nano-LC troubleshooting, J. Sep. Sci., 2007, 30(14),2179–2189, DOI: 10.1002/jssc.200700225.
80 A. J. Chetwynd, A. Abdul-Sada, S. G. Holt and E. M. Hill,Use of a pre-analysis osmolality normalisation method tocorrect for variable urine concentrations and for improvedmetabolomic analyses, J. Chromatogr. A, 2016, 1431,103–110, DOI: 10.1016/j.chroma.2015.12.056.
81 A. J. Chetwynd, A. Samarawickrama and J. H. Vera, et al.,Nanoflow-Nanospray Mass Spectrometry MetabolomicsReveals Disruption of the Urinary Metabolite Profilesof HIV-Positive Patients on Combination AntiretroviralTherapy, J. Acquired Immune Defic. Syndr., 2017, 74(2),e45–e53, DOI: 10.1097/QAI.0000000000001159.
82 S. Medina, F. Ferreres and C. Garcıa-Viguera, et al., Non-targeted metabolomic approach reveals urinary meta-bolites linked to steroid biosynthesis pathway after ingestionof citrus juice, Food Chem., 2013, 136(2), 938–946, DOI:10.1016/j.foodchem.2012.09.004.
83 M. L. Stoll, R. Kumar, E. J. Lefkowitz, R. Q. Cron,C. D. Morrow and S. Barnes, Fecal metabolomics in
pediatric spondyloarthritis implicate decreased metabolicdiversity and altered tryptophan metabolism as pathogenicfactors, Genes Immun., 2016, 17(7), 400–405, DOI: 10.1038/gene.2016.38.
84 A. S. Kononikhin, N. L. Starodubtseva and V. V. Chagovets,et al., Exhaled breath condensate analysis from intubatednewborns by nano-HPLC coupled to high resolution MS,J. Chromatogr. B: Anal. Technol. Biomed. Life Sci., 2017,1047, 97–105, DOI: 10.1016/j.jchromb.2016.12.036.
85 K. T. Myint, K. Aoshima, S. Tanaka, T. Nakamura andY. Oda, Quantitative profiling of polar cationic metabolitesin human cerebrospinal fluid by reversed-phase nanoli-quid chromatography/mass spectrometry, Anal. Chem.,2009, 81(3), 1121–1129, DOI: 10.1021/ac802259r.
86 A. David, A. Lange, A. Abdul-Sada, C. R. Tyler andE. M. Hill, Disruption of the Prostaglandin Metabolomeand Characterization of the Pharmaceutical Exposome inFish Exposed to Wastewater Treatment Works Effluent AsRevealed by Nanoflow-Nanospray Mass Spectrometry-Based Metabolomics, Environ. Sci. Technol., 2017, 51(1),616–624, DOI: 10.1021/acs.est.6b04365.
87 J. Hernandez-Borges, Z. Aturki and A. Rocco, Fanali S. Recentapplications in nanoliquid chromatography, J. Sep. Sci., 2007,30(11), 1589–1610, DOI: 10.1002/jssc.200700061.
88 G. A. Valaskovic, J. P. Murphy and M. S. Lee, Automatedorthogonal control system for electrospray ionization,J. Am. Soc. Mass Spectrom, 2004, 15(8), 1201–1215, DOI:10.1016/j.jasms.2004.04.033.
89 C. E. D. Nazario, M. R. Silva, M. S. Franco and F. M. Lanças,Evolution in miniaturized column liquid chromatographyinstrumentation and applications: An overview, J. Chromatogr.A, 2015, 1421, 18–37, DOI: 10.1016/j.chroma.2015.08.051.
90 Y. Saito, K. Jinno and T. Greibrokk, Capillary columns inliquid chromatography: between conventional columnsand microchips, J. Sep. Sci., 2004, 27(17–18), 1379–1390.
91 D. A. Collins, E. P. Nesterenko and B. Paull, Porous layeropen tubular columns in capillary liquid chromatography,Analyst, 2014, 139(6), 1292–1302, DOI: 10.1039/c3an01869e.
92 M. Hilhorst, C. Briscoe and N. van de Merbel, Sense andnonsense of miniaturized LC-MS/MS for bioanalysis, Bioa-nalysis, 2014, 6(24), 3263–3265, DOI: 10.4155/bio.14.263.
93 M. Motokawa, H. Kobayashi and N. Ishizuka, et al., Mono-lithic silica columns with various skeleton sizes andthrough-pore sizes for capillary liquid chromatography,J. Chromatogr. A, 2002, 961(1), 53–63.
94 E. J. Want, I. D. Wilson and H. Gika, et al., Global metabolicprofiling procedures for urine using UPLC-MS, Nat. Protoc.,2010, 5(6), 1005–1018, DOI: 10.1038/nprot.2010.50.
95 P. Kiefer, N. Delmotte and J. A. Vorholt, Nanoscale ion-pairreversed-phase HPLC-MS for sensitive metabolome analysis,Anal. Chem., 2011, 83(3), 850–855, DOI: 10.1021/ac102445r.
96 L. Imbert, M. Gaudin and D. Libong, et al., Comparison ofelectrospray ionization, atmospheric pressure chemical ioniza-tion and atmospheric pressure photoionization for a lipidomicanalysis of Leishmania donovani, J. Chromatogr. A, 2012, 1242,75–83, DOI: 10.1016/j.chroma.2012.04.035.
Molecular Omics Review
Ope
n A
cces
s A
rtic
le. P
ublis
hed
on 1
3 Se
ptem
ber
2018
. Dow
nloa
ded
on 3
/16/
2022
7:0
8:27
AM
. T
his
artic
le is
lice
nsed
und
er a
Cre
ativ
e C
omm
ons
Attr
ibut
ion-
Non
Com
mer
cial
3.0
Unp
orte
d L
icen
ce.
View Article Online
318 | Mol. Omics, 2018, 14, 307--319 This journal is©The Royal Society of Chemistry 2018
97 F. Lopes, D. A. Cowan, M. Thevis, A. Thomas andM. C. Parkin, Quantification of intact human insulin-likegrowth factor-I in serum by nano-ultrahigh-performanceliquid chromatography/tandem mass spectrometry, RapidCommun. Mass Spectrom., 2014, 28(13), 1426–1432, DOI:10.1002/rcm.6908.
98 G. T. T. Gibson, S. M. Mugo and R. D. Oleschuk, Nanoe-lectrospray emitters: trends and perspective, Mass Spec-trom. Rev., 2009, 28(6), 918–936, DOI: 10.1002/mas.20248.
99 R. T. Kelly, J. S. Page and Q. Luo, et al., Chemically etchedopen tubular and monolithic emitters for nanoelectros-pray ionization mass spectrometry, Anal. Chem., 2006,78(22), 7796–7801, DOI: 10.1021/ac061133r.
100 W. Shui, Y. Yu, X. Xu, Z. Huang, G. Xu and P. Yang, Micro-electrospray with stainless steel emitters, Rapid Commun.Mass Spectrom., 2003, 17(14), 1541–1547, DOI: 10.1002/rcm.1083.
101 W. Xiong, J. Glick, Y. Lin and P. Vouros, Separation andsequencing of isomeric oligonucleotide adducts usingmonolithic columns by ion-pair reversed-phase nano-HPLC coupled to ion trap mass spectrometry, Anal. Chem.,2007, 79(14), 5312–5321, DOI: 10.1021/ac0701435.
102 C. D. Kelstrup, D. B. Bekker-Jensen, T. N. Arrey,A. Hogrebe, A. Harder and J. V. Olsen, Performance Eva-luation of the Q Exactive HF-X for Shotgun Proteomics,J. Proteome Res., 2017, 17(1), 727–738, DOI: 10.1021/acs.jproteome.7b00602.
103 C. A. Crutchfield, W. Lu, E. Melamud and J. D. Rabinowitz,Mass Spectrometry-Based Metabolomics of Yeast, MethodsEnzymol., 2010, 470, 393–426, DOI: 10.1016/S0076-6879(10)70016-1.
104 P. A. Rudnick, S. P. Markey and J. Roth, et al., A Description ofthe Clinical Proteomic Tumor Analysis Consortium (CPTAC)Common Data Analysis Pipeline, J. Proteome Res., 2016, 15(3),1023–1032, DOI: 10.1021/acs.jproteome.5b01091.
105 J. Barretina, G. Caponigro and N. Stransky, et al., TheCancer Cell Line Encyclopedia enables predictive model-ling of anticancer drug sensitivity, Nature, 2012, 483(7391),603–607, DOI: 10.1038/nature11003.
106 Network TCGAR, B. J. Raphael and R. H. Hruban, et al.,Integrated Genomic Characterization of Pancreatic DuctalAdenocarcinoma, Cancer Cell, 2017, 32(2), 185–203, DOI:10.1016/j.ccell.2017.07.007.
107 T. U. Consortium, UniProt: the universal protein knowl-edgebase, Nucleic Acids Res., 2016, 45(D1), D158–D169,DOI: 10.1093/nar/gkw1099.
108 M. Hirosawa, M. Hoshida, M. Ishikawa and T. Toya, MASCOT:multiple alignment system for protein sequences basedon three-way dynamic programming, CABIOS, Comput.Appl. Biosci., 1993, 9(2), 161–167.
109 R. Craig and R. C. Beavis, TANDEM: matching proteinswith tandem mass spectra, Bioinformatics, 2004, 20(9),1466–1467, DOI: 10.1093/bioinformatics/bth092.
110 M. Brosch, S. Swamy, T. Hubbard and J. Choudhary,Comparison of Mascot and X!Tandem performance for lowand high accuracy mass spectrometry and the development
of an adjusted Mascot threshold, Mol. Cell. Proteomics, 2008,7(5), 962–970, DOI: 10.1074/mcp.M700293-MCP200.
111 D. L. Tabb, C. G. Fernando and M. C. Chambers, MyriMatch:highly accurate tandem mass spectral peptide identification bymultivariate hypergeometric analysis, J. Proteome Res., 2007,6(2), 654–661, DOI: 10.1021/pr0604054.
112 H. Lam, E. W. Deutsch, J. S. Eddes, J. K. Eng, S. E. Stein andR. Aebersold, Building consensus spectral libraries forpeptide identification in proteomics, Nat. Methods, 2008,5(10), 873–875, DOI: 10.1038/nmeth.1254.
113 J. K. Eng, T. A. Jahan and M. R. Hoopmann, Comet: anopen-source MS/MS sequence database search tool, Pro-teomics, 2013, 13(1), 22–24, DOI: 10.1002/pmic.201200439.
114 M. Vaudel, H. Barsnes, F. S. Berven, A. Sickmann andL. Martens, SearchGUI: an open-source graphical userinterface for simultaneous OMSSA and X!Tandemsearches, Proteomics, 2011, 11(5), 996–999, DOI: 10.1002/pmic.201000595.
115 Z. Zhang, M. Burke and Y. A. Mirokhin, et al., Reverse andRandom Decoy Methods for False Discovery Rate Estima-tion in High Mass Accuracy Peptide Spectral LibrarySearches, J. Proteome Res., 2018, 17(2), 846–857, DOI:10.1021/acs.jproteome.7b00614.
116 G. W. Park, H. Hwang and K. H. Kim, et al., IntegratedProteomic Pipeline Using Multiple Search Engines for aProteogenomic Study with a Controlled Protein False Dis-covery Rate, J. Proteome Res., 2016, 15(11), 4082–4090, DOI:10.1021/acs.jproteome.6b00376.
117 S. Tyanova, T. Temu and J. Cox, The MaxQuant computa-tional platform for mass spectrometry-based shotgun pro-teomics, Nat. Protoc., 2016, 11(12), 2301–2319, DOI:10.1038/nprot.2016.136.
118 J. Pfeuffer, T. Sachsenberg and O. Alka, et al., OpenMS - Aplatform for reproducible analysis of mass spectrometrydata, J. Biotechnol., 2017, 261, 142–148, DOI: 10.1016/j.jbiotec.2017.05.016.
119 F. Fournier, C. Joly Beauparlant and R. Paradis, Droit A.rTANDEM, an R/Bioconductor package for MS/MS proteinidentification, Bioinformatics, 2014, 30(15), 2233–2234,DOI: 10.1093/bioinformatics/btu178.
120 E. W. Deutsch, L. Mendoza, D. Shteynberg, J. Slagel, Z. Sunand R. L. Moritz, Trans-Proteomic Pipeline, a standardizeddata processing pipeline for large-scale reproducible pro-teomics informatics, Proteomics Clin Appl, 2015, 9(7-8),745–754, DOI: 10.1002/prca.201400164.
121 S. Kim and P. A. Pevzner, MS-GF+ makes progress towardsa universal database search tool for proteomics, Nat.Commun., 2014, 5, 5277, DOI: 10.1038/ncomms6277.
122 C. A. Smith, G. O’Maille and E. J. Want, et al., METLIN: ametabolite mass spectral database, Ther. Drug Monit.,2005, 27(6), 747–751.
123 D. S. Wishart, Y. D. Feunang and A. Marcu, et al., HMDB 4.0:the human metabolome database for 2018, Nucleic AcidsRes., 2017, 46(D1), D608–D617, DOI: 10.1093/nar/gkx1089.
124 I. Blazenovic, T. Kind, J. Ji and O. Fiehn, Software Tools andApproaches for Compound Identification of LC-MS/MS
Review Molecular Omics
Ope
n A
cces
s A
rtic
le. P
ublis
hed
on 1
3 Se
ptem
ber
2018
. Dow
nloa
ded
on 3
/16/
2022
7:0
8:27
AM
. T
his
artic
le is
lice
nsed
und
er a
Cre
ativ
e C
omm
ons
Attr
ibut
ion-
Non
Com
mer
cial
3.0
Unp
orte
d L
icen
ce.
View Article Online
This journal is©The Royal Society of Chemistry 2018 Mol. Omics, 2018, 14, 307--319 | 319
Data in Metabolomics, Metabolites, 2018, 8(2), 31, DOI:10.3390/metabo8020031.
125 N. G. Mahieu and G. J. Patti, Systems-Level Annotation of aMetabolomics Data Set Reduces 25 000 Features to Fewerthan 1000 Unique Metabolites, Anal. Chem., 2017, 89(19),10397–10406, DOI: 10.1021/acs.analchem.7b02380.
126 M. C. Chambers, B. MacLean and R. Burke, et al., A cross-platform toolkit for mass spectrometry and proteomics, Nat.Biotechnol., 2012, 30(10), 918–920, DOI: 10.1038/nbt.2377.
127 T. Pluskal, S. Castillo, A. Villar-Briones and M. Oresic, MZmine2: modular framework for processing, visualizing, andanalyzing mass spectrometry-based molecular profile data,BMC Bioinf., 2010, 11(1), 395, DOI: 10.1186/1471-2105-11-395.
128 F. Fernandez-Albert, R. Llorach, C. Andres-Lacueva and A. Perera,An R package to analyse LC/MS metabolomic data: MAIT(Metabolite Automatic Identification Toolkit), Bioinformatics,2014, 30(13), 1937–1939, DOI: 10.1093/bioinformatics/btu136.
129 H. Tsugawa, T. Cajka and T. Kind, et al., MS-DIAL: data-independent MS/MS deconvolution for comprehensivemetabolome analysis, Nat. Methods, 2015, 12(6), 523–526,DOI: 10.1038/nmeth.3393.
130 C. A. Smith, E. J. Want, G. O’Maille, R. Abagyan andG. Siuzdak, XCMS: processing mass spectrometry datafor metabolite profiling using nonlinear peak alignment,matching, and identification, Anal. Chem., 2006, 78(3),779–787, DOI: 10.1021/ac051437y.
131 J. Xia, N. Psychogios, N. Young and D. S. Wishart, Metabo-Analyst: a web server for metabolomic data analysis andinterpretation, Nucleic Acids Res., 2009, 37(Web Serverissue), W652–W660, DOI: 10.1093/nar/gkp356.
132 T. Huan, E. M. Forsberg and D. Rinehart, et al., Systemsbiology guided by XCMS Online metabolomics, Nat. Methods,2017, 14(5), 461–462, DOI: 10.1038/nmeth.4260.
133 E. Kenar, H. Franken and S. Forcisi, et al., Automated label-freequantification of metabolites from liquid chromatography-mass spectrometry data, Mol. Cell. Proteomics, 2014,13(1), 348–359, DOI: 10.1074/mcp.M113.031278.
134 A. Cambiaghi, M. Ferrario and M. Masseroli, Analysis ofmetabolomic data: tools, current strategies and futurechallenges for omics data integration, Briefings Bioinf.,2017, 18(3), 498–510, DOI: 10.1093/bib/bbw031.
135 T. Valikangas, T. Suomi and L. L. Elo, A systematicevaluation of normalization methods in quantitativelabel-free proteomics, Briefings Bioinf., 2018, 19(1), 1–11,DOI: 10.1093/bib/bbw095.
136 M. E. Ritchie, B. Phipson and D. Wu, et al., limma powersdifferential expression analyses for RNA-sequencing andmicroarray studies, Nucleic Acids Res., 2015, 43(7), e47–e47,DOI: 10.1093/nar/gkv007.
137 M. Kuhn, Building Predictive Models in R Using the caretPackage, J. Stat. Softw., 2008, 28(5), 1–26.
138 F. Pedregosa, G. Varoquaux and A. Gramfort, et al., Scikit-learn: Machine Learning in Python, J. Mach. Learn. Res.,2011, 12(1), 2825–2830, DOI: 10.18637/jss.v033.i01.
139 A. Subramanian, P. Tamayo and V. K. Mootha, et al., Geneset enrichment analysis: a knowledge-based approach for
interpreting genome-wide expression profiles, Proc. Natl.Acad. Sci. U. S. A., 2005, 102(43), 15545–15550, DOI: 10.1073/pnas.0506580102.
140 M. V. Kuleshov, M. R. Jones and A. D. Rouillard, et al.,Enrichr: a comprehensive gene set enrichment analysisweb server 2016 update, Nucleic Acids Res., 2016, 44(W1),W90–W97, DOI: 10.1093/nar/gkw377.
141 J. Reimand, R. Isserlin and V. Voisin, et al., Pathwayenrichment analysis of -omics data, Genes, 2017, 8(10),246, DOI: 10.1101/232835.
142 F. Rohart, B. Gautier, A. Singh and K.-A. Le Cao, mixOmics:An R package for ‘omics feature selection and multiple dataintegration, PLoS Comput. Biol., 2017, 13(11), e1005752,DOI: 10.1371/journal.pcbi.1005752.
143 T.-C. Kuo, T.-F. Tian and Y. J. Tseng, 3Omics: a web-basedsystems biology tool for analysis, integration and visuali-zation of human transcriptomic, proteomic and metabo-lomic data, BMC Syst. Biol., 2013, 7(1), 64, DOI: 10.1186/1752-0509-7-64.
144 J. Eichner, L. Rosenbaum, C. Wrzodek, H.-U. Haring, A. Zelland R. Lehmann, Integrated enrichment analysis andpathway-centered visualization of metabolomics, proteomics,transcriptomics, and genomics data by using the InCroMAPsoftware, J. Chromatogr. B: Anal. Technol. Biomed. Life Sci.,2014, 966, 77–82, DOI: 10.1016/j.jchromb.2014.04.030.
145 E. B. Unterberger, J. Eichner and C. Wrzodek, et al., Ha-rasand beta-catenin oncoproteins orchestrate metabolic pro-grams in mouse liver tumors, Int. J. Cancer, 2014, 135(7),1574–1585, DOI: 10.1002/ijc.28798.
146 D. Szklarczyk, A. Santos, C. Mering von, L. J. Jensen,P. Bork and M. Kuhn, STITCH 5: augmenting protein-chemical interaction networks with tissue and affinitydata, Nucleic Acids Res., 2016, 44(D1), D380–D384, DOI:10.1093/nar/gkv1277.
147 E. Brunk, S. Sahoo and D. C. Zielinski, et al., Recon3Denables a three-dimensional view of gene variation inhuman metabolism, Nat. Biotechnol., 2018, 36(3),272–281, DOI: 10.1038/nbt.4072.
148 S. Razick, G. Magklaras and I. M. Donaldson, iRefIndex:a consolidated protein interaction database with provenance,BMC Bioinf., 2008, 9(1), 405, DOI: 10.1186/1471-2105-9-405.
149 N. Tuncbag, S. J. C. Gosline, A. Kedaigle, A. R. Soltis,A. Gitter and E. Fraenkel, Network-Based Interpretationof Diverse High-Throughput Datasets through the OmicsIntegrator Software Package, PLoS Comput. Biol., 2016,12(4), e1004879, DOI: 10.1371/journal.pcbi.1004879.
150 L. Pirhaji, P. Milani and M. Leidl, et al., Revealing disease-associated pathways by network integration of untargetedmetabolomics, Nat. Methods, 2016, 13(9), 770–776, DOI:10.1038/nmeth.3940.
151 J. Wang, Landscape and flux theory of non-equilibriumdynamical systems with application to biology, Adv. Phys.,2015, 64(1), 1–137, DOI: 10.1080/00018732.2015.1037068.
152 D. K. Wells, W. L. Kath and A. E. Motter, Control of Stochasticand Induced Switching in Biophysical Networks, Phys. Rev. X,2015, 5(3), 031036, DOI: 10.1103/PhysRevX.5.031036.
Molecular Omics Review
Ope
n A
cces
s A
rtic
le. P
ublis
hed
on 1
3 Se
ptem
ber
2018
. Dow
nloa
ded
on 3
/16/
2022
7:0
8:27
AM
. T
his
artic
le is
lice
nsed
und
er a
Cre
ativ
e C
omm
ons
Attr
ibut
ion-
Non
Com
mer
cial
3.0
Unp
orte
d L
icen
ce.
View Article Online