Embed Size (px)
Citation preview

Single Site Umbilical Laparoscopic Surgery
(SSULS)
George W. Holcomb, III, M.D., MBA
Surgeon-in-ChiefChildren’s Mercy Hospital
Kansas City, MO

Open Surgery
Laparoscopic Surgery
1) Less discomfort
2) Reduced hospitalization
3) Faster return to routine activities
4) Cosmesis

SSULS
Cosmesis, but less risky c/w
NOTES
Open Surgery Laparoscopic Surgery
NOTES
• Cosmesis, but risks

• SILS (TM) - Single Incision Laparoscopic Surgery
• SPA (TM) - Single Port Access
• SSULS - Single Site Umbilical Laparoscopic Surgery (CMH)
• SIPES – Single Incision Pediatric Endosurgery (CH-A)
All use umbilicus as single site.
Acronyms

Umbilical Portals (U.S.)
SILS Port(Covidien)
Tri - Port(Olympus)

Umbilical Portals (U.S.)

What Else Is Different?
Instruments are in-line and parallel to each other
Ideally, instruments/telescope should be different lengths

What Else Is Different?
Assistant/camera holder stands next to or behind the surgeon

What Else Is Different?Harder to operate

What Operations Are Being Done Using This SSULS Approach?
• Appendectomy
• Cholecystectomy
• Splenectomy
• Ileocecectomy
• Pyloromyotomy (CH-A)
• Fundoplication (CH-A)
• Others

SSULS Appendectomy

SSULS Appendectomy

SSULS Appendectomy
Please use this link if you experience problems viewing the video above.

Postoperative Appearance

SSULS Cholecystectomy
Please use this link if you experience problems viewing the video above.

SSULS Splenectomy
Please use this link if you experience problems viewing the video above.

SSULS Splenectomy

SSULS Ileocecectomy
•Intracorporeal dissection/mobilization
•Extracorporeal resection/anastomosis

Single-Incision Laparoscopic Surgery in Children: Initial Single-Center Experience
142 SSULS procedures:
• Appendectomy (103)
• Cholecystectomy (24)
• Splenectomy (2)
• Cholecystectomy/splenectomy (1)
• Ileocecectomy (8)
J Pediatr Surg 46:904-907, 2011J Pediatr Surg 46:904-907, 2011

ResultsResults
ProcedureProcedure Additional Additional portsports
Mean Op Mean Op time (min)time (min)
Mean LOS Mean LOS (days)(days)
ComplicationsComplications
Appendectomy (103) 10 34+/-16 1 6
Cholecystectomy (24)
2 73+/-28 1.5 0
Splenectomy
(2)0 90+/- 6 1.5 0
Cholecystectomy/splenectomy
(1)0 116 1 0
Ileocecectomy (8) 0 86+/-22 5 0
J Pediatr Surg 46:904-907, 2011J Pediatr Surg 46:904-907, 2011
SIPESCH - ALABAMA
Appendectomy - 130
Pyloromyotomy - 32
Cholecystectomy - 32
Fundoplication - 6
Pull-through - 4
204
Pediatr Surg Int 2010Pediatr Surg Int 2010

Conclusion
These series show that single site surgery is
feasible, and appears to be associated
with acceptable operating times
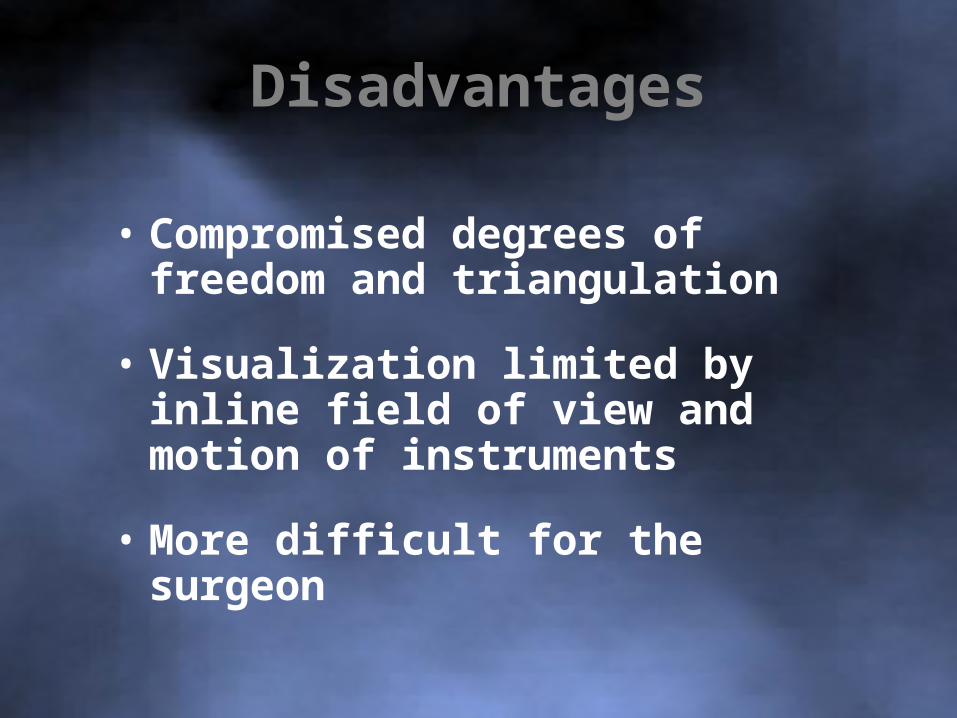
Disadvantages
• Compromised degrees of freedom and triangulation
• Visualization limited by inline field of view and motion of instruments
• More difficult for the surgeon

Questions
• Do the benefits outweigh the risks?
• What are the benefits?
• Is there improved cosmesis?
• Prospective evidence needed
• We are enrolling in 3 SSULS PRT’s
Appendectomy, Cholecystectomy, Splenectomy
Validated scar assessment tool

Prospective Randomized Trials
Power 10 Outcome Analysis Variable
SSULS Appendectomy 360 (360) Infection
SSULS Cholecystectomy 60 (60) Operative time
SSULS Splenectomy 30 ( 7) Operative time

Other Variables Being Collected
• Pain
• Cost (hospital charges)
• Cosmesis (Validated Scar Assessment Tool)

• Aug 2009 – Nov 2010
• Non-perforated appendicitis
• 360 pts – 180 each arm
• No difference in patient characteristics at time of operation
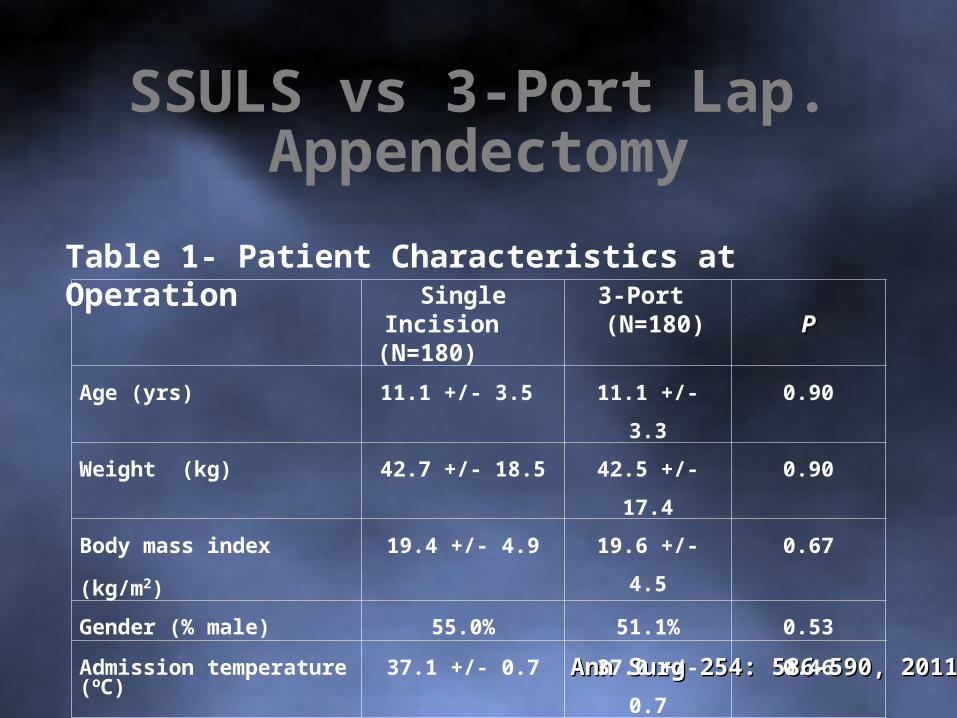
Ann Surg 254: 586-590, 2011Ann Surg 254: 586-590, 2011
SSULS vs 3-Port Lap.Appendectomy
Single Incision (N=180)
3-Port (N=180)
PP
Age (yrs) 11.1 +/- 3.5 11.1 +/- 3.3 0.90
Weight (kg) 42.7 +/- 18.5 42.5 +/- 17.4 0.90
Body mass index (kg/m2) 19.4 +/- 4.9 19.6 +/- 4.5 0.67
Gender (% male) 55.0% 51.1% 0.53
Admission temperature (oC) 37.1 +/- 0.7 37.0 +/- 0.7 0.46
Leukocyte count (1000 cells/mm3)
14.6 +/- 5.4 14.6 +/- 5.2 0.96
Table 1- Patient Characteristics at Operation

SSULS vs 3-Port Lap.Appendectomy
Table 2 - Operative Data Single Incision
(N=180) 3-Port
(N=180) P
Operative Time (mins) 35.2 +/- 14.5 29.8 +/- 11.6 <0.001
Surgical Difficulty (1–Easy to 5–Difficult) 2.3 +/- 1.4 1.7 +/- 1.0 <0.001
Ann Surg 254: 586-590, 2011Ann Surg 254: 586-590, 2011

SSULS vs 3-Port Lap.Appendectomy
Single Incision (N=180)
3-Port (N=180)
P
Wound Infection 3.3% 1.7% 0.50
Abscess 0.0% 0.6% 0.99
Time to Liquid Diet (Hours) 4.1 +/- 3.7 3.7 +/- 3.1 0.25
Time to Regular Diet (Hours) 7.2 +/- 5.1 6.9 +/- 5.2 0.48
Postoperative Length of Stay (hours) 22.7 +/- 6.2 22.2 +/- 6.8 0.44
Total Doses of Analgesics 9.6 +/- 4.9 8.5 +/- 4.3 0.04
Hospital Charges ($) 17.6K +/- 4.0K 16.6K +/- 3.9K 0.005
Corrected Charges* ($) 16.8K +/- 4.1K 16.6K +/- 3.9K 0.60
Table 3 - Table 3 - Outcome Data
*Hospital charges minus the stapler charges.
Ann Surg 254: 586-590, 2011Ann Surg 254: 586-590, 2011
Ann Surg 254: 586-590, 2011Ann Surg 254: 586-590, 2011
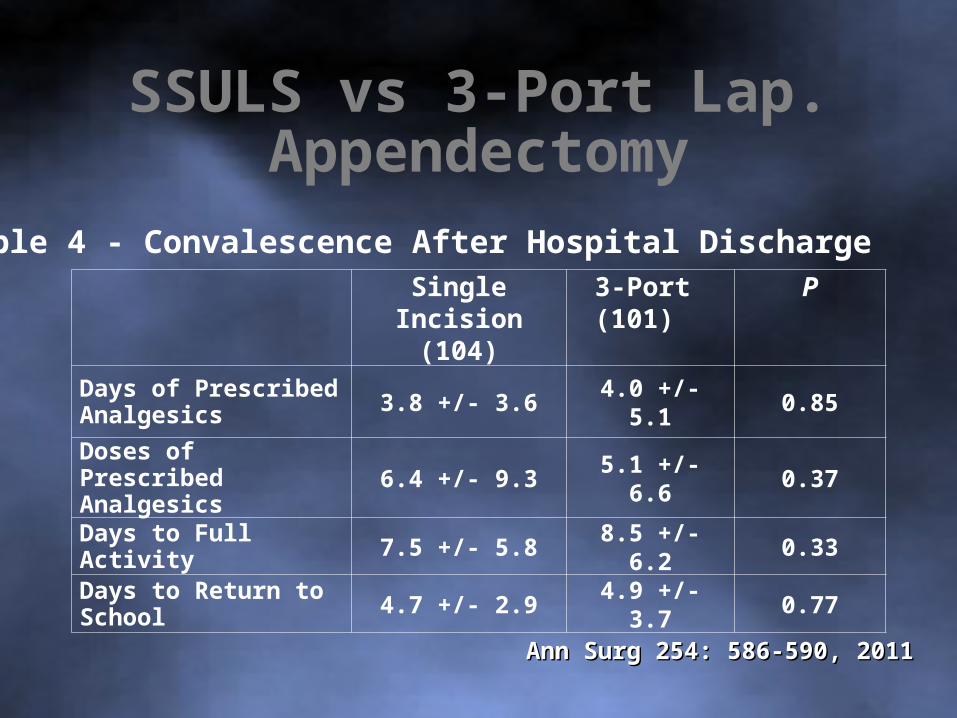
SSULS vs 3-Port Lap.Appendectomy
Single Incision (104)
3-Port (101)
P
Days of Prescribed Analgesics 3.8 +/- 3.6 4.0 +/- 5.1 0.85
Doses of Prescribed Analgesics 6.4 +/- 9.3 5.1 +/- 6.6 0.37
Days to Full Activity 7.5 +/- 5.8 8.5 +/- 6.2 0.33
Days to Return to School 4.7 +/- 2.9 4.9 +/- 3.7 0.77
Table 4 - Convalescence After Hospital Discharge

Summary• No difference in infectious complications:
wound infx, intra-abd abscess
• mean operating time for SSULS – 5 min
? clinical relevance (but leads to hospital charges)
• doses analgesics (p = .04) for SSULS
• Cosmetic advantage for SSULS –
We’ll see.
Ann Surg 254:586-590, 2011Ann Surg 254:586-590, 2011

Does Body Habitus Make a Difference?
SINGLE SITENormal (N=135)
Overweight (N=26)
P-ValueObese (N=19)
P-Value
Age (yrs) 11.0 ± 3.5 10.8 ± 3.9 0.78 12.1 ± 2.9 0.20
Weight (kg) 38.3 ± 14.5 47.4 ± 19.1 N/A 67.5 ± 22.0 N/A
Body Mass Index Percentile
41.1 ± 26.4 89.7 ± 2.8 N/A 97.5 ± 1.5 N/A
Gender (% male) 53.3 57.7 0.83 63.2 0.47
3 PORTNormal (N=139)
Overweight (N=25)
P-ValueObese (N=16)
P-Value
Age (yrs) 10.9 ± 3.4 11.9 ± 2.7 0.17 11.7 ± 3.5 0.38
Weight (kg) 37.8 ± 14.1 52.7 ± 15.3 N/A 66.8 ± 20.5 N/A
Body Mass Index Percentile 44.7 ± 26.5 89.6 ± 2.5 N/A 97.1 ± 1.7 N/A
Gender (% male) 50.4 60.0 0.40 43.8 0.79
IPEG 2012IPEG 2012

Outcomes for 3-Port Based on Body Habitus
3 PORTNormal (N=139)
Overweight (N=25)
P-ValueObese (N=16)
P-Value
Operating Time (Minutes) 29.6 ± 13.6 31.4 ±12.6 0.47 29.3 ± 20.1 0.93
Surgical Difficulty (1 – Easy to 5 – Difficult)
1.7 ± 1.0 1.6 ± 1.0 0.70 1.5 ± 0.6 0.33
Wound Infection (%) 2.2 0 1.00 0 1.00
Doses of Narcotics 5.3 ± 3.2 4.6 ± 3.2 0.31 6.2 ± 4.4 0.32
LOS after Operation (Hours)
22.5 ± 7.2 20.6 ± 5.0 0.22 21.8 ± 5.4 0.72
Hospital Charges ($) 16.4K ± 4.0K 17.2K ± 2.9K 0.32 17.1K ± 4.1K 0.51
IPEG 2012IPEG 2012

Outcomes for Single Incision Based on Body Habitus
SINGLE SITENormal (N=135)
Overweight (N=26)
P-Value Obese (N=19) P-Value
Operating Time (Minutes)
34.0 ± 13.6 34.1 ± 11.9 0.97 45.4 ± 20.1 0.002
Surgical Difficulty (1 – Easy to 5 – Difficult)
2.2 ± 1.4 2.6 ± 1.4 0.18 2.5 ± 1.4 0.38
Wound Infection (%) 1.5 7.7 0.12 10.5 0.08
Doses of Narcotics 5.7 ± 3.5 5.6 ± 3.7 0.85 7.6 ± 0.15 0.05
LOS after Operation (Hours)
22.0 ± 5.7 24.1 ± 6.7 0.11 25.4 ± 8.1 0.03
Hospital Charges ($) 17.1K ± 3.8K 18.5K ± 3.9K 0.09 20.3K ± 4.7K < 0.001
IPEG 2012IPEG 2012

Outcome Comparison for Normal Weight
NORMAL SINGLE (N=135) 3 PORT (N=139) P-Value
Operating Time (Minutes) 34.0 ± 13.6 29.6 ± 13.6 0.004
Surgical Difficulty (1 – Easy to 5 – Difficult)
2.2 ± 1.4 1.7 ± 1.0 0.002
Wound Infection (%) 1.5 2.2 0.68
Doses of Narcotics 5.7 ± 3.5 5.3 ± 3.2 0.31
LOS after Operation (Hours) 22.0 ± 5.7 22.5 ± 7.2 0.59
Hospital Charges ($) 17.1K ± 3.8K 16.4K ± 4.0K 0.13
IPEG 2012IPEG 2012
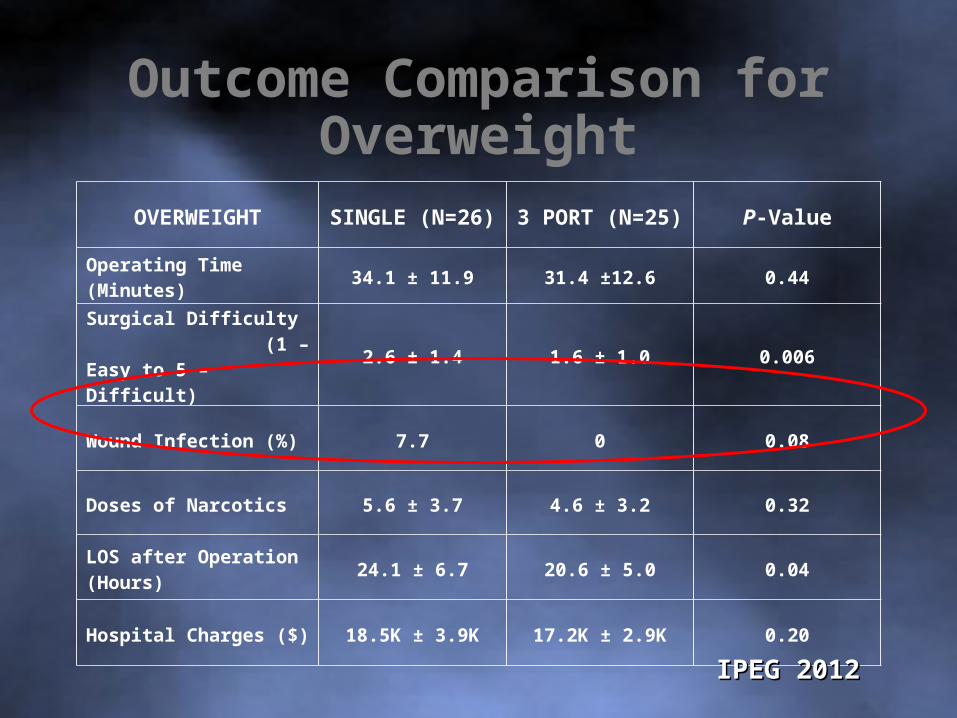
OVERWEIGHT SINGLE (N=26) 3 PORT (N=25) P-Value
Operating Time (Minutes) 34.1 ± 11.9 31.4 ±12.6 0.44
Surgical Difficulty (1 – Easy to 5 – Difficult)
2.6 ± 1.4 1.6 ± 1.0 0.006
Wound Infection (%) 7.7 0 0.08
Doses of Narcotics 5.6 ± 3.7 4.6 ± 3.2 0.32
LOS after Operation (Hours)
24.1 ± 6.7 20.6 ± 5.0 0.04
Hospital Charges ($) 18.5K ± 3.9K 17.2K ± 2.9K 0.20
Outcome Comparison for Overweight
IPEG 2012IPEG 2012

OBESE SINGLE (N=19) 3 PORT (N=16) P-Value
Operating Time (Minutes) 45.4 ± 20.1 29.3 ± 20.1 0.006
Surgical Difficulty (1 – Easy to 5 – Difficult)
2.5 ± 1.4 1.5 ± 0.6 0.014
Wound Infection (%) 10.5 0 0.11
Doses of Narcotics 7.6 ± 0.15 6.2 ± 4.4 0.42
LOS after Operation (Hours)
25.4 ± 8.1 21.8 ± 5.4 0.14
Hospital Charges ($) 20.3K ± 4.7K 17.1K ± 4.1K 0.04
Outcome Comparison for Obese
IPEG 2012IPEG 2012

Conclusions• Obesity increases operating time, postoperative
length of stay, doses of narcotics, and hospital charges c/w single site lap appendectomy
• Obesity has no impact in 3 port appendectomy
• Clinically significant increase in wound infection in overweight and obese patient undergoing single site lap appendectomy
• We do not recommend single site laparoscopic appendectomy in obese patients
IPEG 2012IPEG 2012

SSULS vs 4-Port Lap. Cholecystectomy
Table 1 – Patient Characteristics at OperationTable 1 – Patient Characteristics at Operation
APSA 2012APSA 2012
Single Incision (N=30)
4-Port (N=30) P-Value
Age (yrs) 14.0 +/- 3.2 13.3 +/- 3.3 0.39
Weight (kg) 55.0 +/- 19.4 59.7 +/- 24.0 0.40
Gender (% male) 20% 20% 0.99
Gallstones (% present) 50% 56.7% 0.7

SSULS vs 4-Port Lap. Cholecystectomy
Single Incision (N=30)
4-Port (N=30)
P-Value
Time to Initial Diet (Hours) 3.8 +/- 4.7 5.2 +/- 9.2 0.41
Time to Full Diet (Hours) 6.3 +/- 5.8 7.2 +/- 9.7 0.66Postoperative Length of
Stay (days) 1.01 +/- 0.54 0.90 +/- 0.12 0.28
Total Doses of Analgesics 16.4 +/- 17.8 10.1 +/- 4.3 0.06
Hospital Charges ($) 29.7K +/- 27.3K 20.6K +/- 6.9K 0.08
Table 2 – Operative DataTable 2 – Operative DataTable 2 – Operative DataTable 2 – Operative Data
Table 3 – Outcome DataTable 3 – Outcome Data
APSA 2012APSA 2012
Single Incision (N=30)
4-Port(N=30)
P-Value
Operative Time (mins) 68.6 +/- 22.1 56.1 +/- 22.1 0.03
Surgical Difficulty (1 – Easy to 5 – Difficult)
2.7 +/- 1.0 1.9 +/- 0.8 0.005

SSULS vs 4-Port Lap. Cholecystectomy
Single Incision 3-Port P-Value
Days of Prescribed Analgesics 3.5 +/- 3.2 3.6 +/- 3.8 0.96
Doses of Prescribed Analgesics 7.0 +/- 5.9 3.0 +/- 2.5 0.23
Days to Full Activity 6.1 +/- 3.1 6.0 +/- 4.7 0.96
Days to Return to School 4.8 +/- 1.9 4.5 +/- 4.2 0.88
Table 4 – Convalescence After Discharge
APSA 2012APSA 2012

www.cmhclinicaltrials.comwww.cmhmis.com
QUESTIONS