Embed Size (px)
Citation preview

Accepted Manuscript
Single-specimen evaluation of tearing resistance in SENT testing
M.A. Verstraete, W. De Waele, K. Van Minnebruggen, S. Hertelé
PII: S0013-7944(15)00492-0
DOI: http://dx.doi.org/10.1016/j.engfracmech.2015.07.067
Reference: EFM 4854
To appear in: Engineering Fracture Mechanics
Received Date: 31 July 2014
Revised Date: 11 June 2015
Accepted Date: 24 July 2015
Please cite this article as: Verstraete, M.A., De Waele, W., Van Minnebruggen, K., Hertelé, S., Single-specimen
evaluation of tearing resistance in SENT testing, Engineering Fracture Mechanics (2015), doi: http://dx.doi.org/
10.1016/j.engfracmech.2015.07.067
This is a PDF file of an unedited manuscript that has been accepted for publication. As a service to our customers
we are providing this early version of the manuscript. The manuscript will undergo copyediting, typesetting, and
review of the resulting proof before it is published in its final form. Please note that during the production process
errors may be discovered which could affect the content, and all legal disclaimers that apply to the journal pertain.
Single-specimen evaluation of tearing resistance in SENT testing
M.A. Verstraetea,*
, W. De Waelea, K. Van Minnebruggen
a, S. Hertelé
a
aLaboratorium Soete, Ghent University, Faculty of Engineering and Architecture, Technologiepark
gebouw 903, 9052 Zwijnaarde, Belgium
*Corresponding author: [email protected]
Abstract The evaluation of CTOD tearing resistance is required by several strain based defect
assessment procedures. To that extent, the use of SENT testing is widely advised as the constraint
matches that of pressurized pipes. This indicates the need for well validated testing methods. This
paper discusses two single specimen techniques for the evaluation of tearing resistance using clamped
SENT specimens: the unloading compliance (UC) and the direct current potential drop (DCPD)
technique. From the results of tests carried out on a variety of both base metal and welded specimens,
both methods show a comparable accuracy and scatter.
Keywords: SENT, Unloading Compliance, Direct Current Potential Drop
1. Introduction
Several defect assessment procedures have recently been proposed to assess the criticality of pipeline
girth weld defects under strain based conditions [1-2]. The majority of these procedures require the
material’s tearing resistance as an input. To obtain this tearing resistance, the use of Single-Edge
Notched Tensile (SENT) testing is advised, given the constraint match of SENT specimens with
(pressurized) pipes [3-5]. To date, the most common method for the evaluation of the tearing
resistance, is the multi-specimen technique described in DNV RP-F108 [6]. Although successful
applications are described in literature [7, 8], such technique involves high labor and material costs.
On the other hand, the single specimen technique aims to monitor the ductile crack extension during
the test. The predicted ductile crack extension can then, by means of validation, be compared to the
value measured post-mortem. The latter can be obtained following the ASTM E1820 nine points
average method [9].
For a successful evaluation of the tearing resistance, attention may be devoted to methods focusing on
the evaluation of the crack driving force and methods focusing on the evaluation of the crack
extension (Δa). For the former, both the crack tip opening displacement (CTOD) and J-integral can be
considered to describe the crack loading. Given the equivalence between both, the CTOD parameter
has arbitrarily been selected in this paper [10]. This CTOD parameter is measured using the double
clip gauge method, which is well described and validated in literature for SENT testing [11, 12]. For
the evaluation of the crack extension, both the unloading compliance (UC) and direct current potential
drop method (DCPD) are described in literature [12-16]. It is however not clear which method yields
the most accurate estimate. To that extent, this paper aims at presenting a thorough validation and
comparison of both techniques for crack extension measurement. This issue was also addressed in the
recently released BS8571:2014 standard for SENT testing, where reference is made to the authors’
previous work in this respect [17].
Nomenclature
a crack depth
a0 initial crack depth B thickness
Be effective thickness

BN net thickness
CMOD Crack Mouth Opening Displacement
CTOD Crack Tip Opening Displacement CTODini CTOD at initiation
DCPD Direct Current Potential Drop
Fmax maximum force h1 height of first clip gauge above specimen
h2 height of second clip gauge above specimen
H daylight grip length
I applied current (25 A for all tests) MMFS mismatch in terms of flow stress
N batch size
Pm limit load scr crack front straightness parameter
SENT Single-Edge Notched Tensile
STD standard deviation V potential drop across the crack
V1 opening of first clip gauge
V2 opening of second clip gauge
UC Unloading Compliance Vref potential drop remote from the crack
W width
WMC Weld Metal Center Y/T Yield-to-Tensile ratio
1 curve fitting parameter for R-curve
2 curve fitting parameter for R-curve
Δa crack extension
ab,uc/pd crack extension attributed to blunting for unloading compliance and potential
drop method
a9p measured crack extension using nine points average method
s width of scatter band in terms CTOD
σ0 yield strength σ FS flow strength
σ TS tensile strength
2. Materials and methods
2.1. Test specimens
The SENT specimens considered in this paper have a square cross section (i.e. B / W = 1) and a
daylight grip length (H) equal to 10W (Figure 1) as proposed by Shen et al. [13]. After extracting the
specimens, a notch with depth a0 is introduced through saw-cutting. The cutting blade used for the
final pass is extremely sharp and thin, resulting in an initial notch root radius of 0.075 mm. Fatigue
pre-cracking is not applied. This would complicate the control of the initial crack depth and is not
required for sufficiently ductile materials [12,18,19].
Due to the difference in constraint at mid-thickness (towards plane strain) and at the sides (plane
stress) of the specimen, crack tunneling is expected [20]. This tunneling results in a deteriorated
accuracy of crack growth measurements [21]. V-shaped side grooves are machined at both sides of the
test specimen to promote uniform crack extension, achieving a total thickness reduction of 15%
(BN = 0.85W) as advised by Shen et al. [22] side grooves are produced conform the ASTM E1820
requirements, i.e. having an opening angle less than 90° and a root radius of 0.5 ± 0.2 mm [9].

2.2. Test conditions
The specimens are clamped using hydraulic grips, restricting all rotational degrees of freedom.
Following, the specimen is loaded under displacement control with a displacement rate of 0.01
mm/sec, thus representing quasi-static conditions. To allow for the evaluation of the compliances
during the test, the specimens are partially unloaded and reloaded during the tests. The design of these
loading cycles has been adopted from the recommended practice provided by CANMET MTL in the
framework of a round robin test program [23]:
- Six unloading cycles are performed in the elastic regime when the applied force equals Pm,
equal to
eTS
m BaWP 0
0
22
1
(1)
where the effective width (Be) is determined from the following equation:
B
BBBB N
e
2
(2)
The amount of unloading equals Pm/2.
- Following these elastic unloading cycles, subsequent unloading cycles are performed at fixed
intervals of the crack mouth opening displacement (CMOD). In all cycles the amount of
unloading is force controlled and also equals Pm/2. For the first five plastic unloading cycles
the CMOD intervals equal 0.02 mm, subsequently intervals of 0.04 mm are used. The test is
stopped when the applied tensile force no longer exceeds 80% of its maximum (Fmax).
2.3. Test material
The methods presented in the remainder of this paper are applied to a series of specimens extracted
from different (girth welded) pipes. To demonstrate the general applicability of the presented
procedures, a broad range of testing conditions are covered, both with respect to the tested materials
and geometry. More specifically, specimens with the following properties have been tested:
- Both welded and non-welded specimens have been tested, with the notch in the weld metal center (WMC) line for the welded specimens.
- The specimens are extracted from pipes with a variety of pipe grades, ranging between
API-5L grades X65 and X80.
- The welded specimens are extracted from girth welds created with two different welding
processes, namely shielded metal arc welding (SMAW) and gas metal arc welding (GWAW).
- The variety of welded and non-welded specimens, resulted in yield-to-tensile (Y/T) ratios
between 0.82 and 0.92 for the base metal (Y/TBM), and between 0.83 and 0.94 for the weld metal (Y/TWM).
- The strength difference between base and weld metal, in terms of flow stress (MMFS), ranges
between 0% and 33%. This mismatch definition was adopted as it has shown to be connected to the tensile strain capacity for strain-based design applications [24] and defined by the
following equation:
BMFS
BMFSWMFS
FSMM,
,,
(3)
- From a geometrical point, different relative crack depths have been tested. The a0/W-ratio
ranges between 0.20 and 0.60.
An overview of all tested specimens is provided in Tables 1 and 2 for the tests performed on base
metal and welded specimens respectively.
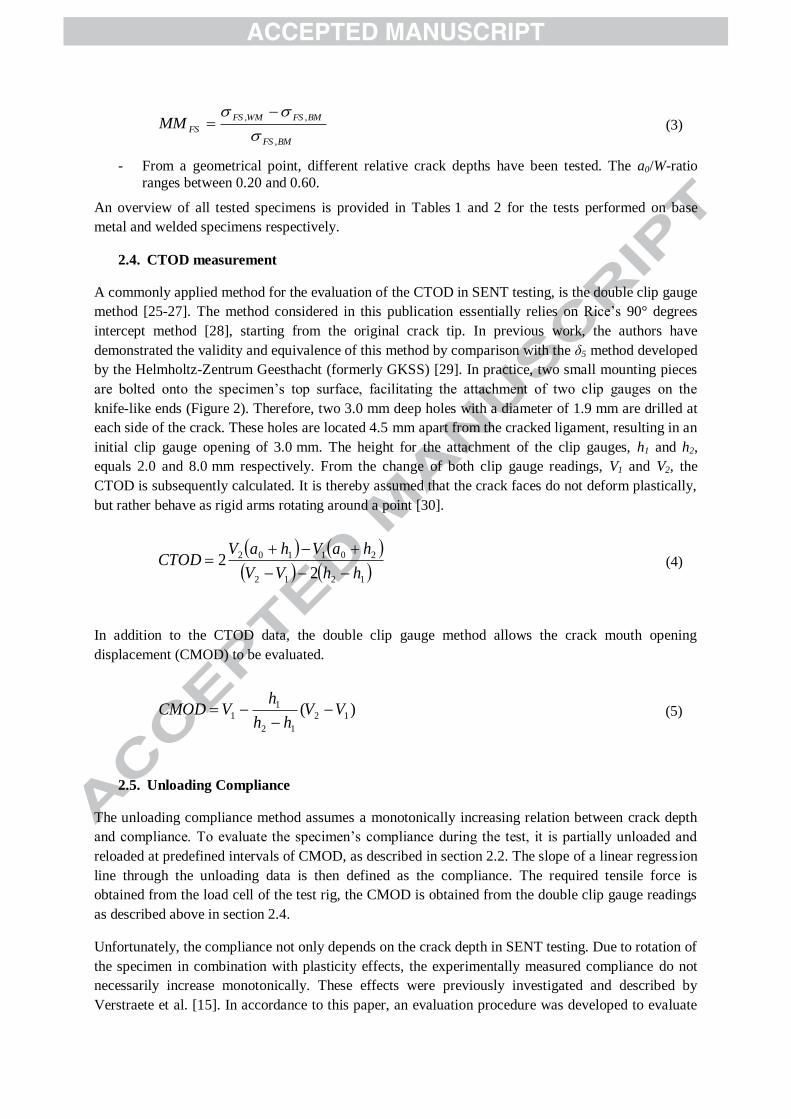
2.4. CTOD measurement
A commonly applied method for the evaluation of the CTOD in SENT testing, is the double clip gauge
method [25-27]. The method considered in this publication essentially relies on Rice’s 90° degrees
intercept method [28], starting from the original crack tip. In previous work, the authors have
demonstrated the validity and equivalence of this method by comparison with the δ5 method developed
by the Helmholtz-Zentrum Geesthacht (formerly GKSS) [29]. In practice, two small mounting pieces
are bolted onto the specimen’s top surface, facilitating the attachment of two clip gauges on the
knife-like ends (Figure 2). Therefore, two 3.0 mm deep holes with a diameter of 1.9 mm are drilled at
each side of the crack. These holes are located 4.5 mm apart from the cracked ligament, resulting in an
initial clip gauge opening of 3.0 mm. The height for the attachment of the clip gauges, h1 and h2,
equals 2.0 and 8.0 mm respectively. From the change of both clip gauge readings, V1 and V2, the
CTOD is subsequently calculated. It is thereby assumed that the crack faces do not deform plastically,
but rather behave as rigid arms rotating around a point [30].
1212
201102
22
hhVV
haVhaVCTOD
(4)
In addition to the CTOD data, the double clip gauge method allows the crack mouth opening
displacement (CMOD) to be evaluated.
)( 12
12
11 VV
hh
hVCMOD
(5)
2.5. Unloading Compliance
The unloading compliance method assumes a monotonically increasing relation between crack depth
and compliance. To evaluate the specimen’s compliance during the test, it is partially unloaded and
reloaded at predefined intervals of CMOD, as described in section 2.2. The slope of a linear regression
line through the unloading data is then defined as the compliance. The required tensile force is
obtained from the load cell of the test rig, the CMOD is obtained from the double clip gauge readings
as described above in section 2.4.
Unfortunately, the compliance not only depends on the crack depth in SENT testing. Due to rotation of
the specimen in combination with plasticity effects, the experimentally measured compliance do not
necessarily increase monotonically. These effects were previously investigated and described by
Verstraete et al. [15]. In accordance to this paper, an evaluation procedure was developed to evaluate
the crack extension based on finite element simulations and experimental observations. This procedure
considers the compliances from initiation onwards. Crack initiation can thereby be identified by either
of the following observations [31]:
- If the compliance curve shows a minimum, discard all compliance data prior to this minimum in the experimentally measured compliance curve. The point of minimum compliance
represents crack initiation.
- If the compliance curve does not show a minimum, it most likely shows a linear increase of
the compliance from the start of the test onwards. In this case, crack initiation is identified as the point where the compliance deviates from this linear trend. All compliance data prior to
this deviation can be discarded.
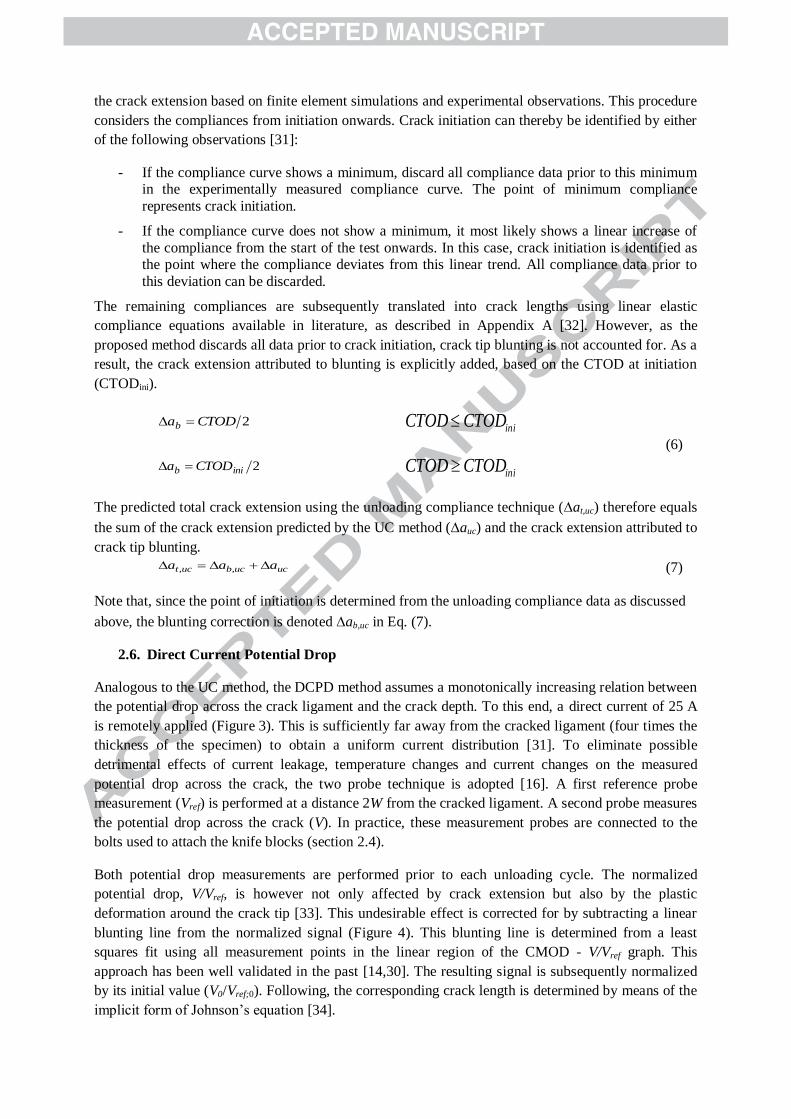
The remaining compliances are subsequently translated into crack lengths using linear elastic
compliance equations available in literature, as described in Appendix A [32]. However, as the
proposed method discards all data prior to crack initiation, crack tip blunting is not accounted for. As a
result, the crack extension attributed to blunting is explicitly added, based on the CTOD at initiation
(CTODini).
2CTODab iniCTODCTOD
(6)
2inib CTODa iniCTODCTOD
The predicted total crack extension using the unloading compliance technique (at,uc) therefore equals
the sum of the crack extension predicted by the UC method (auc) and the crack extension attributed to
crack tip blunting.
ucucbuct aaa ,, (7)
Note that, since the point of initiation is determined from the unloading compliance data as discussed
above, the blunting correction is denoted ab,uc in Eq. (7).
2.6. Direct Current Potential Drop
Analogous to the UC method, the DCPD method assumes a monotonically increasing relation between
the potential drop across the crack ligament and the crack depth. To this end, a direct current of 25 A
is remotely applied (Figure 3). This is sufficiently far away from the cracked ligament (four times the
thickness of the specimen) to obtain a uniform current distribution [31]. To eliminate possible
detrimental effects of current leakage, temperature changes and current changes on the measured
potential drop across the crack, the two probe technique is adopted [16]. A first reference probe
measurement (Vref) is performed at a distance 2W from the cracked ligament. A second probe measures
the potential drop across the crack (V). In practice, these measurement probes are connected to the
bolts used to attach the knife blocks (section 2.4).
Both potential drop measurements are performed prior to each unloading cycle. The normalized
potential drop, V/Vref, is however not only affected by crack extension but also by the plastic
deformation around the crack tip [33]. This undesirable effect is corrected for by subtracting a linear
blunting line from the normalized signal (Figure 4). This blunting line is determined from a least
squares fit using all measurement points in the linear region of the CMOD - V/Vref graph. This
approach has been well validated in the past [14,30]. The resulting signal is subsequently normalized
by its initial value (V0/Vref;0). Following, the corresponding crack length is determined by means of the
implicit form of Johnson’s equation [34].
Wa
W
Wa
W
aV
aV
2cos
49coshcosh
2cos
49coshcosh
0
1
1
0
(8)
Analogous to the unloading compliance method, the potential drop method only considers the ductile
crack extension after initiation. As a result, the predicted total amount of ductile crack extension (at)
consists of both the crack extension predicted by the PD method (apd) and the crack extension
attributed to crack tip blunting (ab), Eq. (6).
pdpdbpdt aaa ,, (9)
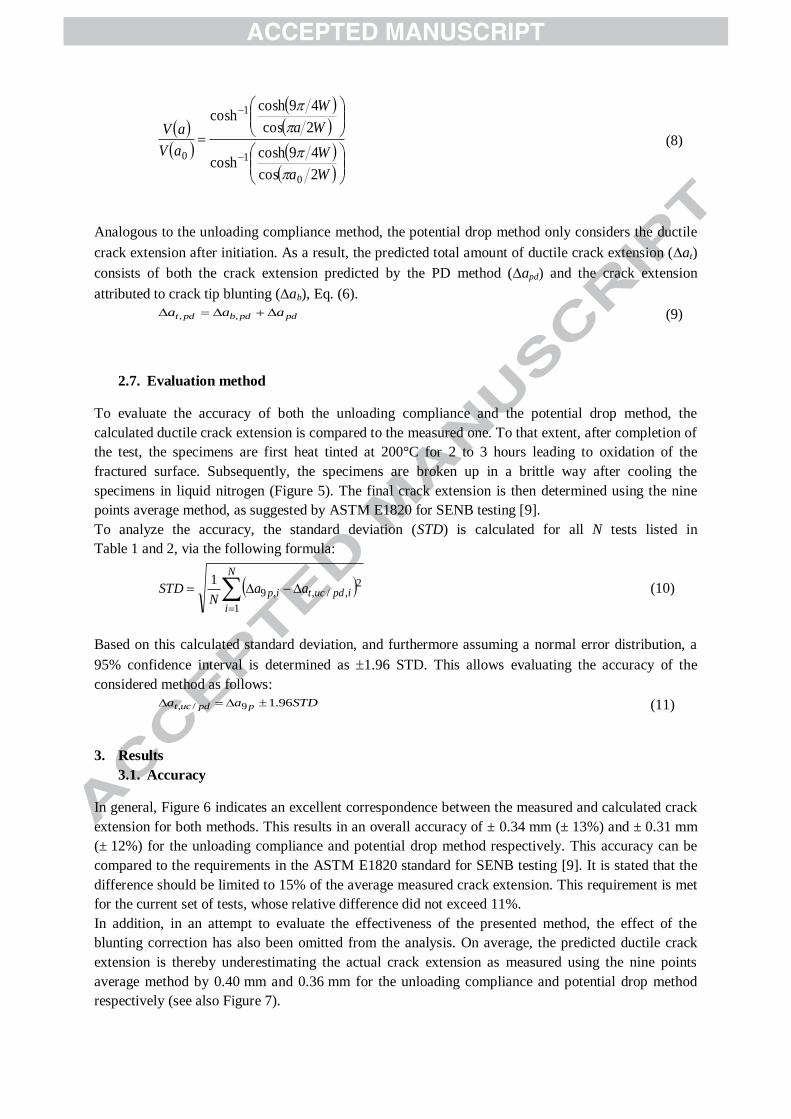
2.7. Evaluation method
To evaluate the accuracy of both the unloading compliance and the potential drop method, the
calculated ductile crack extension is compared to the measured one. To that extent, after completion of
the test, the specimens are first heat tinted at 200°C for 2 to 3 hours leading to oxidation of the
fractured surface. Subsequently, the specimens are broken up in a brittle way after cooling the
specimens in liquid nitrogen (Figure 5). The final crack extension is then determined using the nine
points average method, as suggested by ASTM E1820 for SENB testing [9].
To analyze the accuracy, the standard deviation (STD) is calculated for all N tests listed in
Table 1 and 2, via the following formula:
N
i
ipductip aaN
STD
1
2,/,,9
1
(10)
Based on this calculated standard deviation, and furthermore assuming a normal error distribution, a
95% confidence interval is determined as 1.96 STD. This allows evaluating the accuracy of the
considered method as follows:
STDaa ppduct 96.19/, (11)
3. Results
3.1. Accuracy
In general, Figure 6 indicates an excellent correspondence between the measured and calculated crack
extension for both methods. This results in an overall accuracy of ± 0.34 mm (± 13%) and ± 0.31 mm
(± 12%) for the unloading compliance and potential drop method respectively. This accuracy can be
compared to the requirements in the ASTM E1820 standard for SENB testing [9]. It is stated that the
difference should be limited to 15% of the average measured crack extension. This requirement is met
for the current set of tests, whose relative difference did not exceed 11%.
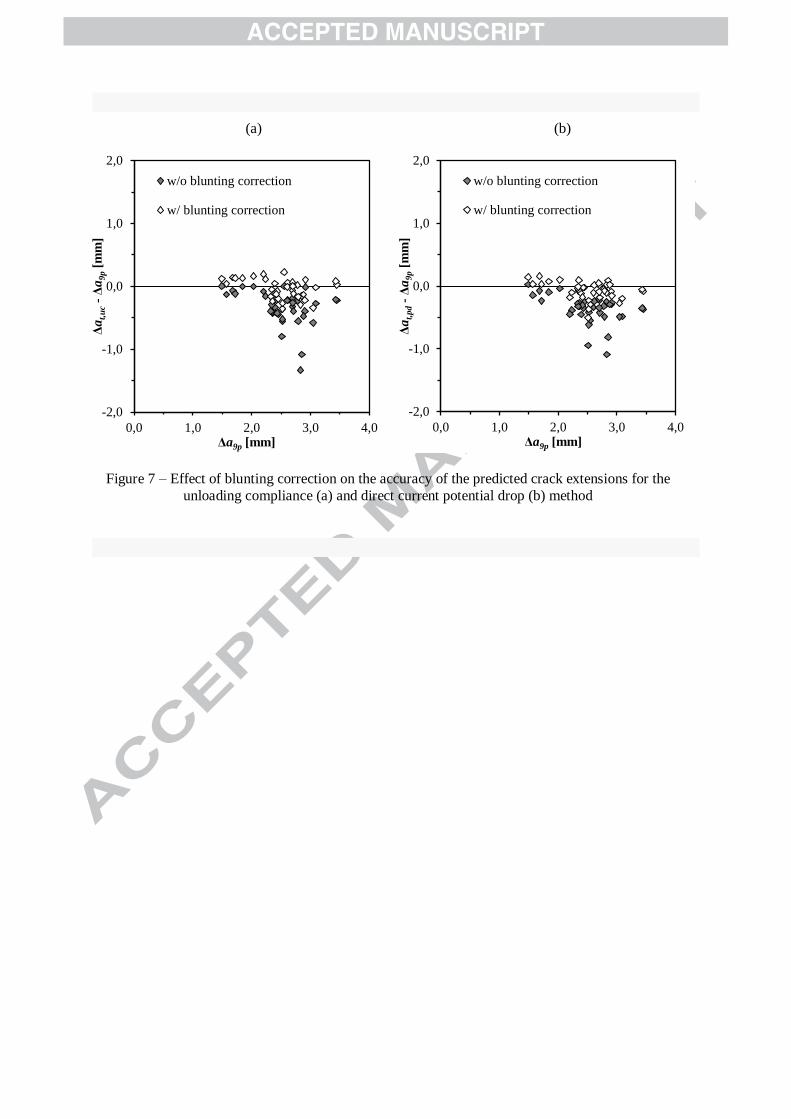
In addition, in an attempt to evaluate the effectiveness of the presented method, the effect of the
blunting correction has also been omitted from the analysis. On average, the predicted ductile crack
extension is thereby underestimating the actual crack extension as measured using the nine points
average method by 0.40 mm and 0.36 mm for the unloading compliance and potential drop method
respectively (see also Figure 7).
3.2. Factors affecting the accuracy
Several factors are expected to influence the aforementioned accuracy. In the remainder of this
section, the following factors are discussed:
- Presence of natural weld metal defects
- Initial crack size
- Crack front straightness
First, the focus is on the presence of natural weld metal defects. By means of example the measured
and calculated ductile crack extension are compared for the welded SENT tests numbered WP2-xx and
WP3-xx. These tests result in data points that are located close to or below the lower bound of the 95%
confidence interval obtained using all test data (section 3.1 - indicated by the dotted lines in Figure 6).
This observation is attributed to the presence of natural weld metal defects. In Figure 8, the fracture
surface for specimen WP2-03 is shown. Multiple natural defects can easily be observed (white arrow
signs). These natural defects contribute to the crack extension as measured by the nine points average
method, though do not increase the potential drop across the crack during the test. The same applies
for the unloading compliance method: the natural defects already decreased the initial compliance and
are therefore not accounted for in the crack extension measurements during the test.
Given the absence of natural defects in base metal tests, a better correspondence is expected between
the measured and calculated crack extension. This particularly holds for the potential drop method,
where the data points are clearly contained within the 95% confidence interval. For the unloading
compliance method (Figure 9), the results are somewhat biased since these base metal specimens have
a wide range of relative crack depths. It has previously been shown that for specimens with a high
initial crack depth the crack extension tends to be overestimated. In contrast, an underestimation is
expected for shallow cracks [15]. This effect is indeed observed though the influence is clearly limited,
indicating that the proposed method for the evaluation of the unloading compliance data performs
satisfactorily.
A third factor that potentially influences the accuracy of the crack extension measurements, is the
straightness of the crack front (e.g. tunneling) [21]. For the tests performed in the framework of this
paper, an inverse tunneling is often observed; the crack grows more near the side grooves compared to
the center of the specimen. This most likely indicates that the thickness reduction resulting from
applying the side grooves is too high. To evaluate the influence of the crack front straightness, the
parameter scr is introduced. This is calculated as the ratio of the standard deviation of the crack depths
measured using the nine points average method (ai) to the nine points averaged crack extension
(a9p).
ppicr aaas 92
99
1
(12)
In Figure 10.a these values are plotted against the relative error of the potential drop method for
specimens WM-07 till WM-15. These specimens are selected since they are obtained from the same
weld; though differ significantly in crack front straightness due to the different notching position
(inner diameter vs. outer diameter vs. through thickness notch). A minor dependency on the crack
front straightness is observed, though in general the influence of the crack front straightness is limited,
particularly when realizing the extreme non-uniformity of some specimens involved in this series. For
instance, the through-thickness notched specimen WM-15 (Figure 10.b) showed an extremely non-
uniform crack extension pattern due to the heterogeneous nature of the sampled weld microstructures.

According to the ASTM E1820 requirements for SENB testing, such test result is not acceptable for
evaluating the ductile tearing resistance. The aim of this paper is however to evaluate and compare the
application limits of the crack growth measurement techniques. Hence, no attention has been paid to
improve the validity of the test results, e.g. by pre-compressing the specimen to alleviate the residual
stresses.
3.3. Crack initiation
Apart from the final crack extension, the CTOD-value corresponding to crack initiation (CTODini) has
also been compared for both methods. In Figure 11, the CTOD at initiation obtained from the potential
drop method is plotted as function of the CTOD at initiation obtained using the unloading compliance
method. Based on this data set, a linear regression analysis is performed. This revealed an excellent
linear correlation (R² = 0.9811, close to 1). Furthermore, the obtained correlation almost perfectly
demonstrates a 1-to-1 relationship (regression line slope 0.9753).
3.4. Impact on resistance curves
The tested materials, in particular the weld metals, are not homogeneous by nature. As a result, the
obtained tearing resistance is expected to vary between geometrically identical test specimens (i.e.
identical notch position and initial crack size) extracted from the same material. To capture this effect,
the ASTM E1820 procedure requires at least three valid test results for each region of interest [9].
Accordingly, three SENT tests have typically been executed for each region of interest (with identical
notch depth, orientation, …), grouped in a so-called configuration. These specimens have been
extracted adjacent to each other.
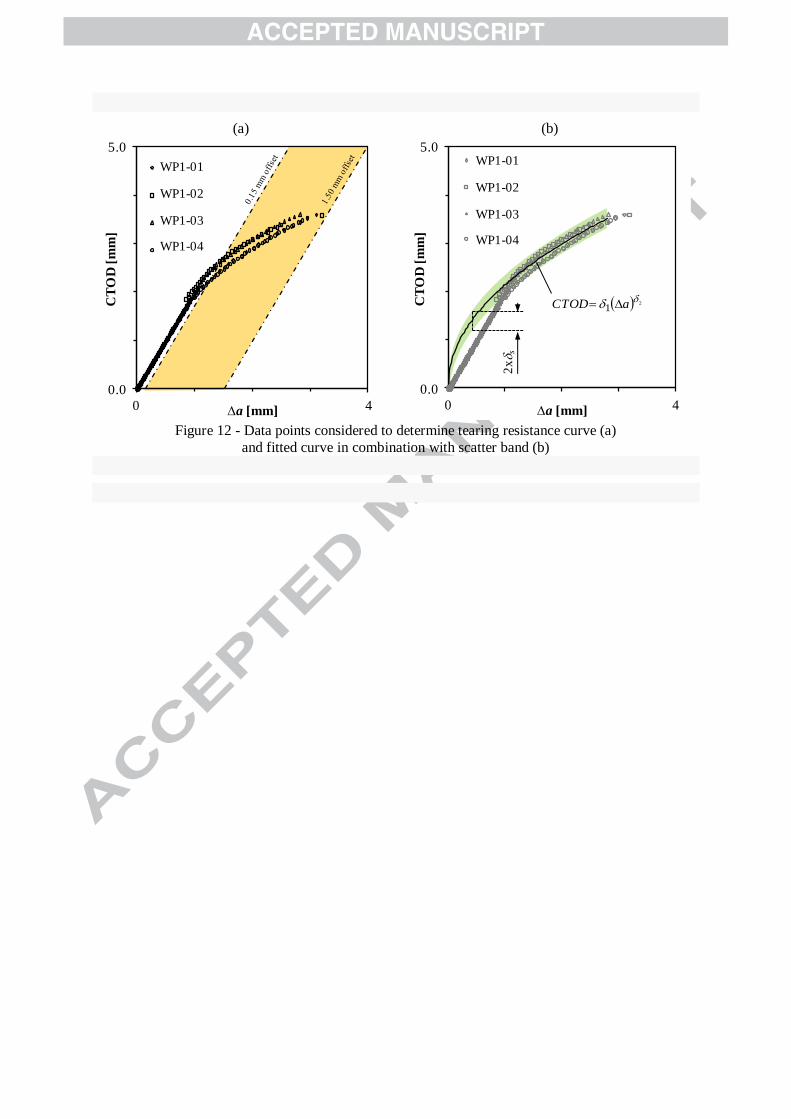
For each configuration, the UC and DCPD data are considered for the evaluation of the ductile crack
extension. For each crack growth measurement method and for each configuration, a curve fit is made
based on all data points that are located between the 0.15 mm and 1.50 mm offset lines as illustrated in
Figure 12.a. These lines are parallel to the blunting line, with an offset on the crack extension (Δa). In
accordance to the ASTM E1820 standard, an exponential curve with two fitting parameters (1 and 2)
is constructed.
2
1 aCTOD (13)
In combination with this curve fit, a scatter band is calculated (Figure 12.b). The constant width of this
scatter band s is chosen to include 95% of all data points within a configuration; s is regarded as a
characteristic for the scatter and/or accuracy of the measured tearing resistance. The boundaries of the
resistance curve can thus be written as:
saCTOD 2
1 (14)
The scatter of the measured tearing resistance is evaluated for all configurations described in Table 1
and 2. It is concluded that both methods result in a similar scatter. On average, s equals 0.15 mm for
the potential drop method and 0.16 mm for the unloading compliance method. It might be argued that
base metal specimens are more homogeneous and hence less prone to material property scatter.
However, the scatter for these tests was not observed to differ considerably (0.20 mm on average)
from that observed in the tests on welded specimens (0.14 mm on average).
4. Discussion

The main aim of this study was to compare both measurement techniques that allow for single
specimen fracture toughness testing of R-curves in SENT specimens. A comparison of both methods
is presented, taking into account aspects related to testing practice and result accuracy.
From a technical perspective, the results presented in the previous section do not identify any clear
distinction between both techniques as both are similarly accurate. In the specific case of weld metal
testing, the unloading compliance technique appeared slightly less susceptible to weld metal defects.
On the other hand, the accuracy of the unloading compliance technique proved to be slightly
dependent on the relative crack depth in contrast to the potential drop technique.
The successful interpretation of both measurement signals requires the determination of the point of
crack initiation. An excellent correspondence was observed between both techniques. This again
supports the equivalence of both measurement methods and adds belief to the validity of the proposed
methods. It should however been noted that the determination of the point of crack initiation remains a
most delicate question, requiring an experienced eye in case of both techniques. No analytical formula
are available to strictly determine this initiation point. To that extent, it could be argued that one
should eventually not necessarily select one of the presented techniques, though combine them. This
will provide the fracture mechanics specialist confidence in the obtained test results.
A third technical aspect regards the scatter between specimens having an identical configuration
(material region, notch depth, notch location and orientation, …). Regarding this aspect, the results
obtained from both techniques did not show any relevant difference.
Whereas the technical arguments discussed in the previous paragraphs do not allow to differentiate
between both techniques, there are some practical aspects which should be taken into account when
selecting either of both techniques. With respect to the required test equipment, it is clear that the
potential drop technique requires an additional investment for the current power source and precision
voltage measurement apparatus. In contrast, two high precision clip gauges are required for the
unloading compliance technique. This accuracy would probably not be required if these clip gauges
were used solely to determine the CTOD and/or CMOD, as would be the case for the potential drop
technique. It is expected that the cost for these clip gauges is smaller compared to the potential drop
equipment, thus requiring a higher initial investment for the potential drop method. On the other hand,
the time needed for testing one specimen is theoretically shorter for the potential drop technique, as it
does not require the time-consuming unloading cycles. The presented results also demonstrated that
there is no need for insulation of the test specimens when using the potential drop method including a
reference voltage measurement. Although insulation might be achievable for smaller specimens, this is
definitely an asset when considering the evaluation of ductile crack extension in large scale specimens
(e.g. curved wide plate specimens [35]).
5. Conclusion
To allow the evaluation of the fracture toughness by using SENT testing, two single specimen
methods have been presented and compared, namely the unloading compliance and direct current
potential drop technique. Based on an extensive set of experimental data, it has been demonstrated that
these techniques are equivalent from a performance point of view; no differences in accuracy, scatter
or moment of initiation have been observed. From a practical perspective, however, one should take
into account the differences between both techniques, for instance the required time for performing
one test and the required investments.
6. Acknowledgements
The authors would like to acknowledge the financial support of the IWT (Agency for Innovation by
Science and Technology – Grant Nos. SB-091512 and SB-093512) and the FWO (Research
Foundation Flanders – Grant Nos. 1.1.880.09.N.00 and 1.1.880.11.N.01). Finally, Dr. W.R. Tyson and
Dr. G. Wilkowski are acknowledged for the numerous fruitful discussions and sharing their
experiences.
7. Appendix A: Unloading Compliance Equations
To convert the measured compliances to actual crack sizes, elastic-plastic finite element simulations
can be considered [15]. Given their complexity, preference has been given in this paper to a more
hands-on, analytical approach. A number of equations are available in literature, all based on elastic
2D finite element simulations [12,13,36,37]. A comparative study indicated only minor differences
between these equations. Therefore, the formulation proposed by Shen et al. is considered in this paper
[13].
This approach starts from a generalized m-th degree relation between the compliance and the relative
crack depth (a/W).
m
i
i
iUrW
a
0
(A.1)
In the above equation, U is calculated from the specimen’s effective thickness (Be), compliance (C)
and Young’s modulus (E).
CEB
Ue
1
1 (A.2)
Shen et al. determined the coefficients ri in Eq. A.1. from 2D plane strain finite element simulations of
SENT specimens with a relative crack depth ranging between 0.05 and 0.95. These curve fitting
parameters are listed in Table A.1 (m = 8).
8. References
[1] Wang, Y. Y., Liu, M., Zhang, F., Horsley, D., and Nanney, S., 2012, "Multi-Tier Tensile
Strain Models for Strain-Based Design - Part 1: Fundamental Basis", International Pipeline Conference, Calgary, Alberta, Canada, paper n° IPC2012-90690.
[2] Fairchild, D. P., Macia, M. L., Kibey, S., Wang, X., Krishnan, V. R., Bardi, F., Tang, H., and
Cheng, W., 2011, "A Multi-Tiered Procedure for Engineering Critical Assessment of Strain-Based Pipelines", International Offshore and Polar Engineering Conference, Maui, HI, United States, pp.
698-705.
[3] Cravero, S., Bravo, R. E., and Ernst, H. A., 2008, "Constraint Evaluation and Effects on J-R Resistancecurves for Pipes under Combined Load Conditions", International Offshore and Polar
Engineering Conference, Vancouver, British Columbia, Canada, pp. 149-156
[4] Xu, J., Zhang, Z. L., Ostby, E., Nyhus, B., and Sun, D. B., 2010, "Constraint Effect on the
Ductile Crack Growth Resistance of Circumferentially Cracked Pipes", Engineering Fracture Mechanics, 77, pp. 671-684.
[5] Cravero, S., and Ruggieri, C., 2004, "Integrity Assessment of Pipelines Using SE(T)
Specimens", International Pipeline Conference, Calgary, Alberta, Canada, paper n° IPC04-0033. [6] Det Norske Veritas, 2006, RP-F108: Fracture Control for Pipeline Installation Methods
Introducing Cyclic Plastic Strain.
[7] Zhou, D. W., 2011, "Measurement and Modelling of R-Curves for Low- Constraint
Specimens", Engineering Fracture Mechanics, 78, pp. 605-622.
[8] Pussegoda, L. N., Tiku, S., Park, D.-Y., Tyson, W. R., and Gianetto, J. A., 2012, "J-Resistance
Results from Multi-Specimen and Single-Specimen Surface Notched SEN(T) Geometry",
International Pipeline Conference, Calgary, Alberta, Canada, paper n° IPC2012-90565. [9] American Society of Testing and Materials, 2011, E1820 - Standard Test Method for
Measurement of Fracture Toughness.
[10] British Standard, 2013, BS7910 - Guide to methods for assessing the acceptability of flaws in
metallic structures, in Annex N - Allowance for constraint effects. [11] Moore, P. L., and Pisarski, H. G., 2012, "Validation of Methods to Determine CTOD from
SENT Specimens", International Offshore and Polar Engineering Conference, Rhodes, Greece, pp.
577-582. [12] ExxonMobil, 2010, "Measurement of Crack Tip Opening Displacement (CTOD) - Fracture
Resistance Curves Using Single-Edge Notched Tension (SENT) Specimens," ExxonMobil Upstream
Research Company, Houston.
[13] Shen, G., Gianetto, J. A., and Tyson, W. R., 2009, "Measurement of J-R Curves Using Single
Specimen Technique on Clamped SE(T) Specimens", International Offshore and Polar Engineering
Conference, Osaka, Japan, pp. 92-99.
[14] Wilkowski, G., Shim, D. J., Kalyanam, S., Wall, G., Mincer, P., Rider, D., Brust, F. W., and
Rudland, D. L., 2009, "Using D-C Electric Potential for Crack Initiation/Growth Monitoring During
Testing of Weld Metal Fracture Specimens", Pipeline Technology Conference, Ostend, Belgium,
paper n° Ostend2009-018.
[15] Verstraete, M.A., Hertelé, S., Denys, R.M., Van Minnebruggen, K., De Waele, W., 2014,
“Evaluation and interpretation of ductile crack extension in SENT specimens using unloading
compliance technique”, Engineering Fracture Mechanics, 115, pp. 190-203.
[16] Verstraete, M.A., Denys, R.M., Van Minnebruggen, K., Hertelé, S., De Waele, W., 2013,
“Determination of CTOD resistance curves in side-grooved Single-Edge Notched Tensile specimens
using full field deformation measurements”, Engineering Fracture Mechanics, 110, pp. 12-22.
[17] British Standard, 2014, BS8571 - Method of test for determination of fracture toughness in
metallic materials using single edge notched tension (SENT) specimens.
[18] Det Norske Veritas, 2012, OS-F101: Submarine Pipeline Systems.
[19] Akourri, O., Louah, M., Kifani, A., Gilgert, G., and Pluvinage, G., 2000, "The Effect of Notch
Radius on Fracture Toughness J(Ic)", Engineering Fracture Mechanics, 65, pp. 491-505.
[20] Lan, W., Deng, X., and Sutton, M. A., 2010, "Investigation of Crack Tunneling in Ductile
Materials", Engineering Fracture Mechanics, 77, pp. 2800-2812.
[21] Riemelmoser, F. O., Pippan, R., Weinhandl, H., and Kolednik, O., 1999, "The Influence of
Irregularities in the Crack Shape on the Crack Extension Measurement by Means of the Direct-
Current-Potential-Drop Method", Journal of Testing and Evaluation, 27, pp. 42-46.
[22] Shen, G., Tyson, W. R., Gianetto, J. A., and Park, D.-Y., 2010, "Effect of Side Grooves on
Compliance, J-Integral and Constraint of Clamped SE(T) Specimen", Pressure Vessels and Piping
Conference, Bellevue, Washington, USA, paper n° PVP2010-25164.
[23] CANMET, 2010, "Recommended Practice: Fracture Toughness Testing Using SE(T) Samples
with Fixed-Grip Loading," CANMET Materials Technology Laboratory, Ottawa.
[24] Hertelé, S., De Waele, W., Denys, R, Verstraete, M.A., Van Minnebruggen, K. and Horn, A.,
2013, "Weld Strength Mismatch in Strain Based Flaw Assessment: Which Definition to Use?", Journal
of Pressure Vessel Technology-Transactions of the ASME, 135, pp. 1-8.
[25] Tang, H., Minnaar, K., Kibey, S., Macia, M. L., Gioielli, P., and Fairchild, D. P., 2010,
"Development of the SENT Test for Strain-Based Design of Welded Pipelines", International Pipeline
Conference, Calgary, Alberta, Canada, paper n° IPC2010-31590.

[26] Fagerholt, E., Ostby, E., Borvik, T., and Hopperstad, O. S., 2012, "Investigation of Fracture in
Small-Scale SENT Tests of a Welded X80 Pipeline Steel Using Digital Image Correlation with Node
Splitting", Engineering Fracture Mechanics, 96, pp. 276-293.
[27] Cicero, S., Gutiérrez-Solana, F. and Álvarez, J. A., 2008, "Structural Integrity Assessment of
Components Subjected to Low Constraint Conditions", Engineering Fracture Mechanics, 75, pp. 3038-
3059.
[28] Rice, J. R., 1968, "A Path Independent Integral and the Approximate Analysis of Strain
Concentration by Notches and Cracks", Journal of Applied Mechanics, 35, pp. 379-386.
[29] Verstraete, M.A., Denys, R.M., Van Minnebruggen, K., Hertelé, S., De Waele, W., 2013,
“Determinations of CTOD resistance curves in side-grooved Single-Edge Notched Tensile specimens
using full field deformation measurements”, Engineering Fracture Mechanics, 110, pp. 12-22.
[30] Manzione, P., and Perez Ipiña, J., 1991, "Sensitivity Analysis of the Double Clip Gauge
Method", Fatigue and Fracture Of Engineering Materials and Structures, 14, pp. 887-869.
[31] Verstraete M.A., “Experimental-Numerical Evaluation of Ductile Tearing Resistance and
Tensile Strain Capacity of Biaxially Loaded Pipelines”, PhD thesis, Ghent University, 2013.
[32] Shen, G., and Tyson, W. R., 2009, "Crack Size Evaluation Using Unloading Compliance in
Single-Specimen Single-Edge-Notched Tension Fracture Toughness Testing", Journal of Testing and
Evaluation, 37, pp. 347-357.
[33] Chipperfield, C. G., 1976, "Detection and Toughness Characterisation of Ductile Crack
Initiation in 316 Stainless Steel", International Journal of Fracture, 12, pp. 873-886.
[34] Johnson, H. H., 1965, "Calibrating the Electric Potential Method for Studying Slow Crack
Growth", Materials Research and Standards, pp. 442-445.
[35] Hertelé, S., De Waele, W., Denys, R.M., Verstraete, M.A., 2012, “Investigation of Strain
Measurements in (Curved) Wide Plate Specimens Using Digital Image Correlation and Finite Element
Analysis”, Journal of Strain Analysis for Engineering Design, 47(5), pp. 276-288.
[36] Cravero, S., Ruggieri, C., 2007, “Estimation procedure of J-resistance curves for SE(T) fracture specimens using unloading compliance”, Engineering Fracture Mechanics, 74, p. 2735-2757.
[37] Fonzo, A., Melis, G., Di Vito, G., Mannucci, G., Darcis, P, Richard, G., Quintanilla, H.,
Armengol, M., 2009, “Measurement of fracture resistance of pipelines for strain based design”, 17th Biennial Joint Technical Meeting on Pipeline Research, Milan, Italy. p. 1-8.

Figures
Figure 1 – Geometry of test specimens
W
a0
H = 10WA A
Detailed view A-A
B =
W
BN
side grooves

Figure 2 – Illustration of mounting pieces attached to a SENT specimen, allowing to measure CTOD
via double clip gauge method
V2
V1
h2h
1
a0
knife blocks
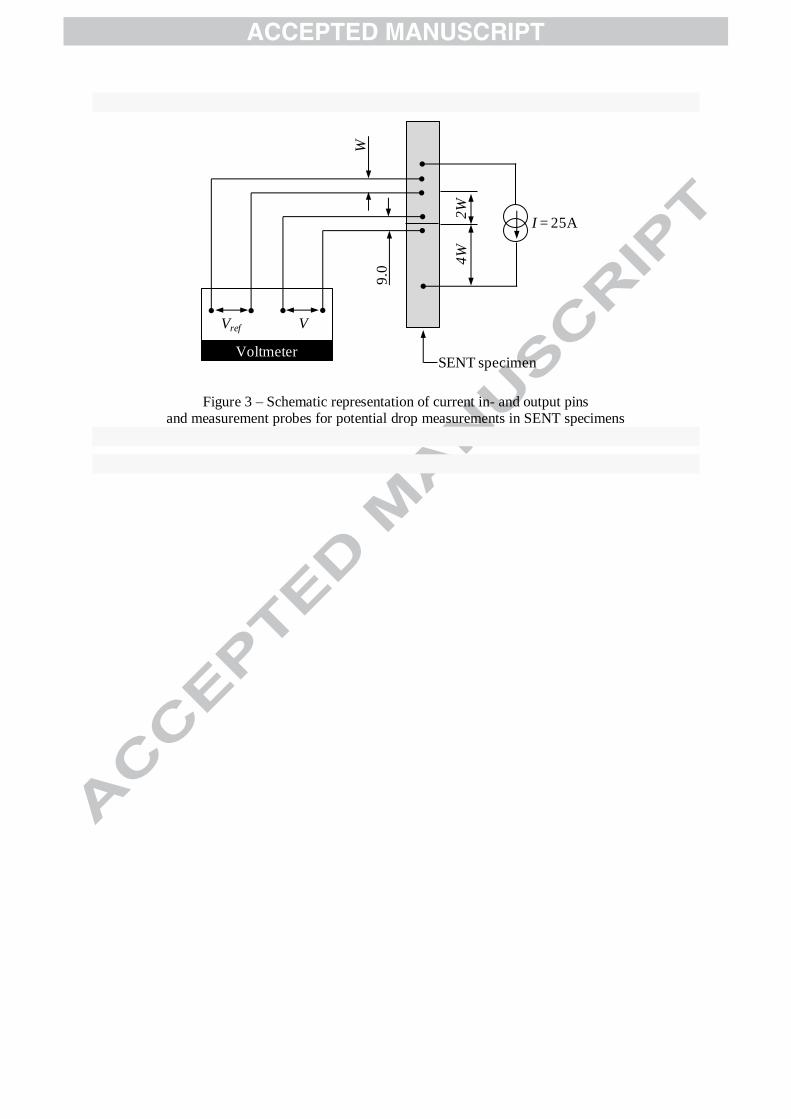
Figure 3 – Schematic representation of current in- and output pins and measurement probes for potential drop measurements in SENT specimens
Voltmeter
VVref
SENT specimen
I = 25A
2W
4W
9.0
W

Figure 4 – Illustration of linear blunting phase obtained from potential drop measurements
0.0
0.5
1.0
1.5
2.0
2.5
0.0 0.5 1.0 1.5 2.0 2.5
V/V
ref
[-]
CMOD [mm]
Measured potential
drop (V/Vref)
Linear blunting phase
(V/Vref|blunt)

Figure 5 – Example fracture surface after heat tinting for specimen WM-03
initial crack
(a0)
ductile crack
extension (a)
brittle fracture
(after cooling)

(a) (b)
Figure 6 - Evaluation of accuracy for unloading compliance (a) and
direct current potential drop (b) method during SENT testing
0,0
1,0
2,0
3,0
4,0
0,0 1,0 2,0 3,0 4,0
Δa
t,u
c[m
m]
Δa9p [mm]
Welded specimens
Base metal specimens
1.96 STD
0.34 mm
WP2-03
0,0
1,0
2,0
3,0
4,0
0,0 1,0 2,0 3,0 4,0Δ
at,pd
[mm
]
Δa9p [mm]
Welded specimens
Base metal specimens
1.96 STD
0.31 mm
WP2-03
(a) (b)
Figure 7 – Effect of blunting correction on the accuracy of the predicted crack extensions for the
unloading compliance (a) and direct current potential drop (b) method
-2,0
-1,0
0,0
1,0
2,0
0,0 1,0 2,0 3,0 4,0
Δa
t,u
c-Δ
a9p
[mm
]
Δa9p [mm]
w/o blunting correction
w/ blunting correction
-2,0
-1,0
0,0
1,0
2,0
0,0 1,0 2,0 3,0 4,0
Δa
t,pd
-Δ
a9p
[mm
]
Δa9p [mm]
w/o blunting correction
w/ blunting correction

Figure 8 – Fracture surface for specimen WP2-03 clearly showing the presence of natural weld defects in the zone of ductile crack extension (indicated by white arrow signs)
left side right side
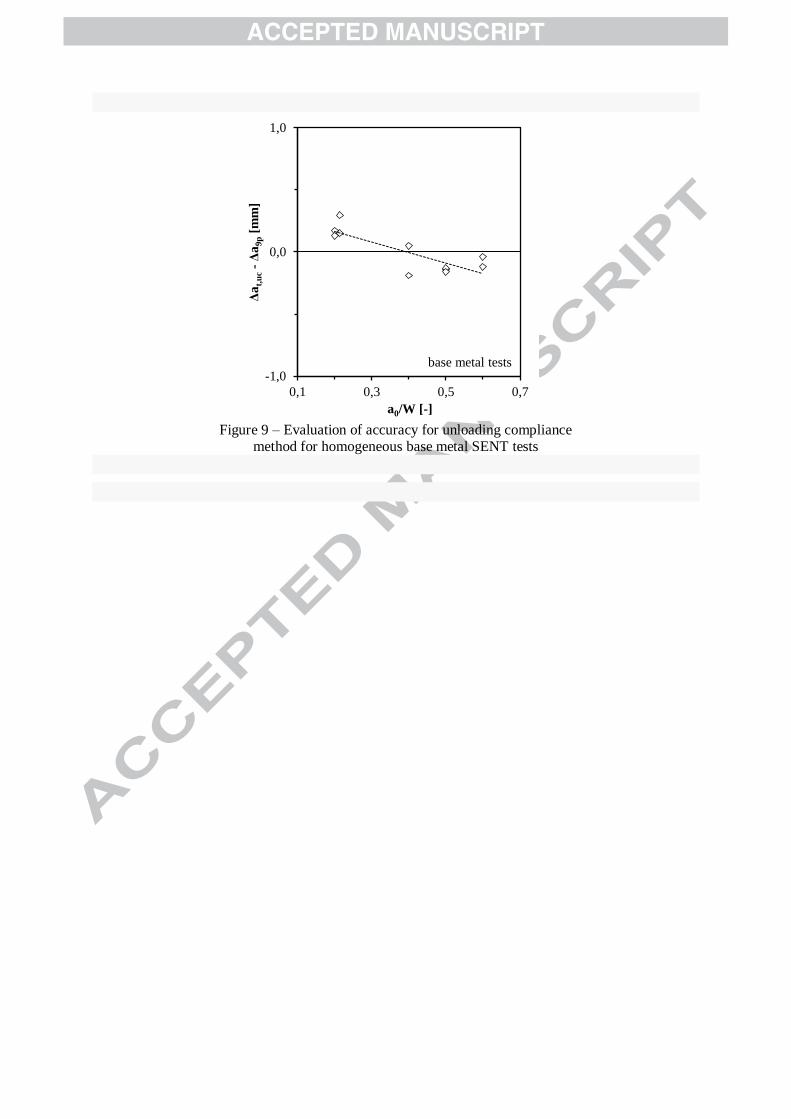
Figure 9 – Evaluation of accuracy for unloading compliance
method for homogeneous base metal SENT tests
-1,0
0,0
1,0
0,1 0,3 0,5 0,7
Δa
t,u
c-Δ
a9p
[mm
]
a0/W [-]
base metal tests

(a) (b)
Figure 10 – Influence of crack front straightness on accuracy of predicted crack extension for potential
drop method for specimens WM-07 to WM-15 (a) and fracture surface showing highly non-uniform
crack extension for specimen WM-15 with a notch located in the through-thickness direction (b)
0,0
1,0
2,0
0,00 0,05 0,10
s cr
[-]
|Δa9p - Δat,pd/uc | / Δa9p [-]
UC
DCPD
Figure 10.b
left side right side
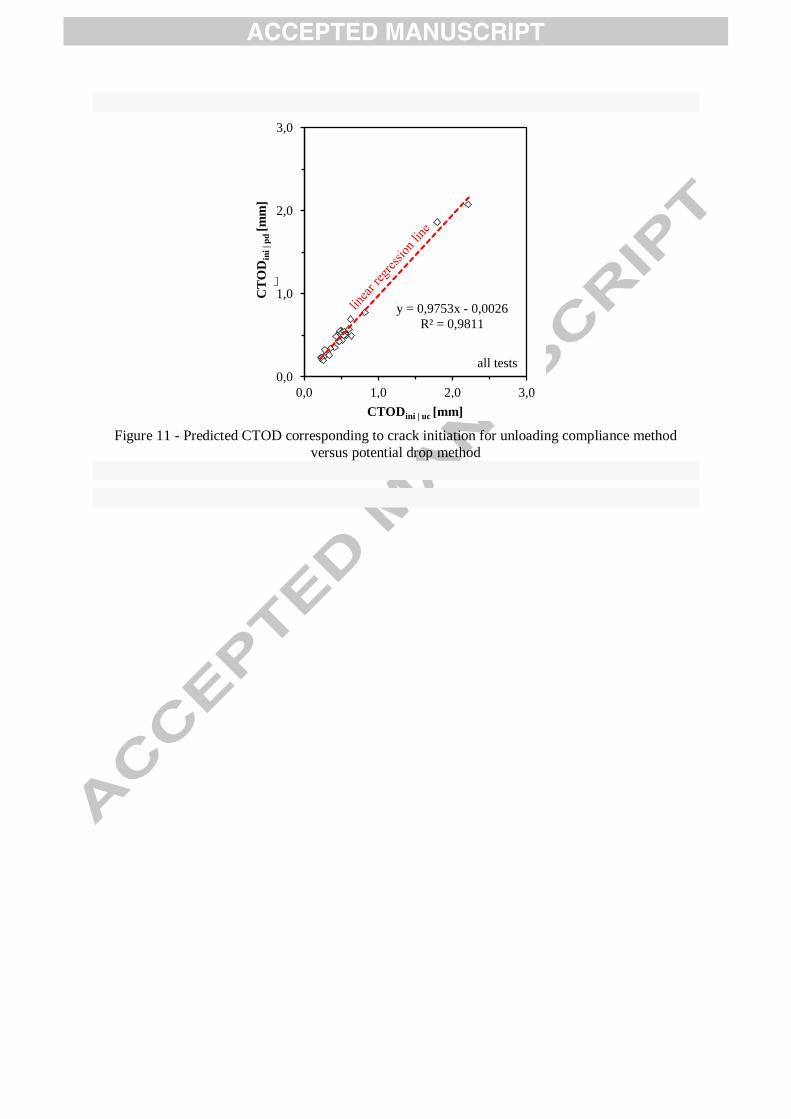
Figure 11 - Predicted CTOD corresponding to crack initiation for unloading compliance method
versus potential drop method
y = 0,9753x - 0,0026
R² = 0,9811
0,0
1,0
2,0
3,0
0,0 1,0 2,0 3,0
ap
d [
mm
]
a9p [mm]CTODini | uc [mm]
CT
OD
ini
| p
d[m
m]
all tests
(a) (b)
Figure 12 - Data points considered to determine tearing resistance curve (a)
and fitted curve in combination with scatter band (b)
0.0
5.0
0 4
CT
OD
[m
m]
∆a [mm]
4A1 SV
4A2 SV
4B1 SV
4B2 SV
WP1-01
WP1-02
WP1-03
WP1-04
0
1
2
3
4
50 31 60 91 121 152 182 213 244 274 305 335 366 397 425 456 486 517 547 578 609 639 670 700 731 762 790 821 851 882 912 943 974
0.0
5.0
0 4C
TO
D [
mm
]∆a [mm]
4A1 SV
4A2 SV
4B1 SV
4B2 SV
WP1-01
WP1-02
WP1-03
WP1-04
2
1 aCTOD
2x s
Tables
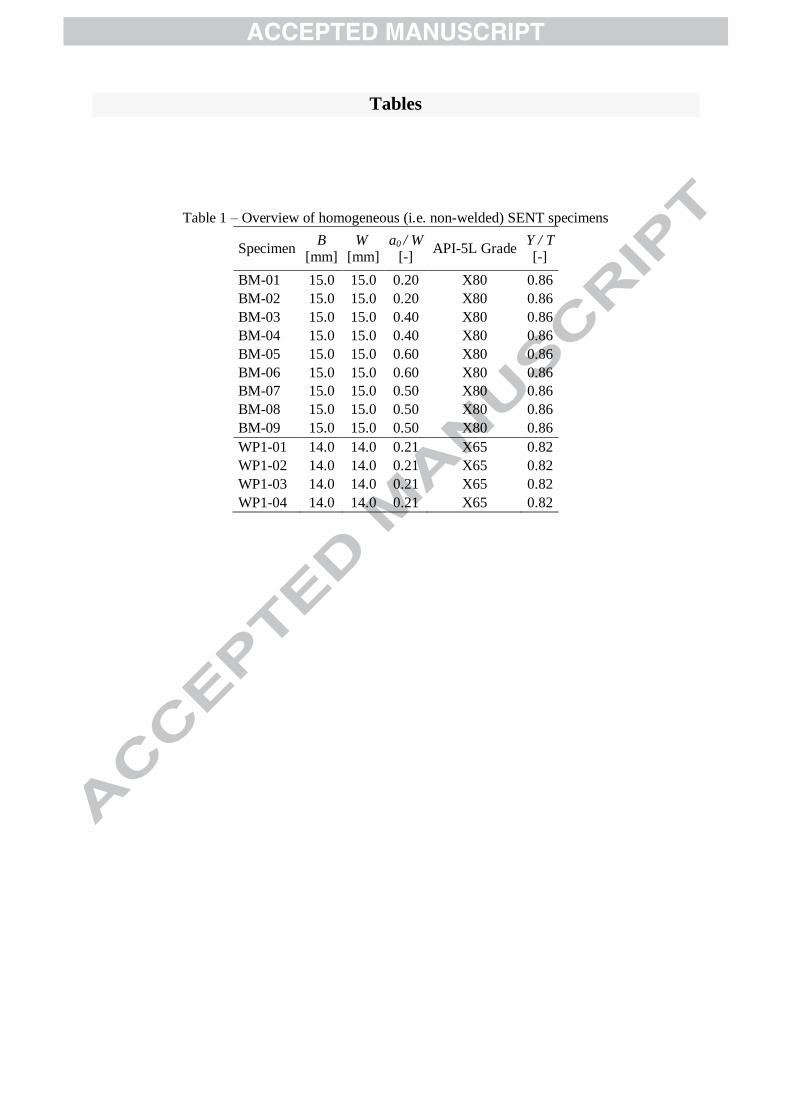
Table 1 – Overview of homogeneous (i.e. non-welded) SENT specimens
Specimen B
[mm] W
[mm] a0 / W
[-] API-5L Grade
Y / T [-]
BM-01 15.0 15.0 0.20 X80 0.86
BM-02 15.0 15.0 0.20 X80 0.86
BM-03 15.0 15.0 0.40 X80 0.86
BM-04 15.0 15.0 0.40 X80 0.86
BM-05 15.0 15.0 0.60 X80 0.86
BM-06 15.0 15.0 0.60 X80 0.86
BM-07 15.0 15.0 0.50 X80 0.86
BM-08 15.0 15.0 0.50 X80 0.86
BM-09 15.0 15.0 0.50 X80 0.86
WP1-01 14.0 14.0 0.21 X65 0.82
WP1-02 14.0 14.0 0.21 X65 0.82
WP1-03 14.0 14.0 0.21 X65 0.82
WP1-04 14.0 14.0 0.21 X65 0.82
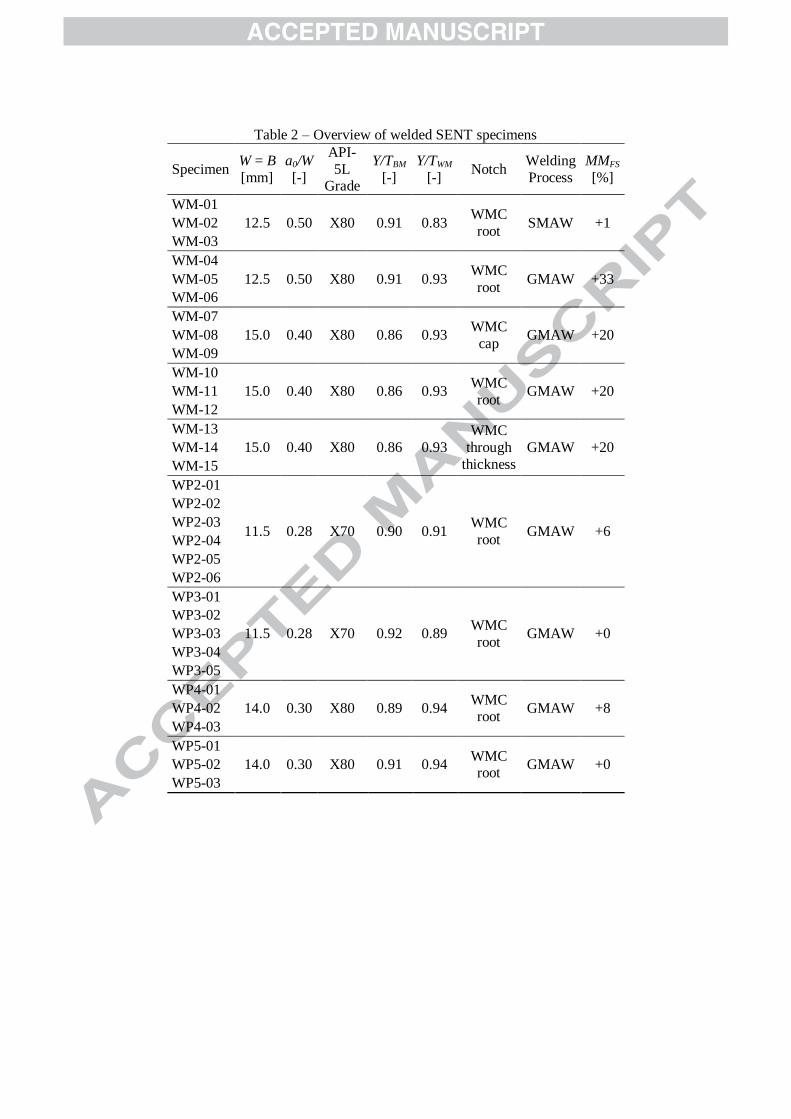
Table 2 – Overview of welded SENT specimens
Specimen W = B
[mm]
a0/W
[-]
API-
5L Grade
Y/TBM
[-]
Y/TWM
[-] Notch
Welding
Process
MMFS
[%]
WM-01
12.5 0.50 X80 0.91 0.83 WMC
root SMAW +1 WM-02
WM-03
WM-04
12.5 0.50 X80 0.91 0.93 WMC
root GMAW +33 WM-05
WM-06
WM-07
15.0 0.40 X80 0.86 0.93 WMC
cap GMAW +20 WM-08
WM-09
WM-10
15.0 0.40 X80 0.86 0.93 WMC
root GMAW +20 WM-11
WM-12
WM-13
15.0 0.40 X80 0.86 0.93
WMC
through
thickness
GMAW +20 WM-14
WM-15
WP2-01
11.5 0.28 X70 0.90 0.91 WMC
root GMAW +6
WP2-02
WP2-03
WP2-04
WP2-05
WP2-06
WP3-01
11.5 0.28 X70 0.92 0.89 WMC
root GMAW +0
WP3-02
WP3-03
WP3-04
WP3-05
WP4-01
14.0 0.30 X80 0.89 0.94 WMC root
GMAW +8 WP4-02
WP4-03
WP5-01
14.0 0.30 X80 0.91 0.94 WMC root
GMAW +0 WP5-02
WP5-03

Table A.1. Curve fitting constants for parameters in Eq. A.1 [13]
r0 r1 r2 r3 r4 r5 r6 r7 r8
2.072 -16.411 -79.600 -211.670 236.857 27.371 -179.740 -86.280 171.764

Nomenclature
a crack depth
a0 initial crack depth
B thickness
Be effective thickness BN net thickness
CMOD Crack Mouth Opening Displacement
CTOD Crack Tip Opening Displacement CTODini CTOD at initiation
DCPD Direct Current Potential Drop
Fmax maximum force
h1 height of first clip gauge above specimen h2 height of second clip gauge above specimen
H daylight grip length
I applied current (25 A for all tests) MMFS mismatch in terms of flow stress
N batch size
Pm limit load scr crack front straightness parameter
SENT Single-Edge Notched Tensile
STD standard deviation
V potential drop across the crack V1 opening of first clip gauge
V2 opening of second clip gauge
UC Unloading Compliance Vref potential drop remote from the crack
W width
WMC Weld Metal Center Y/T Yield-to-Tensile ratio
1 curve fitting parameter for R-curve
2 curve fitting parameter for R-curve
Δa crack extension
ab,uc/pd crack extension attributed to blunting for unloading compliance and potential
drop method
a9p measured crack extension using nine points average method
s width of scatter band in terms CTOD
σ0 yield strength σ FS flow strength
σ TS tensile strength

Highlights
- DCPD en UC suitable for evaluation of ductile crack extension in SENT specimens
- Crack front straightness does not affect accuracy of crack extension measurements
- No difference in accuracy and moment of initiation between both methods