Embed Size (px)
Citation preview
AM 5988 - Revision 1
- 1 -
Single-track length measurements of step-etched fission tracks in Durango apatite: Vorsprung
durch Technik
RAYMOND JONCKHEERE*, MURAT T. TAMER†, FLORENTINE WAUSCHKUHN, BASTIAN WAUSCHKUHN AND LOTHAR RATSCHBACHER
Geologie, Technische Universität Bergakademie Freiberg, 09599 Freiberg (Sachsen), Germany
ABSTRACT
Fossil and induced confined fission tracks in Durango apatite do not etch to their full etchable 1
lengths with the current protocols. Their mean lengths continue to increase at a diminished rate 2
past the break in slope in a length versus etch-time plot, from whereon they are considered to be 3
fully etched. The mean length of the fossil tracks increases from 14.5(1) to 16.2(1) μm and that 4
of the induced tracks from 15.7(1) to 17.9(1) μm between 20s and 60s etching (5.5 M HNO3; 5
21 °C); both are projected to converge towards ~18 μm after ~180 s. This increase is due to 6
track etching, not simple bulk etching. The irregular length increments of individual tracks re-7
veal a discontinuous track structure in the investigated length intervals. The mean lengths of 8
the fossil and induced tracks for the standard etch time (20 s) for the (5.5 M HNO3; 21 °C) etch 9
are thus not the result of a simple shortening of the latent fission tracks but instead of a lower-10
ing of the effective track-etch rate vT. The rate of length increase of individual fossil confined 11
tracks correlates with their length: older tracks are shorter because they etch more slowly. Step 12
etching thus makes it possible to some extent to distinguish between older and younger fossil 13
fission tracks. Along-track vT measurements could reveal further useful paleo-temperature in-14
formation. Because the etched length of a track at standard etch conditions is not its full etcha-15
ble length, geometrical statistics based on continuous line segments of fixed length are less se-16
cure than hitherto held. 17
KEYWORDS
Durango apatite; fission track; step etching; confined-track length 18
* Corresponding author: [email protected]† Present address: Jackson School of Geosciences, The University of Texas at Austin, Austin,Texas, U.S.A.
AM 5988 - Revision 1
- 2 -
BACKGROUND
The conventional fission-track method distinguishes itself from other radiometric geothermo-19
chronometers in that both the parent- and daughter-isotope concentrations are measured by 20
means of proxies. The fossil tracks stand for the daughters produced by spontaneous nuclear 21
fission of 238U. The induced tracks created by thermal-neutron fission of 235U stand for the pre-22
sent concentration of the parent. The damage trails left in the wake of the fission fragments' 23
flight have dimensions (length: ~21 μm; Bhandari et al., 1971; Jonckheere, 2003; diameter: <10 24
nm; Paul and Fitzgerald, 1992) and structure (Miro et al., 2005; Afra et al., 2011; Li et al., 2014; 25
Schauries et al., 2014; Lang et al., 2015). Latent fission tracks are thus susceptible to changes 26
effected by environmental factors, with temperature as the main factor (Fleischer et al., 1964, 27
1974, 1975; Kohn et al., 2003; Schmidt et al., 2014). Each fossil track holds a record of the tem-28
perature effects it experienced from its formation to the present. Apatite fission-track modeling 29
was developed to exploit this stored information for reconstructing the thermal histories of 30
geological samples. 31
The temperature record stored in the fossil tracks is read from the length distribution of etched 32
confined tracks. Etching condenses the information in individual tracks into a single scalar val-33
ue: their etchable length. Tracks that experienced the same environmental conditions are how-34
ever not all etched to the same length as a result of random factors involved in uranium fission, 35
track formation, and repair. Their temperature information is therefore reflected in the mean of 36
their etched-length distribution. Length variations due to the possible effects of the anisotropic 37
properties of the track detector on track formation, annealing, and etching are systematic and 38
can be accounted for (Galbraith and Laslett, 1988; Donelick, 1991; Donelick et al., 1999; Gal-39
braith, 2002; Ketcham et al., 2007). 40
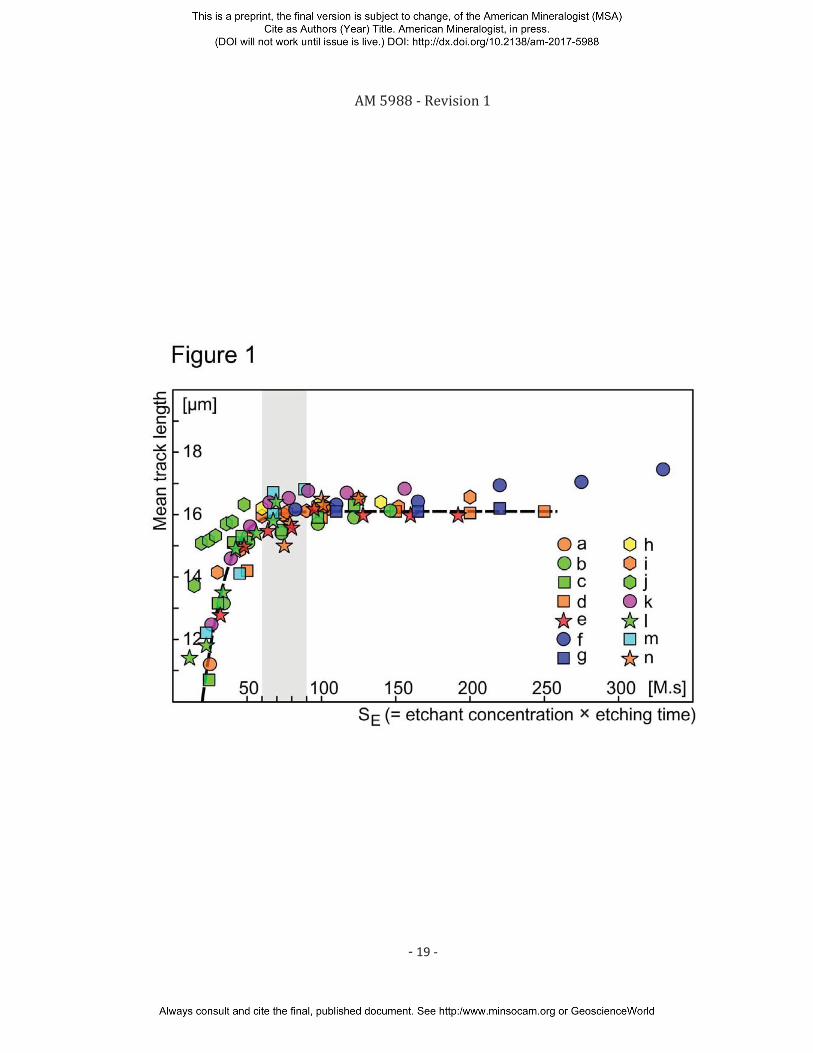
Step-etch experiments show that the mean length of induced fission tracks in apatite increases 41
fast up to an etch strength SE (SE = etchant concentration (M) × etch time (s)) of ~50 M.s, fol-42
lowed by a slow - or no - increase (Figure 1). The data scatter prevents us from concluding 43
whether the transition is gradual or not. Etching to just past the transition point (60 ≲ SE ≲ 90) 44
is considered ideal; tracks on either side are either "under-etched" or "over-etched" (Laslett et 45
al., 1984). The basic model holds that the confined-track length increases at twice the track-etch 46
rate vT until the etchant reaches both ends, and the track is revealed over its full etchable length, 47
and at twice the bulk-etch rate vB thereafter (Laslett et al., 1984). The lack of experimental evi-48
dence of bulk etching (Figure 1; except f) was explained by the fact that most of the measured 49
tracks at each etch step represent a new sample of confined tracks (Green et al., 1986). Both the 50
AM 5988 - Revision 1
- 3 -
Barbarand et al. (2003) data for under-etched tracks (SE < 60 M.s; Figure 1j) and the Carlson et 51
al. (1999) data for over-etched tracks (SE > 90 M.s; Figure 1f) lie above the fitted trend. This 52
could be due to a stricter selection of well-etched tracks for length measurement, compared to 53
the other experiments. This could itself be a bias resulting from the attempt to measure un-54
deretched tracks or from the use of Cf-irradiation for increasing the number of measureable 55
confined tracks close to the sample surface, or from other causes. 56
It is important to distinguish etch effects from temperature effects for extracting temperature 57
data from length measurements of etched fossil confined tracks. This contribution reports the 58
results of a step-etch experiment aimed at a better understanding of track etching. It exploits 59
the advantages of software-controlled motorized microscope stages for recording the position 60
of each confined track and revisiting it after each succeeding step, enabling the investigation of 61
the same track population after each step and the re-measurement of individual track lengths 62
rather than the population mean. In this manner, we compare fossil and induced fission tracks, 63
in annealed and un-annealed Durango apatite. This allows us to address two important ques-64
tions: "do fossil tracks etch like induced tracks?", and "do induced tracks in a natural apatite 65
etch as in annealed apatite?". 66
EXPERIMENT
We cut three ~1 mm-thick sections parallel to the c-axes of cm-sized Durango apatite crystals 67
with a Struers Accutom-50 precision saw. We annealed one section for 24 h at 450 °C in a Gero 68
tube furnace to erase the fossil tracks and exposed it together with an un-annealed section to a 69
nominal thermal-neutron fluence of 5×1015 cm-2 in channel X26 of the BR-1 reactor (SCK•CEN 70
Mol, Belgium) to produce induced fission tracks. We neither annealed nor irradiated the third 71
section, which retained its natural complement of fossil fission tracks. We mounted the three 72
sections in Araldite resin, ground them with #1200 SiC sanding paper, and polished the exposed 73
surfaces with 6-, 3-, and 1-μm diamond suspensions on a Struers RotoPol-35 apparatus 74
equipped with a PdM-Force-20 sample holder. After polishing, we reduced the mount thick-75
nesses to ~2 mm and affixed them to microscope slides. We etched the tracks in 5.5 M HNO3 at 76
21.0 ± 0.1 °C for 20 s (Carlson et al., 1999), and rinsed them immediately upon extraction from 77
the solution successively in two large volumes of fresh deionised water in order to arrest etch-78
ing. We measured the confined-track lengths with a Zeiss M2m microscope with a motorized 79
stage connected to a desktop computer running the Zeiss AxioVision software, which permits 80
recording the coordinates, length and orientation of each track. We then re-etched the samples 81
AM 5988 - Revision 1
- 4 -
for 10 s under the same conditions as before, and re-measured each confined track, except 82
those that we could not measure again, because their ends were hidden by neighboring tracks 83
or because they had been exhumed due to bulk etching of the apatite surface. We repeated this 84
procedure three more times, giving five length measurements for each surviving track. All 85
measured tracks were included in the statistics up to the point that they were lost. Tables 1 and 86
2 summarize the length data. 87
RESULTS AND DISCUSSION
Confined-track lengths
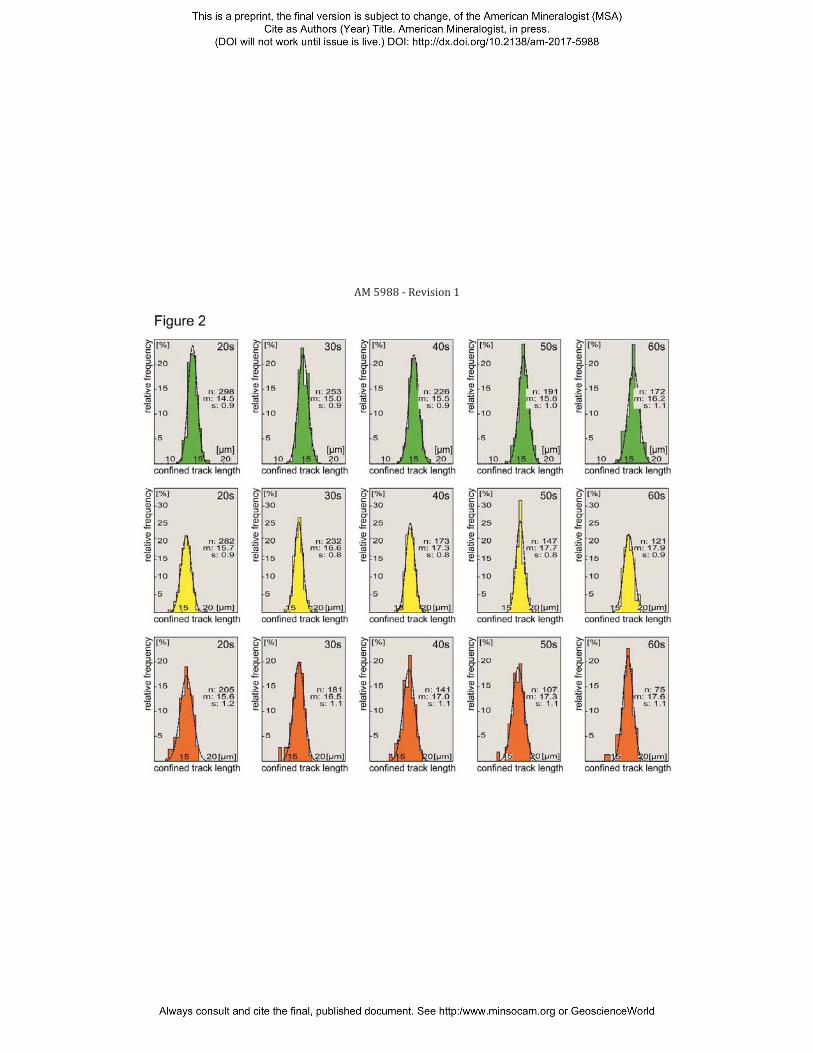
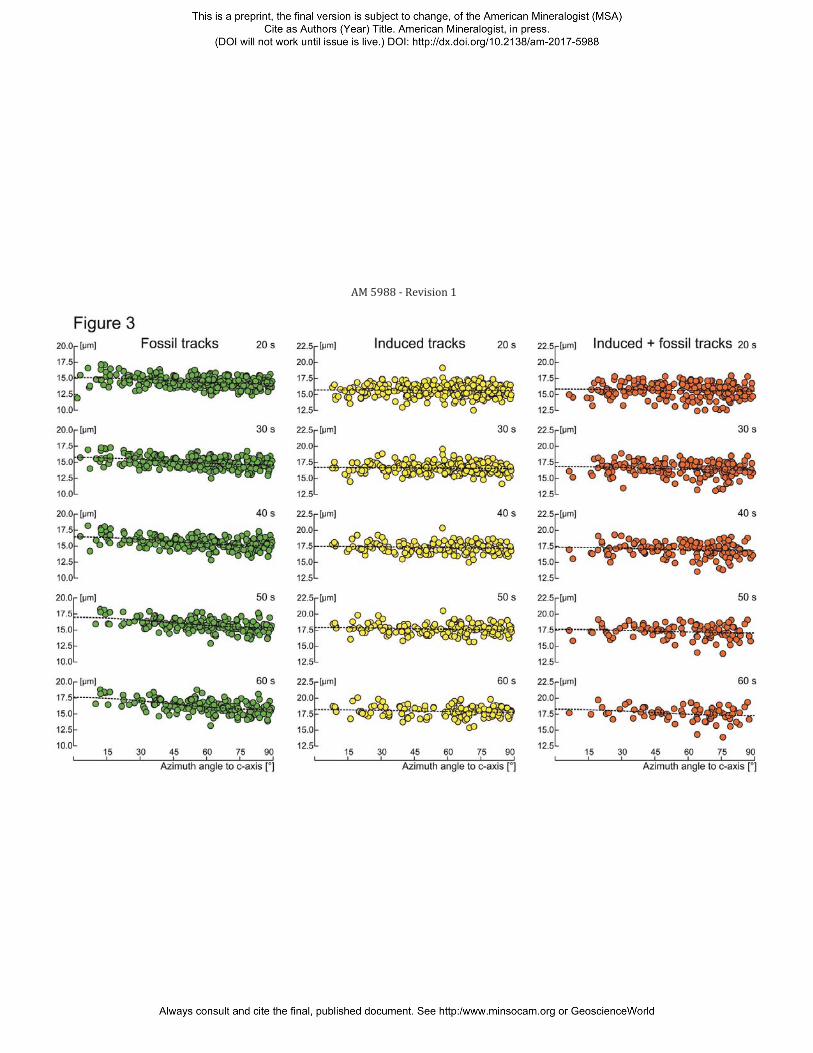
Figures 2 and 3 show the track-length distributions and scatter plots of the track lengths against 88
their angles to the c-axis. The results of the 20-s etch are consistent with published data. The 89
mean length of the induced tracks (15.67(06) μm) agrees within statistical error with the over-90
all mean for several laboratories using different etch conditions (15.89(12) μm; Ketcham et al., 91
2015). The mean length of the fossil tracks (14.47(05) μm) agrees with the mean for different 92
etches listed in Jonckheere et al. (2015, Table 2; 14.35(08) μm). The mean for the sample with 93
both fossil and induced tracks (15.63(08) μm) is intermediate between these values but close to 94
that of the induced tracks. This is consistent with the nominal neutron fluence (5×1015 cm-2), 95
corresponding to a ratio of volumetric latent track densities NS/NI = 0.12 (~11% fossil (NS) and 96
~89% induced (NI) tracks)1. 97
Gaussian functions provide a good fit to the fossil- and induced-track-length distributions and 98
even to the length distribution of the sample with both fossil and induced tracks (Table 1; Fig-99
ure 2); this is an observation. The length distribution of the fossil tracks is the mean-length-100
weighted sum of those tracks that underwent different geological length shortening; that of the 101
sample with fossil and induced tracks also includes tracks that experienced no geological length 102
reduction. There is also no physical imperative for a Gaussian distribution of the induced-track 103
lengths. The fits are therefore considered coincidental. The means and standard deviations of 104
the fitted Gaussian distributions are nevertheless in agreement with the corresponding statis-105
tics based on the raw data (Table 1). The standard deviations of the fossil- (0.86 μm) and in-106
duced-track-length distributions (0.93 μm) are consistent with predictions based on the mean 107
1 The purpose of the sample with fossil and induced tracks is to compare the etching of induced tracks in natural and annealed apatite. The neutron fluence was calculated to swamp the sample with induced tracks while keep-ing the track density low enough for track-length measurements at extended etch times. We observed, however, that the track statistics are almost exactly those of a weighted sum of the fossil and induced tracks, and analysed the results accordingly.
AM 5988 - Revision 1
- 5 -
track lengths (Carlson et al., 1999; Donelick et al., 1999; Ketcham et al., 2000; Ketcham, 2005). 108
Ellipses fitted to the length-versus-orientation data are in broad agreement with model expecta-109
tions (Figure 3) but indicate somewhat less anisotropic track lengths than earlier studies using 110
the same etchant (Donelick, 1991; Donelick et al., 1999; Ketcham, 2003); induced tracks: LA/LC 111
= 1.00(01); fossil tracks: LA/LC = 0.94(01); LA = minor axis; LC = major axis). The minor and ma-112
jor axes of an ellipse fitted to the sample with both fossil and induced tracks are in numerical 113
agreement with the fraction-weighted and length-bias-corrected values calculated from the cor-114
responding axes of the ellipses fitted to the fossil- and induced-track data. 115
The track-length distributions retain an approximate Gaussian shape through consecutive 116
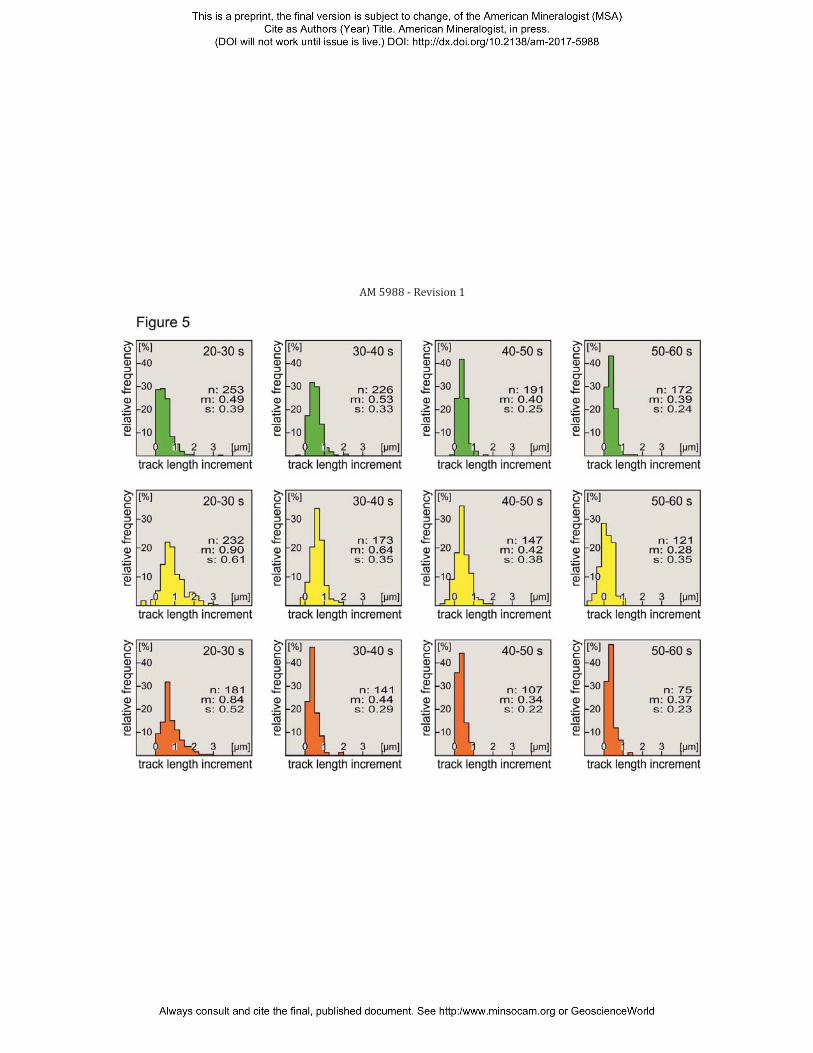
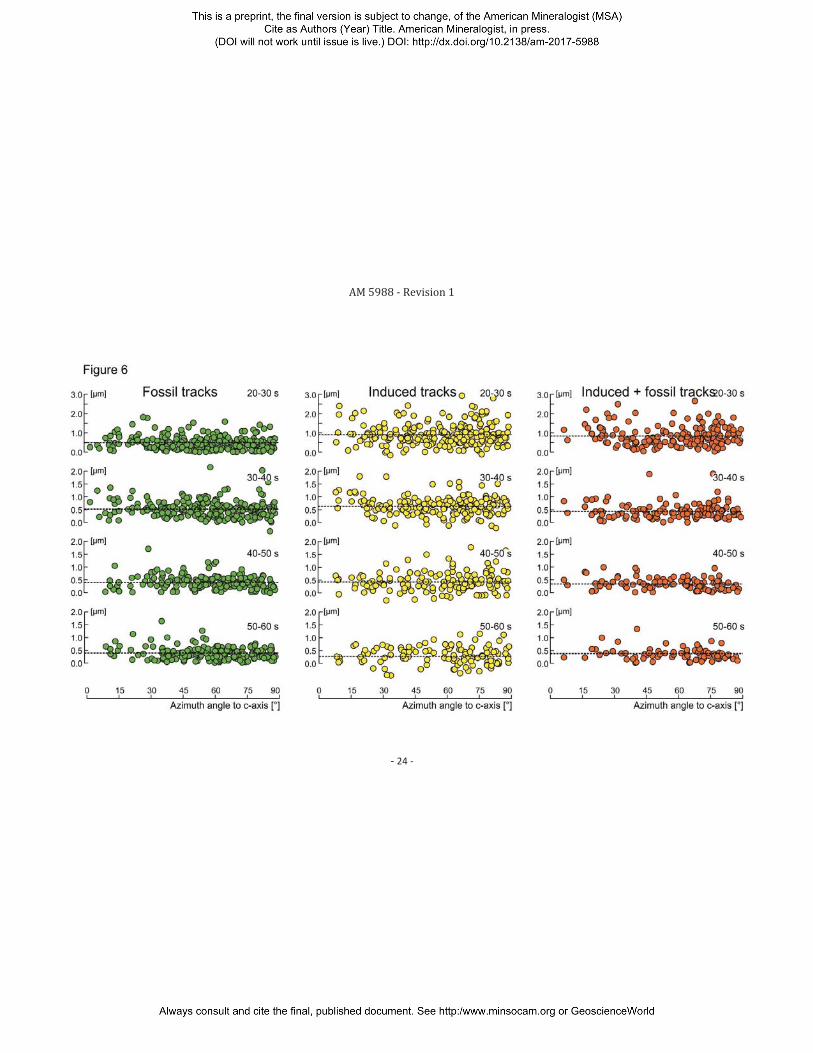
etch steps (Figure 2) with little change of their standard deviations but a clear increase of 117
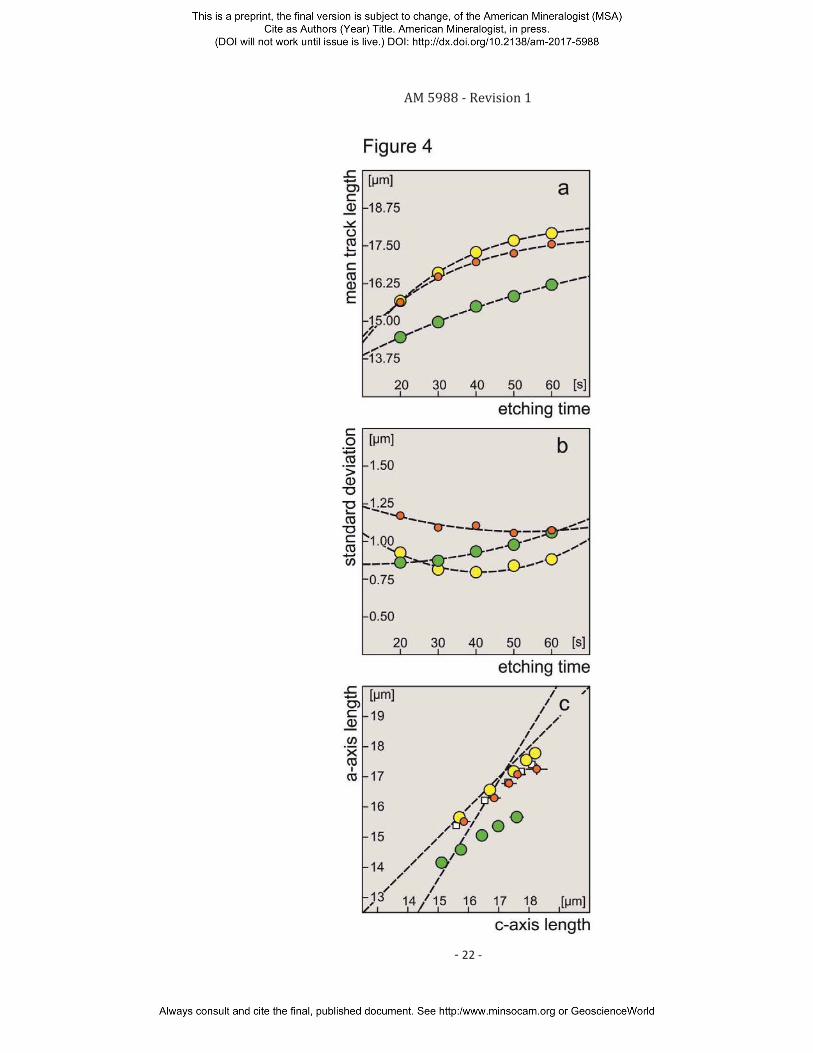
their means (Table 1). Figure 4 shows the means, standard deviations and c- and a-axis 118
lengths plotted against etch time. The mean length of the induced tracks increases at a some-119
what different rate than that of the fossil tracks (Figure 4a). Both rates drop off with increas-120
ing etch time but the decrease of that of the induced tracks is more marked than that of the 121
fossil tracks. The mean confined-track length and its rate of increase of the sample with both 122
fossil and induced tracks are intermediate between the two and consistent with the fraction-123
weighted and length-bias-corrected average of the values for the fossil and induced fission 124
tracks. The extrapolated mean track lengths of the three samples converge on ~18 μm at 125
~180 s etch time. This could indicate that fossil and induced tracks have the same maximum 126
etchable length, ~20% shorter than the combined range of the fission fragments (21.9(9) μm; 127
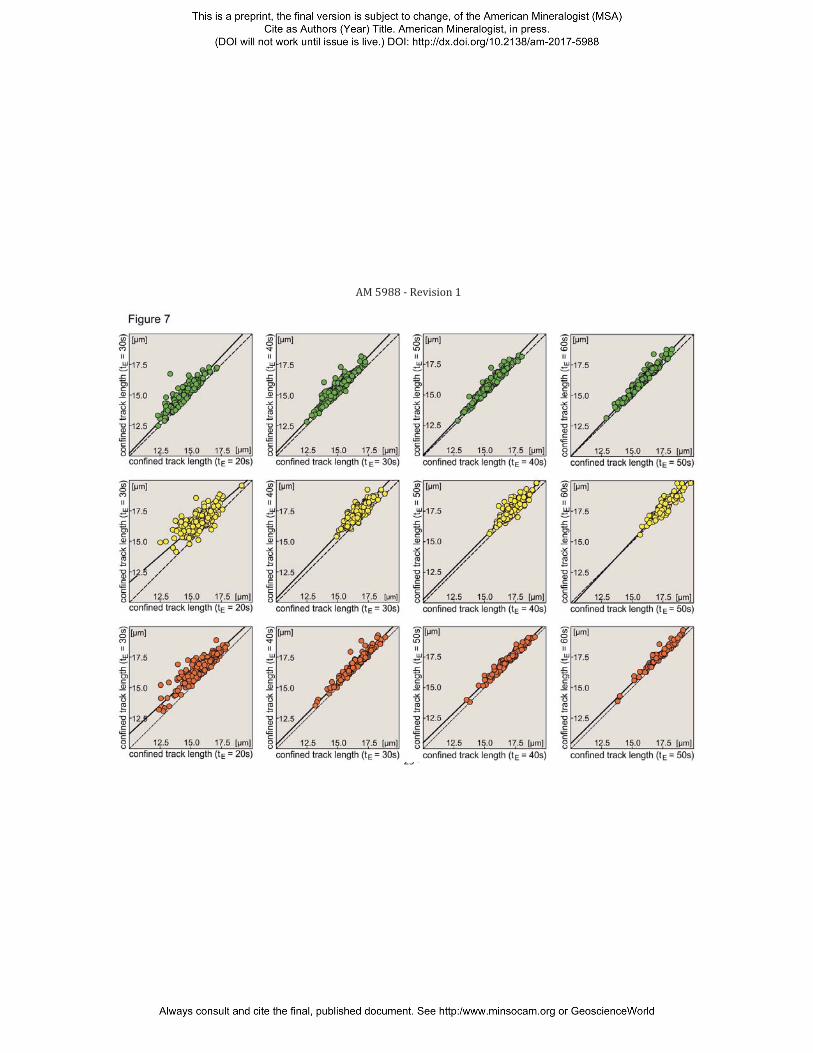
Jonckheere, 2003), or it could be a coincidence. The standard deviations of the length distribu-128
tions of fossil and induced tracks also exhibit a different dependence on etch time (Figure 4b). 129
That of the fossil tracks increases, while that of the induced tracks passes through a minimum 130
at 40 s. That of the fossil plus induced tracks remains high despite a small decrease. 131
An elliptical model continues to provide an acceptable description of the variation of track 132
length with orientation at longer etch times (30-60 s; Table 1; Figure 3). Both the fossil- and 133
induced-track lengths become more anisotropic (Figure 4c). The trends are weak but never-134
theless systematic and that of the fossil tracks is somewhat more pronounced than that of the 135
induced tracks. The trend for the sample with fossil and induced tracks is intermediate be-136
tween the two, and the c- and a-axis lengths of the fitted ellipses are consistent with the frac-137
tion-weighted and length-bias-corrected averages of the c- and a-axis lengths of the samples 138
with fossil and induced fission tracks (Tables 1 and 2). 139
AM 5988 - Revision 1
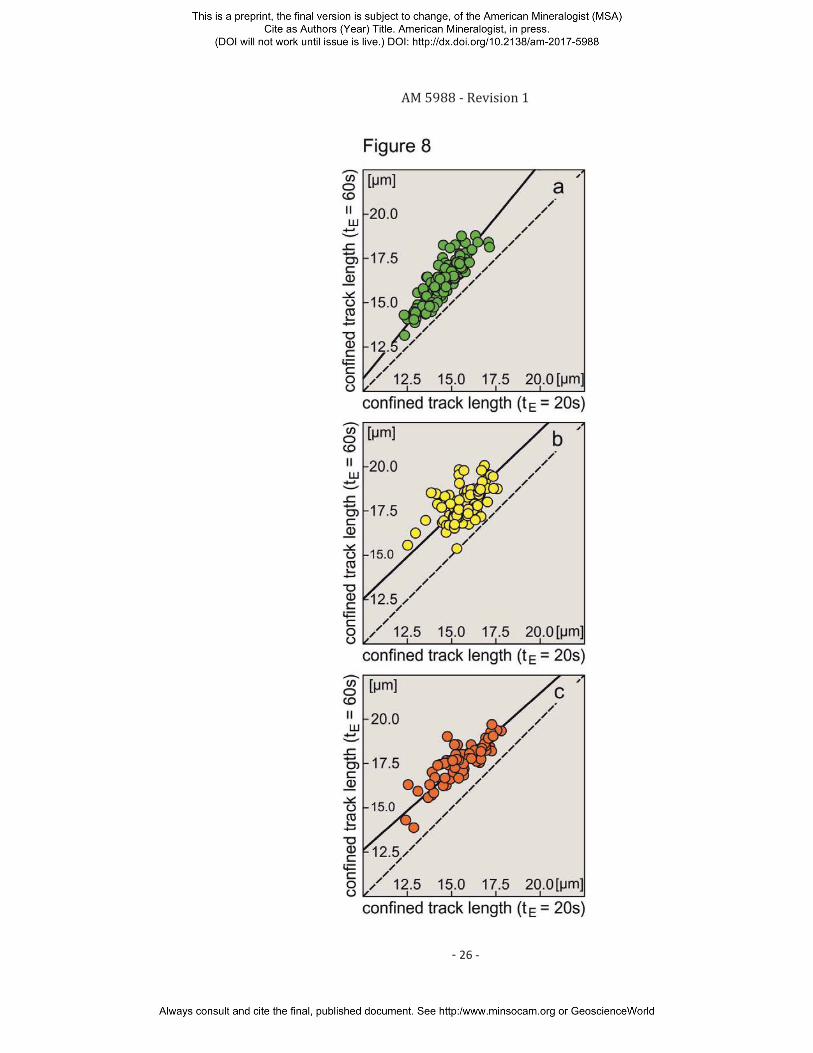
- 6 -
Track-length increments
Figure 5 shows the distributions of the length increments between consecutive etch steps and 140
Figure 6 scatter plots of the increments versus the track angles to the c-axis. The increments are 141
not constant but irregular. Most are <1 μm but some up to 2 μm and even 3 μm. The distribu-142
tions of the length increments are therefore skewed to the right in Figure 5. The average incre-143
ment is more or less constant for the fossil tracks but decreases with each consecutive etch step 144
for the induced fission tracks. The range of individual increments is also broadest from the first 145
to the second step (20-30 s) and decreases thereafter, which is reflected in the standard devia-146
tions (Table 3). The first increment (20-30 s) is greater for both samples containing induced 147
fission tracks than for that with only fossil tracks. The scatter plots show that the length incre-148
ments do not correlate with the track orientations. The tracks lost after each step are also un-149
correlated with their orientations. 150
A comparison of the lengths of individual tracks before and after each etch step (Figure 7) pro-151
vides a means of examining the correlation between the track-length increments and track 152
lengths. For the first step (20-30 s etching), the larger length increments are associated with the 153
shorter tracks in both samples containing induced tracks but with the longer tracks in the sam-154
ple with fossil tracks. The case of the induced tracks can be understood as a consequence of the 155
operators' criteria for selecting well-etched tracks. The operators in this case judged some 156
tracks well etched after 20 s that could after 30 s be reclassified as having been under-etched, 157
based on their shorter starting lengths and larger increments. Such subjective decisions could 158
have contributed to the large spread of mean induced-track lengths reported in a blind experi-159
ment (Ketcham et al., 2015). The fact that this is not the case for the fossil tracks seems to indi-160
cate that the length measurements of these tracks are less susceptible to judgement calls than 161
are those of the induced tracks. It is not improbable that this is related to the smaller average 162
increments. 163
The increase of the induced-track length through subsequent steps is less clear. The results for 164
both samples with induced tracks provide no positive indication of a correlation with track 165
length after 30 s. The weak anti-correlation between the initial (20 s) and final (60 s) lengths 166
(Figure 8) can be attributed to the first increment (20-30 s; Figure 7). The statistics of the sam-167
ple with fossil and induced tracks are consistent with the fraction-weighted and length-bias-168
corrected averages of the fossil and the induced tracks (Tables 1-3; Figures 4a, c). This signifies 169
that the induced-track lengths and their rate of increase in the natural and annealed sample are 170
the same. Low self-irradiation-damage densities (Dα ≤ 1016 g-1 for ≤20 ppm U and ≤350 ppm Th, 171
ignoring Sm; Young et al., 1969; Kimura et al., 2000; Boyce and Hodges, 2005; Morishita et al., 172
AM 5988 - Revision 1
- 7 -
2008; Johnstone et al., 2013; Abdullin et al., 2014; Chew et al., 2014; Soares et al., 2014) thus 173
appear to have no effect on the formation or immediate reorganization (Donelick et al., 1991) of 174
fission tracks, at least none that is detectable by step etching. An earlier investigation reported 175
identical track openings (Dpar; Donelick, 1993; 1995; Burtner et al., 1994) of fossil and induced 176
tracks in Durango apatite (etched 15-45 s in 4.0 M HNO3 at 25 °C; Jonckheere et al., 2007). Both 177
these observations suggest that neither self-irradiation damage nor that from neutron irradia-178
tion affect the bulk-etching properties of this apatite - or have the same effect. 179
The case of the fossil tracks wants a different explanation. We can exclude that the correlation 180
between their initial length (20 s) and length increase is due to track-to-track differences result-181
ing from variable uranium fission or random effects during track formation, because these also 182
affect the induced tracks. The observed correlation must thus be related to the geological histo-183
ries (ages) of individual fossil tracks. Single-track step-etch experiments thus enable us to dis-184
tinguish between older shorter tracks with lower terminal etch rates (e.g., vT = 2.0 μm/min for 185
LM = 13 μm) and younger longer tracks with higher terminal etch rates (e.g., vT = 3.0 μm/min for 186
LM = 16 μm). It therefore appears possible that step-etch experiments might allow distinguish-187
ing successive generations of fossil tracks in geological samples and provide additional details 188
about the environmental factors (temperatures) that affected them, resulting in more detailed 189
thermal histories. 190
The length increase of both the fossil and induced tracks with increasing etch time is not the 191
result of bulk etching (vB) but of track etching (vT). Simple bulk etching cannot account for the 192
unequal length increases between steps or track-to-track differences. Simple bulk etching is 193
also inconsistent with the diminishing rate of increase of the induced-track lengths and the dif-194
ferent rates of increase of the fossil and induced track lengths. Radiation damage in the sample 195
with fossil tracks is not the cause of the latter difference, since the induced tracks in the an-196
nealed and unannealed sample exhibit the same behavior. It follows that the fossil and induced 197
tracks are longer than their measured lengths at the standard etch time (20 s). The fact that fos-198
sil tracks can be etched to lengths (16.21(08) μm; 60 s; Table 1) exceeding those of induced 199
tracks at standard etch conditions (15.67(06) μm; 20 s) but appear shorter (14.47(05) μm; 200
20 s) is thus not the result of an actual shortening of the latent tracks but of a lowering of the 201
effective track-etch rate vT, at least in the investigated length intervals. The fact that induced 202
tracks can be etched to 17.92(08) μm (60 s; Table 1) implies that a lowering of vT also explains 203
their length reduction in the time interval between 10-11 minutes (Durango: 16.6(1) μm; 25 s 204
in 5 M HNO3 at 23 °C; Donelick et al., 1991) and 41 days (16.2(1) μm) after the neutron irradia-205
tion that produced them. 206
AM 5988 - Revision 1
- 8 -
Track structure
The irregular length increments of individual tracks past the break in slope favor a discontinu-207
ous (Dartyge et al., 1981; Pellas and Perron, 1984; Dartyge and Sigmund, 1985; Green et al. 208
1986; Paul and Fitzgerald, 1992; Hejl, 1995; Villa et al., 1999; Jaskierowicz et al., 2004; Li et al., 209
2011; 2012; 2014) over a continuous (Carlson, 1993; Afra et al., 2011; Kluth et al., 2012; Schau-210
ries et al., 2014) damage model. The high etch rate before the break in slope (40-50 μm/min) in 211
the length versus etch-strength plot (Figure 1) suggests a more continuous central track section. 212
Although it is evident that our observations are related to the earlier experiments of Green et al. 213
(1986), there are also differences. Their gap model refers to tracks at high angles to the c-axis 214
near complete annealing, whereas our results refer to fossil and induced tracks with all orienta-215
tions in samples that experienced nothing more than ambient-temperature annealing. Our ob-216
servations also relate to terminal track sections that are not etched under standard conditions. 217
Green et al. (1986) distinguished two stages in the annealing of fission tracks in apatite: a grad-218
ual shrinkage of the tracks resulting from gentle to moderate annealing, followed by the ap-219
pearance of gaps on more severe annealing. This raises the question whether the gradual stage 220
of Green et al. (1986) is in fact gradual at the level of individual tracks, or only at the level of 221
their mean lengths. The mean lengths for our step-etch experiments also appear to increase in a 222
gradual fashion. 223
The fact that the track sections from 14.5 to 16.2 μm (fossil tracks) and from 15.7 to 17.9 μm 224
(induced tracks) can be etched also implies that their starting lengths, in general attributed to 225
(ambient temperature) annealing, are not a result of an actual shortening of the latent tracks 226
but of a lowering of the effective track-etch rate. The notion of a discontinuous track, made up of 227
slower and faster etching sections, confounds the meaning of the track-etch rate. However, an 228
effective etch rate vT can be defined as the length of an etched section divided by the time it 229
takes to etch; vT averages over the length of the considered section and varies along the track. 230
Because it is measured along the track and determined by the remains of the original track ra-231
ther than the pre-existing lattice, we continue to refer to vT as a track-etch rate. A lowering of vT 232
could result from a reorganization of faster- and slower-etching (gap) sections, or from a lower-233
ing of the etch rate of either, or both. Our observations nevertheless allow some tentative sup-234
positions, although we need more experiments to confirm them. (1) The unequal increments 235
from track to track suggest that the separation between successive gaps is of the order of sub-236
AM 5988 - Revision 1
- 9 -
stantial fractions of a micrometer rather than smaller, i.e. the track is discontinuous at a course 237
scale. (2) The significant drop of the etch rate at the track ends compared to its midsection indi-238
cates that gaps exert a strong influence over the effective etch rate vT. (3) In view of this, the fact 239
that the induced tracks length increases at almost the same rate parallel and perpendicular to 240
the c-axis, i.e. the lack of a pronounced anisotropy (Figure 4c), suggests that gaps etch at a high-241
er rate than that of the pristine lattice, perhaps assisted by residual defects. (4) The slower and 242
more anisotropic length increase of the fossil tracks could then both result from a depletion of 243
residual defects in the gaps. (5) The remaining track segments and gaps nevertheless have con-244
trasting etch rates. 245
The observation that there exist, under standard conditions, no full-length tracks, implies that 246
the etched length of a track cannot be equated with its etchable length. The application of geo-247
metrical statistics based on continuous line segments of fixed length is thus problematic (Laslett 248
et al., 1984). Considering that (1) otherwise unetchable terminal sections of surface-intersecting 249
tracks can be etched by surface-assisted sub-threshold etching (Wauschkuhn et al., 2015b) and 250
that (2) a limited shortening of fossil confined tracks does not cause a proportionate lowering of 251
the fission-track age (Gleadow and Duddy, 1981; Gleadow et al., 1983; Wauschkuhn et al., 2015a; 252
Jonckheere et al., 2015), the current model relating surface-track densities to mean confined-253
track lengths (Laslett et al., 1984; Galbraith and Laslett, 1988; Galbraith et al., 1990; Galbraith, 254
2002; Ketcham, 2003) is less secure than we assume. Jonckheere et al. (2015) calculated the 255
effective lengths (lE = 2ρ/N; ρ: surface-track density; N; volume-track density) of fossil and in-256
duced tracks in Durango apatite (fossil: 16.3(3) μm; induced: 16.8(4) μm). This bears out that 257
surface tracks can etch to longer lengths than confined tracks by surface-assisted sub-threshold 258
etching (Wauschkuhn et al., 2105b). 259
IMPLICATIONS
Computer-controlled motorized microscopes and software make it possible to perform repeat-260
ed length measurements of individual confined fission tracks. The lengths of fossil and induced 261
tracks in apatite continue to increase in fits and starts past the point where they are supposed 262
to be well etched. This is due to etching of intermittent damage along the tracks, not to bulk 263
etching. The application of geometrical statistics based on continuous line segments of fixed 264
length is thus questionable. This implies that the theoretical relationship between surface-track 265
densities and mean confined-track lengths must be re-examined. Other empirical relationships, 266
AM 5988 - Revision 1
- 10 -
such as that between the standard deviation and mean of the track-length distribution and that 267
between the mean, a-axis- and c-axis-projected confined-track lengths remain valid under the 268
conditions under which they were established, but should not be used with different etching 269
conditions. The mean rate of length increase of individual fossil confined tracks is correlated 270
with their length. Step etching thus makes it possible, to some extent, to distinguish between 271
slower-etching older tracks and faster-etching younger tracks. Geological applications based on 272
step-etching, e.g., involving two steps (20 s and 40 s), would have the advantage of tightening 273
the distribution of the induced tracks and stretching that of the fossil tracks, which would in 274
principle contribute to an increased resolution of the resulting temperature-time paths. Along-275
track etch-rate measurements could reveal additional paleo-temperature information. This 276
needs a serious calibration effort but has the potential of realizing significant progress in apatite 277
fission-track modeling. 278
ACKNOWLEDGEMENT
Work supported by the German Research Foundation (DFG grants JO 358/3 and RA 442/27). 279
We are obligated to B. Van Houdt (BR-1 reactor; SCK•CEN Mol, Belgium) for the thermal-neu-280
tron irradiation, and to P. Van den haute (Ghent University, Belgium) for discussion of the man-281
uscript. We are indebted to E. Sobel (University of Potsdam) and an unnamed referee for their 282
insightful comments. 283
AM 5988 - Revision 1
- 11 -
References
Abdullin, F., Solé J., and Solari, L. (2014) Fission-track dating and LA-ICP-MS multi-elemental 284 analysis of the fluorapatite from Cerro de Mercado (Durango, Mexico). Revista Mexicana de 285 Ciencias Geológicas, 31, 395-406 (in Spanish). 286
Afra, B., Lang, M., Rodriguez, M., Zhang, D.J., Giulian, R., Kirby, N., Ewing, R.C., Trautmann, C., 287 Toulemonde, M., and Kluth, P. (2011) Annealing kinetics of latent particle tracks in Durango 288 apatite. Physical Review B, 83, 064116/1-5. 289
Barbarand, J., Hurford, A., and Carter, A. (2003) Variation in apatite fission-track length meas-290 urement: implications for thermal history modelling. Chemical Geology, 198, 77-106. 291
Boyce, J.W., and Hodges, K.V. (2005) U and Th zoning in Cerro de Mercado (Durango, Mexico) 292 fluorapatite: insights regarding the impact of recoil redistribution of radiogenic 4He on (U-293 Th)/He thermochronology. Chemical Geology, 219, 261- 274. 294
Burtner, R.L., Nigrini, A., and Donelick, R.A. (1994) Thermochronology of lower Cretaceous 295 source rocks in the Idaho-Wyoming Thrust Belt. American Association of Petroleum Geolo-296 gists Bulletin, 78, 1613-1636. 297
Carlson, W.D. (1990) Mechanisms and kinetics of apatite fission-track annealing. American Min-298 eralogist, 75, 1120-1139. 299
Carlson, W.D., Donelick, R.A., and Ketcham, R.A. (1999) Variability of apatite fission-track an-300 nealing kinetics: I. Experimental results. American Mineralogist, 84, 1213-1223 301
Chew, D.M., Petrus, J.A., and Kamber, B.S. (2014) U-Pb LA-ICPMS dating using accessory mineral 302 standards with variable common Pb. Chemical Geology, 363, 185-199. 303
Crowley, K.D., Cameron, M., and Schaefer, R.I. (1991) Experimental studies of annealing of 304 etched fission tracks in fluorapatite. Geochimica et Cosmochimica Acta, 55, 1449-1465. 305
Dartyge, E., Duraud, J.P., Langevin, Y., and Maurette, M. (1981) New model of nuclear particle 306 tracks in dielectric minerals. Physical Review B, 23, 5213-5229. 307
Dartyge, E., and Sigmund, P. (1985) Tracks of heavy ions in muscovite mica: Analysis of the rate 308 of production of radiation defects. Physical Review B, 32, 5429-5431. 309
Donelick, R.A. (1991) Crystallographic orientation dependence of mean etchable fission track 310 length in apatite: an empirical model and experimental observations. American Mineralogist, 311 76, 83-91. 312
--- (1993) A method of fission track analysis utilizing bulk chemical etching of apatite. Patent 313 No. 5,267,274, U.S.A. 314
--- (1995) A method of fission track analysis utilizing bulk chemical etching of apatite. Patent 315 No. 658,800, Australia. 316
Donelick, R.A., Roden, M.K., Moers, J.D., Carpenter, B.S., and Miller D.S. (1990) Etchable length 317 reduction of induced fission tracks in apatite at room temperature (~23°C): crystallographic 318 orientation effects and "initial" mean lengths. Nuclear Tracks and Radiation Measurements, 319 17, 261-265. 320
Donelick, R.A., Ketcham, R.A., and Carlson, W.D. (1999) Variability of apatite fission-track an-321 nealing kinetics: II. Crystallographic orientation effects. American Mineralogist, 84, 1224-322 1234. 323
AM 5988 - Revision 1
- 12 -
Fleischer, R.L., Price, P.B., and Walker, R.M. (1965) Effects of temperature, pressure, and ioniza-324 tion on the formation and stability of fission tracks in minerals and glasses. Journal of Geo-325 physical Research, 70, 1497-1502. 326
--- (1975) Nuclear tracks in solids. Principles and applications. University of California Press, 327 Berkeley, pp. 604. 328
Fleischer, R.L., Woods, R.T., Hart, H.R. Jr., Price, P.B., and Short, N.M. (1974) Effect of shock on 329 fission track dating of apatite and sphene crystals from the Hardhat and Sedan underground 330 nuclear explosions. Journal of Geophysical Research, 79, 339-342. 331
Galbraith, R.F. (2002) Some remarks on fission-track observational biases and crystallographic 332 orientation effects. American Mineralogist, 87, 991–995. 333
Galbraith, R.F., and Laslett, G.M. (1988) some calculations relevant to thermal annealing of fis-334 sion tracks in apatite. Proceedings of the Royal Society of London A, 419, 305-321. 335
Galbraith, R.F., Laslett, G.M., Green, P.F., and Duddy, I.R. (1990) Apatite fission track analysis: 336 geological thermal history analysis based on a three-dimensional random process of linear 337 radiation damage. Philosophical Transactions of the Royal Society of London A, 332, 419-338 438. 339
Gleadow, A.J.W., and Duddy, I.R. (1981) A natural long-term track annealing experiment for apa-340 tite. Nuclear Tracks, 5, 169-174. 341
Gleadow, A.J.W., Duddy, I.R., and Lovering, J.F. (1983) Fission track analysis: a new tool for the 342 evaluation of thermal histories and hydrocarbon potential. Australian Petroleum Exploration 343 Association Journal, 23, 93-102. 344
Green, P.F., Duddy, I.R., Gleadow, A.J.W., Tingate, P.R., and Laslett, G.M. (1986) Thermal anneal-345 ing of fission tracks in apatite. 1. A qualitative description. Chemical Geology (Isotope Geosci-346 ence Section), 59, 237-253. 347
Hejl, E. (1995) Evidence for unetchable gaps in apatite fission tracks. Chemical Geology (Isotope 348 Geoscience Section), 122, 259-269. 349
Jaskierowicz, G., Dunlop, A., and Jonckheere, R. (2004) Track formation in fluorapatite irradiated 350 with energetic cluster ions. Nuclear Instruments and Methods in Physics Research B, 222, 351 213-227.352
Johnstone, S., Hourigan, J., and Gallagher, C. (2013) LA-ICP-MS depth profile analysis of apatite: 353 Protocol and implications for (U-Th)/He thermochronometry. Geochimica et Cosmochimica 354 Acta, 109,143-161. 355
Jonckheere, R. (2003) On the ratio of induced fission-track densities in a mineral and a co-356 irradiated muscovite external detector with reference to fission-track dating of minerals. 357 Chemical Geology, 200, 41-58. 358
Jonckheere, R., Enkelmann, E., Min, M., Trautmann, C., and Ratschbacher, L. (2007) Confined 359 fission tracks in ion-irradiated and step-etched prismatic sections of Durango apatite. Chemi-360 cal Geology, 242, 202-217. 361
Jonckheere, R., Van den haute, P., and Ratschbacher, L. (2015) Standardless fission-track dating 362 of the Durango apatite age standard. Chemical Geology, 417, 44–57. 363
Ketcham, R.A. (2003) Observations on the relationship between crystallographic orientation 364 and biasing in apatite fission-track measurements. American Mineralogist, 88, 817–829. 365
AM 5988 - Revision 1
- 13 -
--- (2005) Forward and inverse modeling of low-temperature thermochronometry data. Re-366 views in Mineralogy and Geochemistry, 58, 275-314. 367
Ketcham, R.A., Carter, A., Donelick, R.A., Barbarand, J., and Hurford, A.J. (2007) Improved meas-368 urement of fission-track annealing in apatite using c-axis projection. American Mineralogist, 369 92, 789-798. 370
Ketcham, R.A., Carter, A., and Hurford, A.J. (2015) Inter-laboratory comparison of fission track 371 confined length and etch figure measurements in apatite. American Mineralogist, 100, 1452-372 1468. 373
Ketcham, R.A., Donelick, R.A., and Donelick, M.B. (2000) AFTSolve: A program for multi-kinetic 374 modeling of apatite fission-track data. Geological Materials Research, 2(1), (electronic: 18 375 pages, 2 tables, 12 figures). Mineralogical Society of America, Washington, D.C. 376
Kimura, J.-I., Danhara, T., and Iwano, H. (2000) A preliminary report on trace element determi-377 nations in zircon and apatite crystals using Excimer Laser Ablation - Inductively Coupled 378 Plasma Mass Spectrometry (ExLA-ICPMS). Fission Track Newsletter, 13, 11-20. 379
Kluth, P., Afra, B., Rodriguez, M.D., Lang, M., Trautmann, C., and Ewing, R.C. (2012) Morphology 380 and annealing kinetics of ion tracks in minerals. EPJ Web of Conferences, 35, 0300/1-4. 381
Kohn, B.P., Belton, D.X., Brown, R.W., Gleadow, A.J.W., Green, P.F., and Lovering, J.F. (2003) 382 Comment on: "Experimental evidence for the pressure dependence of fission track annealing 383 in apatite" by A.S. Wendt et al. [Earth Planet. Sci. Lett. 201 (2002) 593-607]. Earth and Plane-384 tary Science Letters, 215, 299–306. 385
Lang, M., Devanathan, R., Toulemonde, M., and Trautmann, C. (2015) Advances in understanding 386 of swift heavy-ion tracks in complex ceramics. Current Opinion in Solid State and Materials 387 Science, 19, 39-48. 388
Laslett, G.M., Gleadow, A.J.W., and Duddy, I.R. (1984) The relationship between fission track 389 length and track density in apatite. Nuclear Tracks, 9, 29-38. 390
Li, W.-X., Wang, L., Lang, M., Trautmann, C., and Ewing, R.C. (2011) Thermal annealing mecha-391 nisms of latent fission tracks: Apatite vs. zircon. Earth and Planetary Science Letters, 302, 392 227–235. 393
Li, W.-X., Lang, M., Gleadow, A.J.W., Zdorovets, M.V., and Ewing R.C. (2012) Thermal annealing of 394 unetched fission tracks in apatite. Earth and Planetary Science Letters, 321-322, 121–127. 395
Li, W.-X., Kluth, P., Schauries, D., Rodriguez, M.D., Lang, M., Zhang, F., Zdorovets, M., Trautmann, 396 C., and Ewing R.C. (2014) Effect of orientation on ion track formation in apatite and zircon. 397 American Mineralogist, 99, 1127-1132. 398
Miro, S., Grebille, D., Chateigner, D., Pelloquin, D., Stoquert, J.-P., Grob, J.-J., Costantini, J.-M., and 399 Studer, F. (2005) X-ray diffraction study of damage induced by swift heavy ion irradiation in 400 fluorapatite. Nuclear Instruments and Methods in Physics Research B, 227, 306-318. 401
Morishita, T., Hattori, K.H., Terada, K., Matsumoto, T., Yamamoto, K., Takebe, M., Ishida, Y., 402 Tamura, A., and Arai, S. (2008) Geochemistry of apatite-rich layers in the Finero phlogopite-403 peridotite massif (Italian Western Alps) and ion microprobe dating of apatite. Chemical Ge-404 ology, 251, 99-111. 405
Paul, T.A., and Fitzgerald, P.G. (1992) Transmission electron microscopic investigation of fission 406 tracks in fluorapatite. American Mineralogist, 77, 336-344. 407
AM 5988 - Revision 1
- 14 -
Pellas, P., and Perron, C. (1984) Track formation models: a short review. Nuclear Instruments 408 and Methods in Physics Research, 31, 387-393. 409
Schauries, D., Afra, B., Bierschenk, T., Lang, M., Rodriguez, M.D., Trautmann, C., Li, W.-X., Ewing, 410 R.C., and Kluth, P. (2014) The shape of ion tracks in natural apatite. Nuclear Instruments and411 Methods in Physics Research B, 326, 117-120.412
Schmidt, J.S., Lelarge, M.L.M.V., Conceicao, R.V., and Balzaretti, N.M. (2014) Experimental evi-413 dence regarding the pressure dependence of fission track annealing in apatite. Earth and 414 Planetary Science Letters, 390, 1-7. 415
Soares, C.J., Guedes, S., Hadler, J.C., Mertz-Kraus, R., Zack, T., and Iunes, P.J. (2014) Novel calibra-416 tion for LA-ICP-MS-based fission-track thermochronology. Physics and Chemistry of Miner-417 als, 41, 65-73. 418
Villa, F., Grivet, M., Rebetez, M., Dubois, C., Chambaudet, A., Chevarier, A., Martin, P., Brossard, F., 419 Blondiaux, G., Sauvage, T., and Toulemonde, M. (1999) Damage morphology of Kr ion tracks 420 in apatite: dependence on dE/dx. Radiation Measurements, 31, 65-70. 421
Watt, S., and Durrani, S.A. (1985) Thermal stability of fission tracks in apatite and sphene: using 422 confined track length measurements. Nuclear Tracks, 10, 349-357. 423
Watt, S., Green, P.F., and Durrani, S.A. (1984) Studies of annealing anisotropy of fission tracks in 424 mineral apatite using track-in-track, TINT, length measurements. Nuclear Tracks, 8, 371-375. 425
Wauschkuhn, B., Jonckheere, R., and Ratschbacher, L. (2015a) The KTB apatite fission-track pro-426 files: building on a firm foundation? Geochimica et Cosmochimica Acta, 167, 27-62. 427
Wauschkuhn, B., Jonckheere, R., and Ratschbacher, L. (2015b) Xe- and U-tracks in apatite and 428 muscovite near the etching threshold. Nuclear Instruments and Methods in Physics Research 429 B, 343, 146-152. 430
Young, E.J., Myers, A.T., Munson, E.L., and Conklin, N.M. (1969) Mineralogy and geochemistry of 431 fluorapatite from Cerro de Mercado, Durango, Mexico. U.S. Geological Survey Professional 432 Paper, 650, 84-93. 433
AM 5988 - Revision 1
- 15 -
Figure captions
Figure 1. Published step-etch data for induced fission tracks in apatite etched in nitric acid; 434
mean confined-track length plotted against etch strength SE (concentration × etch time); (a) 435
Laslett et al. (1984; 5 M); (b) Watt et al. (1984; 1.3 M); (c) Watt and Durrani (1985; 1.3 M); 436
(d) Green et al. (1986; 5 M); (e) Crowley et al. (1991; 1.6 M); (f) Carlson et al. (1999; 5.5 M);437
(g) Jonckheere et al. (2007; 5.5M); (h) Jonckheere et al. (2007; 4.0M); (i) Barbarand et al.438
(2003; 5M); (j) Barbarand et al. (2003; 0.8M); (k) Tello et al. (2006; 1.3 M); (l) Moreira et al.439
(2010; 0.75M); (m) Moreira et al. (2010; 1.5M); (n) Moreira et al. (5.0M). Like colors indi-440
cate like concentrations. Measurement errors, where cited, are in general less than the441
symbol size. The shaded interval corresponds to conditions producing confined tracks that442
are considered "well etched" or "full length". The etch-strength scale along the horizontal443
axis is a convenience; it is not implied that is accounts for all the differences between the444
different etches used.445
Figure 2. Length distributions of the fossil (green), induced (yellow), and fossil plus induced 446
(orange) confined tracks in step-etched prism sections of Durango apatite (bin width: 0.5 447
μm). The dashed lines are fitted Gaussian distributions. Statistics: n: number of tracks; m 448
(μm) and s (μm): mean and standard deviation of the track length distribution. 449
Figure 3. Lengths of fossil and induced confined fission tracks in step-etched prism sections of 450
Durango apatite plotted against their orientation to the c-axis. Green: fossil tracks in the 451
unannealed Durango apatite; yellow: induced tracks in the neutron-irradiated, pre-452
annealed sample; orange: fossil and induced tracks in neutron-irradiated, unannealed sam-453
ple; dashed lines: fitted ellipses plotted in Cartesian co-ordinates. 454
Figure 4. Means (a) and standard deviations (b) of length distributions of fossil (green), in-455
duced (yellow), and fossil plus induced (orange) confined fission tracks in prism sections of 456
Durango apatite, plotted against etch time. (c) Plot of the a-versus c-axis lengths of ellipses 457
fitted to the track length-versus-orientation data (green: fossil tracks; yellow: induced 458
tracks; orange: fossil plus induced tracks); the small white squares are predictions of the 459
mixed trend based on the fossil- and induced-track length data. The dashed lines in (a) are 460
ad hoc sigmoidal fits to the data lM = α / (1+exp((tE - γ)/β), with α (μm), β (s), and γ (s) con-461
stants. The dashed lines in (b) are ad hoc second degree polynomials fitted to the data; the 462
AM 5988 - Revision 1
- 16 -
dashed lines in (c) are the 1:1 (diagonal) and the a- versus c-axis relationship of Donelick et 463
al. (1999). Except where error bars are shown, the errors are smaller than the symbols. 464
Figure 5. Frequency distributions of the length increments between consecutive etch steps of 465
fossil (green), induced (yellow), and fossil plus induced (orange) confined tracks in prism 466
sections of Durango apatite (bins: 0.25 μm). Statistics: n: number of tracks; m (μm) and s 467
(μm): mean and standard deviation of the length-increment distribution. 468
Figure 6. Length increments of fossil (green), induced (yellow), and fossil plus induced (or-469
ange) confined fission tracks plotted against the angle of the fission track to the crystallo-470
graphic c-axis. 471
Figure 7. Lengths of single confined tracks in Durango apatite (fossil: green, induced: yellow, 472
fossil plus induced: orange) at consecutive etch steps plotted against one another. The solid 473
lines are geometric mean regression lines; the dashed diagonal lines are 1:1 lines. 474
Figure 8. Lengths of single fossil and induced confined fission tracks in prism sections of Du-475
rango apatite at 60 s etching plotted against their lengths at 20 s (5.5 M HNO3, 21 °C). The 476
solid lines are geometric mean regression lines; the dashed diagonal lines are 1:1. 477
AM 5988 - Revision 1
- 17 -
Tables
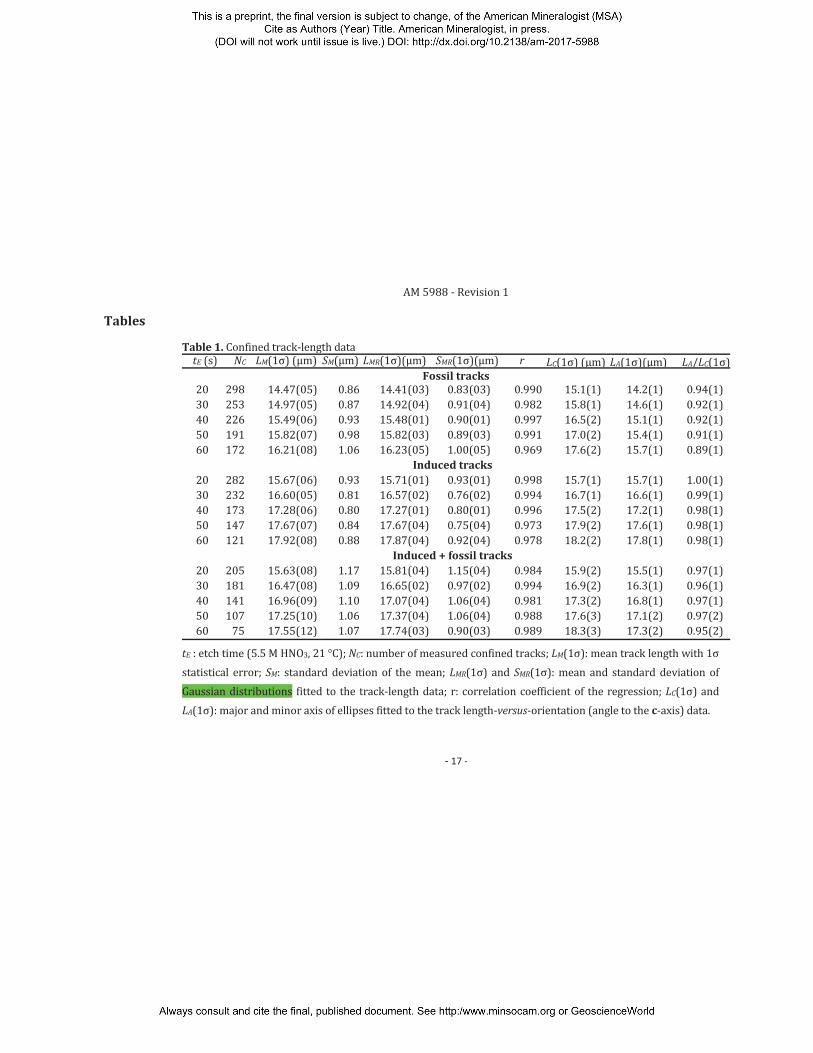
Table 1. Confined track-length data tE (s) NC LM(1σ) (μm) SM(μm) LMR(1σ)(μm) SMR(1σ)(μm) r LC(1σ) (μm) LA(1σ)(μm) LA/LC(1σ)
Fossil tracks 20 298 14.47(05) 0.86 14.41(03) 0.83(03) 0.990 15.1(1) 14.2(1) 0.94(1) 30 253 14.97(05) 0.87 14.92(04) 0.91(04) 0.982 15.8(1) 14.6(1) 0.92(1) 40 226 15.49(06) 0.93 15.48(01) 0.90(01) 0.997 16.5(2) 15.1(1) 0.92(1) 50 191 15.82(07) 0.98 15.82(03) 0.89(03) 0.991 17.0(2) 15.4(1) 0.91(1) 60 172 16.21(08) 1.06 16.23(05) 1.00(05) 0.969 17.6(2) 15.7(1) 0.89(1)
Induced tracks 20 282 15.67(06) 0.93 15.71(01) 0.93(01) 0.998 15.7(1) 15.7(1) 1.00(1) 30 232 16.60(05) 0.81 16.57(02) 0.76(02) 0.994 16.7(1) 16.6(1) 0.99(1) 40 173 17.28(06) 0.80 17.27(01) 0.80(01) 0.996 17.5(2) 17.2(1) 0.98(1) 50 147 17.67(07) 0.84 17.67(04) 0.75(04) 0.973 17.9(2) 17.6(1) 0.98(1) 60 121 17.92(08) 0.88 17.87(04) 0.92(04) 0.978 18.2(2) 17.8(1) 0.98(1)
Induced + fossil tracks 20 205 15.63(08) 1.17 15.81(04) 1.15(04) 0.984 15.9(2) 15.5(1) 0.97(1) 30 181 16.47(08) 1.09 16.65(02) 0.97(02) 0.994 16.9(2) 16.3(1) 0.96(1) 40 141 16.96(09) 1.10 17.07(04) 1.06(04) 0.981 17.3(2) 16.8(1) 0.97(1) 50 107 17.25(10) 1.06 17.37(04) 1.06(04) 0.988 17.6(3) 17.1(2) 0.97(2) 60 75 17.55(12) 1.07 17.74(03) 0.90(03) 0.989 18.3(3) 17.3(2) 0.95(2)
tE : etch time (5.5 M HNO3, 21 °C); NC: number of measured confined tracks; LM(1σ): mean track length with 1σ statistical error; SM: standard deviation of the mean; LMR(1σ) and SMR(1σ): mean and standard deviation of Gaussian distributions fitted to the track-length data; r: correlation coefficient of the regression; LC(1σ) and LA(1σ): major and minor axis of ellipses fitted to the track length-versus-orientation (angle to the c-axis) data.
AM 5988 - Revision 1
- 18 -
Table 2. Properties of the sample with fossil and induced tracks tE (s) LMS/LMI(1σ) NS/NI(1σ) LC*(1σ)(μm) LA*(1σ)(μm)
20 0.92(01) 11.8(1) 15.6(7) 15.4(7) 30 0.90(01) 9.1(1) 16.5(7) 16.2(7) 40 0.90(01) 9.1(1) 17.3(8) 16.8(7) 50 0.90(01) 9.3(1) 17.7(8) 17.2(8) 60 0.90(01) 10.3(1) 18.0(8) 17.4(8)
LMS/LMI: ratio of fossil and induced mean track lengths; NS/NI: ratio
of fossil and induced volumetric track densities; LC* and LA*: pre-dicted major and minor-axis of ellipses fitted to the length-versus-orientation data.
Table 3. Confined track-length increments ΔtE (s) NC ΔLM(1σ) (μm) SD (μm)
Fossil tracks 20-30 253 0.49(02) 0.39 30-40 226 0.53(02) 0.33 40-50 191 0.40(02) 0.25 50-60 172 0.39(02) 0.24 20-60 172 1.69(04) 0.52
Induced tracks 20-30 231 0.90(04) 0.61 30-40 172 0.64(03) 0.35 40-50 142 0.42(03) 0.38 50-60 119 0.28(03) 0.35 20-60 119 2.22(07) 0.81
Induced + fossil tracks 20-30 179 0.84(04) 0.52 30-40 141 0.44(02) 0.29 40-50 106 0.34(02) 0.22 50-60 75 0.37(03) 0.23 20-60 75 1.99(08) 0.68
ΔtE: etch-time interval (5.5 M HNO3, 21°C); NC: number of measured track-length incre-ments; ΔLM(1σ): mean increment and 1σ er-ror; SD (μm): standard deviation of the track-
length-increment distribution.
AM 5988 - Revision 1
- 19 -
AM 5988 - Revision 1
- 20 -
AM 5988 - Revision 1
- 21 -
AM 5988 - Revision 1
- 22 -
AM 5988 - Revision 1
- 23 -
AM 5988 - Revision 1
- 24 -
AM 5988 - Revision 1
- 25 -
AM 5988 - Revision 1
- 26 -


![[PPT]Maintenance DA 5988-E - Q&a | AskTOP.net - Leader ...asktop.net/wp/download/22/Maintenance Filling out the... · Web viewMaintenance DA 5988-E The data on DA Form 5988-E is divided](https://img.pdfslide.net/doc/110x75/5b19511a7f8b9a32258c8106/pptmaintenance-da-5988-e-qa-leader-asktopnetwpdownload22maintenance.jpg)