Embed Size (px)
Citation preview
FACING THE FUTURE:
Findings from the review of efficiencies and operations in fire and rescue authorities in England
Sir Ken Knight CBE QFSM FIFireE
May 2013
Facing the Future
The findings and recommendations in this report are those of the author and do not necessarily represent the views or proposed policies of the Department for Communities and Local Government.
© Queen’s Printer and Controller of Her Majesty’s Stationery Office, 2013 Copyright in the typographical arrangement rests with the Crown. You may re-use this information (not including logos) free of charge in any format or medium, under the terms of the Open Government Licence. To view this licence, visit http://www.nationalarchives.gov.uk/doc/open-government-licence/ or write to the Information Policy Team, The National Archives, Kew, London TW9 4DU, or e-mail: [email protected]. This document/publication is also available on our website at www.gov.uk/dclg Any enquiries regarding this document/publication should be sent to us at: Department for Communities and Local Government Eland House Bressenden Place London SW1E 5DU Telephone: 030 3444 0000 For all our latest news and updates follow us on Twitter: https://twitter.com/CommunitiesUK
May, 2013 ISBN: 978-1-4098-3887-6
2

Findings of the review into efficiency and operations of fire and rescue authorities in England
Contents Foreword 4 How this review was conducted 6 Executive summary and key findings 7 List of Figures 10 Chapter 1: What is efficiency and how efficient is the delivery of fire and rescue services in England? 11 Section 1.1: How have risks and resource changed over time? 11 Section 1.2: How do fire and rescue authorities compare? 16 Section 1.3: What is the scope for efficiencies? 22 Chapter 2: Deploying resources 25 Section 2.1: Right people, right place, right time 25 Section 2.2: Demand reduction 38 Section 2.3: Latent capacity 42 Chapter 3: Collaborating for efficiency 45 Section 3.1: Working with other fire and rescue authorities 45 Section 3.2: Working with other blue-light services 52 Chapter 4: Driving efficiency 56 Section 4.1: Funding 56 Section 4.2: Accountability 63 Section 4.3: The role of national leaders 66 Chapter 5: What is the future for fire and rescue? 70 Section 5.1: What might the future operating environment hold? 70 Section 5.2: Possible future delivery models 73 Appendices 77
3

Facing the Future
Foreword I was pleased to be invited by Brandon Lewis, the Fire Minister, to undertake this review of efficiencies and operations in fire and rescue authorities in England. Having started my fire service career as a firefighter, serving for a number of fire and rescue authorities, and retiring as London's Fire Commissioner I had the privilege of working in the fire and rescue service for over forty years. I joined the fire and rescue service because I cared about the community in which I lived and the risks from fire it faced at that time, like many still employed and responsible for the service. But those risks have changed over my long career. It is a really good news story that there has been a massive reduction in emergency incidents in the last decade, particularly in fires of all kinds. Fire and rescue authorities have played a pivotal role in this, and have moved from predominantly emergency response organisations to organisations that look to reduce risk. There is little doubt that prevention is better than cure. But the reduction in fire risk is not solely due to the actions of fire and rescue authorities – societal changes, technological improvements, the increase in smoke alarm ownership, safety campaigns and government regulations for both buildings and furniture have played a huge part. Despite these changes, no similar significant change in the makeup or cost of the service has taken place. Fire and rescue authorities do now need to transform themselves to reflect the entirely different era of risk and demand they now operate in. I am cognisant of the time in which this review is published, a time of austerity which is likely to continue with downward pressure on public expenditure. I was struck in my conversations that the financial pressures of recent years seem to have been the driving force behind many of the changes and innovation I have seen. It is a fact that whilst most local authorities are feeling the pressure of reduced funding against increased demand for their services, in the case of fire and rescue services there remains a significant decrease in demand for its operational response.
4

Findings of the review into efficiency and operations of fire and rescue authorities in England
During my review I have found inexplicable differences in the expenditure of different fire and fire and rescue authorities in England. It’s apparent that we spend almost twice as much in some areas as others and yet there seems to be little relationship between expenditure and the reduction in demand for operational response in different fire and rescue authorities. Differences in operational practices, including minimum crewing levels and the ratio of senior managers to firefighters further show that there are savings to be made without reducing the quality of outcomes for the public. This report looks to give a sense of the scale of this, though these numbers are simple calculations for discussion, not targets in themselves. There are some good examples from fire and rescue authorities that show the potential for savings and there is much to be done at a local fire and rescue authority level. I am concerned that while I found evidence of sharing between services, there was little evidence of learning, and replication and economies of scale are likely to be missed in this way without greater leadership and a willingness to put interoperability above personalisation. But I am not convinced that local action alone will achieve the most efficient service or enable efficiencies much beyond what is already needed in the current spending review. Compounding this, local politics and the public’s seemingly unconditional attachment to the fire and rescue service can act as constraints on really pursuing the most efficient ways of working, holding on to outdated configuration or location of fire stations and fire appliances rather than changing service delivery to improve overall outcomes. I am extremely grateful for all those I spoke to as part of my review and those who wrote to me. I am also indebted to my team who assisted me in the collation of the information I gathered. I do not pretend to have all the answers, nor have I made specific recommendations, although I hope that this review has asked the right questions. Almost my entire working career has been associated with the fire and rescue service and I care deeply about the service it provides and the people who deliver it. It is in this spirit that I offer my findings, in anticipation that the political and professional leaders of today will face the future in the confidence that the fire and rescue service must and can adapt to provide an effective and efficient service. Sir Ken Knight CBE QFSM FIFireE
5

Facing the Future
How this review was conducted 1. In December 2012, the Fire Minister, Brandon Lewis MP,
commissioned me to undertake a review of efficiencies and operations in fire and rescue authorities in England. This report is the culmination of that work. My terms of reference (Appendix A6) were broad: to explore the activity of fire and rescue authorities and see what the scope for change might be.
2. I took the view that these very broad terms were to enable me to
follow the evidence – to look both at what efficiency might be and at how far fire and rescue authorities have gone in trying to achieve it. I was keen, therefore, to hear as many views as possible; I visited 15 fire and rescue authorities, chosen for their spread across governance types and geographical and industrial differences. I also met with all of the key representative bodies in the fire and rescue sector, as well as hearing from, and taking submissions from, other fire and rescue authorities and interested parties. I have listed all of these in the Appendix (A3-A5).
3. To ensure that I took a rounded approach to my review, I undertook
two key desk-based analyses.
I returned to the numerous reviews of the fire and rescue service that have been conducted in the last ten years, from Sir George Bain’s The Future of the Fire Service in 2002 to Fire Futures in 2010. As I drew up my findings, I reflected on the findings of these previous reviews: many of the problems identified by previous reports remain, albeit often to a lesser extent.
Supported by a small team from the Department for Communities and Local Government, I took an analytical look at the national picture on fire and rescue, in particular on expenditure and the differences between fire and rescue authorities. The statistics used in this report are as recent as possible, based on publicly available data, in most cases, from 2011/12. I would like to acknowledge at the start that further efficiencies will have been sought and achieved in 2012/13 that are not reflected in this data.
4. This report is for the Minister who commissioned it, though there is
much in here that is for fire and rescue authorities to consider and pursue themselves. I hope that it will inspire debate and provoke action.
6

Findings of the review into efficiency and operations of fire and rescue authorities in England
Executive summary and key findings
Chapter one: What is efficiency and how efficient is the delivery of fire and rescue services in England?
Deaths from fires in the home are at an all time low; incidents have reduced by 40 per cent in the last decade, but expenditure and firefighter numbers remain broadly the same. This suggests that there is room for reconfiguration and efficiencies to better match the service to the current risk and response context.
Some fire and rescue authorities spend almost twice as much per person per year in some areas than others, but there seems to be little relationship between expenditure and outcomes.
If all authorities spending more than the average reduced their expenditure to the average, savings could amount to £196 million a year.
Chapter two: Deploying resources
Fire and rescue authorities have transformed themselves from organisations that dealt with fire response to organisations also covering preventative and wider rescue work and they have succeeded in reducing incidents. They now need to transform themselves again to reflect the completely different era of risk and demand.
The focus for the future must be on protecting front-line services; this does not mean a protectionist approach to jobs. Avoiding redundancies, station closures or reductions in fire engines is often the focus for elected members and officers, and there is anecdotal evidence of some self-censorship by Chief Fire Officers.
Innovative crewing and staffing models are being pursued, and there is some evidence that these are being shared – but there is little evidence of areas implementing learning from others.
Increasing the total ‘on-call’ firefighters nationally by just 10 percent (to 40 percent) could provide annual savings of up to £123 million. All fire and rescue authorities must consider whether ‘on-call’
7

Facing the Future
firefighters could meet their risk – it is an invaluable cost-effective service.
£17 million could be saved if authorities adopted the leanest structure in their governance types.
The Grey Book can lead to some self-limitation by leaders not to introduce change that would require lengthy negotiation. It should be reviewed.
Authorities are right to capitalise on their reputation to help deliver other services to hard-to-reach communities. But this should only be where they are commissioned to do it, or have identified a clear cost benefit to their own aims.
Chapter three: Collaborating for efficiency
The 46 fire and rescue authorities, each with different governance structures, senior leaders, and organisational and operational quirks does not make for a sensible delivery model. Mergers can be a solution, but there is a lack of local political appetite and incentive to combine.
There is widespread duplication of effort in the design, commissioning and evaluation of fire-specific products. A greater level of trust between authorities is needed to ensure the rapid spread of good ideas and proven technology.
The challenge for fire and rescue authorities is to accept that to achieve interoperability, we all need to forgo an element of customisation. What I’ve seen throughout this review is that fire and rescue authorities are not yet prepared to take this step – but I hope that the future holds greater pragmatism.
Collaboration, co-responding and co-location with other blue-light services does happen and can deliver efficiency through consolidating public sector assets as well as closer working. But progress is patchy and driven or hindered by local relationships.
Chapter four: Driving efficiency
The major driver for change has been reduction in central government funding and the freeze in local council tax revenue. Fire and rescue authorities spend to their budgets, not to their risk. How to use funding to incentivise further change must be a key consideration for government.
8

Findings of the review into efficiency and operations of fire and rescue authorities in England
Fire and rescue authority reserves increased from just over £200 million to more than £400 million in 2008-2012. These levels are well above the average for local authorities (including police). Prudent reserves should be held, but funding reductions were backloaded to enable authorities to invest in service transformation – reserves should be used to invest in spend-to-save projects.
Authority Members need greater support and knowledge to be able to provide the strong leadership necessary to drive efficiency. Scrutiny of authorities and services varies considerably, some more robust than others. Elected Members must ensure that local people understand their service and encourage an informed debate about change.
Greater sector leadership is needed to drive through a culture of learning from good practice and challenging services to rise to the level of the best.
Chapter five: What is the future for fire and rescue?
Where fire and rescue authorities can provide business cases for local merger, showing clear, achievable efficiencies, central government should step forward to provide financial support for transition.
The potential savings identified in this review are unlikely to be sufficient for some fire and rescue authorities to be able to live within their reducing budgets.
The scale of change needed to fully transform the fire and rescue service is unlikely to be achieved through local action alone. But authorities should not wait for national action before fully exploiting the large number of opportunities already within their grasp.
National level changes to enable greater collaboration with other blue-light services, including through shared governance, co-working and co-location, would unlock further savings.
9

Facing the Future
List of Figures
Figure 1: Change in incidents between 2001/02 and 2011/12 (England)
Figure 2: Types of work done by the Fire and Rescue Service, 2001/02 and 2011/12 (England)
Figure 3: Percentage change in fires, casualties, fatalities, FTE firefighters and expenditure by fire and rescue services in England, 1998 – 2012
Figure 4: Fire and rescue service employees, 2002/03 to 2011/12 (England)
Figure 5: Expenditure per 1,000 population versus type of fire and rescue authority (England)
Figure 6: Expenditure per head of population versus sparsity classification (England)
Figure 7: Expenditure per head of population versus industrial profile (England)
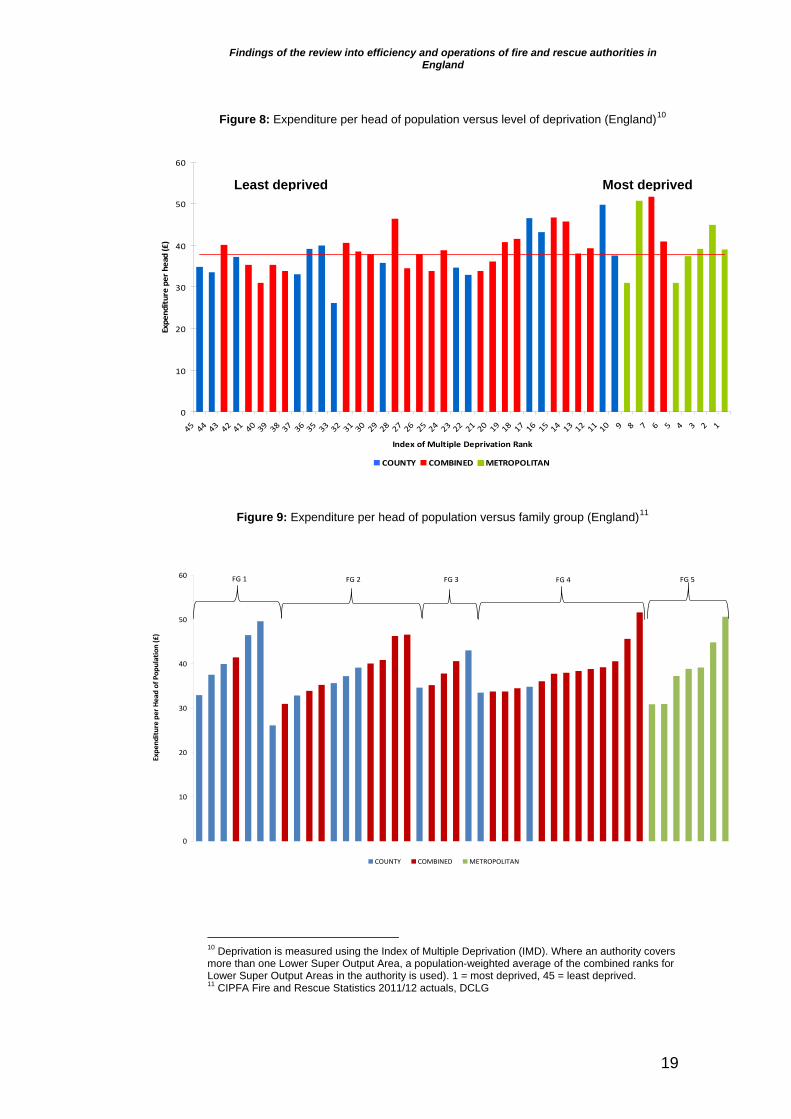
Figure 8: Expenditure per head of population versus level of deprivation (England)
Figure 9: Expenditure per head of population versus family group (England)
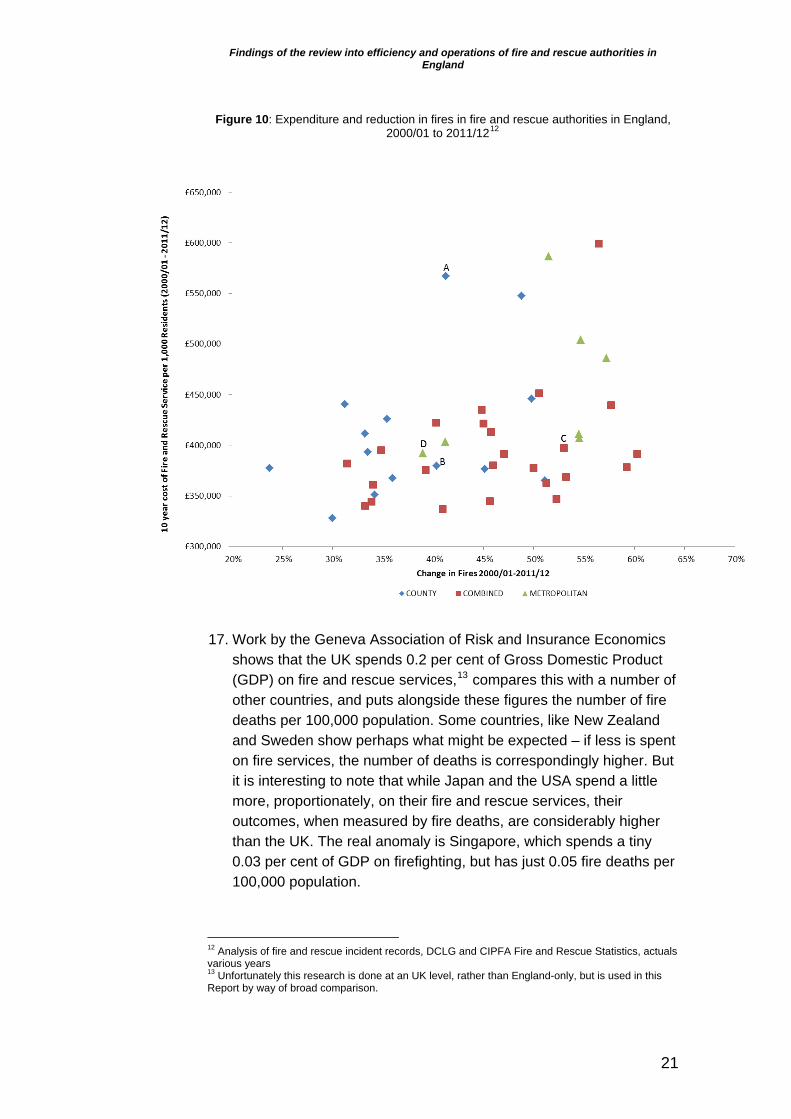
Figure 10: Expenditure and reduction in fires in fire and rescue authorities in England, 2000/01 to 2011/12
Figure 11: Potential savings if total service expenditure in high spending FRAs were reduced to third quartile or median expenditure
Figure 12: Spending power reductions 2011-12 to 2014-15
Figure 13: Breakdown of fire and rescue authority expenditure (England)
Figure 14: Retained and wholetime firefighters (FTE) by authority, excluding LFEPA
Figure 15: Potential saving from increasing the proportion of on-call firefighters, by governance type
Figure 16: Estimated percentage contribution of different types of firefighter to the overall number of firefighters
Figure 17: Ratio of Firefighters to Senior Manager (Brigade, Area and Group managers) for fire and rescue authorities in England
Figure 18: Analysis of potential percentage and cost reductions if fire and rescue authorities moved to the staff to manager ratio of the leanest in their authority type
Figure 19: Breakdown of ‘false alarms’ 2011/12
Figure 20: What sort of incidents does a firefighter attend in a year – 2001/02 versus 2011/12
Figure 21: Fire and rescue authority reserves as a proportion of annual expenditure 2012
Figure 22: Fire and rescue authority reserves in total and by combined or metropolitan authority, 2001-2012
10

Findings of the review into efficiency and operations of fire and rescue authorities in England
1Chapter 1: What is efficiency and how efficient is the delivery of fire and rescue services in England? A service that prevents fire, protects people, property and businesses from fire risk, and which responds to fires, road traffic collisions, flooding and other emergencies is a public good, funded by all for the benefit of all. It is clearly essential that the country has a fire and rescue service of some kind, but the public investment in it does not tell us much about whether or not the service is actually cost efficient. It also does not tell us that value for money and the return on that public investment is the same across all 46 fire and rescue authorities in England. Efficiency does not just mean doing the same for less, nor is it just about one-off cashable savings. It is an entire approach to service delivery, achieving the best possible service for the public. A thorough approach to achieving efficiencies would cover both where the same activity is done differently, such as changing procurement policy or crewing system; as well as wider structural and collaborative approaches. This report considers both but is mindful that the biggest opportunities are in the latter category, requiring ambition and leadership to achieve. To consider whether authorities are already delivering the most efficient service possible, I have considered how risks have changed over time (section 1.1); how fire and rescue authorities compare (section 1.2); and how funds are currently spent and where efficiencies might be made (section 1.3). Section 1.1: How have risks changed over time? 1. Understanding the context in which fire and rescue authorities are
operating is essential to understanding the efficiencies picture. This context has changed significantly over the last decade:
Overall attendance at incidents is down 40 per cent; Attendance at fires is down 48 per cent; Building fires, down 39 per cent; Minor outdoor fires, down 44 per cent; Road traffic collisions, down 24 per cent; and,
11

Facing the Future
Flooding, down 8 per cent.1
The latest half-year statistics published in March 2013 show the continuation of the trend, with total fires from April to September 2012 down 37 per cent on the same period in 2011, and incidents overall down 17 per cent.2
2. Over the longer term, the reduction in risk to the public from fire is
even more dramatic. In 2011/12, 186 people died in accidental fires in the home. This is 60 per cent lower than the average figure we saw annually in the 1980s. Firefighters themselves are also much safer today, even though they risk their lives to save the public.
3. These reductions are significant and have, in part, been delivered
through the dedication and professionalism of members of the fire and rescue service. It is clear that the cumulative effect of building and furniture regulations, Integrated Risk Management Planning and the localisation of decision-making, and importantly the fire prevention and protection work carried out by fire and rescue authorities has significantly reduced the risk of fire in England. The Department’s award-winning ‘Fire Kills’ campaign and the Home Fire Risk Check initiative have also been clear drivers of change (see Section 2.2).
4. Figure 2 demonstrates change in activity over time. This change
has increased capacity for other services, such as responding to road traffic collisions and flooding and co-responder activity, that, along with increased fire prevention and protection work, has helped what were fire response organisations become more rounded safety and rescue organisations.
1 With the exception of numbers of road traffic collisions and flooding prior to 2009, whose source is Fire and Rescue Operational Statistics Bulletin http://webarchive.nationalarchives.gov.uk/20121108165934/http://www.communities.gov.uk/fire/researchandstatistics/firestatistics/firerescue/, these data are published in the Fire Statistics Monitor https://www.gov.uk/government/organisations/department-for-communities-and-local-government/series/fire-statistics-monitor. 2 https://www.gov.uk/government/publications/fire-statistics-monitor-april-to-september-2012
12

Findings of the review into efficiency and operations of fire and rescue authorities in England
Figure 1: Change in incidents between 2001/02 and 2011/12 (England)3
3 Analysis of fire and rescue incident records, DCLG various years
13

Facing the Future
Figure 2: Types of work done by the Fire and Rescue Service, 2001/02 and 2011/12 (England)4
5. But even for those incident types where fire and rescue authority
involvement has increased, the number of incidents themselves has still decreased considerably. At the same time, the expenditure of fire and rescue service services, and firefighter numbers, have remained broadly the same. Figure 3 looks at percentage change in fires, casualties, fatalities, expenditure and firefighters since 1998-99. While casualties and fatalities have fallen continually, and fires, after peaking in 2003, have fallen dramatically, expenditure has actually risen and has only in recent years declined.
6. Firefighter numbers, however, have remained relatively stable over the period, only reducing by 6 per cent in the last 10 years. Can it be right that expenditure and staffing have stayed broadly the same while incidents have fallen across the board, changing the whole environment in which fire and rescue authorities operate? What is reasonable to conclude is that there must be room for reconfiguration and efficiencies to better match the service (and the cost) to the current risk and response context in which it operates.
4 Analysis of fire and rescue incident records, DCLG various years. The 2000/01 incident statistics were set out in the Bain Review (figure 3.1, p.10).
14

Findings of the review into efficiency and operations of fire and rescue authorities in England
Figure 3: Percentage change in fires, casualties, fatalities, FTE firefighters and cue services 5
expenditure by fire and res in England, 1998 – 2012
‐50%
‐40%
‐30%
‐20%
‐10%
0%
10%
20%
30%
40%
50%
60%1998‐99
1999‐00
2000‐01
2001‐02
2002‐03
2003‐04
2004‐05
2005‐06
2006‐07
2007‐08
2008‐09
2009‐10
2010‐11
2011‐12
Fires Casualties Fatalities Firefighters FTE FRS Expenditure
Figure 4: Fire and rescue service employees, 2002/03 to 2011/12 (England)6
5 Analysis of fire and rescue incident records, DCLG and CIPFA Fire and Rescue Statistics actuals
, various years. various years 6 CIPFA Fire and Rescue Service Statistics, actuals
15

Facing the Future
Section 1.2: How do fire and rescue authorities compare? 7. There are a number of ways of comparing the efficiency of fire and
rescue authorities – from expenditure per head of population to expenditure per hectare or per incident, fire engine or firefighter. They are all useful measures, but used selectively or in isolation they can be misleading. A large area will benefit from comparing by landmass, a densely populated area will benefit from measuring by head of population, and a service with a large number of firefighters will have a good position on a graph showing expenditure per firefighter. All of these measures, however, show how much was spent, not how much ought to have been spent.
8. It is therefore not appropriate to choose just one of these measures
to demonstrate efficiency, though they can and should all be used by fire and rescue authorities to build a picture of their service and how it compares to others and for authorities to look at their performance over time.
9. Population density, industrial profile, and deprivation are all used to
eauthorities, but do they really? Figure 5 shows the cost per head of population for each authority. In 2011/12 fire and rescue authorities in England spent in total some £2.2 billion in providing their services. On average the median spend per resident per authority was around £38 per year. But the actual range for providing what is broadly the same service to the public was nearly twice as much in some areas as others (from £26 per resident per year to more than £50 per resident in another area).
xplain the differences in cost across the 46 fire and rescue
16

Findings of the review into efficiency and operations of fire and rescue authorities in England
Figure 5: Expenditure per head of population versus type of fire and rescue authority
(England)7
0
10
20
30
40
50
60
Expend
iture per Head of Pop
ulation (£)
COUNTY COMBINED METROPOLITAN
Bottom Quartile
Top Quartile
ervice in each category. Figure 8 ranks
fire and rescue authorities by the level of deprivation in their areas, based on the Index of Multiple Deprivation – there does not appear to be a relationship between expenditure per head and the relative ranking of deprivation. Lastly, in Figure 9 the data is arranged by ‘family groups’, groups chosen by fire and rescue authorities as similar authorities to compare themselves against. The spread of expenditure remains.
10. This difference in expenditure does not appear to be related to
different authority types – county, metropolitan and combined fire and rescue authorities are spread right across the range.
11. Figure 6 shows the same data arranged by population density. Even
within the three density categories there is significant variation in expenditure. Figure 7 shows the same data arranged by how industrial each area is, again showing a wide range between themost and least expensive s
and Rescue Statistics 2011/12 Actuals.
lease note that this figure, and figures 6 – 9, only show 44 fire and rescue authorities. The Isles of cilly have been excluded as they are too small to make a true comparison. Cambridgeshire fire nd rescue authority did not submit data to CIPFA for the year in question.
Please note that given the small number of Unitary fire and rescue authorities, these have been marked as County fire and rescue authorities for the purposes of figures throughout this report.
7 CIPFA Fire PSa
17

Facing the Future
Figure 8 6: Expenditure per head of population versus sparsity classification (England)
0
10
20
30
40
50
60
Expenditure per Head of Population (£)
COUNTY COMBINED METROPOLITAN
Predominately Rural
Significantly Rural Predominately Urban
Figure 7: Expenditure per head of population versus industrial profile (England)9
0
10
20
30
40
5
60
Significantly Industrial Most IndustrialLeast Industrial Slightly Industrial
0
Expend
iture per Head of Pop
ulation (£)
COUNTY COMBINED METROPOLITAN
8 CIPFA Fire and Rescue Statistics 2011/12 actuals, DCLG 9 CIPFA Fire and Rescue Statistics 2011/12 actuals, DCLG
18
Findings of the review into efficiency and operations of fire and rescue authorities in England
Figure 8: Expenditure per head of popula n versus level of deprivation (England)10 tio
0
10
20
30
40
50
60
45 44 43 42 41 40 39 38 37 36 35 33 32 31 30 29 28 27 26 25 24 23 22 21 20 19 18 17 16 15 14 13 12 11 10 9 8 7 6 5 4 3 2 1
Index of Multiple Deprivation Rank
Expenditure per head (£)
COUNTY COMBINED METROPOLITAN
Figure 9: Expenditure per head of population versus family group (England)11
0
10
20
30
40
50
60
Expend
iture per Head of Pop
ulation (£)
COUNTY COMBINED METROPOLITAN
FG 5FG 4FG 3FG 2FG 1
Deprivation is measured using the Index of Multiple Deprivation (IMD). Where an authority covers
more than one Lower Super Output Area, a population-weighted average of the combined ranks for deprived, 45 = least deprived.
Least deprived Most deprived
10
Lower Super Output Areas in the authority is used). 1 = most11 CIPFA Fire and Rescue Statistics 2011/12 actuals, DCLG
19

Facing the Future
1expenditure involved in providing broadly the same service in each of our 46 fire and rescue authorities. What we cannot tell from these
difference in levels of service provided – measures we have discussed so far are, to some extent, measures of expenditure, rather than the quality of the outcomes achieved for the public, like reductions in incidents and fire deaths.
13. The scattering across the graph in Figure 10 shows that there seems to be little relationship between the expenditure and the reduction in fires in different authorities. Compare County authorities A and B - they both achieved similar reductions in fires of around 40 per cent, but one spent almost 50 per cent more than the other over the decade.
14. It could be posited that those areas that had
the biggest reduction in fires had the biggest opportunity, i.e. they began the period with the highest numbers of fires. However, it does not appear that this is the case. Nine athousand fires in 2001-02, but reduced those fires by between 30 and 50 per cent. Even more markedly, authority C had 14,300 fires in 2001-02, and reduced these by 53 per cent. Authority D had 15,200 fires and reduced these by just 39 per cent. But both spent between £391,000 and £397,000 per 1000 population over the 10 year period.
15. The public might accept higher costs per head if it was clear that these resulted in better outcomes such as fewer fires or deaths. But there does not appear to be any such link between spend and safety. Money goes further in some areas compared to others.
16. It is also important, of course, to consider international comparisons;
unfortunately these are scarce in the fire sector and given the range of factors at play should be treated with some caution. However, they appear to show that the relationship between what is spent and what is achieved is fragile and inconclusive.
2. I am not able to see an obvious justification for the variation in
variations is the all the
accept higher costs per head if it
that these resulted in
better outcomes… but there does not appear to be any
such link between spend and safety.
The public might
was clearuthorities had between three and four
20
Findings of the review into efficiency and operations of fire and rescue authorities in England
Figure 10: Expenditure and reduction in fires in fire and rescue authorities in Eng2000/01 to 2011/1212
land,
Insuraoss Domestic Product
ares this with a number of ther countries, and puts alongside these figures the number of fire
r. But tle
more, proportionately, on their fire and rescue services, their
er
17. Work by the Geneva Association of Risk and
shows that the UK spends 0.2 per cent of Gr(GDP) on fire and rescue services,13 comp
nce Economics
odeaths per 100,000 population. Some countries, like New Zealandand Sweden show perhaps what might be expected – if less is spent on fire services, the number of deaths is correspondingly higheit is interesting to note that while Japan and the USA spend a lit
outcomes, when measured by fire deaths, are considerably higher than the UK. The real anomaly is Singapore, which spends a tiny 0.03 per cent of GDP on firefighting, but has just 0.05 fire deaths p100,000 population.
Analysis of fire and rescue incident records, DCLG and CIPFA Fire and Rescue Statistics, actuals rious years
Unfortunately this research is done at an UK level, rather than England-only, but is used in this Report by way of broad comparison.
12
va13
21

Facing the Future
Section 1.3: What is the scope for efficiencies? 18. While expenditure measures do not show the complexity in different
areas, they do show an unacceptable level of variation in the cost of the service to the public. If we assume that all fire and rescue authorities are currently providing an appropriate service, managing and responding to the risk in their areas, then we must assume that there is potential for cost reduction in the most expensive areas without affecting front line service outcomes.
19. For example, if those authorities in the top 25 per cent of the spending range reduced their expenditure to match that of the next most expensive, there would be savings of just under £124 million a year to the public purse. If all those spending more than the average reduced their expenditure to the average, the savings would rise to £196 million a year.
Figure 11: Potential savings if total service expenditure in high spending FRAs were
reduced to third quartile or median expenditure14
Total Service Expenditure
If those spending
average reduced their expenditure
savings could be £196 million a
more than the
to the average,
year
At or below 3rd quartile At or below median
County (and Unitary) £8,358,000 £18,551,000 Combined £16,070,000 £33,955,000 Metropolitan (and London) £99,541,000 £143,297,000
Total £123,969,000 £195,803,000 20. These numbers are broad estimates, designed only to give a sense
of the scale of the potential for savings in fire and rescue authorities providing similar services. Those authorities at the lower end of the scale when measured on cost per person may, of course, also be able to make further efficiencies.
21. Fire and rescue authorities were given back-loaded spending powreductions to allow time for them to deliver efficiencies.
er
iencies is now immediate and real. The scale of the challenge means that fire and rescue authorities cannot just consider those efficiencies they can achieve by reviewing their own
15 The need to achieve these effic
14 CIPFA Fire and Rescue Statistics 2011/12 actuals
tained business rates. 15 Spending power broadly represents fire and rescue authorities' combined income from council tax, central government grants and re
22

Findings of the review into efficiency and operations of fire and rescue authorities in England
services, but need to review and embrace the opportunities that wider reform and collaboration can bring.
Figure 12: Spending power reductions 2011-12 to 2014-1516
2011-12 2012-13 2013-14 2014-15
2.2% 0.5% 4.7% 3.3% 22. So where could these savings be realised? Figure 13 shows the
breakdown in how fire and rescue authority budgets are currently pent. The vast majority, £1.73 billion of £2.2 billion in 2011/
anag as em
is compades prem
at autho deepe
ving the the right level of risk
cover.
Figure iture
s 12 (79 ers, control ployment costs rable with other ises, vehicles,
rities try first r efficiencies will
right people
per cent) is spent on staffing costs (including mroom staff, pension costs and training, as wellof wholetime and on-call firefighters) which blue-light services. Other expenditure inclusupplies and support services.17 It is natural thto make savings in non-staff expenditure, butbe delivered by better service configuration, hain the right place at the right time, providing
13: Breakdown of fire and rescue authority expend 18
16 DCLG Local Government Finance 2012 17 We cannot see from the data available how these costs further break down. Staff expenditure
ent costs and allowances, along with sickness se
includes overtime pay and bonuses, senior managemabsence, not just firefighters’ salaries. ‘Transport’ in non-staff expenditure is not just responvehicles – it would also include subsidised officer car arrangements.
23

Facing the Future
Chapter One: Key Findings Deaths from fires in the s have home are at an all time low; incident
reduced by 40 per cent in the last de d cade, but expenditure anfirefigh rs re adly t This that ter numbe main bro he same. suggeststhere is r or recon ion and efficiencies to better match the oom f figuratservice to the current risk and response context.
Some fire and rescue authorities spend almost twice as much per person per year in some areas than others, but there seems to be little relationship between expenditure and outcomes.
If all authorities spending more than the average reduced their expenditure to the average, savings could amount to £196 million a year.
18 CIPFA Fire and Rescue Statistics 2011/12 Actuals
24

Findings of the review into efficiency and operations of fire and rescue authorities in England
25
Chapter 2: Deploying resources When it comes to the question of matching resources to risk, the answer has not changed since Sir George Bain published his report in 200219 – fire and rescue authorities need to have a solid understanding of the risin their area and make decisions based on that information
k , effectively
response organisations to include preventative and wider rescue work. The reduction in incidents, casualties and deaths we saw in Chapter One is a testament to that approach. But fire and rescue authorities now need to transform themselves again to reflect the lower-incident context in which they now operate. It is interesting to note that Bain’s recommendation for the introduction of Integrated Risk Management Planning was driven not only by saving lives – it was to be a tool to help fire and rescue authorities provide better value for money for their communities.20 It is time that this latter aim was better drawn out by fire and rescue authorities. This chapter examines opportunities for efficiencies in how services manage their staff and resources (section 2.1); at using prevention work to reduce risk (section 2.2); and at the wider community role that many fire and rescue services play (section 2.3). Section 2.1: Right people, right place, right time
prioritising and comparing risks. In the last ten years, we have seenmuch greater emphasis on reducing and managing risk through effectivefire prevention work and fire and rescue authorities have transformed themselves from primarily fire
Focusing on front-line service 1. What is quite clear after hearing from so many fire and rescue
authorities in the course of this review is that those areas which are taking the most decisive steps towards efficiencies are those with the clearest separation of responsibilities between operational advice from the professional arm (officers of the authority) and the decisions taken by the political arm (members of the authority). In many of the
19 The Future of the Fire Service: reducing risk, saving lives, December 2002.
e 39.
2
20 The Future of the Fire Service, paragraph 5.12, pag
Facing the Future
authorities I visited, whether I spoke to members or officers, there was a strong focus on avoiding any redundancies, station closures
etimes seemingly ahead improving services to
the public (outcomes).
. Government ministers have given strong statements about the need
e a
terms
efend decisions and take these back to their respective local authorities. There
stations. Nearly all I spoke to are instead
considerable work to rebalance crews, fire
rs to effective risk-to-resource
they can offer their non-operational staff.
or reductions in fire appliances (inputs), somof focus on reducing fires and incidents and
2
to protect the front-line from the funding reductions implemented to reduce the national deficit. But this should be about front-line service. That is not automatically the same as protecting jobs as they stand. Front-line service encompasses everything that leads to reductions in incidents, casualties and fatalities and has to includmajor focus on the role of fire prevention and protection work, often overlooked when the media, or fire and rescue authorities themselves, fall into the trap of counting the front-line solely inof operational firefighters.
3. Fire and rescue authorities need to be
prepared to consider all options, accept and d
There was a strong focus on
avoiding any
or fire
s, sometimes
cing
g services to the
public
redundancies, station closures
reductions inappliance
is anecdotal evidence of a level of self-censorship by Chief Fire Officers, knowing or assuming that members will not want to consider fire station closure, or changing crewing arrangements at particular
seemingly ahead of opting to achieve savings through ‘natural wastage’ and frozen recruitment, but this is a piecemeal approach that gives no control over who leaves and creates
focus on redufires and incidents
and improvin
stations and areas. 4. I identified two particular barrie
planning:
The use of Private Finance Initiatives to fund the building of new fire stations, locking in resource, stifling options for change.
The lack of provision to allow authorities to offer uniformed staff
enhanced compensation in the event of redundancy, something
26

Findings of the review into efficiency and operations of fire and rescue authorities in England
A number of authorities want to use voluntary redundancy to help them undertake resource planning and many others said it would bea useful tool to consider. The Government is currently considering a formal request from the Fire and Rescue Employers along these lines and I would encou
rage them to agree.
l and
from have
r areas the current Grey Book stands as either a perceived or actual barrier to change, with some self-
ry som thing that
iver a flexibl of the authori
to re wou
ering to the Naerim, it is recognised
local some
sentativeentative bo
timely to review whether the current Grey Book is fit fopurpose a decade after the last significant revision.
5. A further consideration is the National Joint Council Scheme of
Conditions for Local Authority fire and rescue services (the Grey Book). It covers the national pay and conditions for operationacontrol staff in fire and rescue authorities, and was last overhauled in 2003 (sixth edition) with the aim of being a less prescriptive document than previously, with some revisions since. It can be argued that because of, or in some cases despite, the current Grey Book, some of the fire and rescue authorities I have heard negotiated local changes to facilitate flexible arrangements that suit their local need. But in othe
limitation by local leaders not willing to trequire lengthy local negotiation.
6. Many of those I met felt that in order to del
service that dovetails with expectationsRisk Management Plan it is now appropriaterole maps from the Grey Book. Such a movof resources to meet local need whilst adhOccupational Standards.21 In the intdevelopment of robust job descriptions at facilitate such change as has been done in authorities.
7. I hope that the national employers (as repre
rescue authorities) together with the represthat it is
e would
e localised ty’s Integrated
emove the national ld facilitate the use
tional that the
level could similarly fire and rescue
s of fire and dies recognise
r
21 Skills for Fire and Rescue are in charge of developing and maintaining the national occupational tandards (NOS) for the United Kingdom’s fire and rescue services.
http://www.sfjuk.com/sectors/fire-rescue/developing-talent/nos/s
27

Facing the Future
CASE STUDIES: proving the case
One metropolitan authority is taking a data-driven approach to calc inst ulating risk, balancing their areas’ number of recent incidents agathe ntion and protection ir risk factors and against the amount of prevework carried out. This enables them to prioritise areas for prevention and fire safety audit work, compare stations and areas objectively with elected members, and helps with the planning of new stations that can merge the activity of two less busy stations. A county authority is taking a different but similarly evidence-based approach. They are proposing steps such as changing stations from whole-time to on call, but implementing them incrementally through slowly changing crewing models, using nucleus crewing as a mid-way point. In monitoring the data carefully, they are able to provide assurance to the public and the authority that while crewing decreases, risks in the area do not increase. A rural authority used detailed risk analysis to show that moving two stations to new locations would enable a further 13,900 people to be covered in their 10 minute emergency standard.
More effective crewing 8. The model of crewing wholetime, 24 hour, fire stations that has been
in place for some 30 years is starting to change to more flexible models and I was pleased to see a level of innovative thinking herBut this is not universal. The traditional short day shift and long nighshift with on duty sleeping arrangements together with excess resources bu
e. t
ilt in to cover sickness absence and annual leave has no place in a modern fire and rescue service where operational
number of usable day time hours when, for example, firefighters can perform fire safety duties; or switch crewing with specialist vehicles to allow firefighters to cover either appliance. Many of the fire and rescue authorities I visited have taken steps to change their crewing and staffing models and the case studies in this section illustrate this work. One of the key drivers to efficiency in some of these models has been annualised hours and self-rostering, putting responsibility
utilisation rates are reportedly between three and ten per cent.22 9. There remain many opportunities for the traditional system to be
reformed, such as shorter night shifts to increase the
22 The Future of the Fire Service, paragraph 3.6, page 11.
28

Findings of the review into efficiency and operations of fire and rescue authorities in England
into the hands of firefighters themselves to ensure that their fire engines are kept available.
10. A number of areas I visited have looked at ways of achieving flexible
cover for sickness and training absences rather than need a built-inhigh ridership factor. In some areas this has manifested as a small cadre of whole-time firefighters who provide flexible cover acroseither the whole authority or a number of fire stations. Other areas have created a ‘strategic reserve’ of whol
s
e-time firefighters who also hold a secondary contract – the authority then pays plain rate for
ere
has
er fire and rescue authority.
e es
. One of the constraints on efficiency is the rigidity of dispatching a ‘standard’ fire
ncident; I was heartened to see that many fire
o
cases and risk assessments from other areas where they wish to
d
hours over their standard contract, providing the firefighter with additional employment and the authority with a way of reducing overtime costs. Ten years ago the Bain report was critical that thwere restrictions in wholetime firefighters also undertaking retained duties. During my review, I found that considerable progressbeen made in this area, with firefighters taking on secondary contracts in their own or anoth
11. My review found a significant move by a number of fire and rescu
authorities in providing a variable level of response to differing typof incident and thus matching response to risk
engine to all types of iand rescue authorities have begun to invest in different types of response vehicles that can be crewed by varying numbers of firefighters, enabling a more flexible response.
12. One of the restrictions is the different minimum crewing levels t
produce optimum levels of staffing and safe working practices in different authorities for the delivery of the same service. I would encourage fire and rescue authorities to use the basis of business
adopt their innovative solutions to staffing arrangements, and thatemployer and employee representative bodies and the Health anSafety Executive urgently examine ways of doing so.
29

Facing the Future
CASE STUDIES: a flexible workforce
24 hour shifts: A combined authority has introduced a 24 hour shift system for its wholetime staff, following a ’24 on, 72 off’ rotation. Buy in was achieved through engaging early with representative bodies; benefits include reduced handover time from having a single shift change, and it has been welcomed by all staff. The Service estimated that it will save almost £600,000 between 2012/13 and 2016/17 from this change.
Seasonal crewing: A rural authority has responded innovatively to the challenge of population changing by up to 600 per cent in holiday times by creating a flexible, seasonal 24 hour service at one of its stations. Volunteers were sought among other staff across the Service and a rota developed to provide the cover for four months a year.
Swapping shifts: A metropolitan authority has increased the flexibility and satisfaction of their staffing arrangements through an innovative ‘Swap a Shift’ system. Staff are encouraged to voluntarily work shifts where there are staffing deficiencies and take time off when there is surplus staffing. They have indicated that 1,500 shifts have been swapped annually since this initiative began. This, along with an improved sickness record has allowed this fire service to reduce 12 posts, with reported savings of £451,384, and no impact on risk levels.
Strategic reserve: One metropolitan authority introduced an ‘Operational Resource Pool’ of staff who work flexibly to cover sickness, training and annual leave in the Service. These staff follow a pre-arranged 8-week rota, but also have mobile phones to allow them to be called on at short notice to respond to staffing issues as they arise. This enabled a reduction of 60 Grey Book posts, a saving of around £1.2 million per year. On top of this, early estimates show that it has reduced the overtime bill by £70,000 in six months.
Public holidays: A county authority has achieved agreement with the representative bodies that shifts on public holidays will be covered by either a flexibly rostered employee, or an on-call employee, all paid at plain time. Only in exception will overtime be paid – this has reduced the overtime bill from £729,000 in 2010/11 to a projected £200,000 in 2012/13.
30

Findings of the review into efficiency and operations of fire and rescue authorities in England
On call firefighters 3. Retained duty staff, or ‘on-call firefigh1 ters’, are the backbone of
arly
the can
ity feel that it is an invaluable cost-effective service. A retainer
and
provision for many fire and rescue authorities (Figure 14), particulthose that are most rural, and make up the majority of fire stations inthe country. The challenge for all fire and rescue authorities in new reduced-demand environment is to fully consider how theymake best use of on-call staff. In my discussions for this review I have heard a variety of opinions on the on-call system, but the vast majoris currently 10 per cent of a whole-time firefighter’s salary, with additional payments made for training and attendance at incidents. As calls have dropped, therefore, the on-call system has become more expensive on a per call basis. But it still provides excellent value for money – fire and rescue authorities need to think about what call volume they consider justifies a whole-time service.
Figure 14: Retained and wholetime firefighters (FTE) by authority, excluding LFEPA
the Isles of Scilly.23
0
200
400
600
800
1000
1200
1400
1600
1800
2000
Num
ber
Cou
nty
Cou
nty
Cou
nty
ned
mbi
ned
Com
bine
d
Met
ropo
litan
Met
ropo
litan
M
etro
polit
an
Com
bine
d
Com
bine
d
Cou
nty
Cou
nty
Com
bine
d C
ombi
ned
Com
bine
d
Com
bine
d
Com
bine
d C
ombi
ned
Com
bine
d
Cou
nty
Cou
nty
Com
bine
d
Cou
nty
Cou
nty
Cou
nty
Com
bine
d C
ombi
ned
Com
bine
d
Com
bine
d C
ombi
ned
Com
bine
d
Cou
nty
Com
bine
d C
ount
y
Cou
nty
Cou
nty
Met
ropo
litan
M
etro
polit
an
Com
bine
d
Com
bine
d
Com
bine
d
Met
ropo
litan
C
ombi
ned
Com
biC
o
Retained (FTE) Whole time (FTE)
14. Figure 15 shows some simple modelling of potential savings if all 46 authorities increased their use of on call firefighters. Currently 30 per cent of firefighters are on-call, though the difference between
CIPFA Fire and Rescue Statistics 2011/12 Actuals. Note: LFEPA has around 6000 firefighters, all holetime.
23
w
31

Facing the Future
authority types is quite marked. As a discussion point, I looked at a
n-
Figure 15: Potential saving from increasi the proportion of on-call firefighters, by
what would happen if each of the governance models moved to higher percentage of ‘on-call’ staff – namely that of the upper quartile in each type. This would mean counties would move to 65 per cent, combined to 51 per cent and metropolitans to just nine per cent; overall this would increase on-call staff by just 10 percentage points to 40 per cent. Naturally the cost of employing on-call staff would increase as they would attend more incidents, attracting more call out costs, so I have used the upper quartile of the on call salary range (£12,000) in my calculations.
15. While this is very much an estimate, the scale of savings that could
be released by fire and rescue authorities increasing the use of ocall staff by just 10 per cent could be up to £123 million per year.
ng
governance type24
Percentage of Retained Cost Saving
County 51% £212,400,000 - Combined 40% £578,400,000 - Metropolitan 3% £576,000,000 -
Current model
England 30% £1,366,800,000 -
County 65% £176,800,000 £35,600,000 Combined 51% £517,300,000 £61,100,000 Metropolitan 9% £549,300,000 £26,700,000
Possible model
England 40% £1,243,400,000 £123,400,000 16. Many authorities in England might find this
hard to imagine. However, international models show that our configuration is not the norm across Europe (see Figure 16); many countries have almost entirely volunteer-staffed fire and rescue services, and others
hanalysis has to be, therefore, is a challenge to authorities to consider how on-call can work for them.
nsient
thp
aro
t upo
srte oio
nns
-c o
allf t
ohe
r pm
ar. W
t-thima
et t
sti
afs i
f hllu
astr
veat
hio
ighn a
en
r d
17. Availability is often the key reason given by more urban authorities
for why they cannot use on-call staff – the population is too tra
24 CIPFA Fire and Rescue Statistics 2011/12 Actuals
just 10 per cent
per year
Increasing the use of on-call firefighters by
co£ul1
d 23
be m
ui
plli
too n
32

Findings of the review into efficiency and operations of fire and rescue authorities in England
or works too far from home to provide cover. I am not convinced ththis would be borne out if areas advertised and promoted the on-casystem. It is for each fire and rescue authority to determine their own rules for response times and the distance of an on call firefighter from a station; in some countries there have even been innovatiosuch as stationing a fire engine outside offices during the day. Availability has been improved in many areas by using electronic rostering and availability systems which provide easy monitoring anlets firefighters know when their unavailability will mean that a fireengine is off the run – as with whole-
at ll
ns
d
time firefighters, self-rostering puts the onus on staff to manage availability between them as a
f t
smaller number of whole-time staff to provide the initial response.
Figure 16: Estimated percentag ypes of firefighter to the overall number of firefighters25
team. One of the answers for urban areas might be to try on-call stafto crew the second pump in two-pump stations, providing the weighof attack and resilience for subsequent calls while still having a
e contribution of different t
0%
10%
20%
30%
40%
50%
60%
70%
80%
90%
100%
Sweden
Ireland
Belgium
Netherlands
Port Poland
Germany
Cyprus
Malta
Bulgaria
Lithuania
Estonia
Latvia
Hungary UK
Denmark
Greece
Finland
Italy
Luxemburg
ugal
Slovenia
Czech Rep
Slovakia
France
Austria
Volunteer Full time Part tim
e
CASE STUDIES: good practice on ‘on-call’
Selective alerting: By basing call outs on an Incident Needs Analysis rather than available numbers, a county authority expects to save up to £100,000 per year in reduced call out fees and on call staff will not be disturbed in their place of work / home unless it is necessary for them to ride. 25 Geneva Association of Risk and Insurance Economics October 2011. Estimates between 2006 and 2009 depending upon country.
33

Facing the Future
Support for on call staff: A county authority with a large proportion of its service delivered by on call staff was concerned at the reduction in availability in recent years. They have therefore introduced Retained Station Support Officers, wholetime Watch Managers who are available to RDS staff and champion their roles but also work closely in and with the community to deliver prevention and protection work, building relationships that lead to recruitment of on call staff.
Fire prevention staff 18. Traditionally community fire prevention work has been primarily
carried out by operational firefighters during the periods of non emergency response whilst most fire safety enforcement has been undertaken by full time uniformed fire safety officers. Firefighters bring valuable experience to both fire prevention and fire safety roles
work can be delivered using more cost-effective non-uniformed (Green Book) FRS staff, in some cases entirely. The issue is that once again, fire and rescue authorities are spending very different amounts to provide broadly the same service – while some use non-uniformed staff, others will only use uniformed firefighters at Watch Manager level or higher. I believe that the answer is in a mixed economy, with the majority of community safety work provided by operational firefighters in conjunction with other public sector services e.g. social care and the third sector. In the case of regulatory fire safety it is appropriate to utilise Green Book staff, at an equivalent level to those doing similar audit roles in other parts of the public sector, providing there remains strong links with operational staff to ensure that the firefighting context is taken into account.
19. Increasingly it seems that fire protection work and Fire Safety Order
compliance advice is also being delivered by operational firefighters. My concern here is to ensure that those doing this work have the
technical field, consistency in
but several fire and rescue authorities have shown that prevention
necessary level of competence in a complexparticularly when there is evidence of a lack ofenforcement of the Order. The emergence of commercial fire risk assessors, whose competency in the field of fire safety has been independently certified and even UKAS accredited26, will increasingly provide a challenge to fire and rescue authority staff
26 The United Kingdom Accreditation Service is the sole national accreditation body recognised by
alibration services. government to assess, against internationally agreed standards, organisations that provide certification, testing, inspection and c
34

Findings of the review into efficiency and operations of fire and rescue authorities in England
providing business safety advice and, crucially, auditing premises and enforcing the Fire Safety Order. Authorities need to be investing
in training (and maintaining that training) of their fire safety officers and ensuring that they employ those best suited to the task.
CASE STUDY: using non-uniformed staff
One Metropolitan authority transitioned from predominantly Grey Book fire safety staff to entirely Green Book, saving more than £700,000 per year, including reductions in the number of posts. The authority invested in training and development of the workforce both through the Fire Service College and an in-house workbook programme and mentoring to ensure that they had the rights skills for the job.
CASE STUDY: use of volunteers
A pilot has been established in an urban authority to enable Neighbourhood Watch members to received training to become Neighbourhood Fire Wardens. Looking out for derelict buildings, abandoned vehicles, rubbish and beds in sheds, the information provided by these Fire Wardens will help the authority, and other agencies, target prevention activity.
Management 20. A number of authorities have not reformed their flexible duty system
which provides management and command capability at incidents by senior uniformed officers. In the light of the significant fall inrates, these authorities are adhering to a rota system that can lead a substan
,
incident to
tial number of days off during the working week for staff even when they were not required to attend any incidents during the
have years.
ty
ill the post.
approach suggests a reluctance to redesign how best a service can
n
weekend. This approach reduces the time otherwise available for managerial duties.
21. Many of the authorities that provided evidence to the review
taken steps to reduce their senior management team in recentIn only a handful of places was this achieved as part of a completereview of the structural needs of the organisation – the vast majoricame from retirements and a subsequent decision not to fWhile this has led to authorities making savings, this ad hoc
be delivered. Figure 17 shows the ratio of senior managers to firefighters and evidences a stark difference in approach betwee
35

Facing the Future
authorities. In one metropolitan authority there are 73 firefighters pesenior manager, whereas in another there are 29 and in one combined authority, there are 63, and in a nearby combined authority there are 22.
r
as have different sparse areas, for
be saved in salary costs alone if each fire and rescue authority moved to the staff to management ratio of the leanest in its governance type (Figure 18) –
s to the public purse from
anagers)
22. There will of course be reasons why different are
management structures; in geographicallyexample, there may need to be more group managers simply to make it practicable to cover a number of distant fire stations. However, it is clear that fire and rescue authorities need to challenge themselves on the number of managers they have.
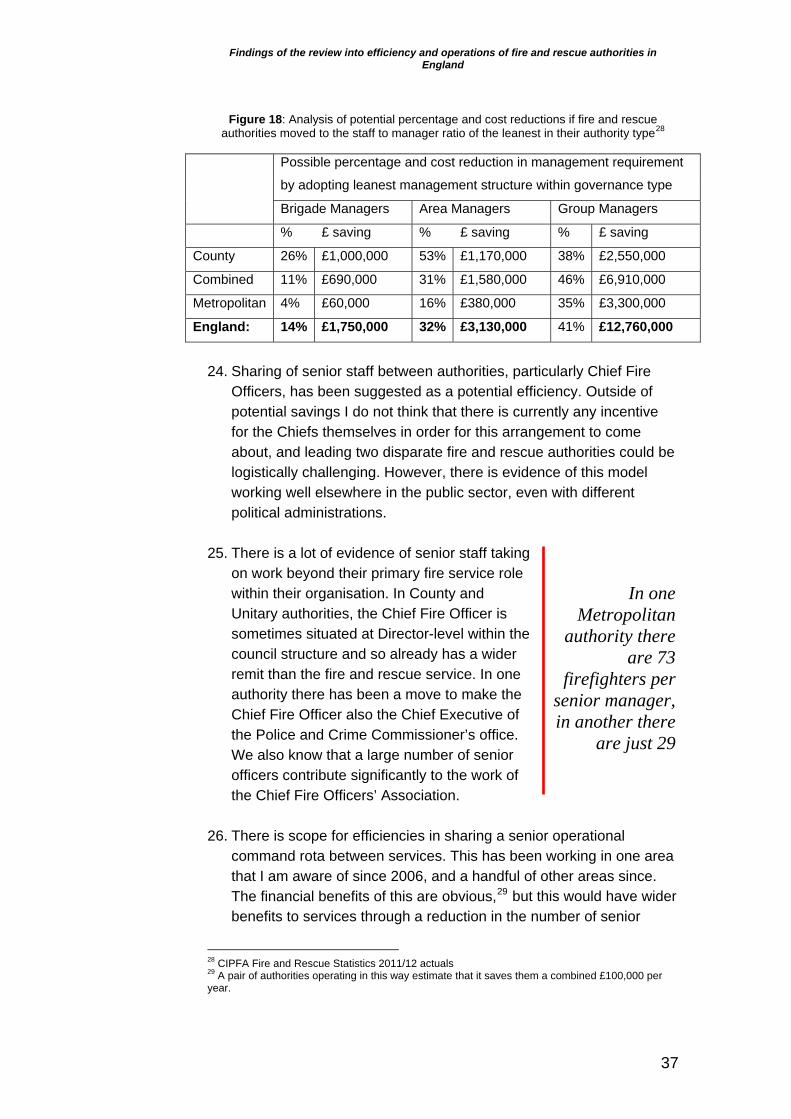
23. Up to £17 million per annum could potentially
there would be additional savingemployment and pension costs.
Figure 17: Ratio of Firefighters to Senior Manager (Brigade, Area and Group m
for fire and rescue authorities in England27
27 CIPFA Fire and Rescue Statistics 2011/12 actuals
36
Findings of the review into efficiency and operations of fire and rescue authorities in England
Figure 18: Analysis of potential percentage and cost reductions if fire and rescue authorities moved to the staff to manager ratio of the leanest in their authority type28
Possible percentage and cost reduction in management re
by adopting leane
quirement
st management structure within governance type
Brigade Managers Area Managers Group Managers
% £ saving % £ saving % £ saving
County 26% £1,000,000 53% £1,170,000 38% £2,550,000
Combined 11% £690,000 31% £1,580,000 46% £6,910,000
Metropolitan 4% £60,000 16% £380,000 35% £3,300,000
England: 14% £1,750,000 32% £3,130,000 41% £12,760,000
24. Sharing of senior staff between authorities, particularly Chief Fire
Officers, has been suggested as a potential efficiency. Outside of potential savings I do not think that there is currently any incentive for the Chiefs themselves in order for this arrangement to cabout, and leading two disparate
ome fire and rescue authorities could be
political administrations. 25. There is a lot of evidence of senior staff taking
on work beyond their primary fire service role within their organisation. In County and Unitary authorities, the Chief Fire Officer is sometimes situated at Director-level within the council structure and so already has a wider remit than the fire and rescue service. In one authority there has been a move to make the Chief Fire Officer also the Chief Executive of the Police and Crime Commissioner’s office. We also know that a large number of senior officers contribute significantly to the work of the Chief Fire Officers’ Association.
26. There is scope for efficiencies in sharing a senior operational
command rota between services. This has been working in one area that I am aware of since 2006, and a handful of other areas since. The financial benefits of this are obvious,29 but this would have wider benefits to services through a reduction in the number of senior
logistically challenging. However, there is evidence of this model working well elsewhere in the public sector, even with different
28 CIPFA Fire and Rescue Statistics 2011/12 actuals 29 A pair of authorities operating in this way estimate that it saves them a combined £100,000 per
In one Metropolitan
authority there are 73
firefighters per senior manager, in another there
are just 29
year.
37

Facing the Future
management roles that need to be operational – this would allow a greater number of leaders to come from other sectors, bringing busines
27. It is wo ep t up a
incentivise, encourage and support g f shared serand functions in loca vernment, th
ward. in m that all fire and rescue ole ort work to merge manage t
h cal or fire author n urage eing c rth d tha c
fire and rescue authorities will pursue this opportunity.
s expertise and a fresh perspective.
rth noting that the D artment has se funding pot to reater use oe Transformation Challe
vices nge l go
A This cludes £6.9 auth rities are eligib to bid for to supp men functions with ot er lo ities a d to enco thos already shar servi es to take fu er ra ical steps in t dire tion. I hope
Section 2.2: Demand reduction Fire prevention and protection 28. The most effective way to save lives is to prevent fires and other
emergency incidents from occurring. The key to efficiency in prevention and protection work comes back to understanding risand devising strategies to
k mitigate it. While the response side of the
fire and rescue service should be universal, prevention and sses and people
ha ire and rescue ere the overall numb
r provide 20
atesty Orde h
ly an
protection is about targeting those areas, businemost at risk. There is some evidence to show tauthorities are doing this – in a period whhome fire risk checks decreased, the numbewith a disabled person increased from 87,000 inthan 118,000 in 2011-12.30 And, by far the grebased audits of compliance with the Fire Safetin premises in which people are sleeping – carand hotels – and whose ability to escape easicompromised.
t fer of
d to households 10-11 to more number of risk er are carried out
omes, hospitals d quickly may be
CASE STUDY: Home Fire Risk Check grant
During 2004-08, the Government directly funded Home Fire Risk Check (HFRC) activity for fire and rescue authorities in England through the provision of Home Fire Risk Check grant, which totalled £25m over four years. During this period fire and rescue services carried out nearly two million HFRCs and fitted nearly 2.5 million 10-year smoke alarms free of charge to the householder. An independent evaluation of the HFRC initiative concluded that it was responsible for:
30 Fire and Rescue Operational Statistics Bulletin for England 2011-12 https://www.gov.uk/government/uploads/system/uploads/attachment_data/file/15228/2222551.pdf
38

Findings of the review into efficiency and operations of fire and rescue authorities in England
a 57 per cent fall in accidental dwelling fire deaths recorded during this period
13,670 fewer fires and 888 fewer non-fatal casualties; and, delivering an economic value of the reduced numbers of fires,
fatalities and injuries, during 2004-2008, of between £926m - £1,943m.
This is a return on investment of between 1.37 and 1.78.
It is worth noting that these 10 year fire alarms are now coming to the end of their anticipated life-span and householders need to be encouraged to check these alarms and replace them, with the assistance of the local fire and rescue authority where appropriate.
9. One of the key outputs of a home2 fire risk check is the installation of
rly smoke alarms. As we saw in ke
o
ry authorities, there is a crucial role for fire and rescue authority members in going back to their home authority
ify those most at risk in
fire safety equipment, particulaChapter One, the proportion of the population with a working smoalarm has increased from just eight per cent in 1987 to 86 per cent in 2010.31 Given this massive improvement across the general population, it is right that fire and rescue authorities target the most vulnerable.
30. Best practice in this area comes from those who are finding ways t
share intelligence with local delivery partners to identify homes for risk checks and to equip or support those agencies to deliver the vital safety message. This data sharing seems to work best in County and Unitary fire and rescue authorities by dint of the connectivity between different parts of the wider council and the likelihood of partners using the same IT platform as the fire and rescue service, though this is by no means assured. In combined and metropolitan authorities, where a fire service sits across a large number of different unita
and pressing for better data sharing to identthe community.
t/organisations/department-31 Fire Statistics Great Britain, Table 2.3 https://www.gov.uk/governmen
for-communities-and-local-government/series/fire-statistics-great-britain
39

Facing the Future
CASE STUDIES: Working with other agencies to help the vulnerable Sharing information with Adult Social Care A county authority is taking advantage of their close working with other parts of the county council to share adult client data with Adult Social Care through a Combined Care Service. Vulnerable residents already known to the Council can opt to have their home address details given to the fire and rescue service, leading to home fire safety checks; where the fire service attends an incident involving a vulnerable person, they trigger a follow-up visit from Adult Social Care to support the client in their own home. Prescribing Home Fire Risk Checks Another county authority is beginning work with local doctor practices to identify those at need of fire safety advice and support. The doctors can provide a ‘prescription’ for a home fire risk check for those presenting with at risk ‘symptoms’ – this helps the message reach those who need it, without the need to share personal data directly.
orking with buW
3siness
1. The vast majority of businesses want to do all they can to minimise
rk and
ry will ue n
the risk of fire; at the same time they need those who regulate them to act in accordance with the principles of better regulation. The wocurrently underway with the Department for Business, Innovation Skills and the Chief Fire Officers’ Association to pilot the PrimaAuthority concept for the Fire Safety Order is to be welcomed. It mean that a business operating across a number of fire and rescauthority areas can choose a single authority to be their partner iduties under the Fire Safety Order, meaning that advice is given for the whole business, rather than part of it. This is a positive example of the sector rising to the challenge of supporting compliance through a constructive relationship and the provision of assured advice.
32. However, it was disappointing to hear little during my review about
the important role that fire and rescue authorities play – individually and collectively – in ensuring and promoting the safety of business premises in their area. Working with business aspirations for accessible, consistent and proportionate advice on regulatory compliance is a significant area for efficiencies both for business and for fire and rescue authorities. I strongly encourage local leadership to listen closely to the views of those being regulated when framing
40

Findings of the review into efficiency and operations of fire and rescue authorities in England
their regulatory services and follow the outcome of the Primary Authority Scheme pilots.
Reducing false alarms 33. 42 per cent of all emergency responses for fire and rescue
authorities in England are false alarms. Malicious false alarms nowstand at fewer than ten thousand per year, a dramatic reduction froalmost sixty thousand in 2001/02.32 This was achieved through a widespread use of call challenge by fire control operators, barring calls from persistent hoax numbers, and prosecutions.
Fi
m
gure 19: Breakdown of ‘false alarms’ 2011/1233
False Alarms Good Intent29%
False Alarms Maliciou4%
67%
Total 249,366 False Alarms (2011/12) (pr)
34. The Fire Protection Association estimates that more than 95 per cenof all fire alarm signals from automatic fire alarm systems are unwanted or false. To reduce attendance at these, a number of fire and rescue authorities have since instituted a ‘call challenge’ pfor alarms originating from automatic fire alarm systems; usually means th
s
Alarms (AFAs)
t
olicy this
at the control room will call the premises to confirm the fire
ill
False Apparatus
before responding, although outside of the premises normal business hours or where the call goes unanswered, an appliance wstill be dispatched.34
32https://www.gov.uk/government/uploads/system/uploads/attachment_data/file/141791/Tables_1_to_2__2012_Q3_.xls 33 Analysis of fire and rescue incident records, DCLG 2011/12 34 High-risk premises such as sheltered housing and nursing homes still attract an automatic call out under this system.
41

Facing the Future
35. While some services began call challenge as long ago as 2003,others are only now taking
this step. Some authorities have reported
a 40 per cent reduction in attendances to automatic fire alarms since with ensuing benefits to staff time and costs.
ation are undertaking some interesting work to look at how unwanted fire alarms can b b r of high offending premises and replacing smoke detection systems with ‘multi-sensing’ (smoke, heat and carbon dioxide) detectors. They hope that using these more modern systems can reduce unwanted alarms by as much as 80 per cent.
37. Even accounting for the 50 per cent of signals currently sifted out by
Alarm Receiving Centres, an 80 per cent reduction could reduce false alarm attendances by more than 100,000 per year; a saving of £7 million could be achieved36. This is however, the marginal cost, assuming that the costs of those firefighters and fire engines would be otherwise paid for. The real impact of a reduction in false alarms would be the opportunity to reconfigure the service – a reduction of 100,000 incidents would be one in six of all incidents.
Section 2.3: Latent capacity
changing their policy,While overall there has been a reduction in attendances at automated fire alarms since 2003, it is only since 2006 that this reduction has been significant and even by 2011/12 the reduction was only 28 per cent.35
36. The Fire Industry Association with the Fire Sector Feder
e significantly reduced, studying a num e
38. The current operational design and delivery of fire and rescue services has been likened to an insurance policy, with fire andrescue authorities prepared for emergency incidents that we all hopewill not happen. Under this model it is inevitable that this over-provision to manage risk will result in latent capacity. How this latent capacity is used is a key issue for efficiency in the service.
35https://www.gov.uk/government/uploads/system/uploads/attachment_data/file/141791/Tables_1_to_2__2012_Q3_.xls 36 The average marginal cost in England of responding to a false alarm is £70. The economic cost of fire: estimates for 2008, Fire research report 3/2011
42

Findings of the review into efficiency and operations of fire and rescue authorities in England
Figure 20: What sort of incidents does a firefighter attend in a year – 2001/02 vers2011/12
us 37
Fires False
alarms
Non-fire
incidents Total
2011-12 43 46 21 110
2001-02 80 70 28 178
39. We know that some latent capacity has been invested in increased s,
at ent
rovision to allow time for firefighters to do this work.
investment through to a quantifiable o see how
agencies respond to being asked to pay for
1. Where fire and rescue authorities continue to pay for firefighters to carry out community roles, they need to be assured that it makes a meaningful contribution to reducing risk. The Chief Fire Officers’ Association is examining the social return on investment of this work which may help authorities to direct latent capacity to the right projects.
fire prevention and protection work and to take on community roleoften using the firefighter ‘brand’ to get traction with those whom other services find difficult to reach, like ex-offenders or childrenrisk of school exclusion. The question that needs to be asked, andnot just because of the current economic pressures, is to what extcommunity work is done to make use of inevitable latent capacity or whether latent capacity is built into p
40. Funding reductions and the wider economic
climate have encouraged some fire and rescue authorities to evaluate their community work, prove its value and try to pass the associated costs to other services. But it can be difficult to work out the costs of community roles and to follow this
Across Englandon average each
firefighter attends110 incidents a
,
year. False alarms now
outnumber fires -
s are
outcome. It will be interesting t
46 of the 110 incident
false alarms, just 43 are fires.
firefighter involvement. They will need to compare the added value a firefighter can bring to the cost of employing a youth or social worker at lower expense and will need to establish whether the previously ‘free good’ is a resource worth paying for.
4
37 Estimates derived from incident records and fire-fighter staffing returns, Department for Communities and Local Government
43

Facing the Future
Chapter Two: Key Findings
Fire and rescue authorities have transformed themselves from organisations that dealt with fire response to organisations also covering preventative and wide scue wor d succeer re k an ded in reducing incidents. They now need to transform themselves again to reflect the completely different era of risk and demand.
The focus for the future must be on protecting front-line services; this does not mean a protectionist approach to jobs. Avoiding redundancies, station closures or reductions in fire engines is often the focus for elected members and officers, and there is anecdotal evidence of some self-censorship by Chief Fire Officers.
Innovative crewing and staffing models are being pursued, and these are being shared – but there is little evidence of areas implementing learning from others.
Increasing the total ‘on-call’ firefighters nationally by just 10 precent (to 40 percent) could provide annual savings of p to £123 million. uAll fire and rescue authorities must consider whether ‘on-call’ firefighters could meet their risk – it is an invaluable cost-effective service.
£17 million could be saved if authorities adopted the leanest structure in their governance types.
The Grey Book can lead to some self-limitation by leaders not to introduce change that would require lengthy negotiation. It should be reviewed.
Authorities are right to capitalise on their reputation to help deliver other services to hard-to-reach communities. But this should only be where they are commissioned to do it, or have identified a clear cost benefit to their own aims.
44

Findings of the review into efficiency and operations of fire and rescue authorities in England
45
Chapter 3: Collaborating for efficiency No one setting out to make an efficient model for the delivery of fire and
little hard evidence of
me sharing of ideas, there continues to be a lack of
nteroperable and, of course,
erefore looks at opportunities for structural, operational
r fire and rescue authorities
rescue services for England would develop the model we now have; it has largely been driven by, and subordinate to, wider local government changes. It cannot make sense to have the current range of fire and rescue authorities, each with attendant and often different governance structures, spend levels, senior leaders, and organisational and operational quirks. However, it is easy to say that there should be far fewer, but because of the paucity of examples of combination, there is increased efficiency and certainly no evidence that the biggest authorities were necessarily the most efficient. While I found evidence on my visits of many positive actions to reducecosts, and solearning between fire and rescue authorities and from the wider public sector and beyond. Collaboration in all its forms is the answer to improving the service, making services ireducing duplication of spend. This chapter thand organisational collaboration between fire and rescue authorities (section 3.1); and at opportunities for fire and rescue to look beyond its borders and collaborate with other blue-light services (section 3.2). Section 3.1: Working with othe 3.1.1 Structural collaboration 1. The Fire and Rescue Services Act 2004 enabled fire and rescue
authorities to voluntarily combine; that there has only been one successful combination since suggests that:
there is little appetite or incentive; and/or, there are barriers and difficulties.
3

Facing the Future
2. Naturally, the barriers have been a greater part of the discussions for this review. Numerous mergers have been proposed, investigated
d as barriers, of the merger
process. These are certainly considerations and the equalisation mechanisms for council tax are impacted by the need for a referendum to raise the precept by more than two per cent in a year.
hat the s across the sector is that the merger of Devon and
Somerset, completed in 2007, was possible because not only was
rn and they have been able to capitalise on this in the last five years. An independent review
t bination, the politics of a merger can be
very difficult to orchestrate locally.
r
he need for a formal combination. This is so true, in fact, that some
outweigh the additional benefits given that the biggest savings had gh shared control rooms. Some are
pursuing ‘strategic alliances’, whereby two or more authorities share
tual
and eventually abandoned, with a range of issues citesuch as differences in council tax levels and the length
However, the key problem compounding these issues seems to be a lack of local political appetite and lack of incentive to combine.
3. The sole driver for mergers in England seems to be the efficiency
opportunities it would free up (reducing governance and management structures, for example). What is interesting is tbroad consensu
there strong political will but the focus was also not on making immediate savings. While not the initial driver, the Devon and Somerset merger was fortuitously timed to respond to the budgetary challenges caused by the economic downtu
of the combination showed that the net cumulative financial savingstotal £4.2 million between 2006/07 to 2011/12. It was disappointing that during the time I have been conducting this review, Devon and Somerset fire and rescue authority and Avon fire and rescue authority did not take forward their proposal to merge, showing thaeven with experience of com
4. What is clear is that mergers may offer significant opportunities fo
efficiencies. But a number of these efficiencies can be made by closer collaboration between fire and rescue authorities without t
mergers have failed in part because the work to merge would
already been achieved throu
as much as possible without a change of legal status, in order to capitalise on these benefits while avoiding the perceived and acdifficulties of merging.
46

Findings of the review into efficiency and operations of fire and rescue authorities in England
3.1.2 Operational collaboration Control rooms 5. A large part of the collaboration between fire and rescue services is
being driven by the move to shared control room systems, a produfrom the demise of the FiReControl project. While the jury iswhether there is a need for 46 different fire and rescue authorities, it is generally accepted that sharing the IT systems, staff and premises for control rooms makes sense, especially in an environment of
ct out on
shrinking call volumes.
s about
from a
eographically adjacent as some collaborations have shown, means that there can be little efficiency
l
by
ssional framework for competence.
. Major challenges remain, however. The production of easily understandable and updateable guidance is key: previous guidance
6. There are lessons here both for fire and rescue authoritie
proactively and positively engaging with initiatives, and for central government in considering how best to use levers to drive collaboration. Using funding to incentivise collaboration but not mandating the method seems to have produced good results.
7. However, I am concerned that a number of fire and rescue
authorities have not yet fully taken on the opportunity that control room funding offered. Almost half of authorities have invested in shared systems but have declined to take the natural step of merging control rooms, teams and operational practices. Savings in shared fire control do come from shared procurement of systems and efficiencies in interoperability/back up, but they also comesingle location and fewer staff – this is where ongoing revenue savings can and should be made. The reduction in call volume and the fact that there is no need to be g
in small services in particular retaining their own control room. It is telling that it was Sir George Bain who recommended that all fireauthorities retaining separate control rooms should be required to demonstrate how this is cost effective.38
Shared operational policies and practices 8. Shared control rooms are driving conversations about operationa
policies and practices that will lead to greater interoperability as well as considerable scope for efficiency. Much work is now being led the sector to bring together operational guidance, standard operatingprocedures, and a profe
9
38 The Future of the Fire Service, paragraph 6.17, page 49.
47

Facing the Future
has been too long, too onerous to produce, and the consultation and validation procedures too complex and drawn out. My hope is that by
y the sector, this work can focus on core needs. One
led pportunity for sector leaders to take a strong
role in coordinating this work, both to achieve a clear, single set of
1. Interoperability is a key requirement of the Fire and Rescue National i is a
ch
n-
e will help it become more price competitive,
recruitment. The challenge for fire and
being driven bof the work streams developed during the FireControl project was to develop common operating procedures and practices to improve mobilising response procedures and enhance interoperability and firefighter safety.
10. Both of these areas of work are now being coordinated by sector
groups and there is an o
procedures and guidance, but also to ensure take up of these documents across all authorities to avoid potential duplication or worse, contradicting each others' work.
Shared training 1
Framework for England and compatible training and exercislever to achieve it; this is at odds with the fragmented local approaI have seen as part of this review.
ng
39 There will always be some training carried out in-house, and it makes sense for routine, owatch training to be done in this way. However, for fire and rescue authorities to continue to build their own training centres to providethe type of ‘off watch’ training which the Fire Service College can provide does not seem a sensible use of scarce funds nor an approach that will ensure common standards across Services.
12. I was heartened to hear, however, the
widespread support amongst the sector for having a national training institution for fire and also for the wider emergency services. The recent sale of the Fire Service Colleg
free from the constraints of government ownership. But the key to this happening is fire and rescue authorities ‘buying-in’ to the College and achieving economies of scale, especially training in more specialist areas and recruit training at a time of low levels of
rescue authorities is to accept that to
39 The challenges were highlighted in the HSE Report “Management of Health and Safety in Great
ge nd
authorities is to accept that to
ve
isation
The challenfor fire a
rescue
achieinteroperabilitythey all need to
forgo an elementof custom
Britain FRS, October 2010”.
48

Findings of the review into efficiency and operations of fire and rescue authorities in England
achieve interoperability they all need to forgo an element of customisation. What I’ve seen throughout this review is that fire and rescue authorities are not yet prepared to take this step – but I hopethat the future holds greater pragmatism.
13. It is encouraging that the new owners, Capita, have expressed the
vision of the Fire S
ir ervice College becoming a centre of excellence
for interoperable training between fire and rescue services and
come, f
o Training40 and the Civil Service Learning Portal,41 available to the wider public service
between Category 1 and Category 2 responders for both training and exercising. They have also made statements on the need for a blended approach to training to a common competency standard, and the development of web-based e-learning packages is welparticularly for on call firefighters. This is in line with the Ministry oDefence’s Defence Systems Approach t
sector. 3.1.3 Organisational collaboration Sharing and outsourcing back office 14. While I have found no evidence to suggest that there is an optimu
size of authority; however it is certainly questionable whether each authority should have its own individual HR, payroll, and legal teamsWhile, many of these support functions are shared, in county authorities in particular, though there is potential for more to bedone.
m
.
light is the administration of c serv ce nd desiraghters’ pensdminist
le, part Across both
ctive scheme med mebine th
shoul
15. One particular example I wanted to high
pensions. In his independent review of publiHutton questioned whether it was efficient aand rescue authority to administer their firefischemes. He found clear evidence that the aschemes can benefit from economies of scaschemes were below 100,000 members.pension schemes, there are around 37,000 a38,000 pensioner members and 4,400 deferrcould be an opportunity for authorities to comreduce costs and fire and rescue authoritiesfurther.
i pensions, Lord ble for each fire
ion ration of pension
icularly where firefighter
embers, mbers. There eir operations to
d investigate this
40 http://www.gov.uk/government/publications/jsp-822-governance-and-management-of-defence-individual-training-education-and-skills 41 www.civilservicelearning.gov.uk
49

Facing the Future
Procurement 16. Collaborative procurement is often suggested to be the silver
for efficiency and it is an obvious way to save money, when commissioning expensive or gene
bullet
ric items. Procurement collaborations drive two types of efficiency:
and
e a better deal with another supplier. I discussed with a number of senior officers whether fire and rescue authorities, even
chaser to influence the market. I think it is clear that there are opportunities in fire-specific equipment
ms, the answer is to scale up
re cue authorities should adopt a principle of never buying alone
(at least one authority is able to make this claim already) and where
e
g
r, while steps are being taken in leveraging the power of buying together, I have found widespread duplication of effort in the
financial savings through economies of scale; and time savings (and consequently cost savings) through
reduced duplication of effort in designing, commissioningevaluating products.
17. Many fire and rescue authorities have taken steps in the first area
and some considerable savings have been achieved. The Firebuy project has left some ongoing value in framework contracts still in use by a number of authorities; others have reported that the framework acts as a sort of ‘market price’ that they can use to negotiat
together, can be a big enough pur
and services, but for more generic iteonce again, and purchase alongside other public sector bodies.
18. Fire and rescue authorities in England enjoy great independence in
procurement – the police, since 2011, must use national framework contracts for much of their procurement.42 What is clear is that fiand res
they do buy alone, because they have driven a harder bargain and made savings, they should share their experiences so that other authorities can benefit. One opportunity for this is the Cabinet Office procurement pipeline, an initiative with great potential, though it is disappointing to see that only a handful of fire and rescue authorities have used this so far. Pipelines highlight opportunities for suppliersand help them align their business to meet projected demand. ThConfederation of British Industries considers that pipelines have increased suppliers confidence in UK markets as well as influencinchanges in approaches to procurement.
19. Howeve
42 http://www.nao.org.uk/wp-content/uploads/2013/03/10092-001-Police-procurement-Exc-Summary.pdf This recent NAO report shows that there is still some way to go with implementing national procurement, but that there are substantial opportunities for efficiency that can be achieved in this way.
50

Findings of the review into efficiency and operations of fire and rescue authorities in England
design, commissioning and evaluation of fire-specific products and
rted from scratch on agreeing
nt items – and authorities need to be prepared to buy generic items that meet their needs
r ine of
procurement, as one of the visited authorities does.
n
t is
nt, hopefully enabling greater savings and further collaboration.
efficiency. Representatives of the Fire and Rescue Suppliers
UK
this is where fire and rescue authorities should focus their efforts towards better procurement:
1. Design – Four authorities visited had sta
substantially the same procurement project rather thanone specification, driving a lower price and improving interoperability. England is not so geographically diverse as to mean that areas need vastly differe
rather than falling into the trap of over-specification. Tellingly, nearly all areas said they were open to letting other areas use their contracts – but few seem prepared to just buy from anotheservice’s contract. This isn’t a new phenomenon – In the LFire (1995) said that Brigades should agree standard specifications.
2. Commissioning – The procurement process itself is also an
area for efficiency. One way to achieve efficiency is to share procurement teams with another body, an advantage built in to the County governance model, or to share the head of
3. Evaluation – The lack of learning between fire and rescue
authorities leads to an authority testing and approving a new product or new design even where it has already been tested and approved in another authority. This is also true of service delivery models. I do not think that mandatory third party accreditation is the answer, but a greater level of trust betweeauthorities is needed to ensure the rapid spread of good ideas and proven technology, with knock-on efficiencies for manufacturers, particularly small companies.
20. This review did not focus on the detail of fire and rescue
procurement; as such, I am pleased therefore that the Departmenworking with the Chief Fire Officers’ Association to capture procurement data on fire specific equipme
21. The fire supply industry has an important part to play in procurement
Association demonstrate a commitment to maintaining a strongsupply chain to support the fire market. The fire and rescue service is
51

Facing the Future
a trusted brand which in turn can be used to the benefit of UK small and medium enterprises together with export potential for UK Plc.
CASE STUDY: designing and procuring together
Two groups of authorities who chose to continue working together after the demise of Regional Management Boards have been able to make considerable savings through working together on procurement. One has collaborated on contracts for workwear, firefighter protective clothing, breathing apparatus, officers’ cars and specialist training, collectively saving £0.9 million since 2010/11. Across the whole of their procurement work, for a cost of less than £9,000, they have achieved cashable and non-cashable savings estimated at more than £1.5 million. They have also agreed to jointly procure fire engines to a common specification, saving £18-20,000 per vehicle. The other has collaborated to draw up framework contracts on specialist training, fire fighter clothing and the management and maintenance of personal protection equipment, saving £600,000 per year across four services.
Section 3.2: Collaboration with other blue-light services
of
re rities:
of course essential at the scene of an
d – after all, efficiency is not just about
entation of
esponder tchy,
but firefighters have shown a real
e ese new
es
22. Efficiency and quality can be driven through collaboration outside
the fire sector, particularly with other blue-light services. Besides finding partners to achieve economies of scale in procurement theare two core operational opportunities for fire and rescue authco-working, and co-location.
Co-working 23. Co-working with other blue-light services is
o
incident and this is acknowledged through the sector-led Joint Emergency Services Interoperability Programme which has high-level government support. This work is crucial to improved efficiency on the groun
Implemco-responding and
first rschemes is pa
money. While this interoperability programme deals primarily with emergency response at incidents, strategic joint working like this can create opportunities from that
willingness to takon th
responsibiliti
52

Findings of the review into efficiency and operations of fire and rescue authorities in England
greater understanding. It would be valuable if those involved in this work could examine joint efficiencies that could be achieved.
24. Some countries have a single fire, rescue and em
service because of the obvious on-scene synergies and theergency medical
re have
left to local determination with the inevitable result that
e
ieving a shared way forward, with areas arriving at different solutions. The most
ng bulance service to the community rather than subsidising it. In
other areas, agreement had been reached for the Ambulance Trust flat rate
retainer was paid by the Ambulance Trust per station that could
particular synergy between Ambulance Trusts’ Hazardous Urban Search and
both services go to the ble du
th the ilar team
be merg
is less developctice on mn order
ty, and th
been suggestions over the years that as demand for fire and rescue’s traditional roles reduces, firefighters should support the ambulance service by taking on some casualty care. This has been
implementation of co-responding and first responder schemes is patchy across England, though in my experience firefighters havshown a real willingness to take on these new responsibilities and beable to provide this higher level of emergency care at incidents.
25. With 10 Ambulance Trusts in England, and 46 fire and rescue
authorities, there has been difficulty in ach
innovative I saw was where the Ambulance Trust reimbursed costs where the fire service reached the patient within the response standards set by the Trust, ensuring that fire and rescue is improvithe am
to provide training to fire and rescue staff, and in others a
provide casualty response. I would like to see a more uniform approach to take advantage of the possibilities and encourage fireand rescue employers, representative bodies and the ambulance service to discuss how this can be achieved without significant impacts on the public purse.
26. There is a
Area Response Teams and fire and rescue’sRescue Teams. These responders fromsame type of incidents and there are inevitaexpertise, training and equipment. With boand the fire and rescue service operating simis now timely to questions how they cansingle response team.
27. Co-working with the police service
the ambulance service. I saw some good prafirefighters joining community policing teams imessages about arson and community safe
plications in their ambulance service
s in parallel it ed to provide a
ed still than with y visits of
to spread is should be
53

Facing the Future
examined further. There are however, more recent developments offire and rescue authorities joining the police for a single emerg
ency
control function. There has also been active consideration as to how Police and Crime Commissioners might also take on responsibility for fire and rescue services (see section 5.2).
CASE STUDY: co-responding
One combined authority has a well-established programme of co-responding and have an attendance-based payment agreement with the local Ambulance Trust. Operating out of 19 fire stations, they receive approximately £90,000 per annum for their attendances at Category A emergencies.
Co-location 28. I was pleased to see that some fire and rescue authorities are ta
steps to co-locate with ambulance and police services, albeit on only a handful of stations. The majority of co-location involves ambulancecrews using fire and rescue stations as they would an ambulance station – and many fire stations are set up for this, being able to offer space to park and fuel ambulances and provide rest areas for crew. A smaller number of co-locations include the police service, which can be vital in rural areas in keeping a local presence. Part of the reason for this slower pace is cited as ensuring suitable custodiaspace.
29. I believe that there is significant opportunity to expand on this start
and rationalise the public sector estate. Co-location is currently much the exception and not th
king
l
very
e rule and discussions between
en
of rimarily based on operational and risk
t
leadership organisations in each service would help facilitate a clearer direction. The best planned co-locations include the ambulance or police service selling their previous location, and thpaying rent to the fire and rescue authority, and in some cases supplementing this with a small amount of capital for modifications. The opportunity is particularly attractive in urban areas where land suitable for development has a higher value, of course, but the benefits of co-location could be realised nationwide. The locationfire stations should be pplanning, but where fire and rescue authorities decide that a new site would provide better cover, or a station needs renovation, they musshow that they have pursued opportunities to co-locate with other services.
54

Findings of the review into efficiency and operations of fire and rescue authorities in England
CASE STUDY One Metropolitan authority has worked with other blue light services to set up two Tri-Service stations, with potentially more on the way. In addition to the benefits of closer working with these partners, the authority also reports that it receives annual revenue of more than £40,000 per year.
Chapter Three: Key Findings
The 46 fire and rescue authorities, each with different governance structures, senior leaders, and organisational and operational quirks does not make for a sensible delivery model. Mergers can be a solution, but there is a lack of local political appetite and incentive to combine.
There is widespread duplication of effort in the design, commissioning and evaluation of fire-specific products. A greater level of trust between authorities is needed to ensure the rapid spread of good ideas and proven technology.
The challenge for fire and rescue authorities is to accept that to achieve interoperability, we all need to forgo an element of customisation. What I’ve seen throughout this review is that fire and rescue authorities are not yet prepared to take this step – but I hope that the future holds greater pragmatism.
Collaboration, co-responding and co-location with other blue-light services does happen and can deliver efficiency through consolidating public sector assets as well as closer working. But progress is patchy and driven or hindered by local relationships.
55

Facing the Future
56
Chapter 4: Driving efficiency I have so far discussed the different options that fire and rescue
highlights , it has also shown the lack of shared
te
marking, scrutiny and accountability to the rs (section
authorities can pursue to make efficiencies. While this report many examples of notable practicelearning within the sector, and this has undoubtedly impacted on the raof change. This chapter therefore asks what drives efficiency in the provision of fire and rescue services and how can it be further encouraged. It includes discussion of the impact of funding (section 4.1); the importance of benchpublic we serve (section 4.2); and the role of national leade4.3). Section 4.1: Funding Challenging budgets 1. As we saw in Chapter One, there have been central governm
funding reductions since the 2010 Spending Review which have impacted on fire and rescue budgets. It was striking in discussions with Chief Fire Officers and elected memb
ent
ers, and in submissions
services
quantifying the costs and benefits of the different things that fire and rescue authorities do, to help them to prioritise.
2. The difficulty with all statistics relating to fire and rescue authority
expenditure is that it is coloured by the amount the authorities are funded, both centrally through government grant and locally through council tax precept. I believe decisions made locally by fire and rescue authorities seem to have, understandably, been made with the budget available rather than necessarily with the level of risk in mind.
3. My view is that the starting point for the funding formula is fair.
Central funding takes account of a range of factors that affect the cost of service delivery, including deprivation, and also of the amount
4
from others, that it is this funding reduction, combined with council tax freezes, rather than the need to deliver more efficient per se that has been the driver for the vast majority of changes. Funding reductions also seem to have been a key driver for

Findings of the review into efficiency and operations of fire and rescue authorities in England
of local income (council tax) which each council has the potential to raise. However, in any system, there are ‘winners’ and ‘losers’ and in
roup government has f funding through floor
damping and ceilings, which limits the effects of reductions and increases in grant. It is these decisions that have led to perceptions of unfairness, as those authorities whose funding is scaled back do
ers pplied to
ll drive out most of this slack. Like many I spoke to, I believe further funding reductions will be needed due to the economic
tlined in this report, were they applied by all authorities, would certainly enable further efficiency savings.
elieve that savings much beyond those required t
o
m ble to
e needs to be a way to reflect and incentivise change, previous attempts to do this have
ny rs
s as a way of managing contingencies, spreading costs and planning for the future. A fire and rescue authority may also, in
g to
responding to requests from this latter grepeatedly sought to maintain stability o
not gain their full funding formula allocation, while others are protected from larger reductions.
4. Chapter One (Figure 11) demonstrated that £196 million per year
could be saved by reducing the expenditure of the highest spendto that of the average. However, reductions in funding are athe national envelope, not particular authorities. While I believe that £196 million is an achievable sum for the service overall, the spending reductions set out in the current spending review period wi
situation. The ideas ou
However, I do not bby the current spending review period would be achievable withousome sort of change or action at the national level, and I reflect onthis in Chapter Five.
5. Some of those who engaged in the review said that funding needs t
be reviewed, particularly in light of the different speeds that fire andrescue authorities have responded to the efficiency challenge. I aconcerned that there are some authorities that would not be ameet the challenge should substantial further reductions be applied equally across the board. While I agree that ther
not resulted in an agreed way forward and I have not heard from aquarter a way of achieving this. This is a challenge for sector leadeto consider and put to central government.
Reserves 6. It is right that fire and rescue authorities hold and accumulate some
reserve
certain circumstances, be eligible for central government fundin
57

Facing the Future
reimburse a portion of response costs in significant emergencies under the Bellwin Scheme.43
7. National statistics allow us to compare the levels of reserves hdifferent parts of the local government sector.44 Fire and rescue authorities have levels of reserves well above the average percentage of revenue outturn. The comparison with police authorities is particularly pertinent – while the police hold 11.9 per cent of revenue outturn in reserves, fire and rescue authorities hold a substantial 21.5 per cent. When re
eld by
serves are split between ‘earmarked’ and ‘unallocated’, the situation is even more pronounced
ut it poses the question: is this an appropriate amount for fire and rescue authorities to hold
ow not the time for these reserves to be called upon to invest
– fire and rescue authorities hold 9.1 per cent of outturn in unallocated reserves, while the police hold just 4.5 per cent.
8. We can only get a true picture of reserves for
‘stand-alone’ fire and rescue authorities as county and unitary authorities and London Fire Brigade all hold non-ring fenced reserves within their parent organisation. Figure 21 shows reserves for each combined and metropolitan authority compared to their annual revenue outturn, showing an exceptionally high level of reserves in some areas. One Metropolitan holds more than 55 per cent of their annual revenue outturn.
9. Moreover, if we look at a picture of fire and rescue authority reserves
over the financial downturn of the 2008-2012 period, we would instinctively expect to see reserves staying relatively stable as authorities both take advantage of the back-loaded funding reductions to make savings, and invest those savings in projects to deliver further efficiencies. What is remarkable about Figure 22 is that it shows that even in 2008-2012 single-purpose fire and rescue authorities’ total reserves increased from just over £200m to more than £400m. It is good that authorities were clearly seeking to make efficiencies and made savings of this size, b
and is nin spend-to-save type schemes?
43 https://www.gov.uk/government/uploads/system/uploads/attachment_data/file/5943/2160230.pdf 44 Local Government Financial Statistics England, No. 22, 2012. https://www.gov.uk/government/uploads/system/uploads/attachment_data/file/7476/2158981.pdf
ity ore
5 per ir
evenue
s
One authorholdsthan 5cent of the
annual routturn in
reserve
m
58

Findings of the review into efficiency and operations of fire and rescue authorities in England
Figure 21: Fire and rescue authority reserves as a proportion of annual expenditure
452012
0
10
20
30
40
50
60Pe
rcen
tage
METROPOLITAN COMBIN
Figure 22: Fire and rescue authority reserves in total and by combauthority (excluding LFEPA), 2001-201246
ED
ined or
metropolitan
400,000
450,000
0
50,000
100,000
150,000
200,000
250,000
300,000
350,000
2001 2002 2003 2004 2005 2006 2007 2008 2009 2010 2011
£000
2012
Total Combined Metropolitan
45 Local government finance outturn data 46 Local government finance outturn data
59

Facing the Future
Invest to save 10. The capital grant for fire for 2013-15 was awarded in part through a
bidding round for projects predicting a clear return on investment over ten years. This was an innovative idea, using capital to make ongoing savings for fire and rescue authorities and target funding at those areas that needed it most.
11. However, in my opinion the overall quality of the bids was low and
only 21 of the 113 bids showed a cost-benefit ratio of one or more over a decade. It’s unclear from my discussions whether this was due to a shortage of efficiency ideas or a reluctance to undertake projects, such as the merger of stations, which would lead to staff reductions. Looking at the bids, it was remarkable the difference in estimated costs and benefits on very similar projects, showing a lack of sharing – if fire and rescue authorities were more open with each other about how much they spend on different items/projects, there would be a better sense of benchmark costs. What is clear is that in addition to sharing best practice, greater capacity needs to be created in fire and rescue authorities in identifying and pursuing
projects that will release long term return on investment.
CASE STUDY: invest to save
One authority successful in the capital grant bids is using the £3.9 million to begin a major estate rebuild in a substantial and considered ‘Invest-to-Save’ approach. They have predicted cashable savings of £22,564,000 from their rebuild projects, which incorporate improvements in space utilisation, reduced maintenance and use of technologies.
Charging and trading 12. Some fire and rescue authorities are taking an innovative look at the
services they provide to their community and the potential for either recouping the costs (charging) or selling those services for profit (trading) where appropriate. The difference between trading and charging is fairly easy to set out conceptually, but has proven difficult for authorities to navigate in practice. The difficulty seems to be around setting a price for activities that properly reflects the costs involved to ensure that total cost recovery is achieved, without overstating these costs and slipping into trading. This might be a suitable area for the National Audit Office to consider under the new audit arrangements.
60

Findings of the review into efficiency and operations of fire and rescue authorities in England
13. Fire and rescue authorities are only allowed to charge for or trade services outside their statutory duties. In trading, fire and rescue authorities are constrained in that any service provided on a commercial basis, beyond simple cost recovery, must be delivered through a company, or trading arm, making them subject to competition law. Some in the fire industry have expressed concern that fire and rescue authorities, in using the fire service badge and
y e
he e
on acts,
aring and collaboration between services?
reputation, are trading on an unfair advantage. While the fire service is rightly well-respected, it is however constrained in its operation bbeing a public body and does not have the advantages of a privatesector organisation. The real issue for me is whether fire and rescuauthorities have the right skill set to trade efficiently, and whether tgovernance structure can properly challenge the business side of thservice – a Non-Executive Director or similar may be appropriate to provide additional challenge.
14. Trading can be a useful way to generate income. As more fire and
rescue authorities move to having a trading arm, one intriguing question arises – won’t this bring authorities into direct competitiwith the private sector and each other as they try to secure contrand might this competition act as a new barrier to fuller sh
CASE STUDY: Community Interest Companies
A number of authorities have sought to fully utilise the Localism Act 2011 freedom to generate revenue themselves by trading though a Community Interest Company.47 One formed their Company in March 2012 and expect a surplus of between £0.5 and 1 million by the end of 2014/15. This surplus can then be used for a wide range of community projects that have the potential to reduce the demand on fire service resources, such as training and education programmes.
Mutuals 15. One of the more innovative delivery models proposed by a fire and
rescue authority is to deliver the service through an employee-led mutual. Over £1 billion in public services are being delivered throu
gh
CICs are limited companies, with special additional features, created for the use of people who
want to conduct a business or other activity for community benefit, and not purely for private advantage.
47
61

a mutual model, with evidence suggesting they are delivering a better and more cost-effective service, with higher staff satisfaction.48
16. The specific proposal under consideration by a fire and rescu
authority is for the service to separate from the authority to become an employee-led mutual, providing services commissioned by the authority and generating additional income through a range of commercial activities. The authority would retain its statutory responsibilities. The service would then have the freedom to design their services in a way that best meets the needs of their local communities, whilst exploring new commercial opportunities and boosting staff engagement and productivity. Potential benefits, therefore, are increasing efficiency and use of assets, as well as in bringing in new revenue and o
e
pportunities.
a level of concern among the public that
, despatch. In
all of these areas, a mutual could operate. Indeed there is no legislative barrier to fire and rescue authorities continuing to explore
tions of outsourcing any or all of its services short of any
19. It is of note that one of the most respected international sector fire and rescue services is that provided in Denmark by private
17. Any fire and rescue authority can choose
to mutualise some of its services. But the Fire and Rescue Services Act 2004 limits the extent to which mutuals can deliver all fire and rescue authority services, including firefighting. There is also
involving what is essentially a company, however it is run, in the delivery of frontline emergency services brings a risk of a ‘profit over lives’ mentality.
18. Having said this, there is already a range of fire and rescue activities
currently outsourced to both the private sector and other parts of thepublic sector including: support services, training, specialist rescuevehicle and equipment maintenance, call handling and
the opactivity needing to access a fire and rescue authority’s powers in relation to Sections 44 and 45 of the 2004 Act.
48 For example, Anglian Community Enterprise, a mutual healthcare provider with over 1000 staff,
11 0%
d spending on frontline services from 74% to 84%.
nefits e
e
as bringing in new revenue and
Potential beof a mutual ar
increasing efficiency and usof assets, as well
opportunities
made efficiency savings in 2011/12 worth £1.4 million. And since leaving their local authority in 20Project Salus, a children and youth services mutual in the South East, has grown by around 3and increase

Findings of the review into efficiency and operations of fire and rescue authorities in England
contractor Falck, whilst in the UK most international airports havefirefighters employed by the private sector. But in both of these
models, as well as in health and social care examples, public tly
public
utions
new innovative
opportunities and a connection with the service being provided. g pub ical trust servic
confidence and assurance in the service provided are significanassisted by an independent regulator and inspectorate (i.e. the CareQuality Commission for health, the Civil Aviation Authority Fire Inspectorate in airports, and the Fire Service Inspectorate in Denmark) setting the standards and bringing the providers to account. The absence of such a body for fire and rescue in England is likely to provide a consideration to some of the innovative solbeing considered where public confidence is at risk.
20. While mutuals may not be the panacea for efficiency in the provision
of fire and rescue services, they do provide
However, there is a significant risk of losinin a highly respected public fire and rescueunderpinning assurances in place.
Section 4.2: Accountability
lic and polite without
Scrutiny arrangements 21. Local elected member scrutiny of the serv
varies considerably in fire and rescue author2012 Fire and Rescue National Framework rrescue authorities mus
ice anities in Enequires th
t hold their senior officer to account for the delivery of the fire and rescue service; and that they should satisfy
al
er the sort of scrutiny communities might expect. Some that I saw seemed robust
o perly
scrutiny and efficiency needs to be investigated further. To my mind,
d outside challenge gland. The at fire and
themselves that they have arrangements in place to provide the level of scrutiny their communities expect. The evidence that this is happening was patchy.
22. County and unitary fire and rescue authorities have statutory scrutiny
arrangements at a council-wide level; however neither combined nor metropolitan authorities seem to have fully embraced the NationFramework requirement and consequently the variety of structuresthat have been put in place do not seem to deliv
and independent, some over-burdensome, and others potentially tohigh-level. There was not sufficient time for this review to procompare the different arrangements in place, but the link between
County fire and rescue authorities provide the best model for scrutiny, in that decisions are examined in the wider context that the
63

Facing the Future
parent authority provides – this scrutiny includes, of course, the contestability of funding from central government.
23. It is notable that elected Police and Crime Commissioners were
introduced because former Police Authorities (which were established on similar levels to existing single purpose fire anrescue authorities) were not seen as providing enough scrutiny and accountability to the public. A similar model for fire could clarify accountability arrangements and ensure more direct visibility to the electorate.
d
n there still doesn’t seem to be an active strategy for
c on risk and resources, with the vast majority of people
ged in the provision
fire eroic situations, and
the other, being chastised for spending time rescuing squirrels. The
n
if the
t
public – using deliberative polling, for example, where over a number
s treme
images of the fire
situations or
g els
Helping the public get the service they need 24. Since the Bain Report’s recommendation,
fire and rescue authorities have been required to consult their communities in the preparation of their Integrated Risk Management Plans. But ten years o
The public seetwo
effectively engaging the publi
unaware of and unengaof their local fire service. There is a need to re-evaluate how authorities engage the public, both in relation to planning documents and more widely.
25. Part of the issue is getting beyond the public’s relatively superficial
view of the service. The public sees two extreme images of theservice in popular culture – one, saving lives in h
for rescuinsquirr
ex
service – saving lives in heroic
being chastised
nuance of the debate about whether resources should be focused on prevention work or response, and whether a fire station needs to be kept crewed full time if it only has 100 calls a year, can get lost. Thedrive behind localism and local decision-making is that the public caget more involved in influencing the services they receive, but public are not properly engaged, what is the intrinsic value in having 46 local services? The authority is of course a proxy for the public but it needs to play a stronger role in ensuring that the local area isinformed about the service it gets and how different decisions affecthem.
26. In some areas there is a strong effort to engage and inform the
64

Findings of the review into efficiency and operations of fire and rescue authorities in England
of hours a group is polled, then given more information and the opportunity to ask questions, and then polled again. The validity of future budget planning influenced by a survey conducted by
nable.
e
whether their local fire and rescue service delivers the
service that they need.
cue autho challenge luntary
team from other seressm
for th should niew reports
atter oAssociation
t fire and rescu area seeking
n
ties with the means to benchmark their performance across a range of criteria.
firefighters in uniform asking how much the public would be individually prepared to pay for their service seems questio
27. There is no easy answer. I hope this report can spark a conversation
about how much the service costs and the different ways it can bdelivered; and that the public, alongside authority members, can useit to look at
Peer review and benchmarking 28. One of the mechanisms for fire and res
their performance is peer review. This is a voheld every three years, with a small reviewing performance against their self-assservice improvement rather than scrutiny, but meaningful and inspire confidence, servicescontinue to choose the review team and revpublished together with an action plan as a msolution would be for the Local Government of reviewers, noting their specialisms thacould request, and to allocate these to the nextreview.
rities to process, usually
vices ent. It is a tool for
e process to be ot be able to
should be f course. One
to hold a list e authorities
a
29. A small number of fire and rescue authorities are using the Europea
Foundation Quality Model as a way of looking more widely than just the self-assessment, with non-fire experts looking at their organisational practices. The benefit of this model seems to be around the year-on-year comparison of performance, providing a sense of continuity that current peer review arrangements do not offer. However, there are a number of other tools that do provide thison a statistical level, notably the Audit Commission’s value for money profile tool,49 which I was surprised to hear nothing of on my visits. Itis an excellent tool for comparing performance, both year-on-year and against other authorities and importantly is fully open to the public. The Local Government Association’s ‘Inform’ service, due to be updated and extended shortly, also provides fire and rescue authori
49 http://profiles.audit-commission.gov.uk/_layouts/ACWebParts/NativeViewer.aspx?Report=/Profiles/VFM_Landing
65

Facing the Future
Section 4.3: The role of national leaders Knowledge and skills of fire and rescue authority members 30. The delivery of fire and rescue services is clearly diverse in t
different areas have responded to the changing environment. The he ways
Bain Review identified that elected members needed greater support
y
. hat there is variation in the knowledge and
engagement of fire and rescue authority members.
r
d
ate a
ctice bulletin for all members. The lack of sharing across the service is not limited to fire and rescue services, it is endemic in
to
ly
sing the innovative from what should already be standard practice; and,
to be able to provide the strong leadership necessary to drive reform of the fire service50 and this is still true today. Arrangements differ bauthority, with vast disparities in the number of members and some authorities working on a cabinet basis and others with an executiveIt is inevitable therefore t
31. But fire and rescue authority members are ultimately responsible for
the service in their area, not the Chief Fire Officer – there needs to be a clear understanding on both sides that the authority is accountable for ensuring a quality, value for money, appropriate fire and rescue service for their area and that the fire and rescue serviceis a body they commission to help them discharge that duty. In ordeto ensure this robust customer/provider relationship, members neeto have the knowledge and skills to provide challenge to their officers. I am pleased to see that the Local Government Association is planning to hold a ‘Leadership Academy’ to provide training to leadmembers on fire authorities. I also welcome their decision to crebest pra
Authorities themselves, and I hope that by members hearing more of the activities of other authorities, they can ask their service ‘why not?’
Sharing good ideas 32. The Chief Fire Officers’ Association oversees a range of activities
promote sharing of good practice within the sector, including conferences, websites, and workshops and this has clearly taken a step up in recent years. Many of those I spoke to for this review said that the need for increased sharing of good practice would inevitabhave to be a conclusion for this report; on reflection, I disagree. There is a plethora of information shared and available to senior officers; the real problems in this area seem to lie in:
properly asses
50 The Future of the Fire Service, paragraph 6.28, page 52.
66

Findings of the review into efficiency and operations of fire and rescue authorities in England
taking action from shared learning and implementing ideas created by other areas. I felt a great deal of frustration from
had
embers (and senior officers) are exposed to the best of fire and rescue. With this
to see
e
res lp authorities make savings and improve their service. There is
an important role here that the Chief Fire Officers’ Association and ent Association could fill in leading discussions
ation.
ch ire and
Rescue Suppliers Association to produce clear (non product specific)
Such work would avoid duplication at the pre-procurement phase as would joint evaluation of products
senior officers on a number of visits that where somethingbeen proven to work, with a robust business case and risk assessment, and agreement with representative bodies and theworkforce, that the outcomes could not be replicated in the other 45 fire and rescue authorities without repeating the whole process.
33. I think there is a role for the Chief Fire Officers’ Association in both
these areas but this work needs to be linked into the Local Government Association’s initiatives to ensure that m
shared knowledge I hope the sector can begin to re-baseline what is standard practice and put an increased emphasis on raising performance across the board to that of the best. I would likethe sector measuring itself not just by how much is shared and how well-attended committees or conferences are, but by tangible results of what is learnt and copied from one area to another.
Facilitating collaboration 34. There is a clear potential role for sector organisations and
representative bodies to promote efficiency through collaboration. Many of the ideas in this report can only be implemented with strong leadership from employers and political leaders in partnership with the professional leadership cadre providing a clear espousal of thbenefits to employees. Promoting shared training and procurement, and marshalling work to agree ever closer standards and proceduwill he
the Local Governmwith their counterparts in the police and ambulance services, and with trades unions, to agree a shared way forward on collaborOn co-location, for example, a national agreement could be sought that when any of the services look to renew or relocate buildings, they examine the possibility of collaboration.
30. There is also clear scope for a collaborative approach between su
bodies as the Chief Fire Officers’ Association and the F
output specifications for products that fire and rescue services will mutually recognise and use.
67

Facing the Future
being purchased, thus avoiding additional cost to both fire and rescue authorities and the supply chain of the fire sector.
Professional leadership 35. The Bain Review noted in 2002 that there was a need for clear
professional leadership in the sector, particularly at times of change, in policy discussions with central government; he felt that the CFire Officers’ Associat
hief ion could take on this role if it were able “to
speak with a collective voice”.51 This remains true today, and
ance
is
therefore I hope that the Association might consider how it can bestachieve this role. I hope that it might look again at its governarrangements to avoid the perception that the annual change of strategic leadership creates a potential lack of consistency and coherence. I believe that a greater consistency would permit the organisation to engage more fully with central government. It worthy of note that the Association of Chief Police Officers and the Association of Ambulance Chief Executives have three year appointments for the heads of their organisation.
Chapter Four: Key Findings
The major driver for change has been reduction in central government funding and the freeze in local council tax revenue. Fire and rescue authorities spend to their budgets, not to their risk. How to use funding to incentivise further change must be a key consideration for government.
Fire and rescue authority reserves increased from just well just over £200 million to more than £400 million in 2008-2012. These levels are well above the average for local authorities (including police). Prudent reserves should be held, but funding reductions were backloaded to enable authorities to invest in service transformation – reserves should be used to invest in spend-to-save projects.
Authority members need greater support and knowledge to be able to provide the strong leadership necessary to drive efficiency. Scrutiny of authorities and services varies considerably, some more robust than others. Elected members must ensure that local people understand their service and encourage an informed debate about change.
51 The Future of the Fire Service, paragraph 7.31, page 63.
68

Findings of the review into efficiency and operations of fire and rescue authorities in England
Greater sector leadership is needed to drive through a culture of learning from good practice and challenging services to rise to the level of the best.
69

Facing the Future
70
Chapter 5: What is the future for fire and rescue? This review has focused on how fire and rescue authorities can best achieve efficiency in today’s context, looking both at technical efficiencies to make the current system as efficient as possible and the potential for locally-driven broader allocative efficiencies. However evidence shows that there is little appetite locally for these latter efficiencies, despite the opportunity for more significant savings. I hope that readers do not fall into the trap of ‘adding up’ the various efficiency ideas in this review – they are inevitably broad-brush, designed to give a sense of the scale of opportunity. It is also important to note that this review is drafted part way through a government spending review period, with larger efficiencies to be driven out over the next two years. Whichever way I look at the efficiencies picture it seems to me that the scale of change needed to fully transform the fire and rescue service is unlikely to be achieved through individual local action alone. This final chapter, therefore, looks briefly at the future and potential changes to the context in which fire and rescue authorities will operate (section 5.1) and then puts forward for discussion a range of possible future operating models (section 5.2). I wish to make it clear, however, that fire and rescue authorities should not wait for any of these changes to be investigated before taking advantage of the large number of opportunities that are already within their grasp. Section 5.1: What might the future operating environment hold? Challenges and opportunities 1. I wonder if anyone a decade ago would have predicted the need for
fire and rescue services to attend 40 per cent fewer emergency incidents. Given how much the situation has changed over the last decade, it is likely that further significant change will occur in the next ten years and that these will present both challenges and opportunities.
5

Findings of the review into efficiency and operations of fire and rescue authorities in England
2. Some behaviours linked to fire risk, namely smoking and drinking, are decreasing,52 while
rescue authorities, given that people aged 65 or over account for over 50 per cent of all fire-
54
am-filled
en and cost, my view is
ems in terms of life safety, property protection and business
continuity. I understand that a very low proportion of domestic premium (some 10%) is fire related,
other trends like the aging population53 will have considerable implications for fire and
related deaths, 2005/6 to 2010/11. The whole picture indicates that fire and rescue authorities will need to continue their steps to target their prevention and protection work. Prevention will need to be ever higher on the agenda and this will need to be facilitated by better data-sharing across public services. I therefore welcome the work undertaken by the Chief Fire Officers’ Association to explore with the Department for Work and Pensions the feasibility of fire and rescue authorities accessing data for people of pensionable age to be better able to serve this community.
Technology 3. Technology and innovation has been a key driver to reduced risk,
increased efficiency and better outcomes, particularly in the field of fire safety. We have witnessed this from flame retardant fofurniture and the increased number of smoke alarms. Technology moves ever forward; the introduction of ‘fire-safer’ cigarettes from November 2011, which self-extinguish if left alone, is already reducing the number of smoking-related accidental fire deaths.
4. Contrast this with the issue of sprinklers; rather than committing a
disproportionate amount of timer and resources to lobbying theGovernment for more regulation; adding burdthat industry needs to make its own case to owners and occupiers (including property developers), of the benefits of fire suppressionsyst
property protection insurancenevertheless I believe that the insurance industry has a part to play in enhancing protection through sprinkler systems. Moreover I
52 http://www.ons.gov.uk/ons/rel/ghs/general-lifestyle-survey/2011/index.html 53 http://www.ons.gov.uk/ons/rel/npp/national-population-projections/2010-based-projections/index.html
Fire Statistics Great Britain, Table54 1.3 https://www.gov.uk/government/organisations/department-for-communities-and-local-government/series/fire-statistics-great-britain
Prevention needs
to be facilitated by better data-
oss services,
d help
most at of fire
sharing acrpublic
so fire anrescue can
those risk
71

Facing the Future
believe that there is a clear place for suppressprinklers, in targeted areas and I commend thauthorities that have pursued projects, oftento install such systems in premises to protecmay well lead to the suppression industry makwidely.
5. It is important that there is a continuous inve
solutions to reduce further fire injuries and deawhich is the proposed stove/cooker heat alapower shut-off switch. When more than 50 perfires in the home are cooking-related, this innoparticularly valuable for the most vulnerable asafety technology reduces fire deaths and infire and rescue authorities will be to keep pacereduced demand, and make sure that their stlevels are appropriate.
sion ystems, such as os escue
with the private sector, t at ri
ing
stment iths, a
rm, connecte centvation m
nd elderly. Ajuries, the challenge for
with this hopefully affing and response
se fire and r
sk groups. This the case more
n technological n example of
d to a of accidental
ay prove s such fire
CASE STUDY: Using sprinklers in high-risk homes
An urban combined authority is pioneering low cost installation of sprinklers in a small number of high-risk domestic buildings. The system costs around £2,500 per household plus installation costs of £800; an Accidental Dwelling Fire costs on average £25,000.
6. Little has changed in firefighting technology and techniques over a
number of years. New technological solutions may assist firefitechniques in modern buildings and increase the safety of firefigh
ghting
ters and improve the detrimental environmental effect of traditional
very
of n and
f
and agreed evaluation data.
ith the fire
firefighting methods. During my review I heard about enhanced thermal imaging, high pressure firefighting and water cutting delisystems, steam firefighting and the use of aggressive positive pressure ventilation. It is not for me to say how successful these might be, or to speculate about the more effective and safer firefighting and rescue environments they might create. A culture working in partnership with the fire industry to support innovatioevaluation is to be encouraged whilst avoiding falling into the trap oeach potential fire and rescue service reinventing each new innovation as their own by sharing agreed output specifications
7. So the issue is in how fire and rescue authorities work w
industry to research, develop and implement these sorts of systems.
72

Findings of the review into efficiency and operations of fire and rescue authorities in England
The Fire Sector Federation, the sector-wide group formed as a resulof the Government’s Fire Futures work, seems well-placed to take technological advancement forward in partnership. It has been put tome that central government should lead and provide new funding research, but I am not convinced that this is the right way forwardthe same
t
for . In
way as procurement, fire and rescue authorities need to pool their resources and invest where they see fit. A national body, of some sort, sitting outside the sector overseeing research would likely go the way of other national bodies in the fire sector. If new technologies can be shown to achieve a return on investment, through improved safety, outcomes and efficiencies, I would think that any future bidding rounds for capital funding should look favourably on bids, particularly joint bids, to invest in them.
Section 5.2: Possible future operating models 8. Fire and rescue authorities in England have a lot of freedom to
manage their own affairs; however, I have heard localism used to and innovation
rvices
and rescue being within the remit of local government, this has resulted in five different
t and
r
t efficiency in the funding formula (see
justify siloism, with some authorities rejecting ideas from outside the local area or from other agencies, meaning sehave developed at different speeds. Local politics can also get in the way of making difficult changes that would drive efficiencies, with some preferring to keep the status quo, or tinker around the edges. Successive governments have fully supported fire
authority governance models. 9. I believe there are a number of larger-scale options to release
greater efficiencies that would need to be driven by governmennational leaders in the sector, including:
moving towards a more national model, through enforced
mergers to reduce the number of fire and rescue authorities opotentially a full merger in the style of Scotland;
further embedding fire and rescue in local authorities, removing stand-alone fire and rescue authorities and ensuring that funding for fire and rescue services is contested locally alongside other local priorities;
finding a way to reflecSection 4.1);
allowing fire and rescue authorities to procure their fire and rescue service from a mutual company (see Section 4.1);
73

Facing the Future
following international example and privatising the provision of fire and rescue services;
merging fire and rescue services with one or more of the other blue-light services, improving interoperability;
sharing governance structures with other blue-light services, such as Police and Crime Commissioners taking on the role of fire and rescue authority; and / or,
improving join up at a government level between sponsors of thblue-light services and other departments that hold an interest in activity related to fire and rescue work.
10. These are clearly broad-brush options, many of which would
e
i olve upheaval in fire and rescue authorities and potentially in other blue-
to provide financial
nv
light services. But the gains could be considerable. 11. Scotland has shown one way forward, creating a single fire and
rescue service, removing the complexity of multiple governance models and the duplication of support services and leadership, withadditional benefits expected in interoperability across areas. Some have suggested that my review should suggest an optimum size for a fire and rescue service, with the knock-on impact of identifying the ‘right’ number of fire and rescue services in England. But the evidence does not suggest an optimum size.
12. Scotland has estimated that, allowing for the
sale of surplus assets, a one-off transition cost of around £25 million will enable them to deliver cumulative efficiency savings of £293 million over a fifteen year period.55 It would be interesting to see similar modelling for a single English fire and rescue service – my feeling is that it would require much more in upfront costs and that it would take many years to achieve. Where fire and rescue authorities can provide business cases for local merger, showing clear, achievable efficiencies, I do think central government should step forwardsupport for transition.
55 Reform of the Fire and Rescue Service in Scotland - Outline Business Case, September 2011, http://scotland.gov.uk/Publications/2011/09/15153130/9
a single fire and
ver
n s
Scotland estimate that moving to
rescue service will delicumulative
efficiency savings of £293 millio
over fifteen year
74

Findings of the review into efficiency and operations of fire and rescue authorities in England
13. The current fire and rescue authority governance configuration is certainly complex and piecemeal, and although a recent proposal for
vative, it would
uld
aboration between the fire and rescue services and other public services
e of en
to be further embedded into local authorities, who already hold responsibilities for
be le to ensure a are currently inspected
k oe on
ch ban help prior
made a d the authorit
diverse wg from co
ugh PCCs and mutuals, of a national structure to
assurance of the service. Despite carrying a responsibility for those vulnerable in society and the public expectation for a seamless, resilient national response to
the Police and Crime Commissioners to also take the responsibilityfor the fire and rescue services in their area is innocomplicate the current fire authority landscape. Nonetheless I wowelcome such a model being trialled not least to examine the rangeof opportunities that such closer integration between the two services might bring. However, subject to the outcome of the pilot, to become most effective and efficient this model would need to be adopted universally, with clearly set out benefits, both financially and accountability and scrutiny for the public.
14. I do not think that the strategic question of the number of fire and
rescue authorities in England can be considered in isolation. An as yet insufficiently exploited area for efficiency is in coll
providing similar services and I believe that this is key to the futurfire and rescue. I have previously highlighted the synergies betweUrban Search and Rescue and Hazardous Area Response Teams (section 3.2), but there are opportunities more widely to merge response functions with other blue-light services that demand to be explored.
15. There is also potential for non-response activity
other aspects of community safety and wouldseamless service both for businesses whichand audited by different teams, and those at risengaging with other services. It really struck mcounty council Chief Fire Officer sits within a muthan his counterparts and that structure crescue activity – in one area, the council hadprotect fire prevention work because it helpedthe elderly to stay in their own homes.
16. Fire and rescue in England is delivered in a
drive for financial efficiencies often comindisparate governance models emerge, throit's timely to ask whether there is enoughprovide oversight and
ab
f fire who are also my visits that a
igger structure itise fire and ecision to
y to enable
ay and the llaboration. As
emergencies, the fire and rescue service is out of step with other
75

Facing the Future
agencies by not having an independent inspectorate. As public bodies, fire and rescue authorities are financially audited, but an inspectorate would look more widely at the operational performance and effectiveness of the service.
17. These are clearly challenging times for the fire and rescue service,
as they are for all public services. While reform and efficiencypatchy, services are heading in the right direction. My only concern is the pace of change – I hope that services can redouble their efforand come together to tackle change head-on.
is
ts
Chapter Five: Key Findings
Where fire and rescue authorities can provide business cases for local merger, showing clear, achievable efficiencies, central government should step forward to provide financial support for transition.
The potential savings identified in this review are unlikely to be sufficient for some fire and rescue authorities to be able to live within their reducing budgets.
The scale of change needed to fully transform the fire and rescue service is unlikely to be achieved through local action alone. But authorities should not wait for national action before fully exploiting the large number of opportunities already within their grasp.
National level changes to enable greater collaboration with other blue-light services, including through shared governance, co-working and co-location, would unlock further savings.
76

Findings of the review into efficiency and operations of fire and rescue authorities in England
Appendix A1. Basic statistics about the provision of fire and rescue services in England (DCLG Annual Returns, CIPFA, ONS) There are 46 fire and rescue authorities in England. As at 31 March 2012, there were 1422 fire stations, of which 661 are wholetime and 761 are on-call.
42,062 firefighters, of which 28,245 are wholetime, and 13,817 are
on-call. 1,442 fire control staff, and 8,567 support staff.
2,026 fire engines, and 147 aerial appliances.
A2. Governance models of fire and rescue authorities in Englan
Local Authority Membership Scrutiny Funding route
d
County (11)
Fire and rescue services are part of the County Council.
Council members is portfolio holder for fire and rescue.
One of the County
Unitary (4)
Fire and rescue services are part of the Unitary authority.
Various, set out in legislation.
Yes – scrutiny requirement set in statute.
but not cleaidentified anfenced, cothe budget ofand rescue ssepa
Funding to the county rly d not ring-
uncil sets the fire ervice. No
rate fire precept.
Combined
A stand-alone authority covering pre-1992 county council areas, including a combination of
Maximum 25 elected members nominated from (24 residual county
councils, district councils and unitary authorities.
constituent authorities.
)
Metropolitan (6)
A stand-alone authority covering the area a number of Unitary Authorities within the Metropolitan Counties set out in 1974.
Membership is set out in Local Government Act 1985, which specifies numbers from each constituent council.
Funding direct from central government, plus precept across constituent authorities.
LFEPA (1)
A stand-alone authority including emergency planning, covering 31 London Boroughs plus City Corporation.
17 elected representatives plus 2 Mayoral appointees.
No statutory requirement for scrutiny.
Separately identified, but funding to the Greater London Assembly is non-ring fenced. The GLA then set the budget requirement for LFEPA. No separate fire precept.
77

Facing the Future
A3. Fire and redfordshire fire and re
escue authorities visited as part of this review scue authority
evon and Somerset fire and rescue authority
ty
ire and rescue authority
4. Meetings with representative bodies held as part of this review ssociation of Ambulance Chief Executives (AACE)
ire Officer (FOA)Fire and R Asso )Fire Secto SF)
Gov etained F on (RF
5. Other v t of this review Buckinghamshire and Milton Keynes fire and rescue authority Cheshire f ority Derbyshire uth
fire oritymergenc search f Nottingham Trent
Univer gham UGlouceste ue authority Kent fire and rescue authority Norfolk fire authorityNottingham ue
e auurrey fire y
Tyne and cue West Midlands fire and rescue aWest Midlands Branch of the Emergency Planning Society Submissio eived viduals.
BCleveland fire and rescue authority Cornwall fire and rescue authority
umbria fire and rescue authority CDEssex fire and rescue authority
reater Manchester fire and rescue authority GHampshire fire and rescue authori
umH berside fire and rescue authority ondon fire and emergency planning authority L
Merseyside fire and rescue authority Oxfordshire fire and rescue authority
hropshire fSSuffolk fire and rescue authority
est Yorkshire fire and rescue authority W AAChief Fire Officers’ Association (CFOA) Fire Brigades Union (FBU) F s’ Association
escue Suppliers ciation (FIRESA
(LGA) U)
r Federation (Fernment Associationirefighters Uni
LocalR
A submissions recei ed as par
ire and rescue auth fire and rescue a and rescue authy Services Resity and Nottinrshire fire and resc
ority Programme oniversity
Dorset E
and rescue shire fire and resc
ire fire and rescu and rescue authoritWear fire and res
authority thority authority uthority
StaffordshS
ns were also rec from indi
78

Findings of the review into efficiency and operations of fire and rescue authorities in England
A6. Terms of Reference To review the ways in which fire and rescue authorities may deliver
improvements without reducing the ublic. The review will examine
current Spending Review
Collaboration with
ng of senior staff
y led mergers and operational collaborations
Preventative
h local businesses
rganisations in the fire sector, including the Local Government Association, the Chief Fire
Sector s who
isits to a representative range of cluding those covering urban and
d
ith analytical support, in les of efficiencies from outside of the
ngs of previous reviews and ding the 2002 Independent
mission’s llenge; the
pendent Review of ons (the Winsor
further efficiencies and operationalquality of front-line services to the poptions for savings both within and beyond the period, including through:
Firefighter training
Flexible staffing and crewing arrangements Locall
The use of Retained Firefighters
Procurement
Shared services New fire-fighting
technology
emergency services and approaches other organisations on Working witservice delivery and estates
Sickness management
Shari
In conducting this review:
Sir Ken Knight will talk to key o
Officers’ Association, the Fire Brigades Union, the FireFederation, individual fire and rescue authorities and otherSir Ken deems relevant;
Sir Ken will undertake up to 10 vfire and rescue authorities, inrural areas, and those constituted as metropolitan, county ancombined authorities;
The Department will provide Sir Ken wparticular in looking at exampfire sector.
The review will take into account the findiureports and their recommendations, incl
Review of the Fire Service (the Bain Report); the Audit Com2008 Community Safety National Report, Rising to the Cha2010 Fire Futures review; and the 2011/2012 IndePolice Officer and Staff Remuneration and ConditiReports).
79