Embed Size (px)
Citation preview
Site Visit to Sishen Mine14 April 2010
2
Agenda
Overview of Kumba Iron Ore
Iron Ore market outlook
Kumba’s Growth pipeline
Q&A
3
Overview of Kumba Iron Ore
4
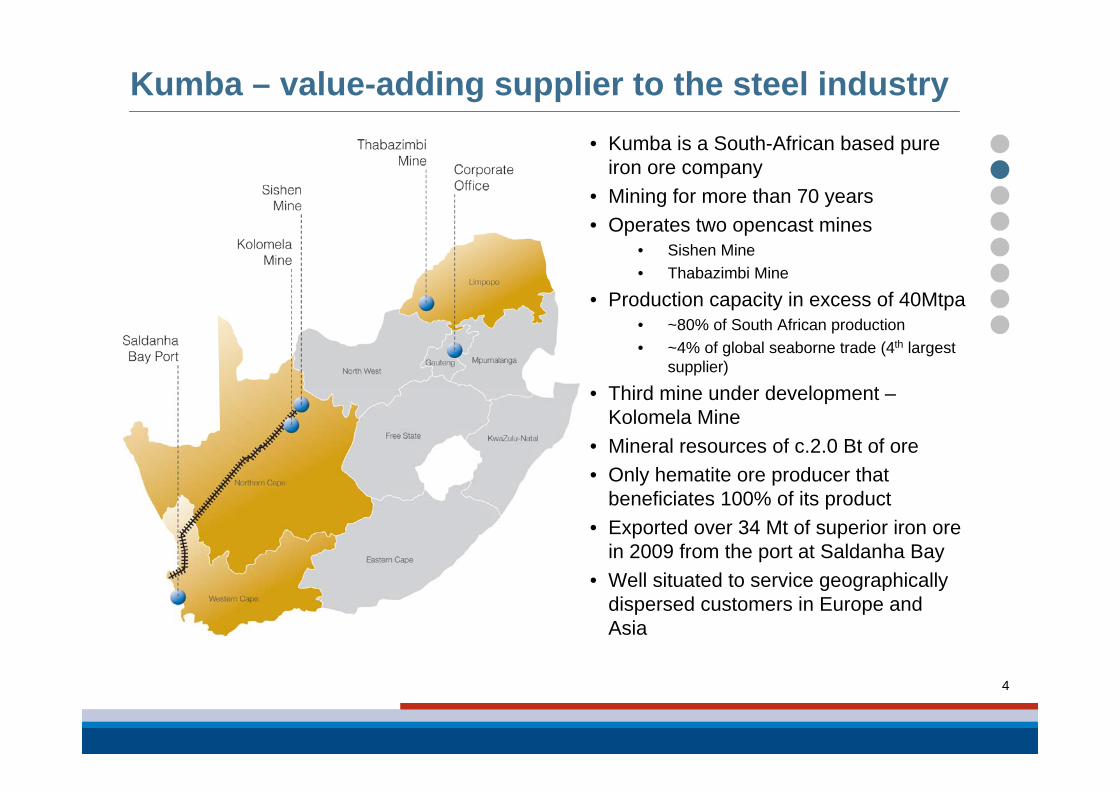
• Kumba is a South-African based pure iron ore company
• Mining for more than 70 years• Operates two opencast mines
• Sishen Mine • Thabazimbi Mine
• Production capacity in excess of 40Mtpa • ~80% of South African production• ~4% of global seaborne trade (4th largest
supplier)
• Third mine under development –Kolomela Mine
• Mineral resources of c.2.0 Bt of ore• Only hematite ore producer that
beneficiates 100% of its product• Exported over 34 Mt of superior iron ore
in 2009 from the port at Saldanha Bay• Well situated to service geographically
dispersed customers in Europe and Asia
Kumba – value-adding supplier to the steel industry
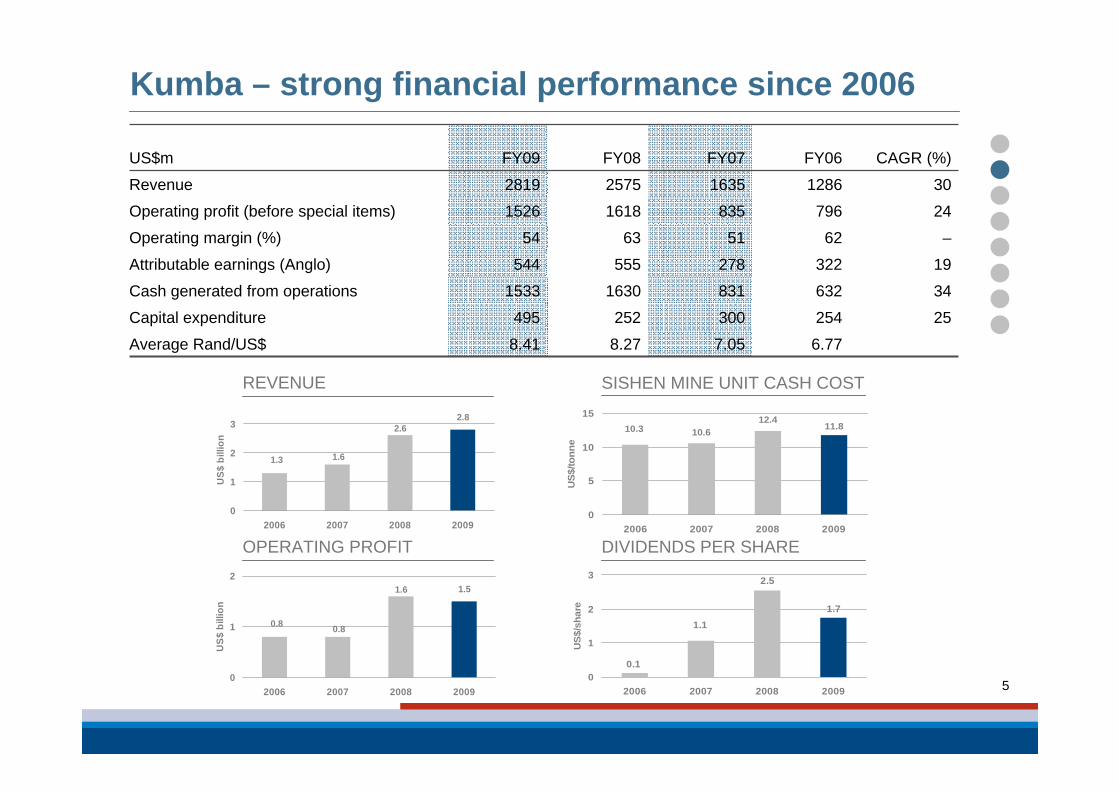
2.8
1.61.3
2.6
0
1
2
3
2006 2007 2008 2009
US$
bill
ion
1.71.1
0.1
2.5
0
1
2
3
2006 2007 2008 2009
US$
/sha
re1.5
0.80.8
1.6
0
1
2
2006 2007 2008 2009
US$
bill
ion
5
Kumba – strong financial performance since 2006
OPERATING PROFIT
11.812.4
10.3 10.6
0
5
10
15
2006 2007 2008 2009
US$
/tonn
e
SISHEN MINE UNIT CASH COST
DIVIDENDS PER SHARE
REVENUE
6.777.058.278.41Average Rand/US$
254
632
322
62
796
1286
FY06
25300252495Capital expenditure
3483116301533Cash generated from operations
US$m FY09 FY08 FY07 CAGR (%)
Revenue 2819 2575 1635 30
Operating profit (before special items) 1526 1618 835 24
Operating margin (%) 54 63 51 –
Attributable earnings (Anglo) 544 555 278 19
6
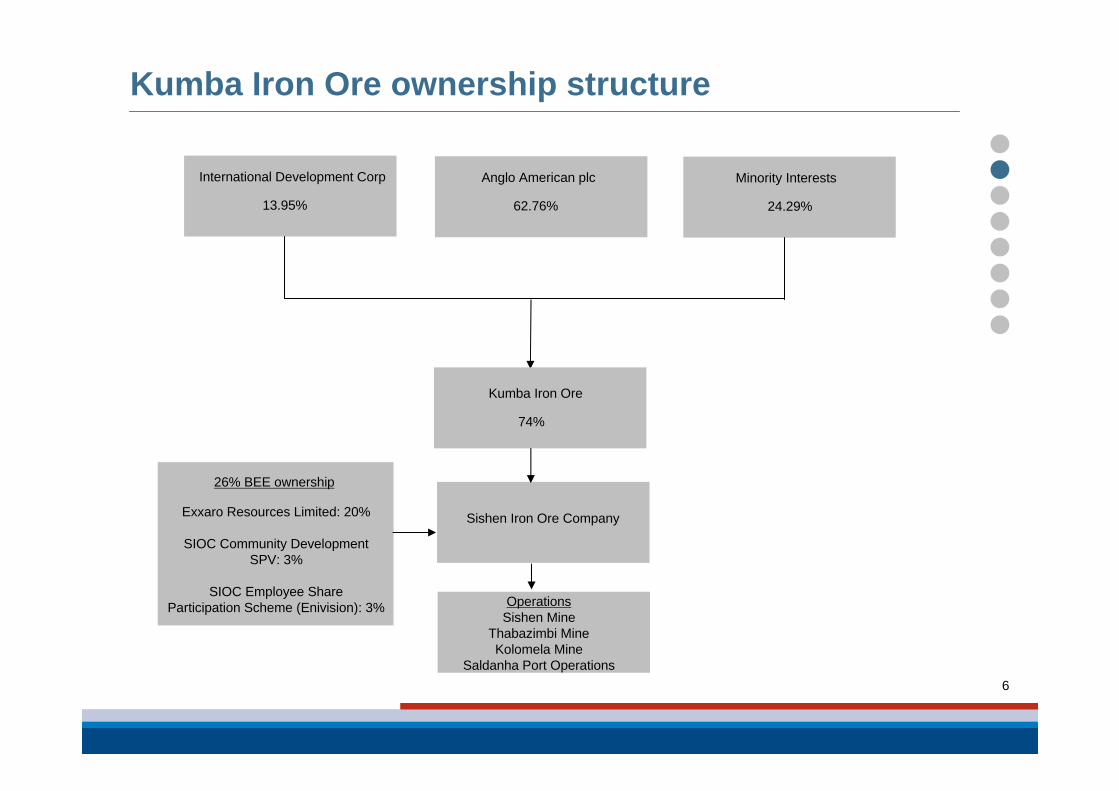
Kumba Iron Ore ownership structure
Anglo American plc
62.76%
International Development Corp
13.95%
Minority Interests
24.29%
Kumba Iron Ore
74%
Sishen Iron Ore Company
OperationsSishen Mine
Thabazimbi MineKolomela Mine
Saldanha Port Operations
26% BEE ownership
Exxaro Resources Limited: 20%
SIOC Community DevelopmentSPV: 3%
SIOC Employee ShareParticipation Scheme (Enivision): 3%
0
2500
5000
7500
10000
2006 2007 2008 2009
US$
mill
ion
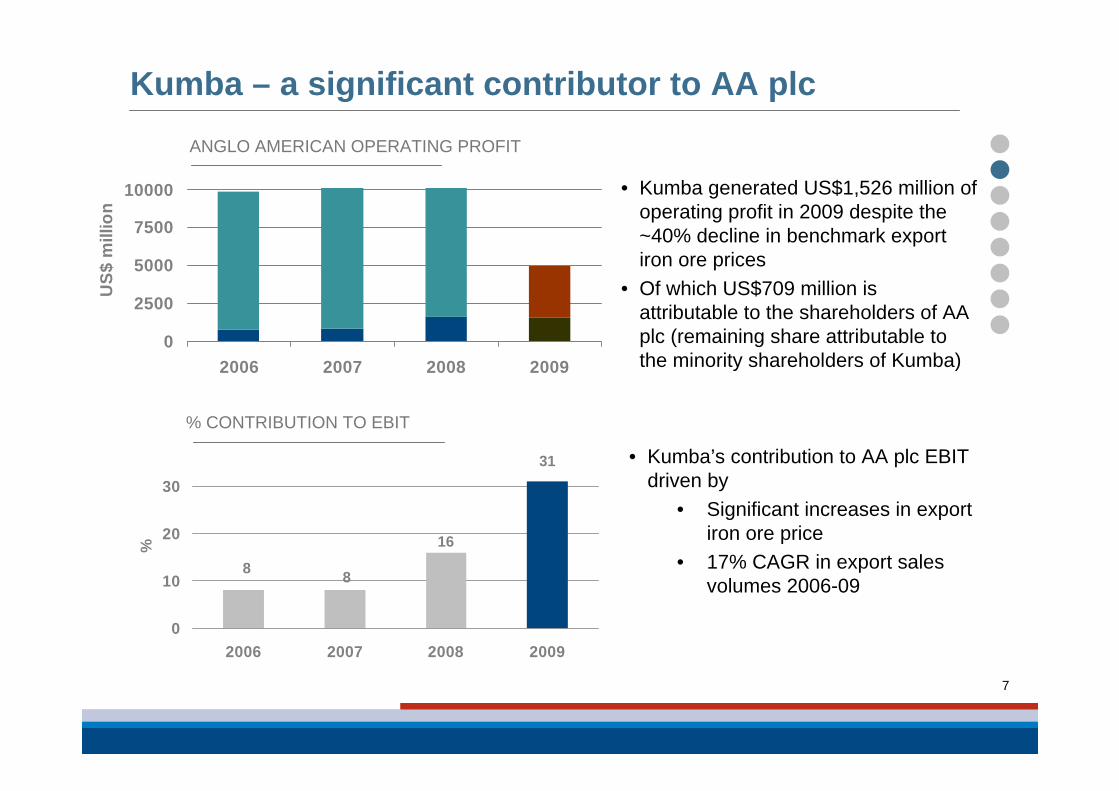
31
88
16
0
10
20
30
2006 2007 2008 2009
%
7
Kumba – a significant contributor to AA plc
% CONTRIBUTION TO EBIT
ANGLO AMERICAN OPERATING PROFIT
• Kumba’s contribution to AA plc EBIT driven by
• Significant increases in export iron ore price
• 17% CAGR in export sales volumes 2006-09
• Kumba generated US$1,526 million of operating profit in 2009 despite the ~40% decline in benchmark export iron ore prices
• Of which US$709 million is attributable to the shareholders of AA plc (remaining share attributable to the minority shareholders of Kumba)
8
Safety
9
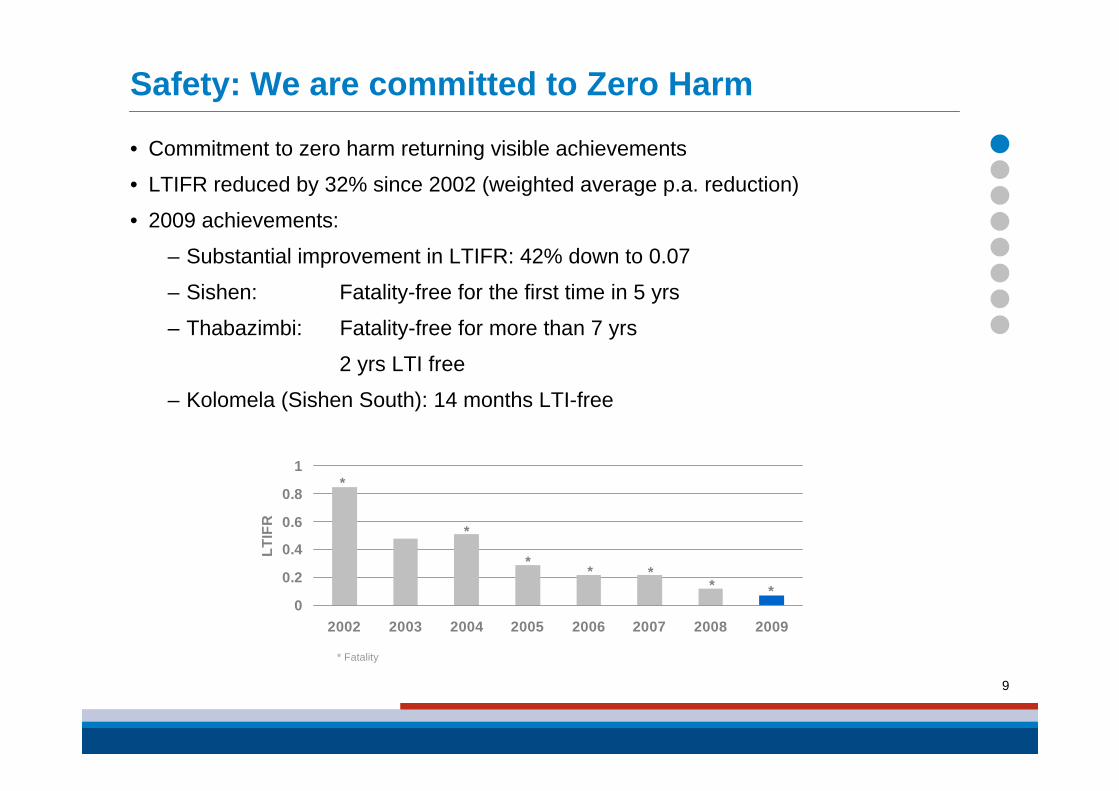
Safety: We are committed to Zero Harm
• Commitment to zero harm returning visible achievements
• LTIFR reduced by 32% since 2002 (weighted average p.a. reduction)
• 2009 achievements:
– Substantial improvement in LTIFR: 42% down to 0.07
– Sishen: Fatality-free for the first time in 5 yrs
– Thabazimbi: Fatality-free for more than 7 yrs
2 yrs LTI free
– Kolomela (Sishen South): 14 months LTI-free
*****
*
*
0
0.2
0.4
0.6
0.8
1
2002 2003 2004 2005 2006 2007 2008 2009
LTIF
R
* Fatality
10
Kumba’s operations
11
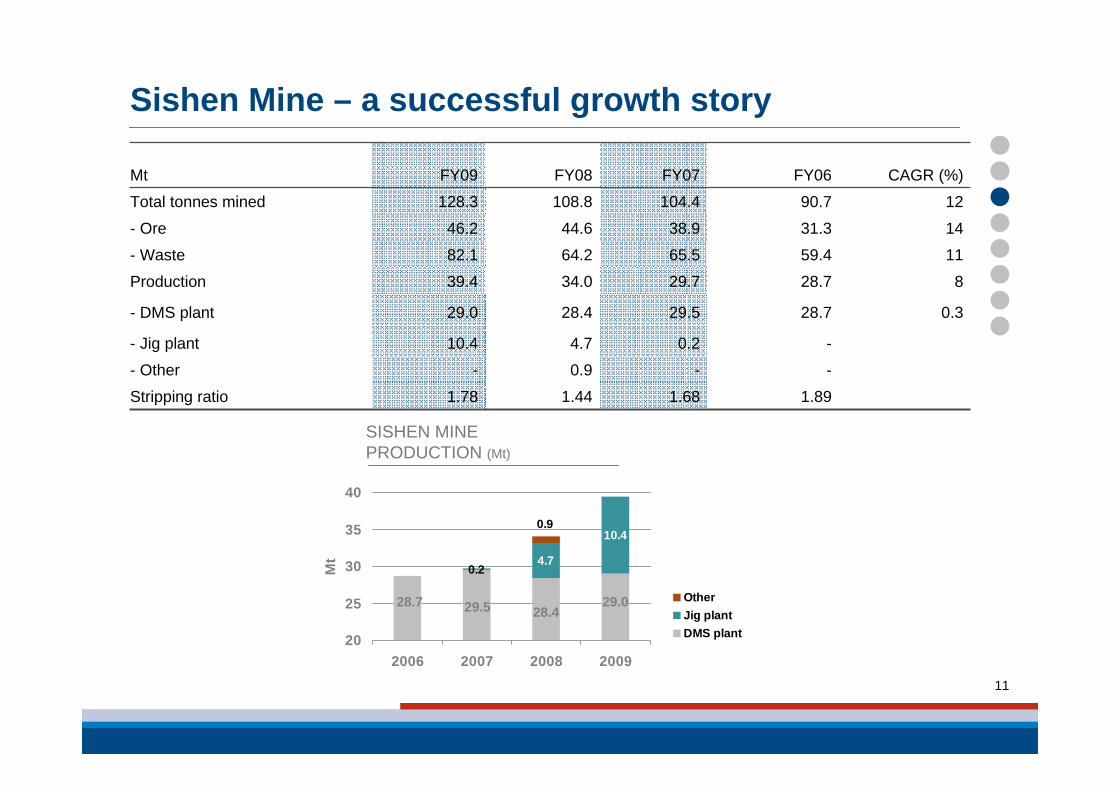
Sishen Mine – a successful growth story
--0.9-- Other
0.328.729.528.429.0- DMS plant
1.89
-
28.7
59.4
31.3
90.7
FY06
1.681.441.78Stripping ratio
0.24.710.4- Jig plant
Mt FY09 FY08 FY07 CAGR (%)
Total tonnes mined 128.3 108.8 104.4 12
- Ore 46.2 44.6 38.9 14
- Waste 82.1 64.2 65.5 11
Production 39.4 34.0 29.7 8
0.2
29.029.528.728.4
4.7
10.40.9
20
25
30
35
40
2006 2007 2008 2009
Mt
OtherJig plantDMS plant
SISHEN MINE PRODUCTION (Mt)

12
Sishen Mine – export sales 17% CAGR 2006-9
1227.430.530.538.2Total sales
1721.524.024.934.2- Export
5.9
24.3
FY06
(12)6.55.64.0- Domestic
Mt FY09 FY08 FY07 CAGR (%)
Railed to port 34.6 27.8 24.6 13
34.2
24.021.5
24.9
20
25
30
35
2006 2007 2008 2009
Mt
EXPORT SALES (Mt)
13
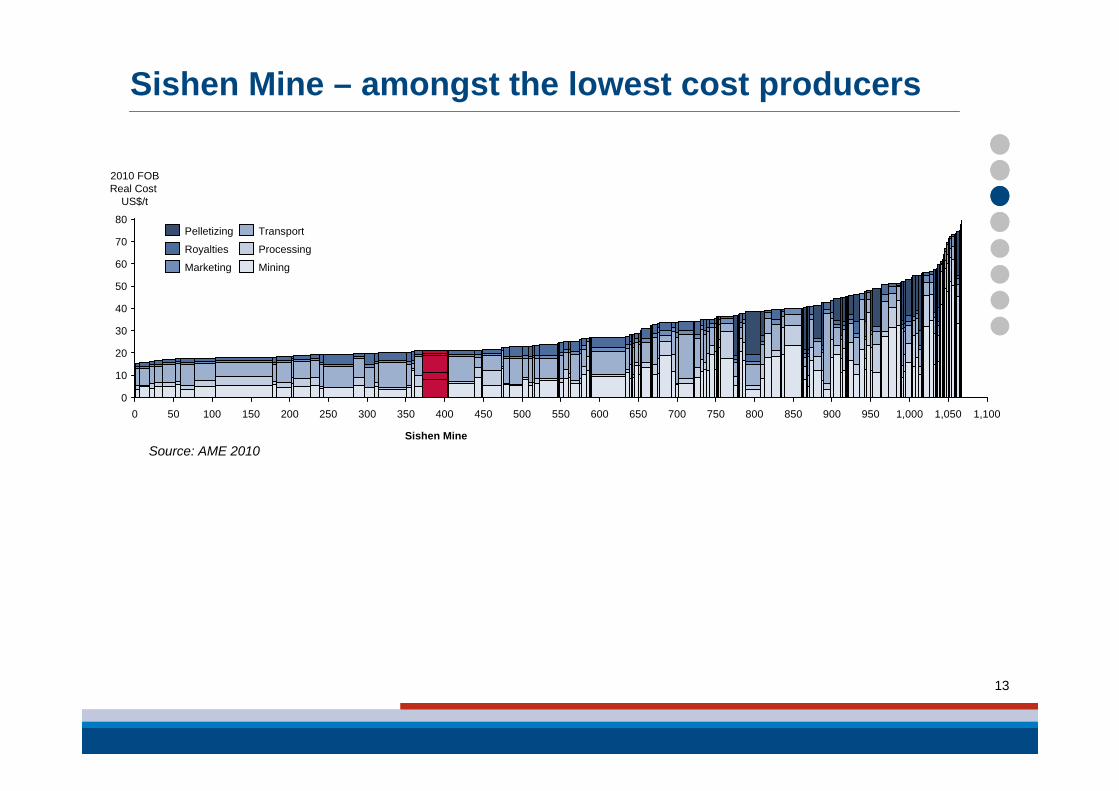
Sishen Mine – amongst the lowest cost producers
Source: AME 2010
Transport
Marketing
Royalties
Pelletizing
Mining
Processing
500400300200
80
1000 9000
350
20
250
40
1,000150
60
50
2010 FOBReal Cost
US$/t
800700600
Sishen Mine
450 550 650 850 950 1,050
10
30
50
70
1,100750
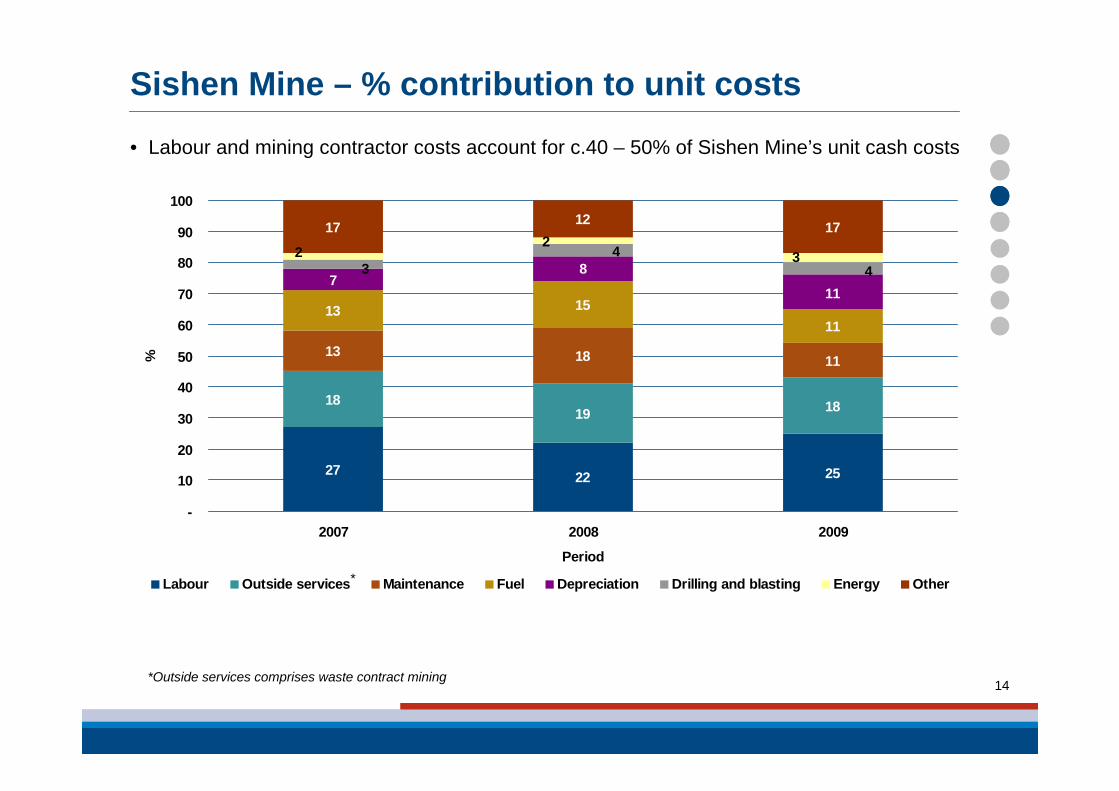
• Labour and mining contractor costs account for c.40 – 50% of Sishen Mine’s unit cash costs
14
Sishen Mine – % contribution to unit costs
27 22 25
1819 18
13 18 11
13 1511
17 12 17
11
87 4
43
32
2
-
10
20
30
40
50
60
70
80
90
100
2007 2008 2009
Period
%
Labour Outside services Maintenance Fuel Depreciation Drilling and blasting Energy Other*
*Outside services comprises waste contract mining
15
70
75
80
85
90
95
100
60% 62% 64% 66% 68% 70%
BrazilAustraliaAfricaIndiaCanada
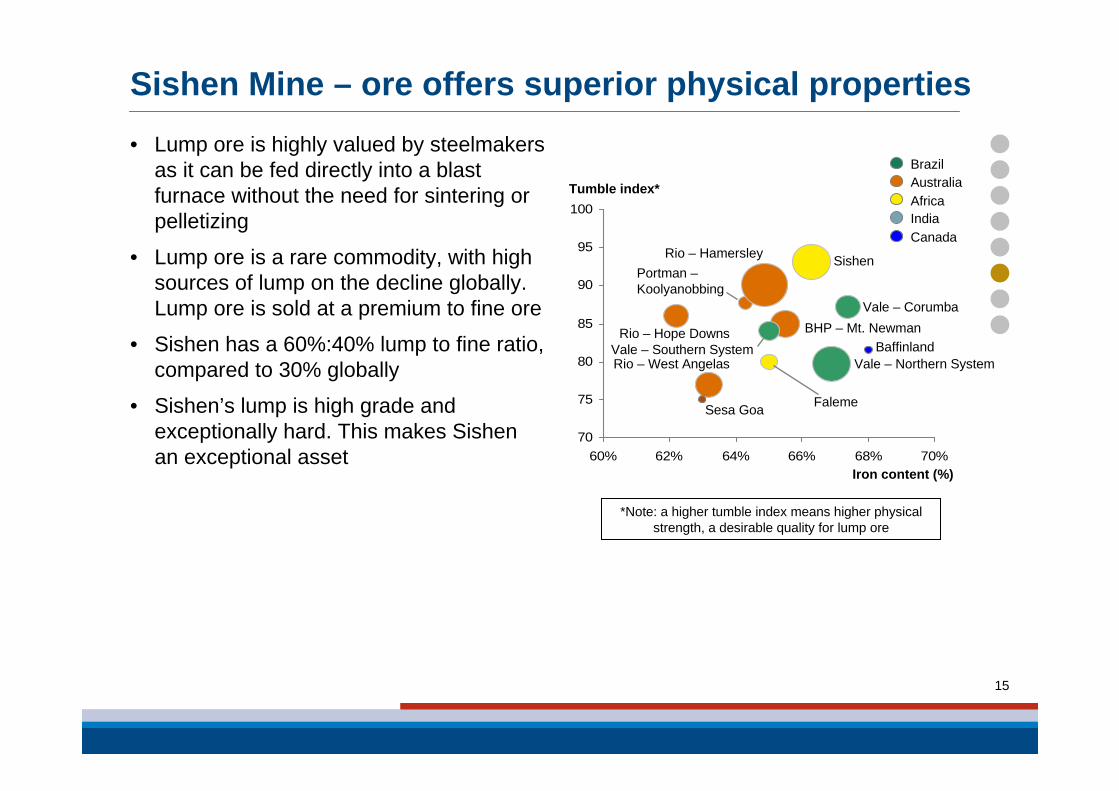
Tumble index*
Iron content (%)
Sishen
Faleme
Vale – Corumba
Vale – Northern SystemVale – Southern System
Rio – Hamersley
BHP – Mt. Newman
Rio – West Angelas
Portman –Koolyanobbing
Rio – Hope Downs
Sesa Goa
Baffinland
*Note: a higher tumble index means higher physical strength, a desirable quality for lump ore
• Lump ore is highly valued by steelmakers as it can be fed directly into a blast furnace without the need for sintering or pelletizing
• Lump ore is a rare commodity, with high sources of lump on the decline globally. Lump ore is sold at a premium to fine ore
• Sishen has a 60%:40% lump to fine ratio, compared to 30% globally
• Sishen’s lump is high grade and exceptionally hard. This makes Sishen an exceptional asset
Sishen Mine – ore offers superior physical properties
16
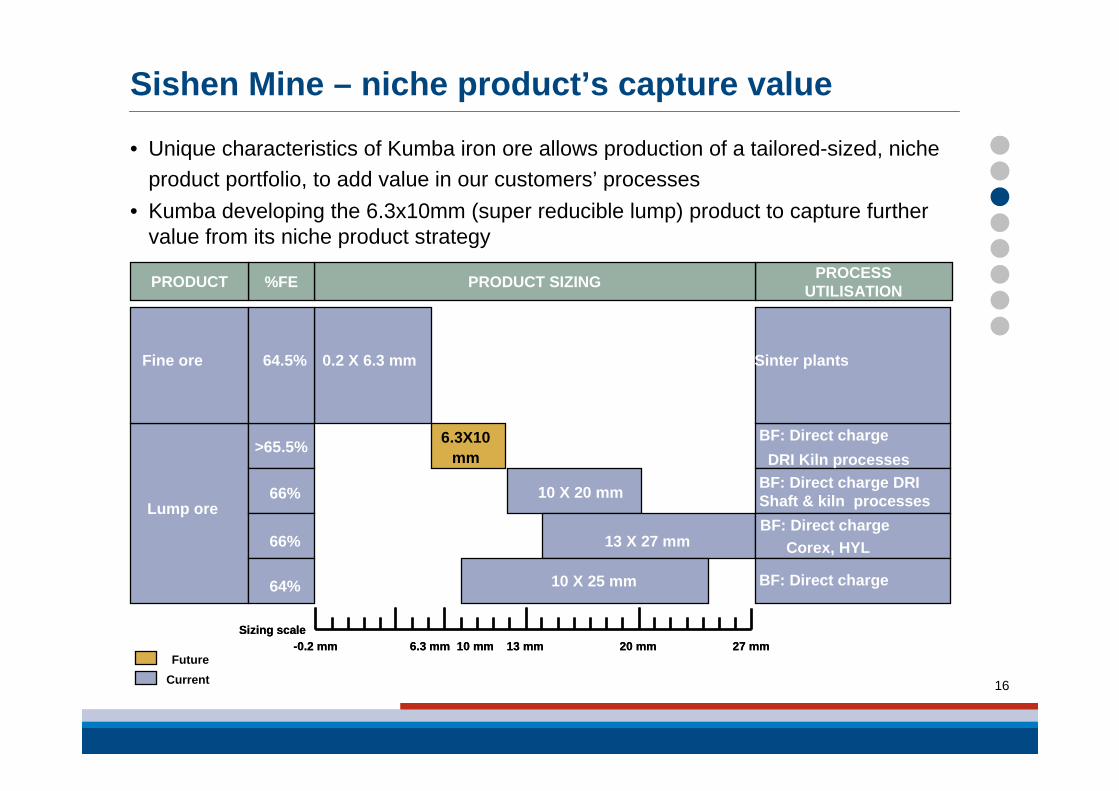
Sishen Mine – niche product’s capture value
• Unique characteristics of Kumba iron ore allows production of a tailored-sized, niche product portfolio, to add value in our customers’ processes
• Kumba developing the 6.3x10mm (super reducible lump) product to capture further value from its niche product strategy
-0.2 mm 20 mm6.3 mm 13 mm10 mm 27 mmSizing scale
-0.2 mm 20 mm6.3 mm 13 mm10 mm 27 mmSizing scale
PROCESS UTILISATIONPRODUCT SIZING%FEPRODUCT
Lump ore
>65.5% 6.3X10mm
10 X 20 mm66%
66%
64%
BF: Direct chargeDRI Kiln processes
BF: Direct charge DRI Shaft & kiln processesBF: Direct charge
Corex, HYL
BF: Direct charge
Fine ore 64.5% 0.2 X 6.3 mm Sinter plants
13 X 27 mm
10 X 25 mm
FutureCurrent
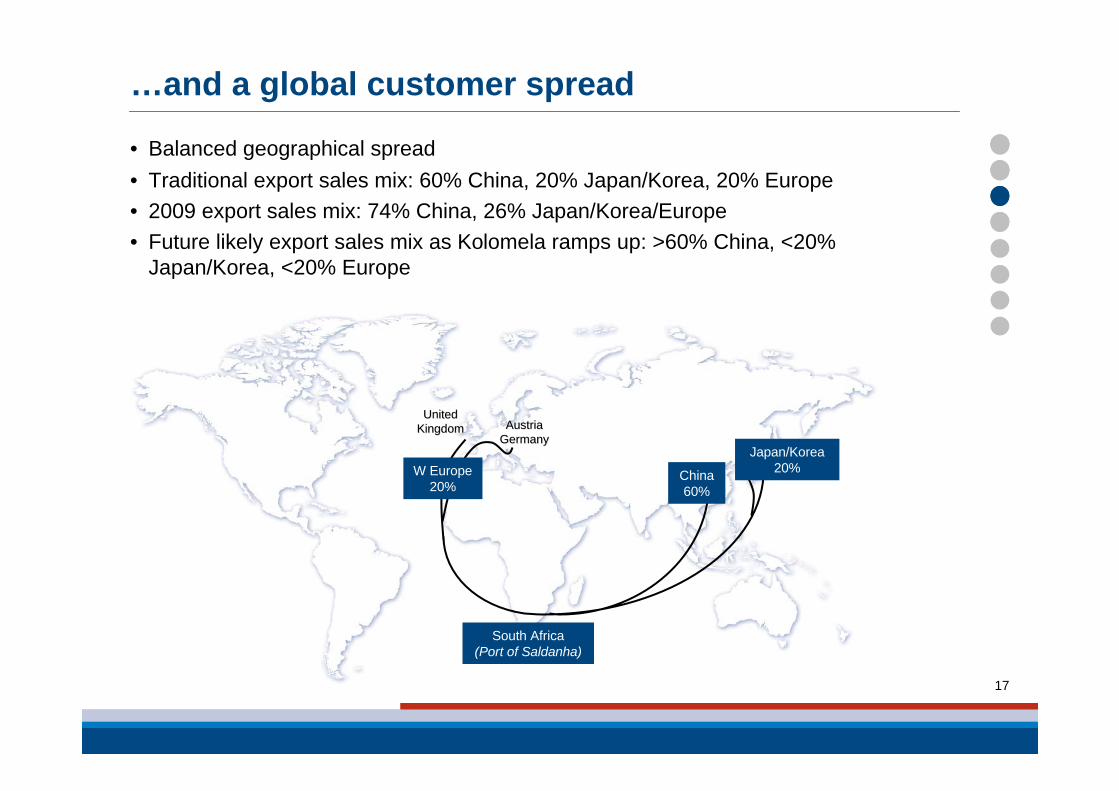
• Balanced geographical spread• Traditional export sales mix: 60% China, 20% Japan/Korea, 20% Europe• 2009 export sales mix: 74% China, 26% Japan/Korea/Europe• Future likely export sales mix as Kolomela ramps up: >60% China, <20%
Japan/Korea, <20% Europe
17
…and a global customer spread
United United KingdomKingdom AustriaAustria
GermanyGermanyJapan/Korea
20%China60%
W Europe20%
South Africa (Port of Saldanha)
18
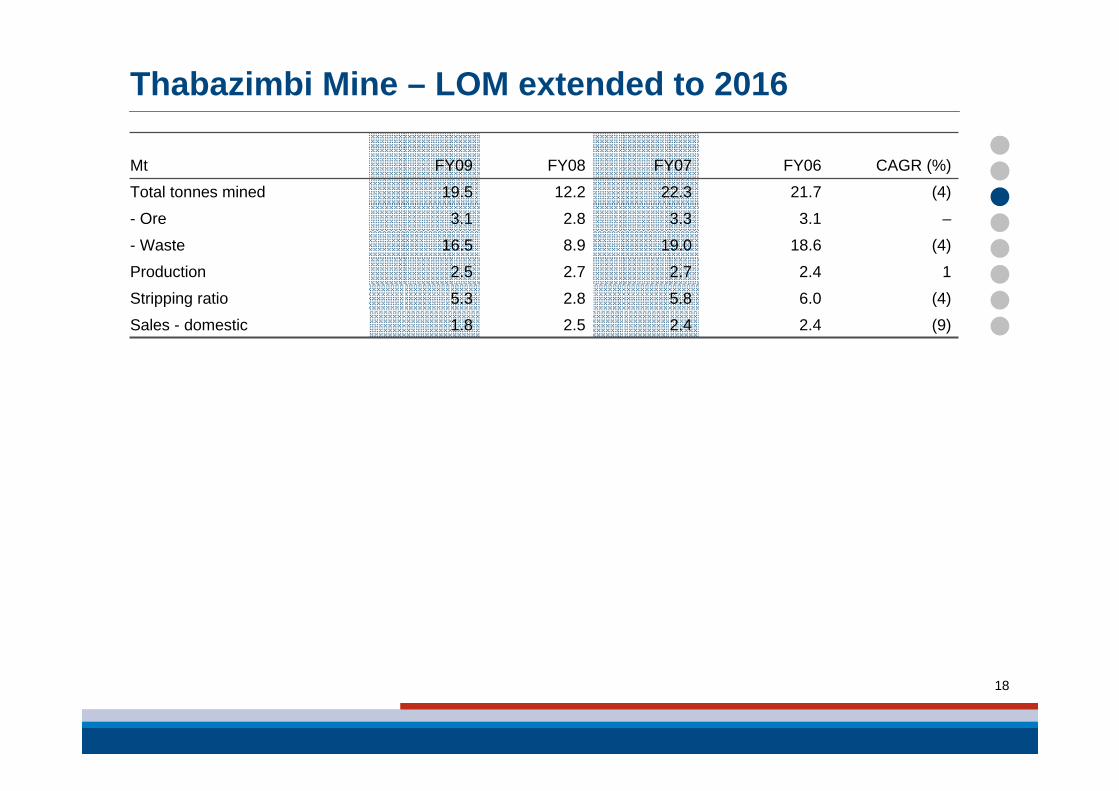
Thabazimbi Mine – LOM extended to 2016
(4)6.05.82.85.3Stripping ratio
2.4
2.4
18.6
3.1
21.7
FY06
(9)2.42.51.8Sales - domestic
Mt FY09 FY08 FY07 CAGR (%)
Total tonnes mined 19.5 12.2 22.3 (4)
- Ore 3.1 2.8 3.3 –
- Waste 16.5 8.9 19.0 (4)
Production 2.5 2.7 2.7 1
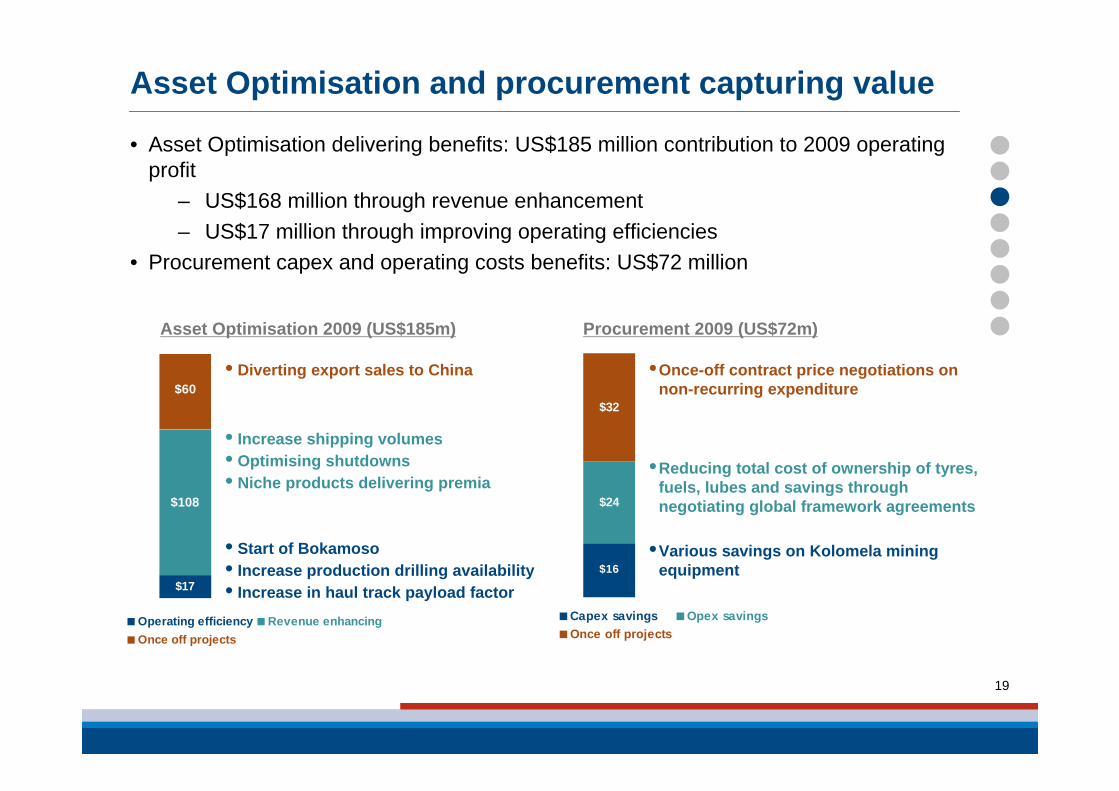
$24
$16
$32
Capex savings Opex savingsOnce off projects
19
Asset Optimisation and procurement capturing value
• Asset Optimisation delivering benefits: US$185 million contribution to 2009 operating profit
– US$168 million through revenue enhancement– US$17 million through improving operating efficiencies
• Procurement capex and operating costs benefits: US$72 million
$108
$17
$60
Operating efficiency Revenue enhancingOnce off projects
Asset Optimisation 2009 (US$185m) Procurement 2009 (US$72m)
• Increase shipping volumes• Optimising shutdowns• Niche products delivering premia
• Start of Bokamoso• Increase production drilling availability• Increase in haul track payload factor
• Diverting export sales to China •Once-off contract price negotiations on non-recurring expenditure
•Reducing total cost of ownership of tyres, fuels, lubes and savings through negotiating global framework agreements
•Various savings on Kolomela mining equipment
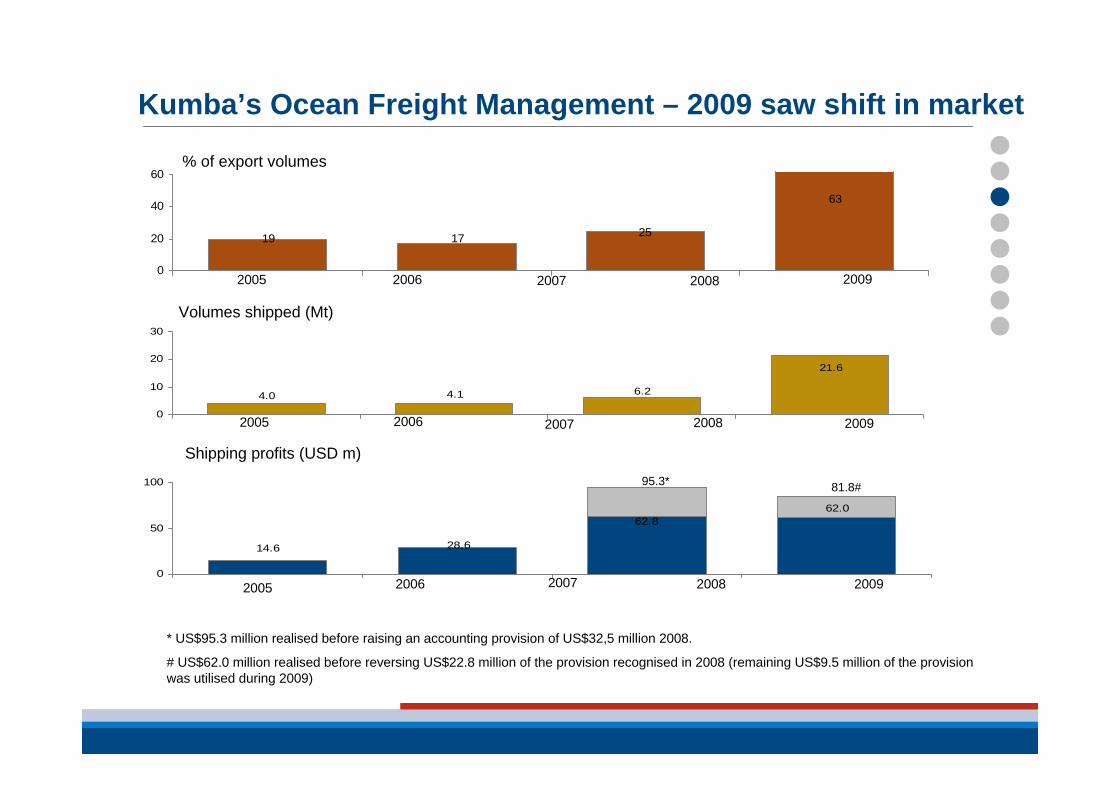
Kumba’s Ocean Freight Management – 2009 saw shift in market
63
251719
0
20
40
60
2005 2006 2007 2008 2009
% of export volumes
21.6
6.24.14.0
0
10
20
30
2005 2006 2007 2008 2009
Volumes shipped (Mt)
14.6 28.6
62.862.0
0
50
100
2005 2006 2007 2008 2009
Shipping profits (USD m)95.3*
* US$95.3 million realised before raising an accounting provision of US$32,5 million 2008.
# US$62.0 million realised before reversing US$22.8 million of the provision recognised in 2008 (remaining US$9.5 million of the provision was utilised during 2009)
81.8#
21
Legal Update
• Kolomela (Sishen South) – Arbitration complete– ArcelorMittal South Africa not entitled to equity participation– Significant EBIT preservation
• Faleme– Awaiting determination (expected Q2 2010)
• Lithos– Action in the SA High Court postponed
22
ArcelorMittal South Africa – Sishen Supply agreement
• 5th February 2010: Sishen Iron Ore Company (‘SIOC’) notified ArcelorMittal South Africa (‘Mittal’) that, as Mittal had failed to convert its 21.4% undivided share in the old order mining rights which it held in relation to the Sishen Mine, Kumba would no longer supply iron ore at cost plus 3%, but at market related prices
• 25th February 2010: SIOC offered an interim pricing agreement to Mittal
• 26th February 2010: Mittal released a SENS announcement declaring a dispute with SIOC
• 17th March 2010: SIOC announced it applied for the residual 21.4% mining right previously held by Mittal, on 1st May 2009. However, the Department of Mineral Resources had granted a prospecting right over the 21.4% interest to a third party, Imperial Crown Trading
• Kumba has appealed the grant of these prospecting rights, through the appeal process provided for in the MPRDA
23
Iron Ore market outlook
24
Iron Ore: Outlook is robust• Global GDP to recover from 2009 levels, driven by China and recovery in RoW
• Steel demand to recover robustly, partly due to restocking
• New projects expected to be approved in medium-term but long lead-times could result in effective deficit for number of years
• A sustained deficit will draw in high cost supply from China
• Higher prices in medium-term are supported
25
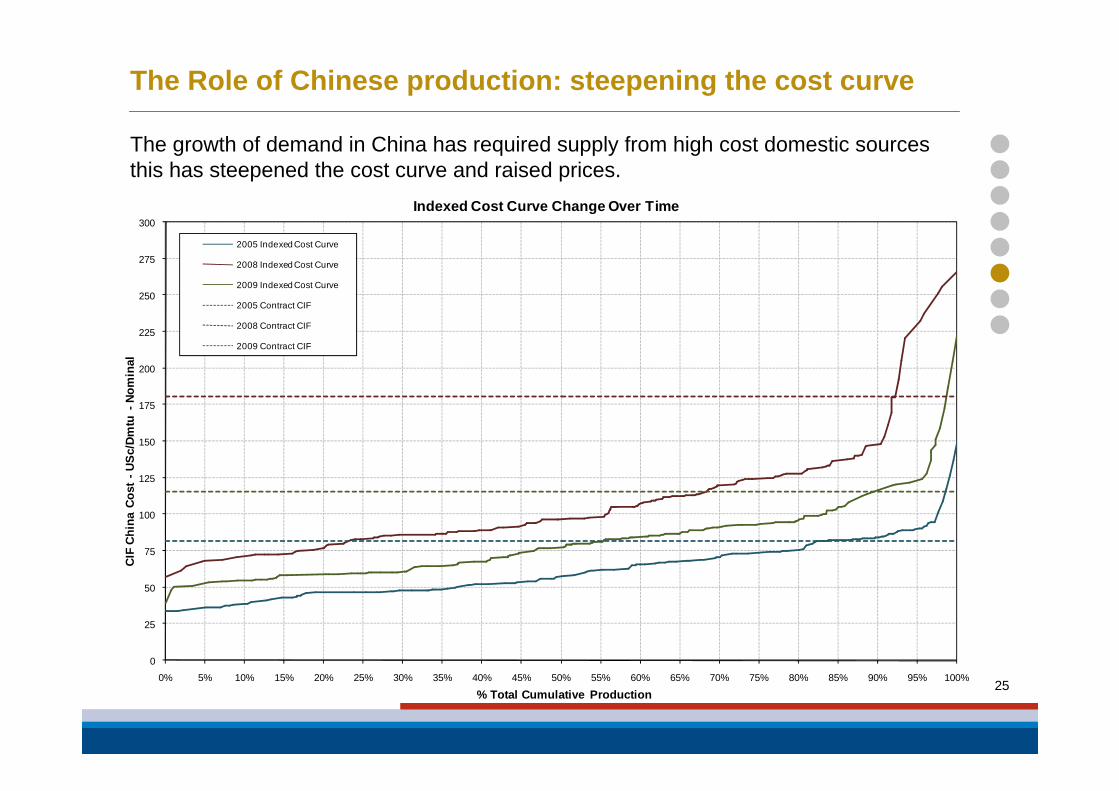
The Role of Chinese production: steepening the cost curve
The growth of demand in China has required supply from high cost domestic sources this has steepened the cost curve and raised prices.
0
25
50
75
100
125
150
175
200
225
250
275
300
0% 5% 10% 15% 20% 25% 30% 35% 40% 45% 50% 55% 60% 65% 70% 75% 80% 85% 90% 95% 100%
CIF
Chi
na C
ost -
USc
/Dm
tu -
Nom
inal
% Total Cumulative Production
Indexed Cost Curve Change Over Time
2005 Indexed Cost Curve
2008 Indexed Cost Curve
2009 Indexed Cost Curve
2005 Contract CIF
2008 Contract CIF
2009 Contract CIF
26
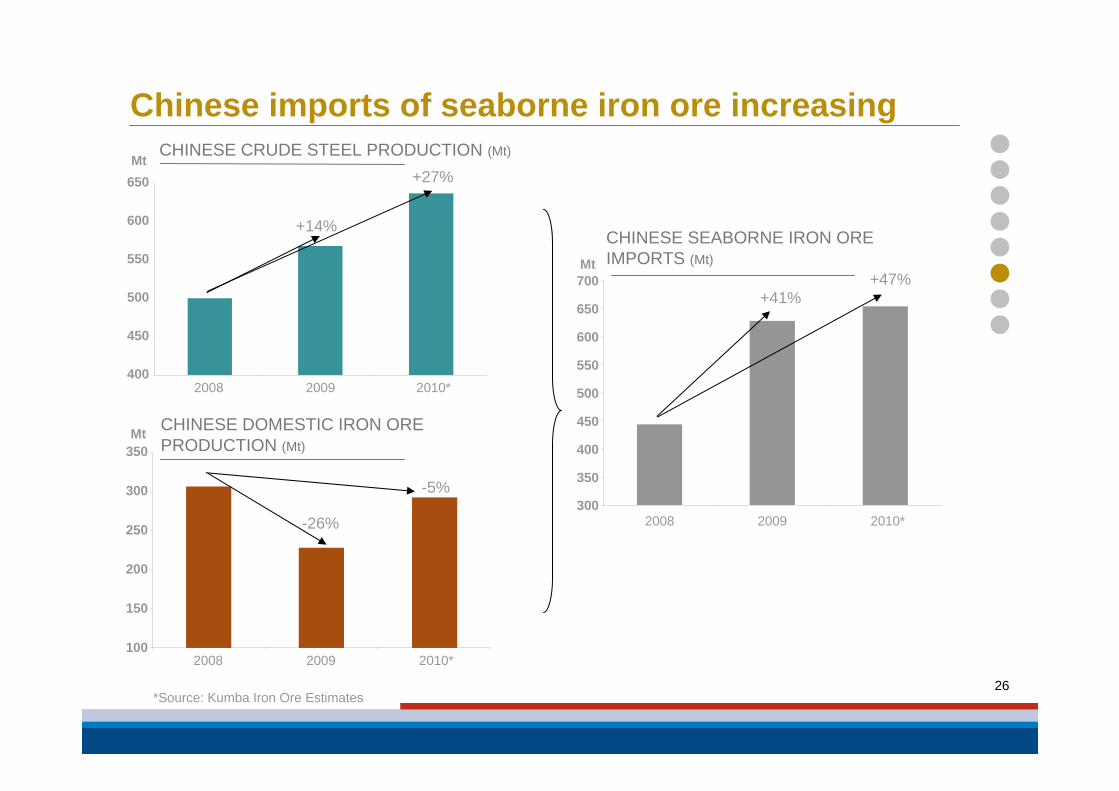
Chinese imports of seaborne iron ore increasing
400
450
500
550
600
650
2008 2009 2010*
CHINESE CRUDE STEEL PRODUCTION (Mt)
CHINESE DOMESTIC IRON ORE PRODUCTION (Mt)
100
150
200
250
300
350
2008 2009 2010*
-5%
+27%
-26%
+14%
300
350
400
450
500
550
600
650
700
2008 2009 2010*
CHINESE SEABORNE IRON ORE IMPORTS (Mt)
*Source: Kumba Iron Ore Estimates
Mt
Mt
Mt
+41%+47%
27
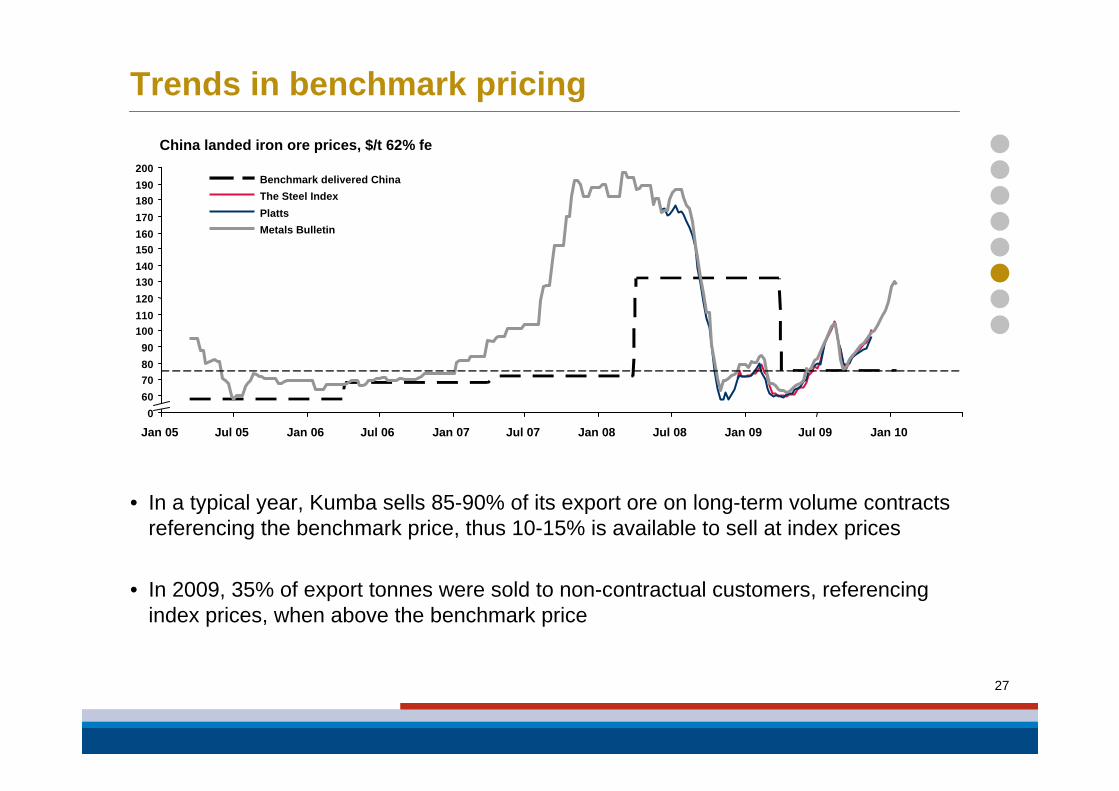
Trends in benchmark pricing
Jul 05 Jan 06Jan 05 Jul 09Jul 08
100
0
Jan 10Jan 08Jul 07Jan 07Jul 06
200
60
9080
110120130140
160
Jan 09
170180190
150
70
Metals BulletinPlattsThe Steel IndexBenchmark delivered China
China landed iron ore prices, $/t 62% fe
• In a typical year, Kumba sells 85-90% of its export ore on long-term volume contracts referencing the benchmark price, thus 10-15% is available to sell at index prices
• In 2009, 35% of export tonnes were sold to non-contractual customers, referencing index prices, when above the benchmark price
28
Projects
29
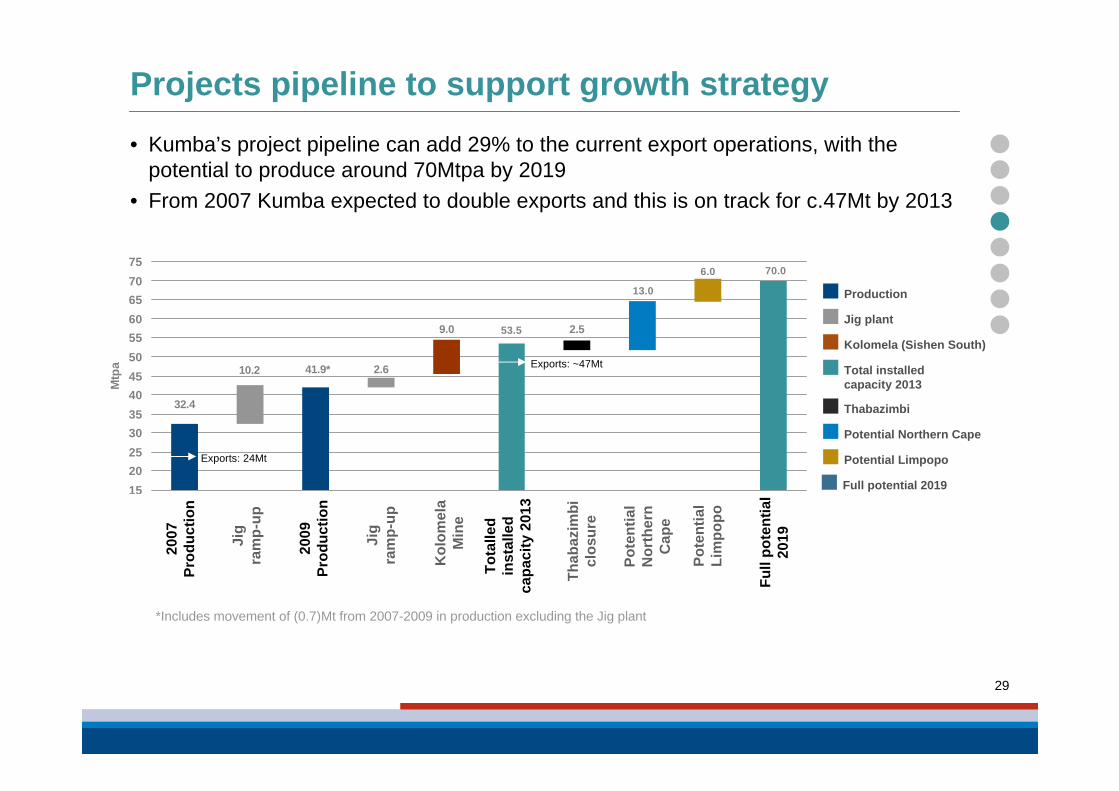
Projects pipeline to support growth strategy• Kumba’s project pipeline can add 29% to the current export operations, with the
potential to produce around 70Mtpa by 2019• From 2007 Kumba expected to double exports and this is on track for c.47Mt by 2013
9.0
6.0
2.610.2
13.0
2.553.5
70.0
32.4
41.9*
15202530354045505560657075
2007
Prod
uctio
n
Jig
ram
p-up
2009
Prod
uctio
n
Jig
ram
p-up
Kol
omel
aM
ine
Tota
lled
inst
alle
dca
paci
ty 2
013
Thab
azim
bicl
osur
e
Pote
ntia
lN
orth
ern
Cap
e
Pote
ntia
lLi
mpo
po
Full
pote
ntia
l20
19
Mtp
a
Potential Northern Cape
Thabazimbi
Total installedcapacity 2013
Kolomela (Sishen South)
Jig plant
Production
Full potential 2019
Potential LimpopoExports: 24Mt
Exports: ~47Mt
*Includes movement of (0.7)Mt from 2007-2009 in production excluding the Jig plant
2007
Pr
oduc
tion
Jig
ram
p-up
2009
Pr
oduc
tion
Jig
ram
p-up
Kol
omel
a M
ine
Tota
lled
inst
alle
d ca
paci
ty 2
013
Thab
azim
bi
clos
ure
Pote
ntia
l N
orth
ern
Cap
e
Pote
ntia
l Li
mpo
po
Full
pote
ntia
l 20
19
30
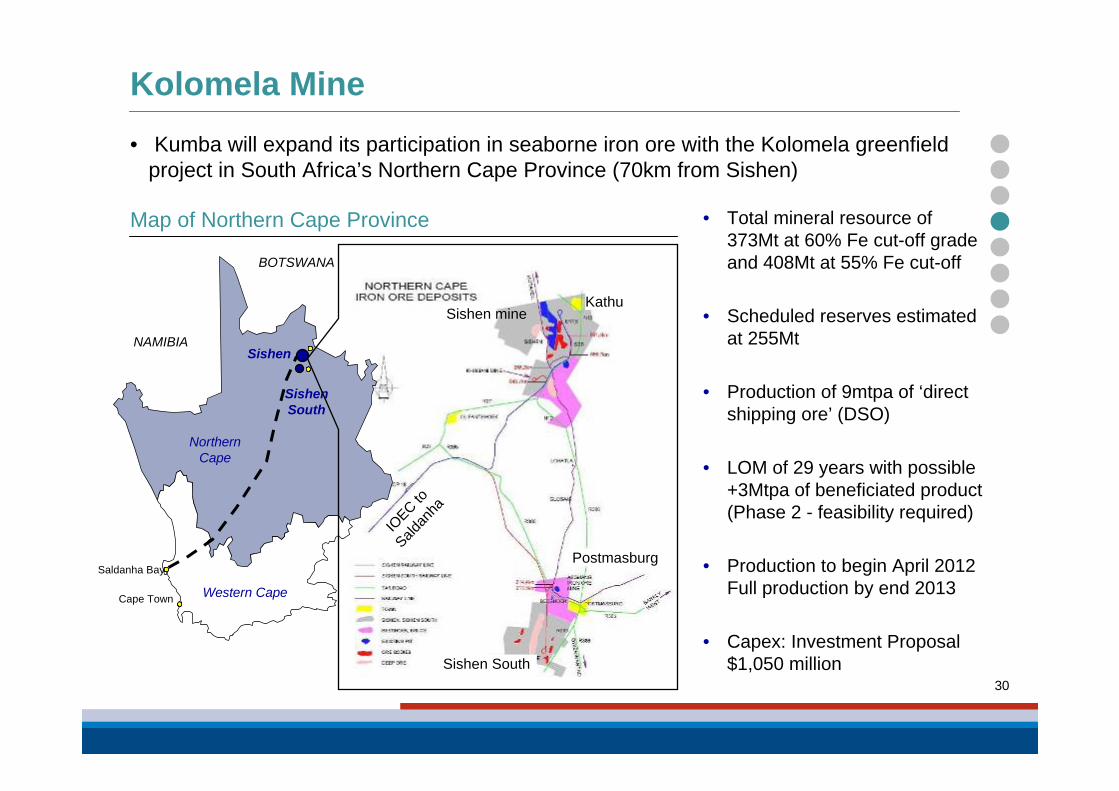
Kolomela Mine• Kumba will expand its participation in seaborne iron ore with the Kolomela greenfield
project in South Africa’s Northern Cape Province (70km from Sishen)
Map of Northern Cape Province • Total mineral resource of 373Mt at 60% Fe cut-off grade and 408Mt at 55% Fe cut-off
• Scheduled reserves estimated at 255Mt
• Production of 9mtpa of ‘direct shipping ore’ (DSO)
• LOM of 29 years with possible +3Mtpa of beneficiated product (Phase 2 - feasibility required)
• Production to begin April 2012Full production by end 2013
• Capex: Investment Proposal $1,050 million
Northern Cape
Western Cape
BOTSWANA
NAMIBIA
Cape Town
Sishen
Sishen South
Saldanha Bay
Sishen South
Postmasburg
Sishen mineKathu
IOEC to
Saldan
ha
31
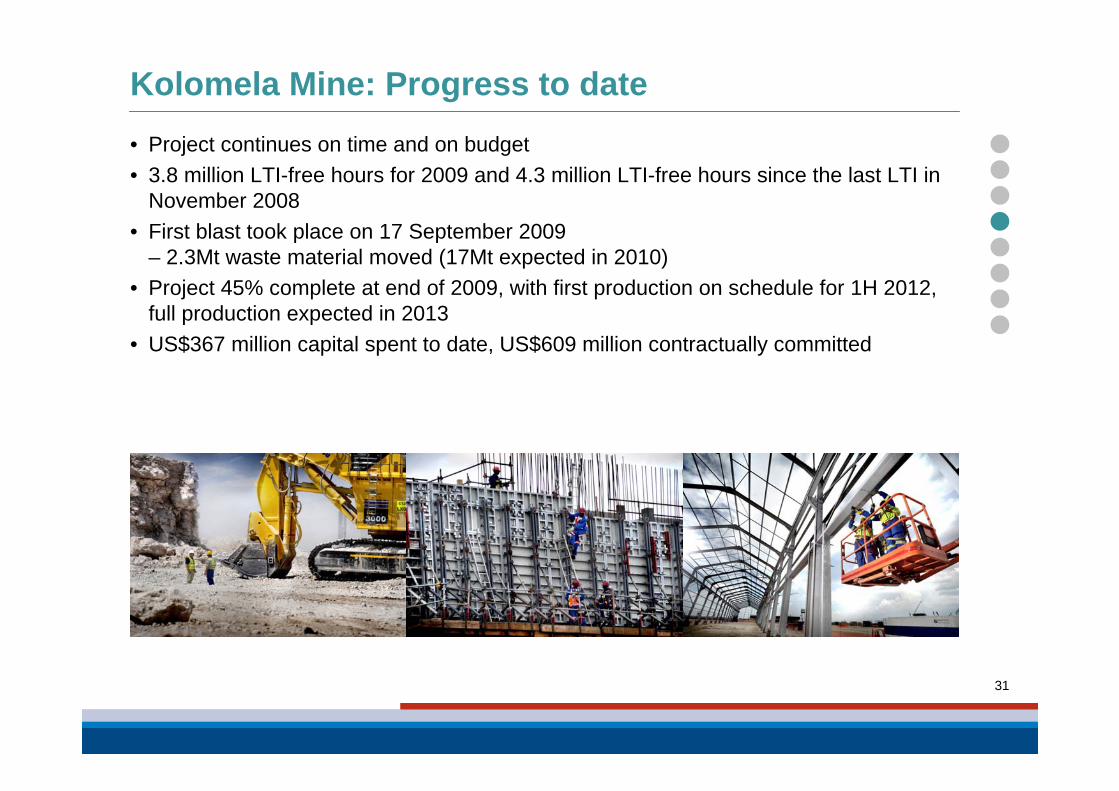
Kolomela Mine: Progress to date• Project continues on time and on budget• 3.8 million LTI-free hours for 2009 and 4.3 million LTI-free hours since the last LTI in
November 2008• First blast took place on 17 September 2009
– 2.3Mt waste material moved (17Mt expected in 2010)• Project 45% complete at end of 2009, with first production on schedule for 1H 2012,
full production expected in 2013• US$367 million capital spent to date, US$609 million contractually committed
256 151158
96
410395
156
2779*
-
500
1,000
2008 2009 2010 2011
US$
m
SIB Expansion Total capital expenditure
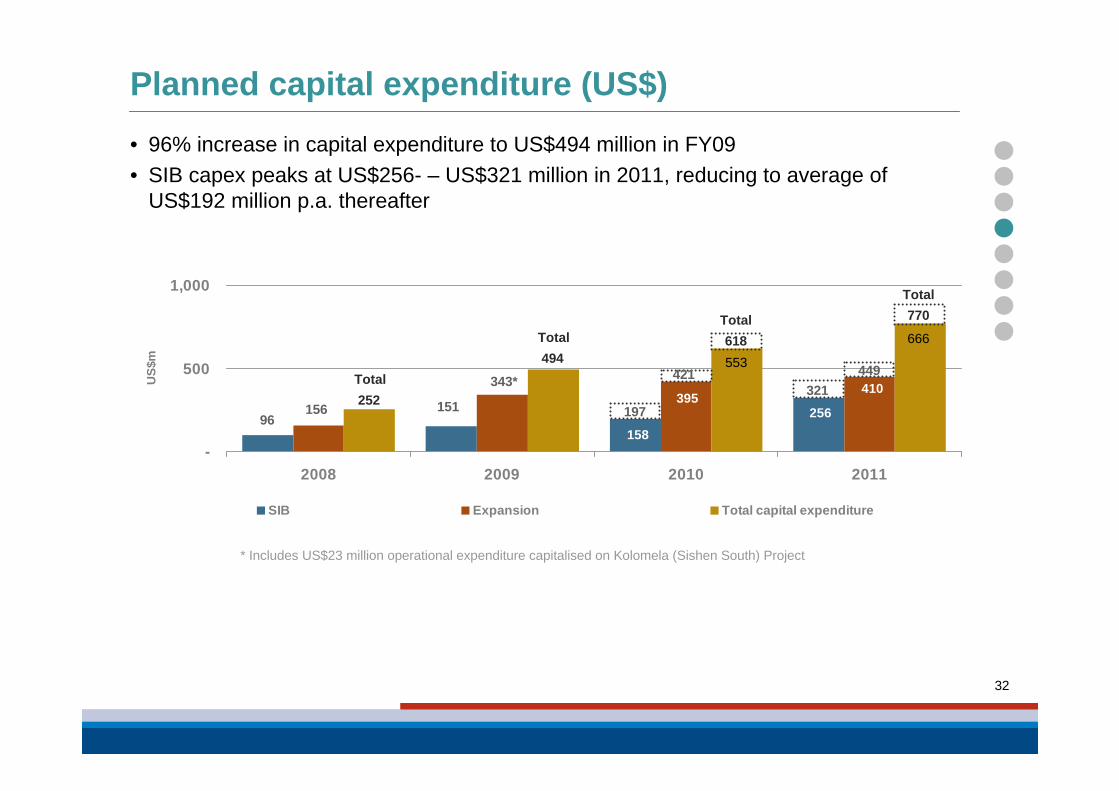
• 96% increase in capital expenditure to US$494 million in FY09• SIB capex peaks at US$256- – US$321 million in 2011, reducing to average of
US$192 million p.a. thereafter
32
Planned capital expenditure (US$)
Total494
Total618
Total770
* Includes US$23 million operational expenditure capitalised on Kolomela (Sishen South) Project
Total252
197
421553
321449
666
343*
15115696
33
In Summary
• Kumba is a leading value-adding iron ore supplier to the global steel industry
• Kumba has low-cost, long-life mining assets, supported by a significant growth pipeline
• Kumba is focused on revenue enhancement and cost management through Asset Optimisation, with savings already delivered and stretch targets being met
• Kumba has delivered significant cash to shareholders
• Kumba is fully committed to the achievement of zero harm for all its employees
34
Questions and Answers
“We see what could be”
35
Appendix
36
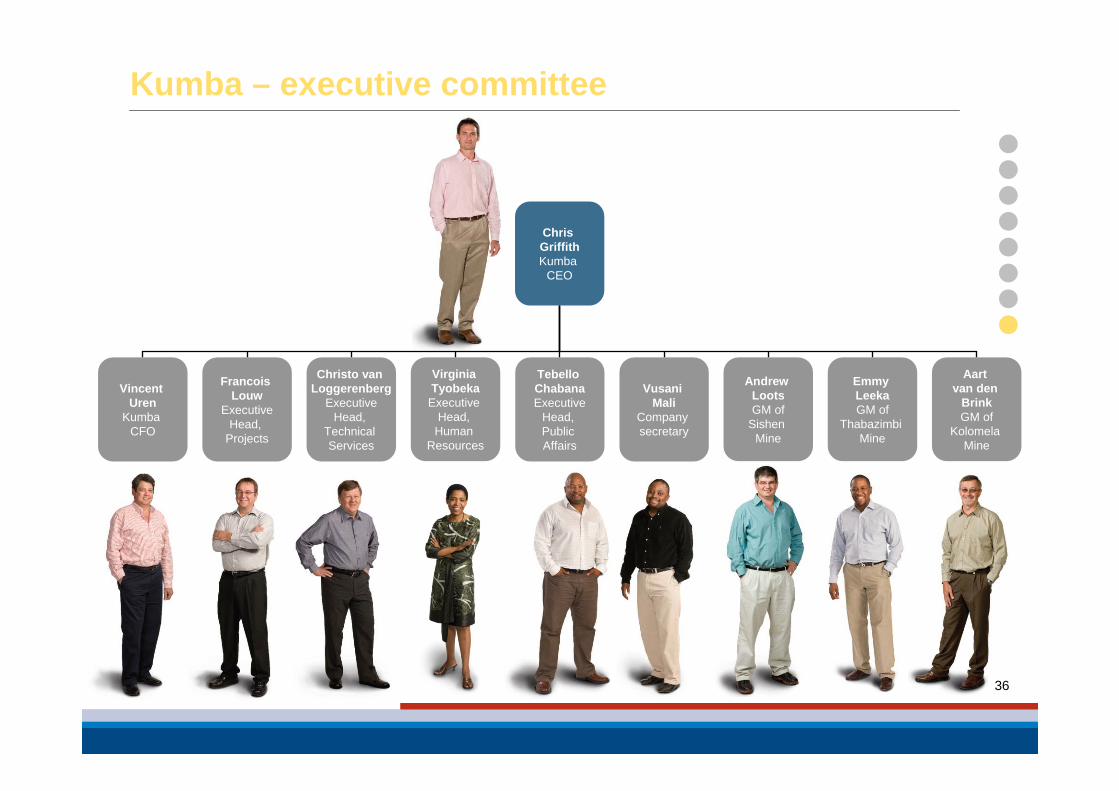
Kumba – executive committee
Chris GriffithKumba
CEO
Vincent Uren
Kumba CFO
Francois Louw
ExecutiveHead,
Projects
Christo van Loggerenberg
ExecutiveHead,
Technical Services
Virginia Tyobeka
Executive Head,
Human Resources
Tebello ChabanaExecutive
Head, Public Affairs
Vusani Mali
Company secretary
Andrew LootsGM of
Sishen Mine
Emmy LeekaGM of
Thabazimbi Mine
Aart van den
BrinkGM of
Kolomela Mine
12.9
6.05.4
13.5
0
5
10
15
2006 2007 2008 2009
R b
illio
n
37
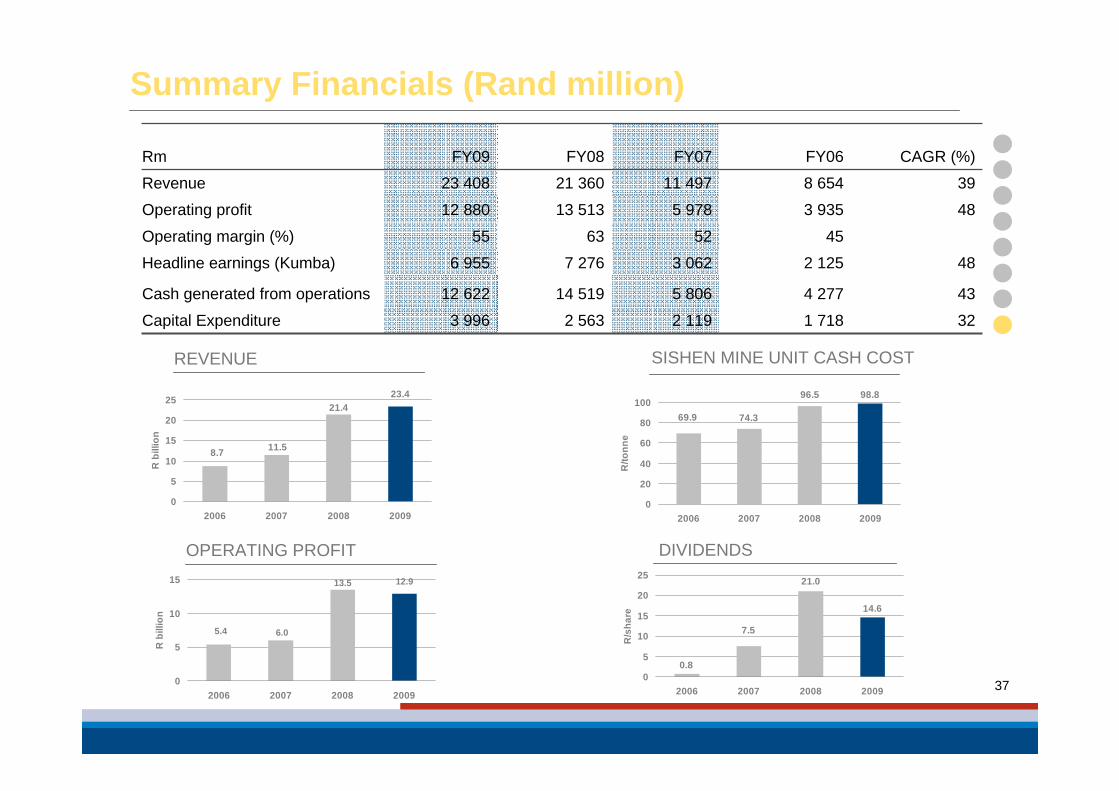
Summary Financials (Rand million)
OPERATING PROFIT
98.896.5
69.9 74.3
0
20
40
60
80
100
2006 2007 2008 2009
R/to
nne
SISHEN MINE UNIT CASH COST
DIVIDENDS
14.6
7.5
0.8
21.0
0
5
10
15
20
25
2006 2007 2008 2009
R/s
hare
23.4
11.58.7
21.4
0
5
10
15
20
25
2006 2007 2008 2009
R b
illio
n
REVENUE
1 718
4 277
2 125
45
3 935
8 654
FY06
322 1192 5633 996Capital Expenditure
435 80614 51912 622Cash generated from operations
Rm FY09 FY08 FY07 CAGR (%)
Revenue 23 408 21 360 11 497 39
Operating profit 12 880 13 513 5 978 48
Operating margin (%) 55 63 52
Headline earnings (Kumba) 6 955 7 276 3 062 48
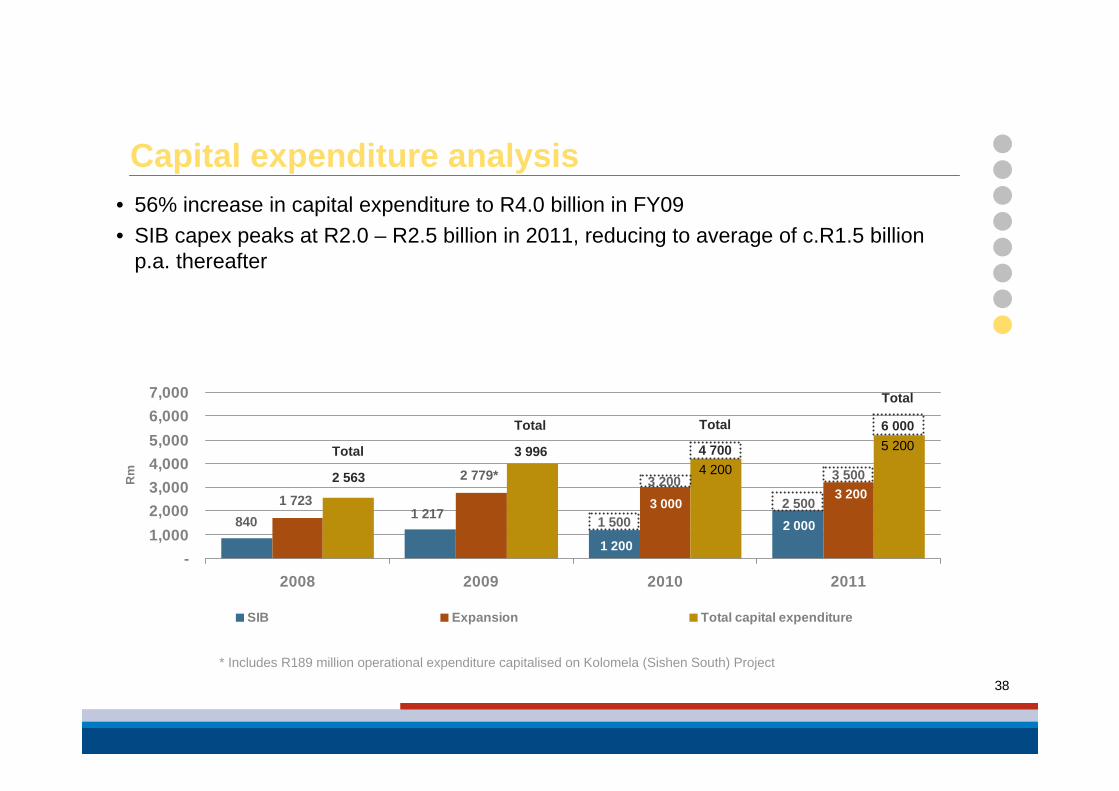
• 56% increase in capital expenditure to R4.0 billion in FY09• SIB capex peaks at R2.0 – R2.5 billion in 2011, reducing to average of c.R1.5 billion
p.a. thereafter
2 0001 217
1 200 840
3 2003 0001 723
2779*
-1,0002,0003,0004,0005,0006,0007,000
2008 2009 2010 2011
Rm
SIB Expansion Total capital expenditure
38
Capital expenditure analysis
Total
3 996
Total
4 700
Total
6 000
* Includes R189 million operational expenditure capitalised on Kolomela (Sishen South) Project
Total
2 563
1 500
3 2004 200
2 500
3 500
5 200
2 779*
1 2171 723
840
39
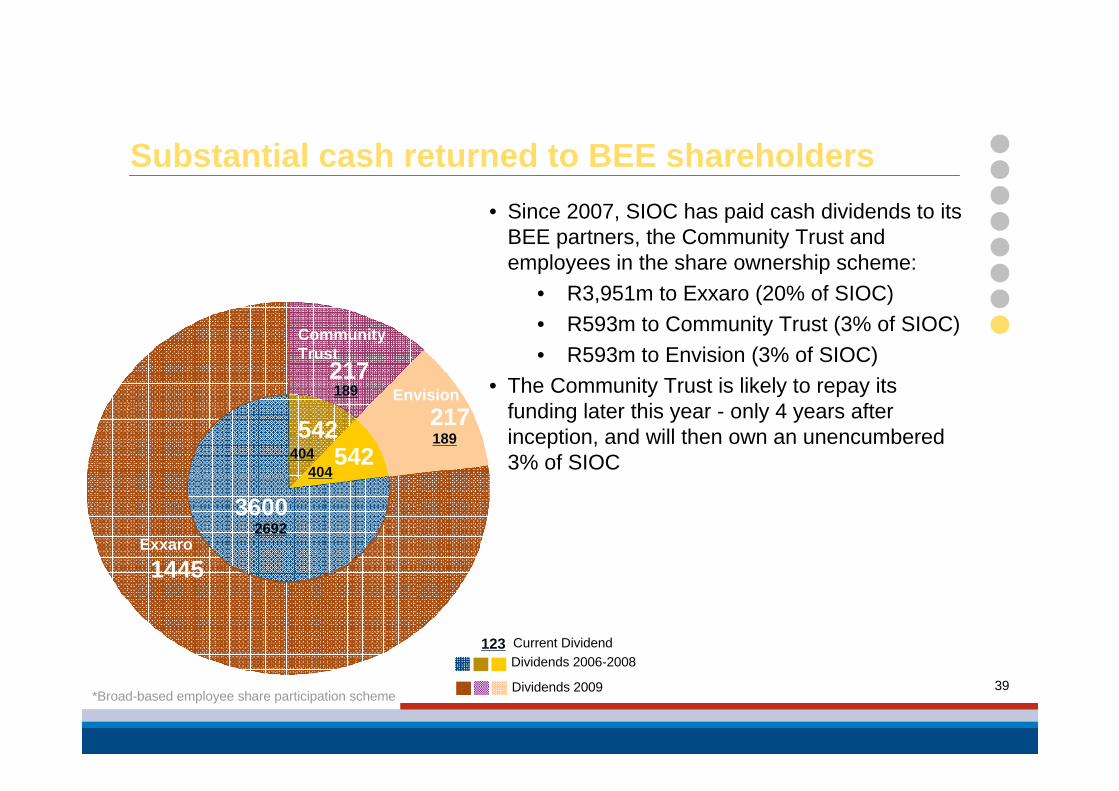
Substantial cash returned to BEE shareholders• Since 2007, SIOC has paid cash dividends to its
BEE partners, the Community Trust and employees in the share ownership scheme:
• R3,951m to Exxaro (20% of SIOC)• R593m to Community Trust (3% of SIOC)• R593m to Envision (3% of SIOC)
• The Community Trust is likely to repay its funding later this year - only 4 years after inception, and will then own an unencumbered 3% of SIOC
Dividends 2006-2008
Dividends 2009*Broad-based employee share participation scheme
Envision
123 Current Dividend
1445
3600
217
217542
542
Exxaro
Community Trust
2692
404404
189
189
Envision
40
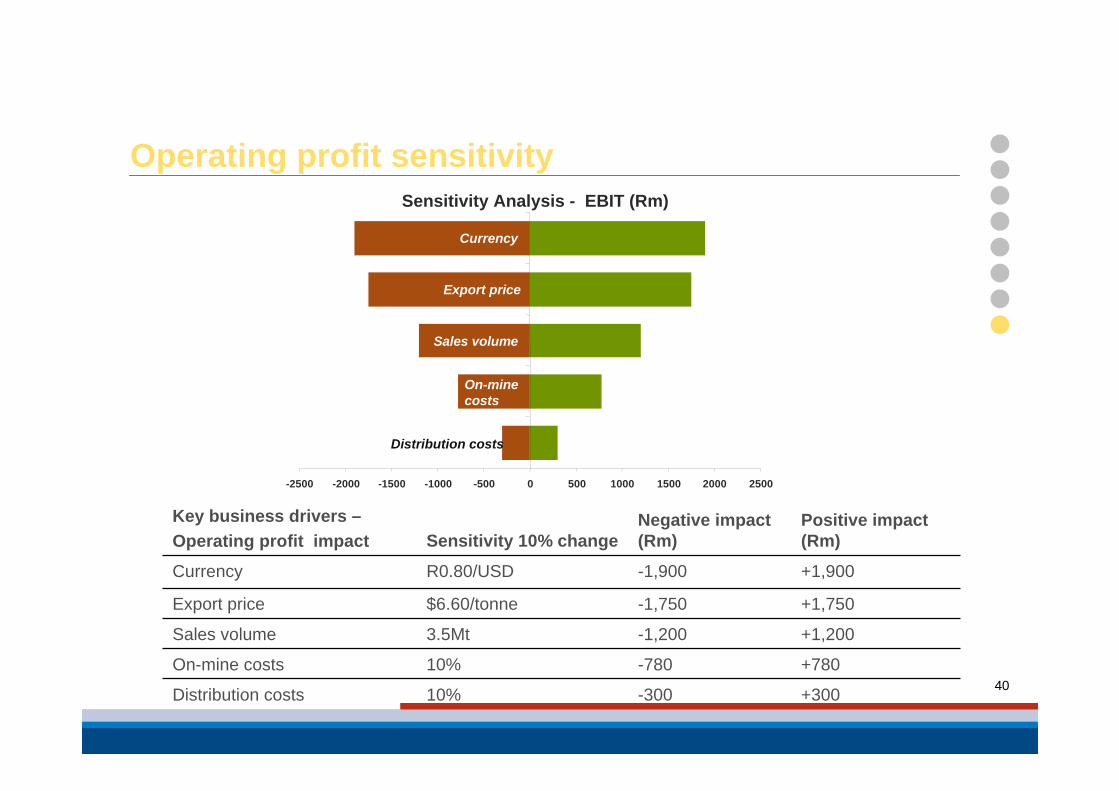
Operating profit sensitivity
+300-30010%Distribution costs
+780-78010%On-mine costs
+1,200-1,2003.5MtSales volume
+1,750-1,750$6.60/tonneExport price
+1,900-1,900R0.80/USDCurrency
Positive impact (Rm)
Negative impact (Rm)Sensitivity 10% change
Key business drivers –Operating profit impact
Sensitivity Analysis - EBIT (Rm)
-2500 -2000 -1500 -1000 -500 0 500 1000 1500 2000 2500
Distribution costs
On-minecosts
Sales volume
Export price
Currency