Embed Size (px)
Citation preview

Site Director: Udaya B. Halabe, Ph.D., P.E., ASCE Fellow
Date: February 1, 2011

WVU recently purchased a 220-kip Instron universal testing machine to replace a similar machine acquired in 1936.
NSF support for government agencies to join should allow WVDOT-DOH and WV-DOE to join, as they have been very interested.

WVU-1: Resin Design for Fire Safety Requirements
WVU-2: Strength and Fatigue Life Prediction
WVU-3: Aging Testing and Analysis of Composites
WVU-4: Nondestructive Evaluation of FRP Composites Using Infrared Thermography (IRT)
WVU-5: Design, Manufacture and Implementation of Structural Panels
Project Manager / PI: Rakesh Gupta
Overview ◦ FRPs are susceptible to heat and fire: upon heating, matrix
decomposes, releasing volatiles that act as fuels, there is fire spread and emission of toxic smoke and soot
◦ There is loss of mechanical properties and structural integrity
◦ Flame retardants in polymer can delay combustion
◦ Knowledge of sequence of events that lead to fire can be used to understand and improve material behavior
Budget Update

Progress to Date ◦ Computational methods can be used to determine
influence of heating on a composite structure
◦ Good agreement shown between calculations and data for ignition temperature of polymers subjected to UL-94 test
◦ COMSOL Software now is used to simulate the decomposition of FRPs upon heating at prescribed rate
◦ Time- and position-dependent temperature and gas emission profiles have been calculated
◦ Computations agree with experiments reported in the literature

Figure 1. Schematic diagram of decomposition of a composite
Physical Situation
Heat Insulation
Volatile gases due to
composite decomposition
Fiber-reinforced polymer composite
Resin Design for Fire Safety Requirements Project Number: WVU-1

Governing equations
T, temperature [K]; t, time [s]; , density [kg/m3]; k, thermal conductivity [W/(m*K)];
Cp and Cpg, heat capacity of composite and gases [J/(kg*K)];
, gases mass flux [kg/(s.m2)]; Q, heat consumption or generation [J/kg];
Qhhtx
TCm
x
Tk
xt
TC gpggp
Energy balance
Accumulation Conduction Convection Heat generation or
consumption
Convection
Accumulation
H and Hg, enthalpy of composite and gases [J/kg]
gm
Resin Design for Fire Safety Requirements Project Number: WVU-1

Governing equations
A, pre-exponential factor [1/s]; Ea, activation energy [J/mole];
0 and f, initial and final densities of the composite [Kg/m3];
n, order of decomposition reaction
Mass balance x
m
t
g
Decomposition reaction
Arrhenius equation
RT
EA
t
a
n
fexp
0
0
Resin Design for Fire Safety Requirements Project Number: WVU-1
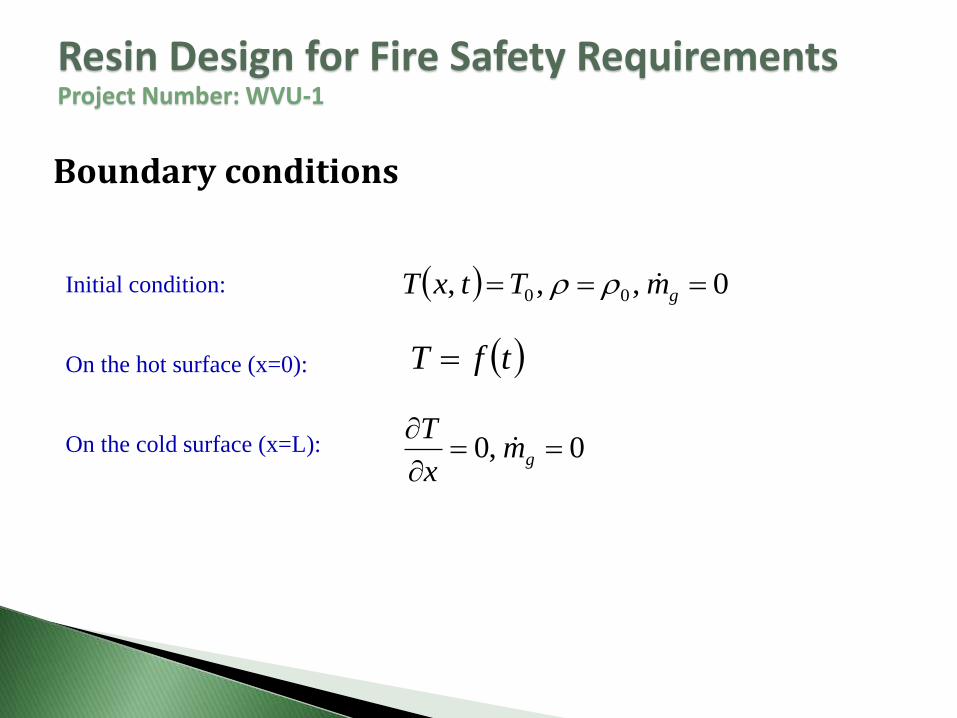
Boundary conditions
Initial condition:
On the hot surface (x=0):
0,0
gm
x
T
0,,, 00 gmTtxT
tfT
On the cold surface (x=L):
Resin Design for Fire Safety Requirements Project Number: WVU-1
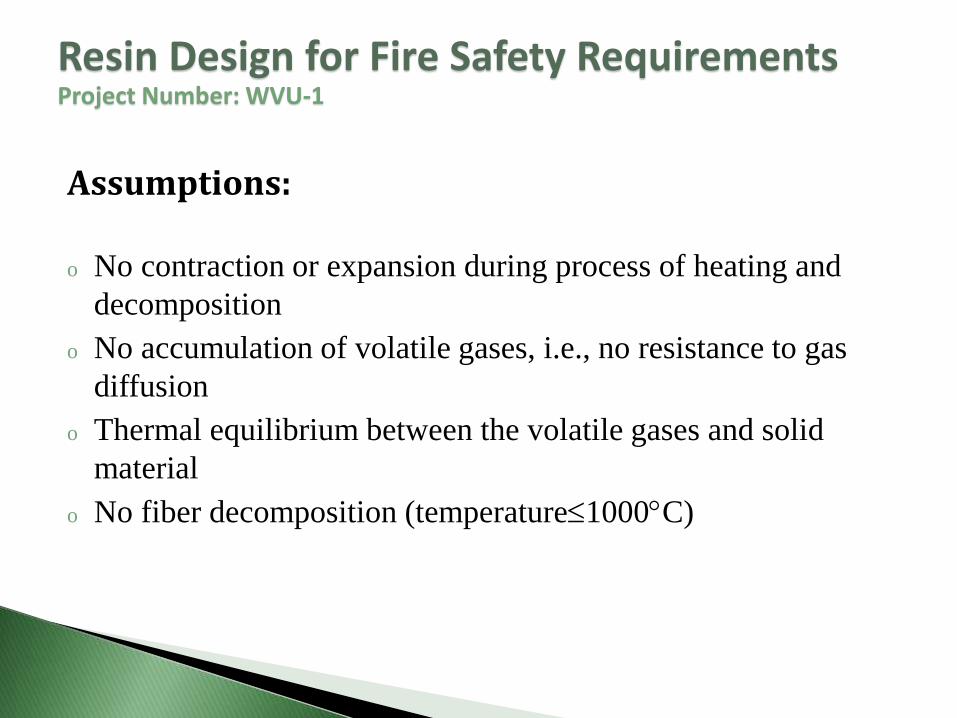
Assumptions:
o No contraction or expansion during process of heating and
decomposition
o No accumulation of volatile gases, i.e., no resistance to gas
diffusion
o Thermal equilibrium between the volatile gases and solid
material
o No fiber decomposition (temperature1000C)
Resin Design for Fire Safety Requirements Project Number: WVU-1

Material [glass fiber (45 vol. % or 63.6 wt. %) + polyester resin] properties
Property Value
A, pre-exponential factor [1/s] 1000
Cpfr, fiber specific heat capacity [J/(kg.K)] 760
Cpr, resin (matrix) specific heat capacity [J/(kg.K)] 1600
Cpg, gas specific heat capacity [J/(kg.K)] 2386.5
Ea, activation energy [J/mole] 5E+4
kfr, fiber thermal conductivity [W/(m.K)] 1.04
kr, resin conductivity [W/(m.K)] 0.20
Q, heat of decomposition [J/kg] -2.3446E+5
R, gas constant [J/(mole.K)] 8.314
T0, initial temperature [C] 20
Vfr, fiber volume fraction [-] 0.45
fr, fiber density [Kg/m3] 2560
r, resin density [Kg/m3] 1200
0, initial density of the composite [Kg/m3] 1812
n, order of the decomposition reaction [-] 1
From Looyeh et al. (1997), Int. J. Numer. Methods Heat Fluid Flow, 7(6):609-625
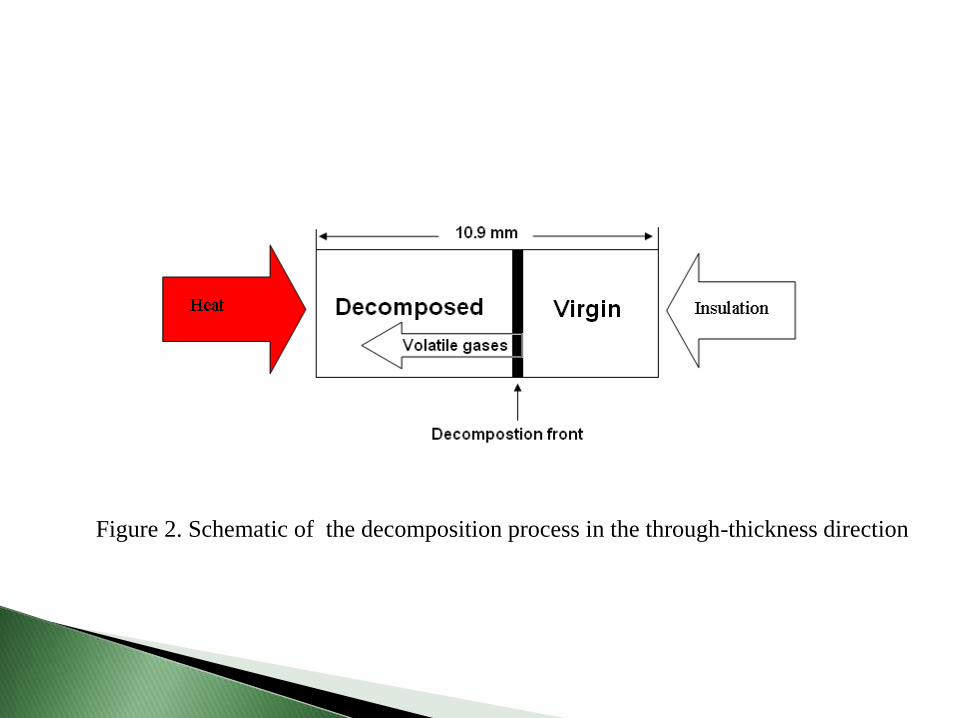
Figure 2. Schematic of the decomposition process in the through-thickness direction

Material in three stages
Degree of
decomposition,
remain fraction: F
Properties during decomposition
Undecomposed (virgin) Decomposing Decomposed
f
fF
0
Mixture law fkFFkk 10
pfpp CFFCC 10
fFF 0;1 0
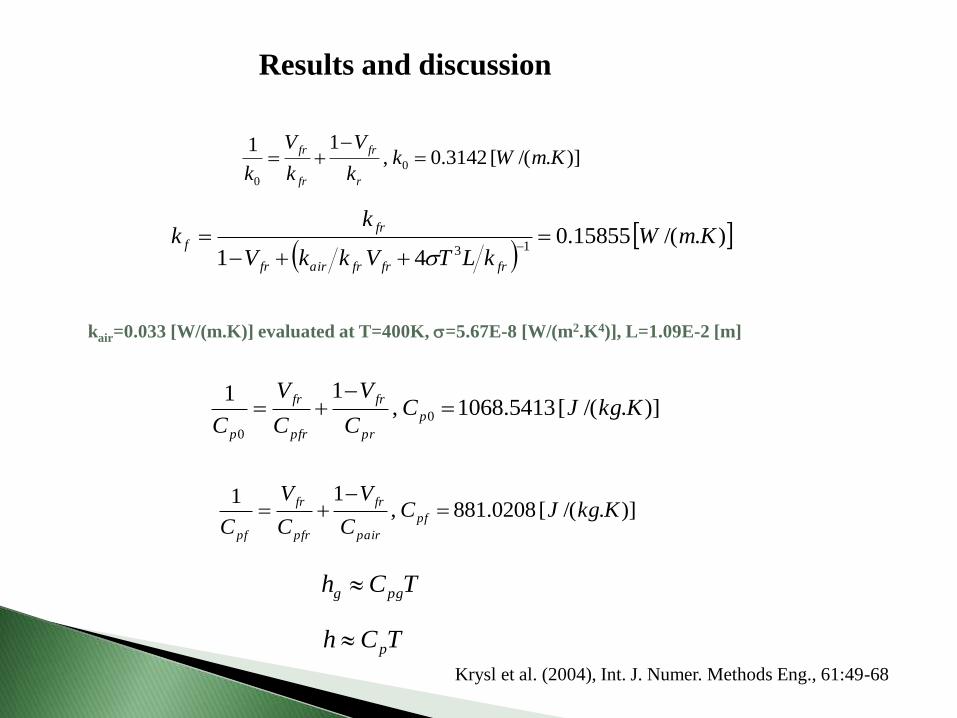
Results and discussion
TCh p
kair=0.033 [W/(m.K)] evaluated at T=400K, =5.67E-8 [W/(m2.K4)], L=1.09E-2 [m]
)]./([5413.1068,11
0
0
KkgJCC
V
C
V
Cp
pr
fr
pfr
fr
p
)]./([0208.881,11
KkgJCC
V
C
V
Cpf
pair
fr
pfr
fr
pf
TCh pgg
)]./([3142.0,11
0
0
KmWkk
V
k
V
k r
fr
fr
fr
)./(15855.0
4113
KmWkLTVkkV
kk
frfrfrairfr
fr
f
Krysl et al. (2004), Int. J. Numer. Methods Eng., 61:49-68
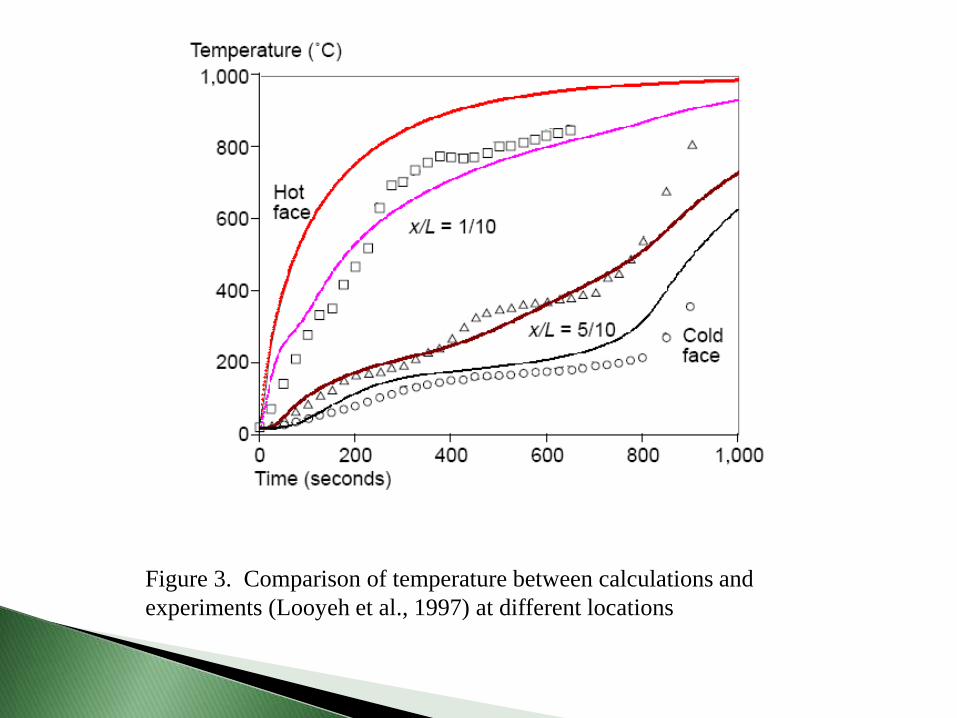
Figure 3. Comparison of temperature between calculations and
experiments (Looyeh et al., 1997) at different locations

Figure 4. Temperature evolution in the composite
Position (m)
0.000 0.002 0.004 0.006 0.008 0.010 0.012
Tem
pe
ratu
re (
°C)
0
200
400
600
800
1000t=0
t=100 (s)
t=200 (s)
t=400 (s)
t=600 (s)
t=800 (s)
t=1000 (s)
Animation: Temperature evolution in the composite with time
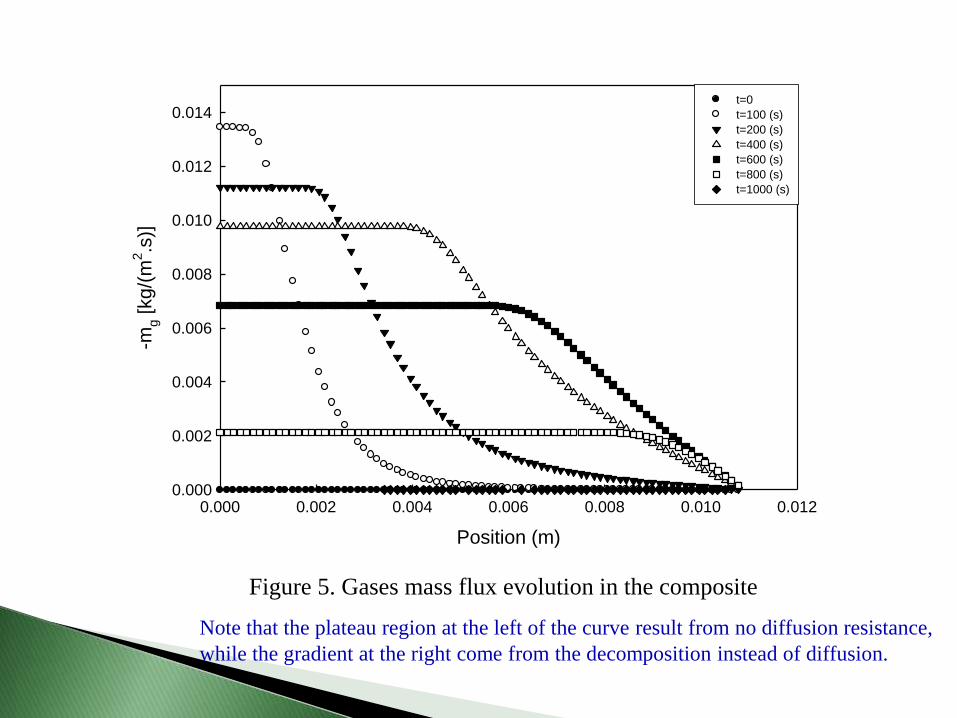
Figure 5. Gases mass flux evolution in the composite
Position (m)
0.000 0.002 0.004 0.006 0.008 0.010 0.012
-mg [kg/(
m2.s
)]
0.000
0.002
0.004
0.006
0.008
0.010
0.012
0.014t=0
t=100 (s)
t=200 (s)
t=400 (s)
t=600 (s)
t=800 (s)
t=1000 (s)
Note that the plateau region at the left of the curve result from no diffusion resistance,
while the gradient at the right come from the decomposition instead of diffusion.
Animation: Gases mass flux evolution in the composite with time

Figure 6. Normalized density of comparison profile in the composite
Position (m)
0.000 0.002 0.004 0.006 0.008 0.010 0.012
/
0
0.60
0.65
0.70
0.75
0.80
0.85
0.90
0.95
1.00
t=0
t=100 (s)
t=200 (s)
t=400 (s)
t=600 (s)
t=800 (s)
t=1000 (s)

Animation: Normalized density evolution in the composite with time
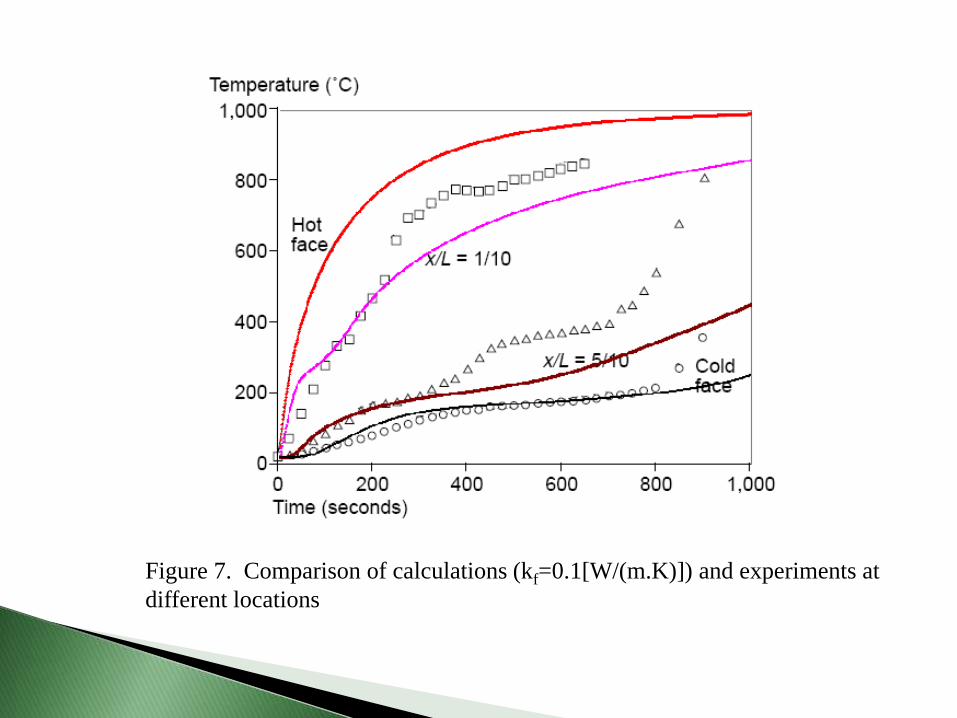
Figure 7. Comparison of calculations (kf=0.1[W/(m.K)]) and experiments at
different locations

Conclusions
o Calculated temperature profiles show reasonable agreement with experimental data
o The model can capture the physics of FRP composite decomposition
o Parameters appearing in the equations need to be determined with accuracy as they play a critical role in predicting thermal behavior
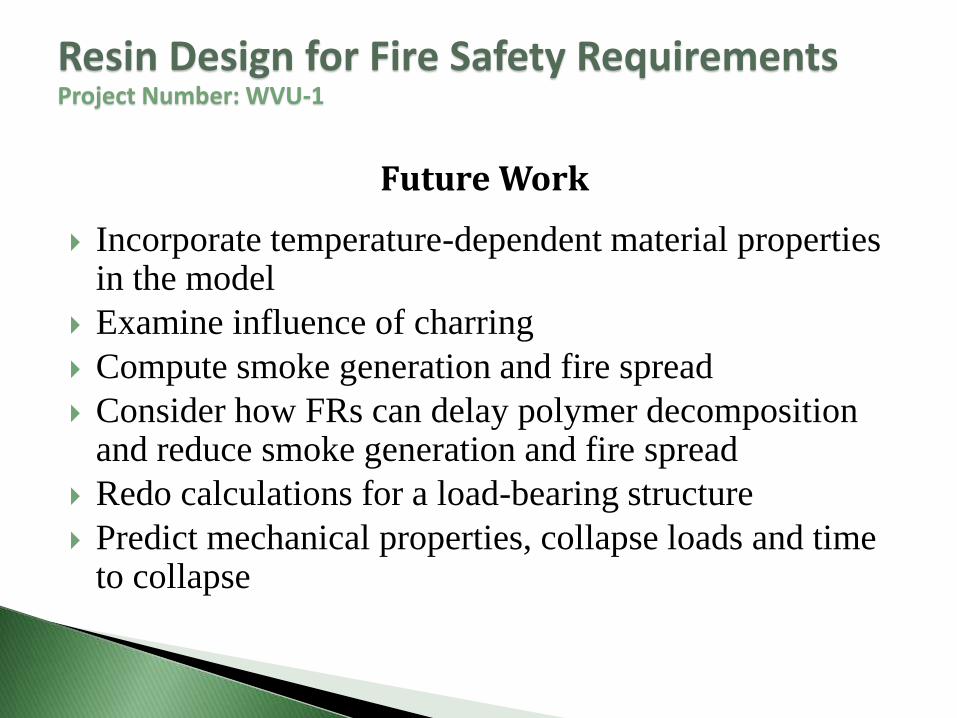
Future Work
Incorporate temperature-dependent material properties in the model
Examine influence of charring
Compute smoke generation and fire spread
Consider how FRs can delay polymer decomposition and reduce smoke generation and fire spread
Redo calculations for a load-bearing structure
Predict mechanical properties, collapse loads and time to collapse
Resin Design for Fire Safety Requirements Project Number: WVU-1
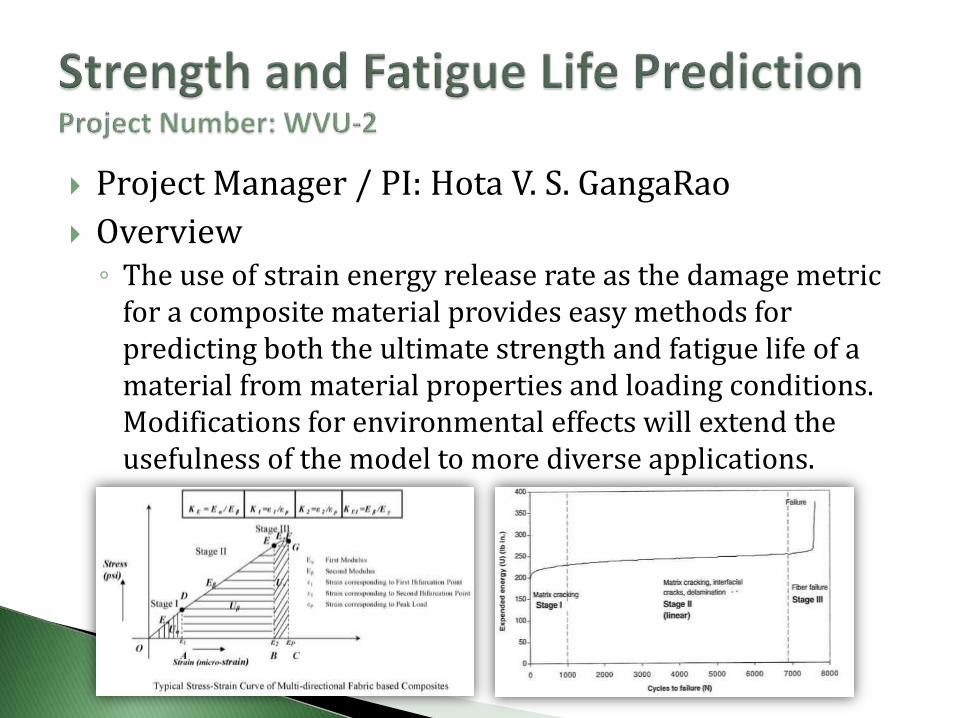
Project Manager / PI: Hota V. S. GangaRao
Overview ◦ The use of strain energy release rate as the damage metric
for a composite material provides easy methods for predicting both the ultimate strength and fatigue life of a material from material properties and loading conditions. Modifications for environmental effects will extend the usefulness of the model to more diverse applications.

Previously Reported Progress
◦ Strength prediction
Applied to GFRP coupons of various fiber architectures in either tension or bending
Applied to different cross sections of full-length columns in axial compression
Strain energy density formula with coefficients from stress-strain curve

Previously Reported Progress
◦ Strength prediction
Accounted for combined loading due to eccentricities in testing
Able to predict the failure load to within about 10% of the experimental value

Previously Reported Progress
◦ Fatigue Life Prediction
Able to fit and predict GFRP coupon fatigue life data to within 5% log error with over 80% success rate when 3 or more experimental data points were used
GFRP beam fatigue lives were also predicted to within 2.5% log error
75.00%
80.00%
85.00%
90.00%
95.00%
100.00%
Within 5% Log Error Within 10% LogError
Full Data Set
R2 > 0.9
R2 > 0.95
R2 > 0.98
0.25
0.35
0.45
0.55
0.65
0.75
0.85
0 2 4 6 8 10
No
rmal
ized
Max
Str
ess
(σm
ax/σ
ult
)
Cycles to failure (Log Nf)
Actual
Model Fit
Upper Limit (+10%)
Lower Limit (-10%)
Upper Limit (+5%)
Lower Limit (-5%)
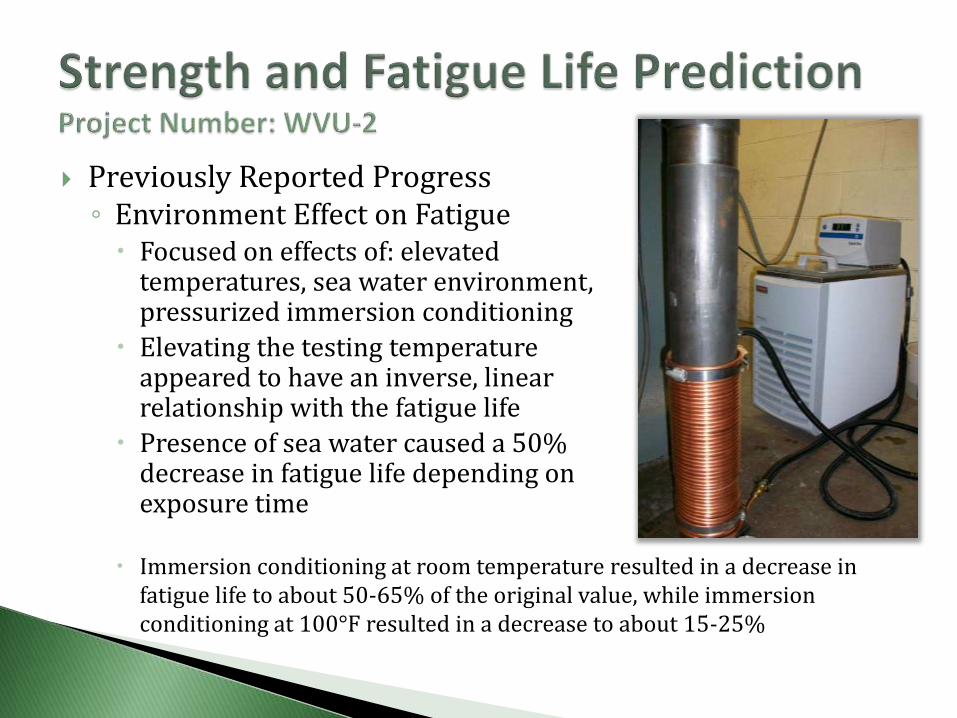
Previously Reported Progress ◦ Environment Effect on Fatigue
Focused on effects of: elevated temperatures, sea water environment, pressurized immersion conditioning
Elevating the testing temperature appeared to have an inverse, linear relationship with the fatigue life
Presence of sea water caused a 50% decrease in fatigue life depending on exposure time
Immersion conditioning at room temperature resulted in a decrease in fatigue life to about 50-65% of the original value, while immersion conditioning at 100°F resulted in a decrease to about 15-25%

Recent Work
◦ Fatigue Life Prediction
Strain energy fatigue model compared to a bending fatigue model proposed for the Pre-standard for LRFD of FRP Structures by ASCE.
WVU model resulted in fatigue life prediction factor of safety of around 5; ultra-conservative pre-standard model resulted in factor of around 100.
Original WVU Equation:
WVU Equation modified for comparison to pre-standard:

Future Work / Conclusion ◦ Obtain fatigue data from more sources, continue to try to
establish good model constants ◦ Sample properties and testing conditions need to be
explored and incorporated into the model constants ◦ Environmental effects may be able to be incorporated into
the life prediction model as factors ◦ Additional GRFP column strength testing planned for
Bedford Reinforced Plastics (after aging in wet and high temperature environments)
◦ Additional GRFP coupon fatigue testing planned for Lockheed Martin (focusing on effect of seawater aging)

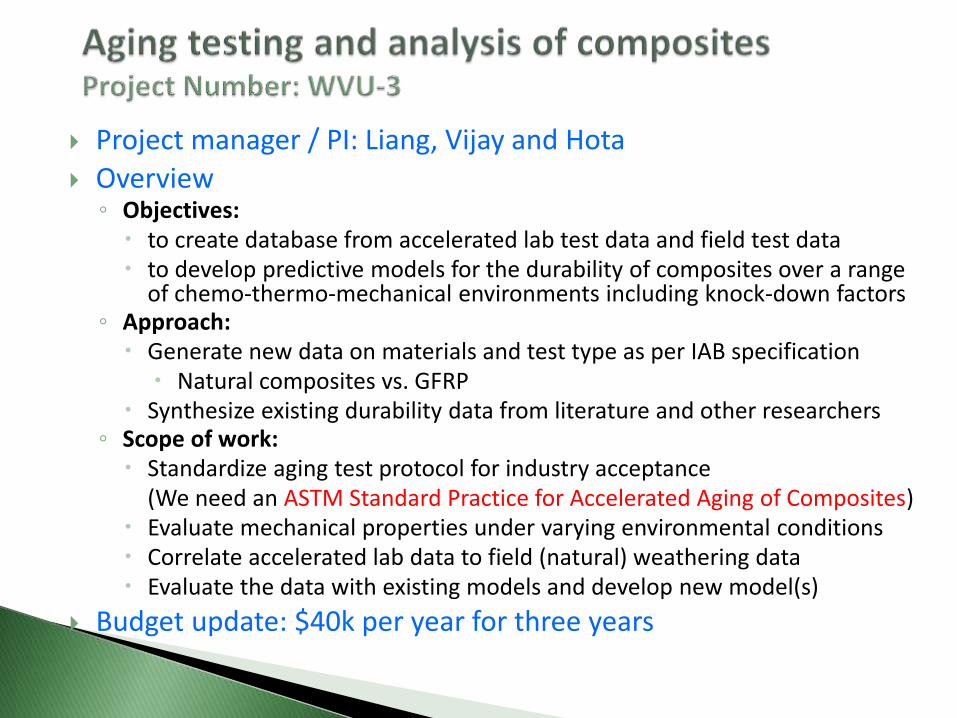
Project manager / PI: Liang, Vijay and Hota
Overview ◦ Objectives:
to create database from accelerated lab test data and field test data to develop predictive models for the durability of composites over a range
of chemo-thermo-mechanical environments including knock-down factors ◦ Approach:
Generate new data on materials and test type as per IAB specification Natural composites vs. GFRP
Synthesize existing durability data from literature and other researchers ◦ Scope of work:
Standardize aging test protocol for industry acceptance (We need an ASTM Standard Practice for Accelerated Aging of Composites) Evaluate mechanical properties under varying environmental conditions Correlate accelerated lab data to field (natural) weathering data Evaluate the data with existing models and develop new model(s)
Budget update: $40k per year for three years

Progress to date ◦ Review and analysis of new aging data of GFRP composites under accelerated
and in-service conditions, including evaluation of time-temperature superposition method for performance prediction
◦ Development and collection of natural fiber/resin composites and planning of their aging studies including test matrix
◦ Review Technical Paper "Natural Fiber Reinforced Pultruded Composites" by Bhyrav Mutnuri of Bedford Reinforced Plastics Inc
◦ Receipt of test samples for long term performance evaluation for deep seawater application (including void, post cure, knitline effects) and full spectrum of testing being started
◦ Continuation of collection of long term sorption test data ◦ Aging tests (temperature related) on natural FRP composite coupons and axial
testing of GFRP column specimens (3”x3”x72”)
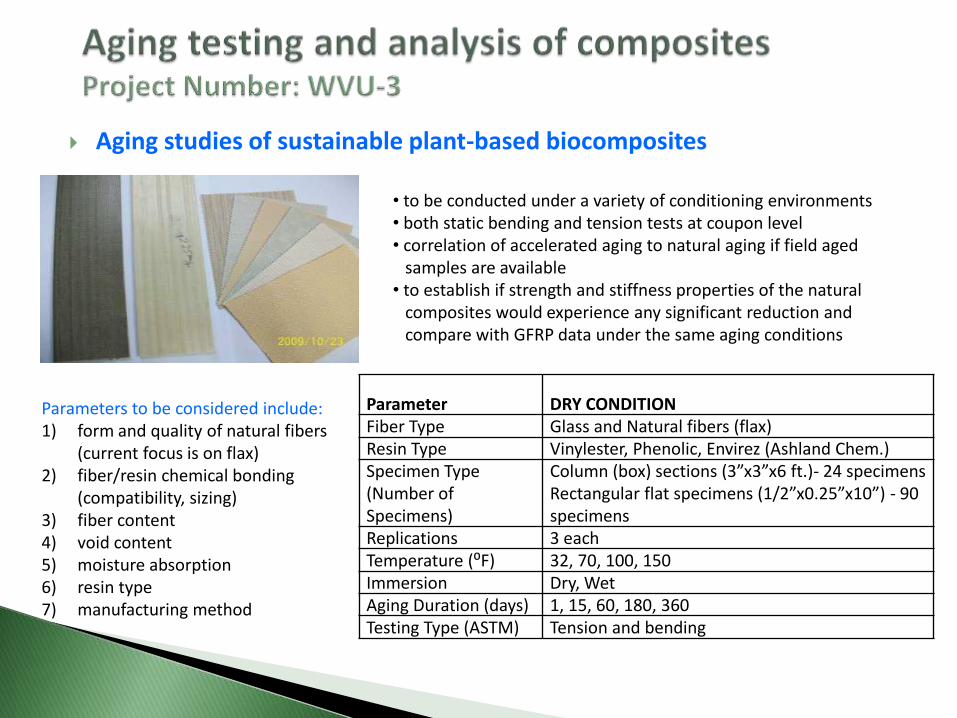
Aging studies of sustainable plant-based biocomposites
• to be conducted under a variety of conditioning environments • both static bending and tension tests at coupon level • correlation of accelerated aging to natural aging if field aged samples are available • to establish if strength and stiffness properties of the natural composites would experience any significant reduction and compare with GFRP data under the same aging conditions
Parameters to be considered include: 1) form and quality of natural fibers
(current focus is on flax) 2) fiber/resin chemical bonding
(compatibility, sizing) 3) fiber content 4) void content 5) moisture absorption 6) resin type 7) manufacturing method
Parameter DRY CONDITION Fiber Type Glass and Natural fibers (flax) Resin Type Vinylester, Phenolic, Envirez (Ashland Chem.) Specimen Type (Number of Specimens)
Column (box) sections (3”x3”x6 ft.)- 24 specimens Rectangular flat specimens (1/2”x0.25”x10”) - 90 specimens
Replications 3 each Temperature (⁰F) 32, 70, 100, 150 Immersion Dry, Wet Aging Duration (days) 1, 15, 60, 180, 360 Testing Type (ASTM) Tension and bending
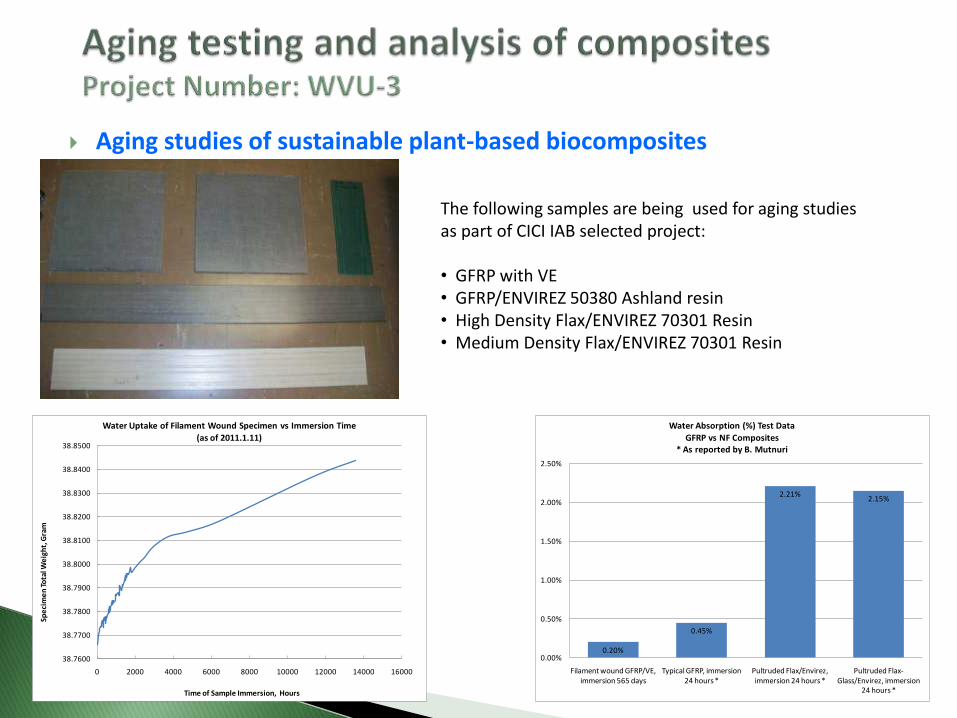
Aging studies of sustainable plant-based biocomposites
The following samples are being used for aging studies as part of CICI IAB selected project: • GFRP with VE • GFRP/ENVIREZ 50380 Ashland resin • High Density Flax/ENVIREZ 70301 Resin • Medium Density Flax/ENVIREZ 70301 Resin
38.7600
38.7700
38.7800
38.7900
38.8000
38.8100
38.8200
38.8300
38.8400
38.8500
0 2000 4000 6000 8000 10000 12000 14000 16000
Spe
cim
en
To
tal W
eig
ht,
Gra
m
Time of Sample Immersion, Hours
Water Uptake of Filament Wound Specimen vs Immersion Time
(as of 2011.1.11)
0.20%
0.45%
2.21%2.15%
0.00%
0.50%
1.00%
1.50%
2.00%
2.50%
Filament wound GFRP/VE, immersion 565 days
Typical GFRP, immersion 24 hours *
Pultruded Flax/Envirez, immersion 24 hours *
Pultruded Flax-Glass/Envirez, immersion
24 hours *
Water Absorption (%) Test Data
GFRP vs NF Composites* As reported by B. Mutnuri
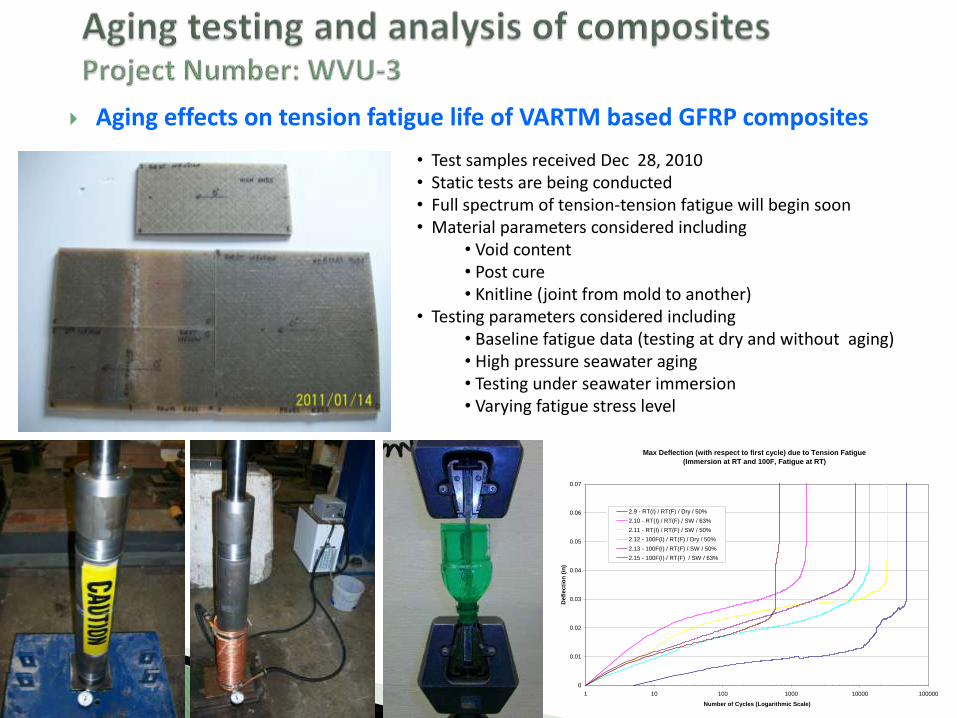
Aging effects on tension fatigue life of VARTM based GFRP composites
• Test samples received Dec 28, 2010 • Static tests are being conducted • Full spectrum of tension-tension fatigue will begin soon • Material parameters considered including
• Void content • Post cure • Knitline (joint from mold to another)
• Testing parameters considered including • Baseline fatigue data (testing at dry and without aging) • High pressure seawater aging • Testing under seawater immersion • Varying fatigue stress level
Max Deflection (with respect to first cycle) due to Tension Fatigue
(Immersion at RT and 100F, Fatigue at RT)
0
0.01
0.02
0.03
0.04
0.05
0.06
0.07
1 10 100 1000 10000 100000
Number of Cycles (Logarithmic Scale)
De
fle
cti
on
(in
)
2.9 - RT(I) / RT(F) / Dry / 50%
2.10 - RT(I) / RT(F) / SW / 63%
2.11 - RT(I) / RT(F) / SW / 50%
2.12 - 100F(I) / RT(F) / Dry / 50%
2.13 - 100F(I) / RT(F) / SW / 50%
2.15 - 100F(I) / RT(F) / SW / 63%
Aging testing and analysis of composites Project Number: WVU-3
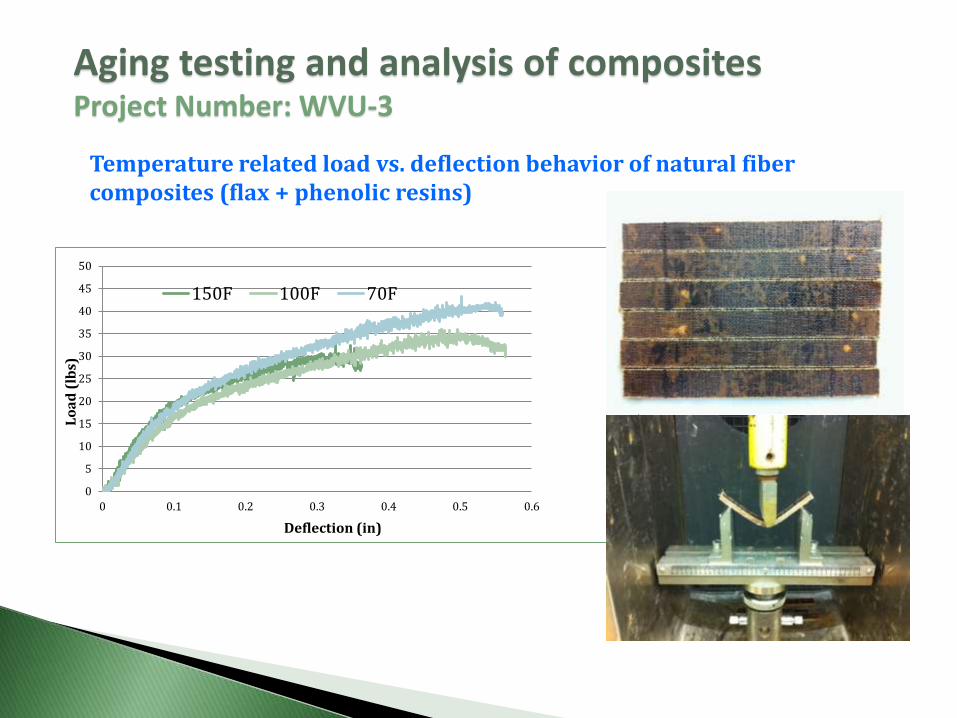
Temperature related load vs. deflection behavior of natural fiber composites (flax + phenolic resins)
0
5
10
15
20
25
30
35
40
45
50
0 0.1 0.2 0.3 0.4 0.5 0.6
Lo
ad
(lb
s)
Deflection (in)
150F 100F 70F
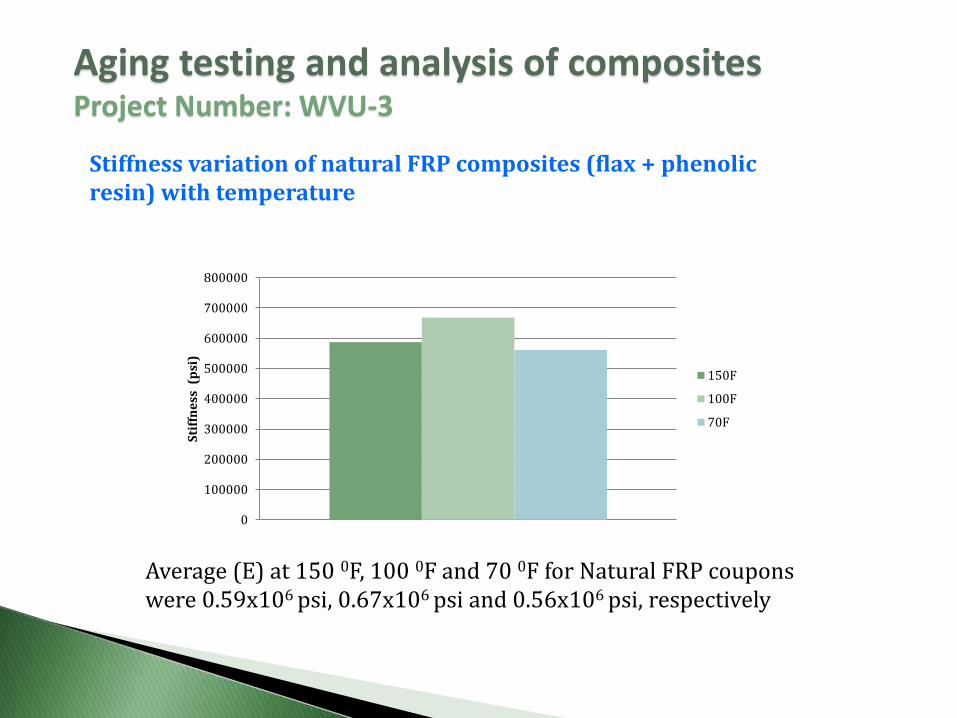
Aging testing and analysis of composites Project Number: WVU-3
Stiffness variation of natural FRP composites (flax + phenolic resin) with temperature
0
100000
200000
300000
400000
500000
600000
700000
800000
Sti
ffn
ess
(p
si)
150F
100F
70F
Average (E) at 150 0F, 100 0F and 70 0F for Natural FRP coupons were 0.59x10⁶ psi, 0.67x10⁶ psi and 0.56x10⁶ psi, respectively
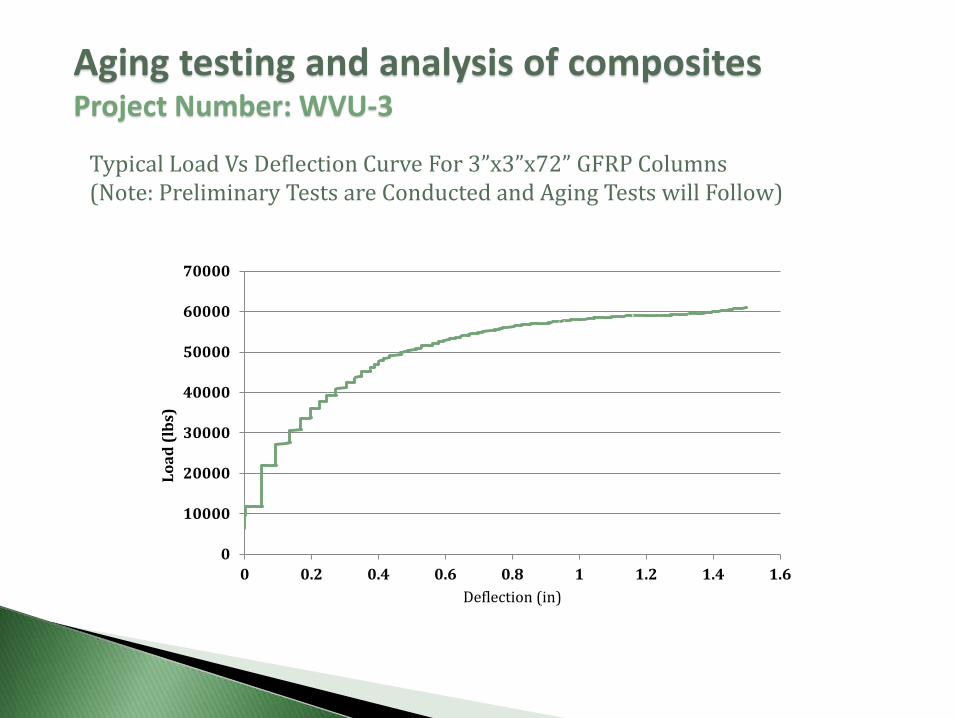
Aging testing and analysis of composites Project Number: WVU-3
Typical Load Vs Deflection Curve For 3”x3”x72” GFRP Columns (Note: Preliminary Tests are Conducted and Aging Tests will Follow)
0
10000
20000
30000
40000
50000
60000
70000
0 0.2 0.4 0.6 0.8 1 1.2 1.4 1.6
Lo
ad
(lb
s)
Deflection (in)
Ongoing work
◦ To conduct aging studies of natural fiber/resin composites at coupon level and compare their data to those of GFRP with reference to their potential applications for energy efficient buildings
◦ To conduct tension-tension fatigue tests to assess the salt-water fatigue behavior of FRP composites to arrive at safety (knock-down) factors for GFRP coupons for applications as specified by industry members
◦ Conducting aging studies for tensile and bending properties (dry/wet immersion, temperature variations for up to 360 days)
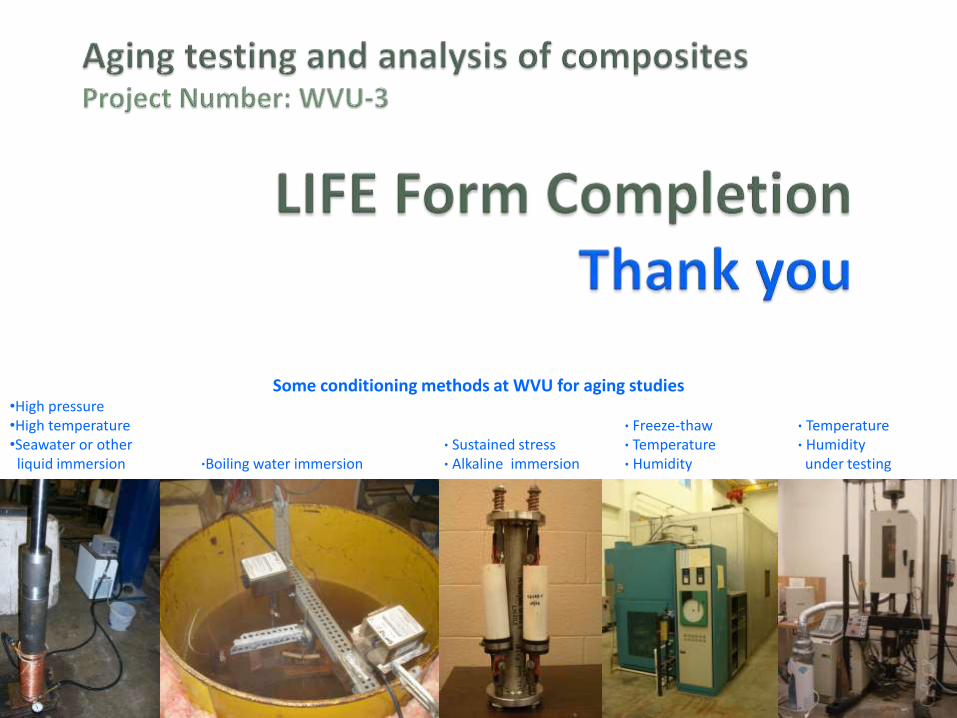
Some conditioning methods at WVU for aging studies •High pressure •High temperature ∙ Freeze-thaw ∙ Temperature •Seawater or other ∙ Sustained stress ∙ Temperature ∙ Humidity liquid immersion ∙Boiling water immersion ∙ Alkaline immersion ∙ Humidity under testing
Project Manager / PI
Udaya B. Halabe, Ph.D., P.E., ASCE Fellow
Professor West Virginia University
Department of Civil and Environmental Engineering
Morgantown, WV 26506-6103

Overview: Periodic monitoring of the FRP components is necessary for the timely
detection of subsurface defects and to ensure continued structural integrity
Infrared Thermography (IRT) is emerging as a promising nondestructive technique for this application ◦ Portable Equipment ◦ High speed data acquisition ◦ Easy data interpretation
Examples of subsurface defects that can be detected using IRT ◦ Subsurface debonds and delaminations in FRP bridge decks, FRP panels ◦ Debonds between FRP wrap and the underlying structural component ◦ In-situ evaluation of concrete bridge components prior to rehabilitation using GFRP fabrics
Past Research at WVU (2000-2009) – supported by FHWA Laboratory investigations on many Glass Fiber Reinforced Polymer (GFRP) composite
bridge deck specimens and GFRP fabric wrapped components with embedded
debonds and delaminations using digital infrared camera
- Debonds are gaps between two dissimilar layers
(e.g., wearing surface and underlying deck)
- Delaminations are defects within the flanges of an FRP deck
On-going Research at WVU (2000-Present) – supported by
USDOT-FRA and WVDOH
Field infrared testing and evaluation of :
- GFRP bridge decks
- GFRP wrapped components in timber railroad bridges
- Concrete bridge components before & after rehabilitating with GFRP wraps

IRT Monitoring System (Thermal Sensitivity 0.06-0.10oC at 30oC)

Heating Sources – Quartz Heater – Heating Blanket – Solar Radiation
Quartz Heater (1500W capacity)
Heating Blanket (1500W capacity)

Example of Laboratory Test Results
(a) (b) (c) (d) (a) Deck specimen BD2 with embedded debonds, (b) Schematic showing debond locations with air-filled
debond of size 2” x 2” x 1/16” and water-filled debonds of sizes 2” x 2” x 1/16” and 3” x 3” x 1/8”
(c) Infrared image of deck BD2, (d) deck BD2 placed in inverted position, Surface Temperature difference between defect-free and defective areas:
(a) 5.7oC (b) – 2.5oC (c) – 3.9oC

Example of Field Test Results - WVDOH
La Chein FRP Bridge, Monroe County, WV
Photograph and Infrared image of a small debond
Photograph of a crack in the wearing surface
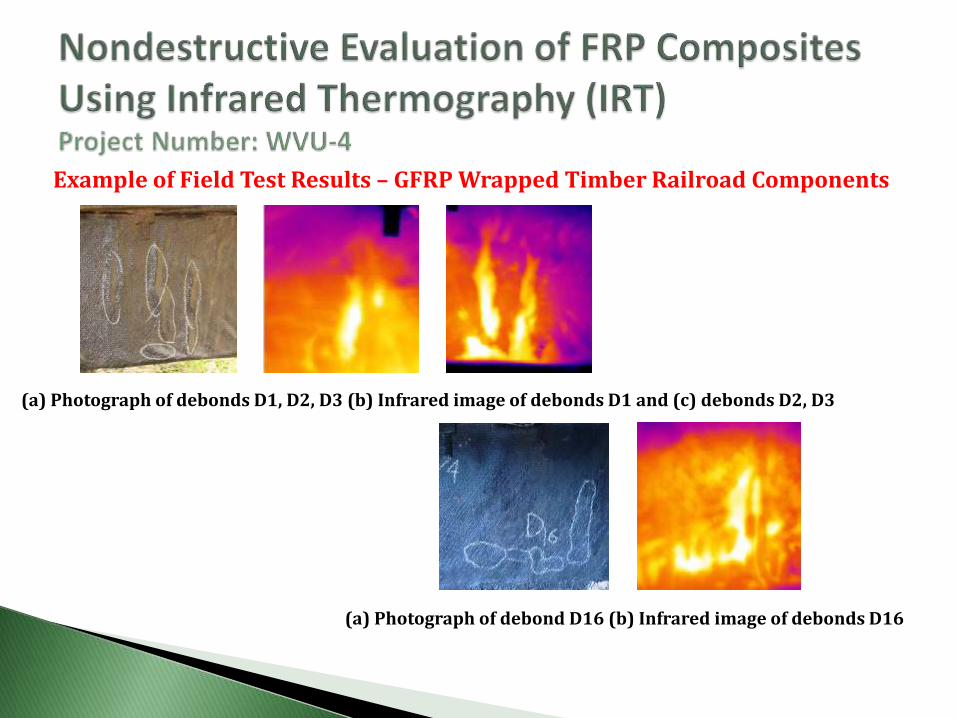
Example of Field Test Results – GFRP Wrapped Timber Railroad Components
(a) Photograph of debonds D1, D2, D3 (b) Infrared image of debonds D1 and (c) debonds D2, D3
(a) Photograph of debond D16 (b) Infrared image of debonds D16

Project Work Plan under CICI
Investigate the use of Infrared Thermography in an on-line setting for manufacturing quality control.
Develop guidelines and procedures for application of infrared thermography by field technicians and contractors for construction quality control and periodic monitoring over the service life of the structure, and prepare a comprehensive report/inspection manual with examples (case studies).
Progress Update/Budget to Date (under CICI):
Work Start Date: May 16, 2010
Budget: $40,000 per year (received ~ $20,000 so far)
Recent Activities (May 16, 2010 – present) – under CICI funding: Use of IRT in Bedford Reinforced Plastics (BRP) plant on July 8, 2010.
Literature review and collection of case studies on current IRT applications to composite components.
Infrared testing of a West Virginia concrete bridge (using direct WVDOH funding) prior to rehabilitation using GFRP fabrics
Work has commenced on preparing a comprehensive report/inspection manual on the use of IRT for nondestructive evaluation of FRP composite components in manufacturing and field setting (needed for field inspectors for quality control of initial construction and periodic in-service monitoring).

Photo and IRT image of tube sections coming out of the manufacturing die (Bedford Reinforced Plastics)
Photo and IRT image of stacked channel sections (Bedford Reinforced Plastics)
IRT image showing debonding of FRP layer in a pultruded panel during initial set up which was later adjusted to pultrude defect-free panels (Bedford Reinforced Plastics)
Photo and IRT image of a concrete pier cap that is a candidate for repair using GFRP (WVDOH)

P.V. Vijay, Ph.D.
Hota V.S. Gangarao, Ph.D., P.E.
54
Constructed Facilities Center West Virginia University
• Design/develop/evaluate modular FRP panels with efficient and cost-
effective fiber-fabric architecture & joining schemes under static and
fatigue loads.
• Static: Coupon tests
• Static: Component bending (stresses/strain/deflections)
• Fatigue: Stresses/strains, S-N curves
• Theoretically evaluate strength/stiffness of modular panels.
• Experimentally evaluate joining /anchoring schemes
• Assess durability of panels (limited work during first year)
55

0
5
10
15
20
25
30
35
40
45
room 1.5%room 2.0% 120 F 1.5%
120 F 2.0%
150 F 1.5%
150 F 2.0%
200 F 1.5%
200 F 2.0%
Ult
ima
te B
en
din
g S
tre
ss
(k
si)
56
Average Value of UBS is 30 ksi (Difft. Temp. & Catalyst)
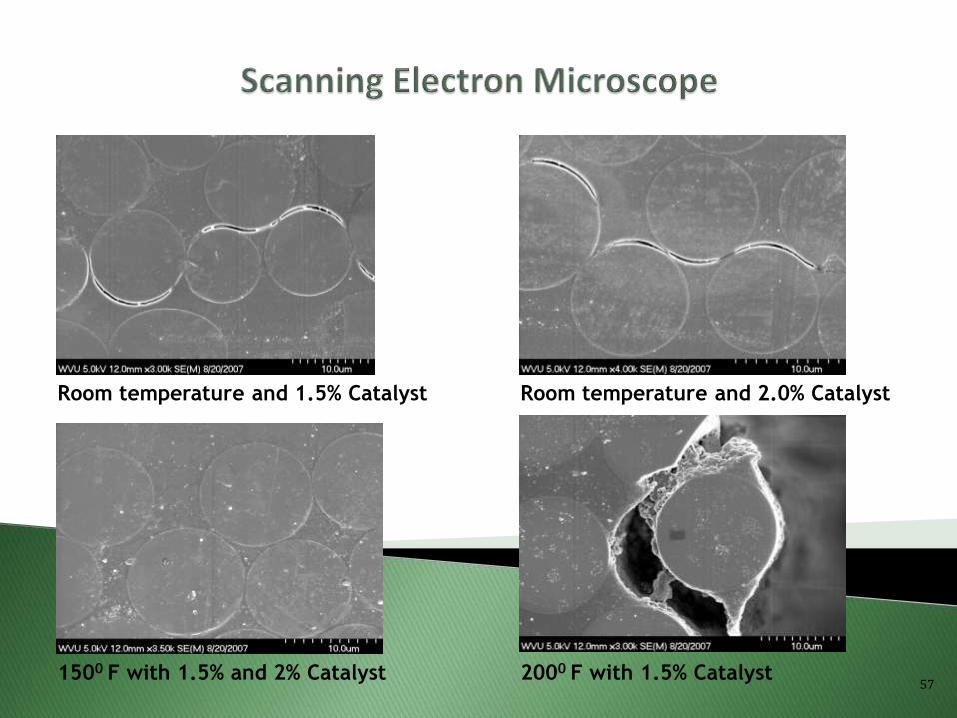
57
Room temperature and 1.5% Catalyst Room temperature and 2.0% Catalyst
1500 F with 1.5% and 2% Catalyst 2000 F with 1.5% Catalyst

0
50
100
150
200
250
0 0.1 0.2 0.3 0.4 0.5 0.6 0.7 0.8 0.9
Deflection (in)
Lo
ad
(lb
s)
58
Samples cured at 2000 F
0
50
100
150
200
250
300
350
0 0.1 0.2 0.3 0.4 0.5 0.6 0.7 0.8 0.9
Deflection (in)L
oa
d (
lbs
)
Load-Deflection Curve
Samples cured at 1500 F
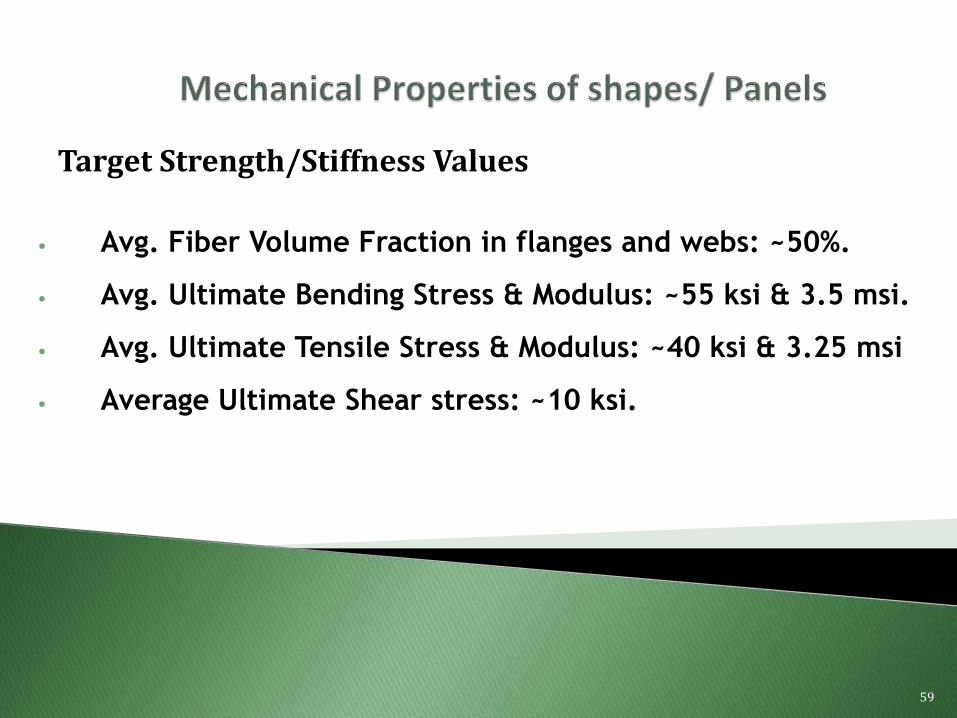
• Avg. Fiber Volume Fraction in flanges and webs: ~50%.
• Avg. Ultimate Bending Stress & Modulus: ~55 ksi & 3.5 msi.
• Avg. Ultimate Tensile Stress & Modulus: ~40 ksi & 3.25 msi
• Average Ultimate Shear stress: ~10 ksi.
59
Target Strength/Stiffness Values
60
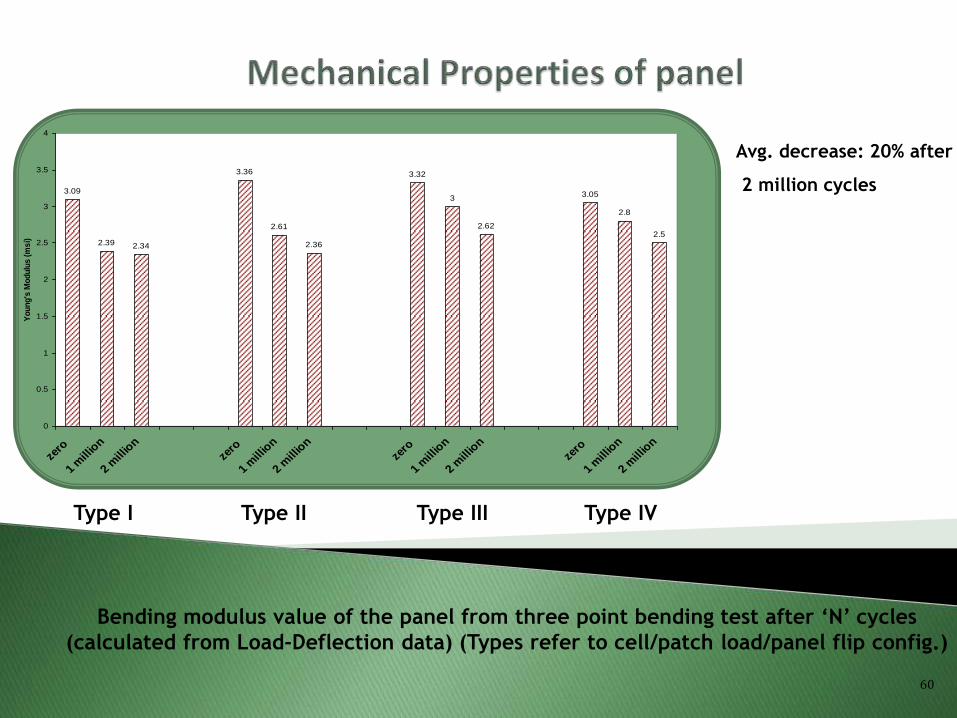
Bending modulus value of the panel from three point bending test after ‘N’ cycles
(calculated from Load-Deflection data) (Types refer to cell/patch load/panel flip config.)
Type I Type II Type III Type IV
Avg. decrease: 20% after
2 million cycles
3.09
2.39 2.34
3.36
2.61
2.36
3.32
3
2.62
3.05
2.8
2.5
0
0.5
1
1.5
2
2.5
3
3.5
4
zero
1 m
illio
n
2 m
illio
n
zero
1 m
illio
n
2 m
illio
n
zero
1 m
illio
n
2 m
illio
n
zero
1 m
illio
n
2 m
illio
n
Yo
un
g's
Mo
du
lus
(m
si)

61
View at Section AA A A
13 ft 13 ft
8.7 ft
8.7 ft
I-Beams I-Beams
Central I-beam
Edge I-beam flanges may be trimmed to obtain C-shaped channel
13 ft
8.7 ft
Direction of hollow core cells
FILED CONNECTION LAYOUT
62
• Asphalted FRP panels are performing very well.
• Joining schemes with shimmed FRP I-sections and glassing
schemes need tight fit without shimming for future
installations.
• Pavement surface characteristics (ridability, surface cracks,
support condition at pavement junctions) have remained
practically unchanged over the summer and winter
temperatures (freeze-thaw, hot and cold temperatures).
FUTURE WORK/SUMMARY
• Coupon results from static and fatigue tests will be evaluated.
• Durability tests are beginning to be conducted on coupons from
FRP panels/ components (dry and wet conditions with
temperatures up to 150 F),
• The field installed panels are performing as per the design and
the joining schemes require additional modifications and
research for proper load transfer.
• Design methodology for modular panels is being developed and
will be refined with information from additional test/field data.
63