Embed Size (px)
Citation preview

January 6, 2016
Site Feasibility Report
Your File No.N/A
Proposed Pio Nono Avenue Site1095 Pio Nono Avenue
Macon
GEORGIA
31204
COMPLETED FOR:
Bob Fountain
BobFountain
(478) 747-9577
Processed with PetroMARK® Valuation Software
COPYRIGHT © 2015 C-STORE EVALUATIONS LLC. ALL RIGHTS RESERVED.

20
Email:
Website:
www.PetroREPORT.com
$499 NATIONWIDE | 72 HOURS
C - S T O R E E V A L U A T I O N S L L C
A SPECIALIZED FINANCIALSERVICES PROVIDER OF C-STORE VALUATIONS
D A L L A S, T E X A S
FOR CURRENT INDUSTRY INFORMATION, PLEASE VISIT US AT: w w w . c s t o r e v a l u e . c o m
C-Store Valuations | Suite 110, Mail Box 237 | 4447 N. Central Expressway | Dallas, TX 75205

Table of Contents
Overall Site Feasibility ………………………………………………………………………3
Feasibility Summary Four Development Options ………………………………………4
Trade Area Dignostic Ratios Panel ………………………………………………………..5
Projected Market Value Summary ........................................................................................................... 6
Valuation Diagnostic Ratios Panel …………............................................................................................. 7
Intended User/Client Identification …………………………………………………………………………..8
Site Feasibility Methodology…………………………………………………………………9
Step 1: Trade Area Analysis .............................................................................................. 11
Step 2: Gallonage and Sales Projections .................................................................................. 12
Step 3: Calculation of Adjusted EBITDA ................................................................................................... 13
Step 4: Capitalization of Earnings ....................................................................................................... 14
Recent National Value Trends for NAICS 4457 ........................................................................................... 15
Value Check: Peer-Group Transaction Data ................................................................................... 16
Step 5: Estimated Development Costs ………………………………………………….17
Step 6: Economic Value of the Site (Option 1: Store and Fuel Service) ………………………………………….18
Step 6: Economic Value of the Site (Option 2: Add Car Wash) ………………………………………….19
Step 6: Economic Value of the Site (Option 3: Add Food Service) ………………………………………….20
Step 6: Economic Value of the Site (Option 4: Add Car Wash + Food Service) ………………………………………….21
Mortgage Loan Metrics …………………………………………………………………….22
Equipment Valuation ………………………………………………………………………23
Preparer’s Certification ................................................................................................................................24
Appendix
Sources
How Retail Property Value is Created
Photographs
Trade Area Aerials/Maps
Supplemental Report Provisions
For more information:
www.PetroREPORT.com
COPYRIGHT © 2016 C-STORE EVALUATIONS LLC. ALL RIGHTS RESERVED.

Proposed Pio Nono Avenue Site
COMMENTS 2
Hypermarket Threat
Supply and Demand
Customer Propensity to Shop at a Convenience Store
Access
Visibility
Traffic Count
Raised Medians
Corner Location
COMMENTS
1. Because of a high hypermarket threat and a low supply and demand
threshold, this site is not a strong candidate for fuel sales.
2. Because of the low potential for fuel sales here, additional profit
centers, such as a car wash and/or branded fast food are required to
make this site feasible for convenience retail development.
3. Four development options and the resulting economic land values
are summarized on the following page.
COPYRIGHT © 2016 C-STORE EVALUATIONS LLC. ALL RIGHTS RESERVED.
0 1 2 3 4 5 6 7 8 9 10
UNACCEPTABLE ACCEPTABLE
OVERALL SITE FEASIBILITY

Proposed Pio Nono Avenue Site
FEASIBILITY SUMMARY 3
Proposed Pio Nono Avenue Site
OPTION 1 OPTION 2 OPTION 3 OPTION 4ADD
C-STORE ADD ADD CAR WASH +
WITH FUEL SERVICE CAR WASH FOOD SERVICE FOOD SERVICE
SITUSSite Size (acres) 1.25 1.25 1.25 1.25Store Size (SF) 3,000 3,000 2,000 2,000Food Service Size (SF) 0 0 1,000 1,000Fuel Positions 8 8 8 8
PROJECTED OPERATIONSProjected Annual Gallons 1,005,000 1,005,000 1,005,000 1,005,000Projected Merchandise Sales $1,229,287 $1,229,287 $819,525 $819,525Projected Food Service Sales $0 $0 $534,050 $534,050Projected Car Wash Sales $0 $53,405 $0 $53,405Projected Gross Margin % 11.9% 12.8% 15.1% 15.9%Projected Annual Gross Profit $ $444,728 $484,812 $585,059 $625,143
SITE FEASIBILITYWhole Property Market Value at Completion $1,236,000 $1,363,000 $1,653,000 $1,829,000Less: Cost of Store $450,000 $450,000 $450,000 $450,000Less: Cost of Fuel Service $448,000 $448,000 $448,000 $448,000Less: Cost of Site Improvements $102,900 $102,900 $102,900 $102,900
Less: Cost of Car Wash $0 $100,000 $0 $100,000
Economic Value of the Proposed Site $ $235,100 $262,100 $652,100 $728,100
Economic Value of the Proposed Site PSF $4.32 $4.81 $11.98 $13.37
COPYRIGHT © 2016 C-STORE EVALUATIONS LLC. ALL RIGHTS RESERVED.

HYPERMARKET THREAT IS HIGH.
Miles from Subject.
0.30
THE TRADE AREA IS OVER-SUPPLIED.
Location Quotient.
0.66
Propensity to Shop at a Convenience Store.
0.42
COPYRIGHT © 2016 C-STORE EVALUATIONS LLC. ALL RIGHTS RESERVED.
T R A D E A R E A D I A G N O S T I C R A T I O S
THE SPI IS LOW COMPARED TO THE
NATIONAL AVERAGE.
0 1 2 3 4 5
HYPERMARKET THREAT
0.0 0.5 1.0 1.5 2.0
TRADE AREASUPPLY AND DEMAND
0.00 1.00 2.00LOW MODERATE HIGH
SPENDING POTENTIAL INDEX
OVER-SUPPLIED AT BALANCE UNDER-SUPPLIED
LOW MODERATE HIGH

Proposed Pio Nono Avenue Site
PROJECTED MARKET VALUE SUMMARY 5
SitusStore Number 1Brand NoneStreet Address 1095 Pio Nono AvenueCity MaconCounty BibbState GEORGIAZip Code 31204Owner UnknownAssessment Number N/AAssessed Value N/ASale Price Last 5 Years None
Physical CharacteristicsSite Size (Sq. Ft.) 54,450Store Size (Sq. Ft.) 3,000Fueling Positions 8Car Wash 0Year Built/Major Remodel 2016Effective Age 1
FAIR
MARKET VALUE
Real Property ValueTANGIBLE ASSETS, REALTY(Site, Store Building, Canopy, Fuel Dispensers, USTs, ElectronicsCar Wash and all associated systems, if any)
FF&E ValueTANGIBLE ASSETS, NON-REALTY(Moveable Personal Property)
Business Enterprise ValueINTANGIBLE ASSETS(Capitalized Accounting and Economic Profit)
Going Concern ValueTOTAL ASSESTS OF THE BUSINESS (Fee Simple)
LEASED FEE VALUE
RECOMMENDED FAIR MARKET VALUES
OPTION 1: Store and Fuel Service OnlyBASED ON EARNINGS CAPITALIZATION AND ASSUMING 100% FAIR MARKET VALUE
COPYRIGHT © 2016 C-STORE EVALUATIONS LLC. ALL RIGHTS RESERVED.
$1,236,000
$58,000
$74,000
$1,368,000
N/A
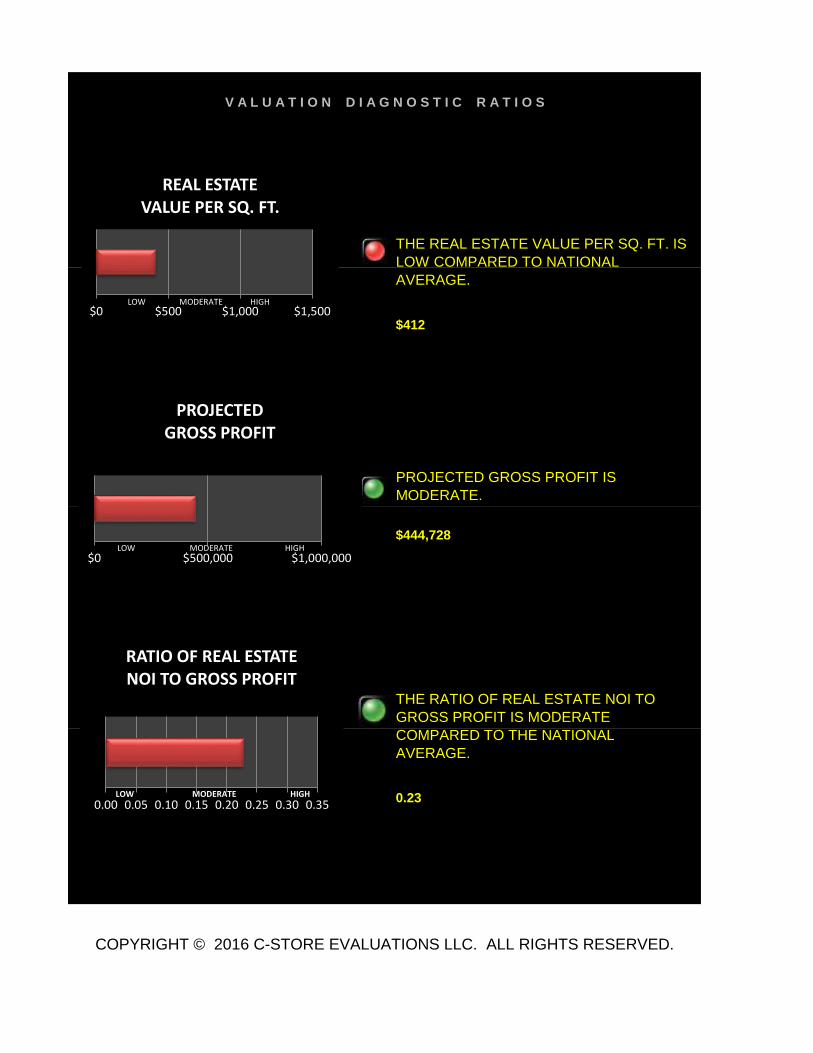
$412
$444,728
0.23
V A L U A T I O N D I A G N O S T I C R A T I O S
THE REAL ESTATE VALUE PER SQ. FT. IS
LOW COMPARED TO NATIONAL
AVERAGE.
PROJECTED GROSS PROFIT IS
MODERATE.
COPYRIGHT © 2016 C-STORE EVALUATIONS LLC. ALL RIGHTS RESERVED.
THE RATIO OF REAL ESTATE NOI TO
GROSS PROFIT IS MODERATE
COMPARED TO THE NATIONAL
AVERAGE.
$0 $500 $1,000 $1,500
REAL ESTATE VALUE PER SQ. FT.
$0 $500,000 $1,000,000
PROJECTEDGROSS PROFIT
0.00 0.05 0.10 0.15 0.20 0.25 0.30 0.35LOW MODERATE HIGH
RATIO OF REAL ESTATE NOI TO GROSS PROFIT
LOW MODERATE HIGH
LOW MODERATE HIGH

Proposed Pio Nono Avenue Site
7
CLIENT FILE NO. N/A
PROJECT NAME Proposed Pio Nono Avenue Site
STATE JURISDICTION Georgia
DATE OF EVALUATION January 6, 2016
INTENDED USER(S) Bob Fountain
CLIENT BobFountain
Client Name Bob Fountain
Street Address (478) 747-9577
City, State, Zip [email protected]
PURPOSE Site Feasibility
STUDY LOCATION Proposed Pio Nono Avenue Site
Street Address 1095 Pio Nono Avenue
City Macon
State GEORGIA
Zip 31204
County Bibb
OWNER Unknown
BRAND None
PROPERTY TYPE NAICS 4471:convenience store/motor fuel sales
STORE NUMBER 1
ADMINISTRATIVE DETAILS
Assessment Number N/A
Assessed Value N/A
Sale Price Last 5 Years None
Year Built/Remo 2016
Our File No. 16-3001Fountain
Actual Age 0
Flood Map No. 13021C0133F
Census Tract No. 0103.00
Flood Map Date 4/2/2007
Flood Zone No
INTENDED USER/CLIENT IDENTIFICATION
COPYRIGHT © 2016 C-STORE EVALUATIONS LLC. ALL RIGHTS RESERVED.
Proposed Pio Nono Avenue Site
SITE FEASIBILITY METHODOLOGY 9
COPYRIGHT © 2016 C-STORE EVALUATIONS LLC. ALL RIGHTS RESERVED.
Step 1: Trade Area Analysis An earnings capitalization approach begins with a supply and demand analysis of the trade area. A typical convenience store will draw 70% to 80% of its customers from the primary trade area. A successful location requires at least 2,500 people per store within a 2-3 mile radius of the store. Hypermarket competition is a significant competitive disadvantage for a traditional convenience store.
Step 3: Calculation of Adjusted EBITDA is then made, which is the gross economic return to all the assets of the business. After allocating the earnings to FF&E and the business enterprise, the residual earnings is the amount earned by the real estate.
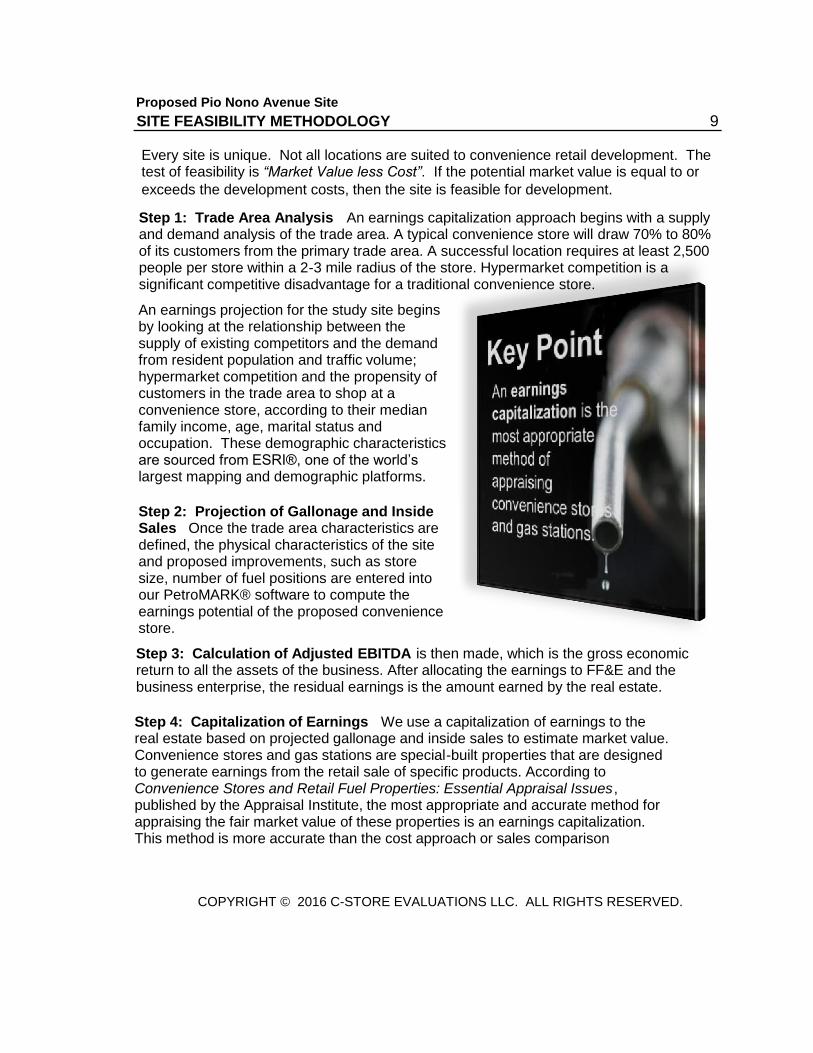
Step 4: Capitalization of Earnings We use a capitalization of earnings to the real estate based on projected gallonage and inside sales to estimate market value. Convenience stores and gas stations are special-built properties that are designed to generate earnings from the retail sale of specific products. According to Convenience Stores and Retail Fuel Properties: Essential Appraisal Issues, published by the Appraisal Institute, the most appropriate and accurate method for appraising the fair market value of these properties is an earnings capitalization. This method is more accurate than the cost approach or sales comparison
Every site is unique. Not all locations are suited to convenience retail development. The test of feasibility is “Market Value less Cost”. If the potential market value is equal to or
exceeds the development costs, then the site is feasible for development.
An earnings projection for the study site begins by looking at the relationship between the supply of existing competitors and the demand from resident population and traffic volume; hypermarket competition and the propensity of customers in the trade area to shop at a convenience store, according to their median family income, age, marital status and occupation. These demographic characteristics are sourced from ESRI®, one of the world’s largest mapping and demographic platforms.
Step 2: Projection of Gallonage and Inside Sales Once the trade area characteristics are defined, the physical characteristics of the site and proposed improvements, such as store size, number of fuel positions are entered into our PetroMARK® software to compute the earnings potential of the proposed convenience store.
Proposed Pio Nono Avenue Site
SITE FEASIBILITY METHODOLOGY 10
COPYRIGHT © 2016 C-STORE EVALUATIONS LLC. ALL RIGHTS RESERVED.
Step 5: Estimating Development Costs The construction costs of the store building, fuel service, site improvements and other structures are then deducted from the estimated market value. These cost estimates are either furnished by the prospective operator or are sourced from The Marshall Valuation Service, a recognized supplier of building cost data.
Step 6: Economic Value of the Site The difference between the market value of the whole property and the construction costs is the residual economic value of the site when used as a convenience store. This is not the market value of the site, but rather is the maximum price a convenience store operator could afford to pay for the site without incurring an economic loss.
The Reported ResultsThe economic value of the site under study will vary depending on the intensity of development. Additional profit centers, such as a car wash and/or branded food service will often increase the economic value of a site because earnings capacity is expanded through a more intensive use of the site.
For this reason, Four Feasibility Optoions have been calculated by our software.
Option 1: Store and fuel service only;
Option 2: Store, fuel service and a car wash;
Option 3: Store, fuel service and branded food service;
Option 4: Store, fuel service, car wash and branded food service.
Not all sites can physically accommodate a car wash or branded food service. In our methodology, the value-added of a car wash or branded food service is based on the assumptions that (1) The site is physically suitable, and (2) No competitors for these services exist within the 1-minute drive-time. If the study site is too small, or if nearby competitors for these services already exist, then the feasibility results in Options 2 – 4 should be disregarded, or at least conservatively measured.
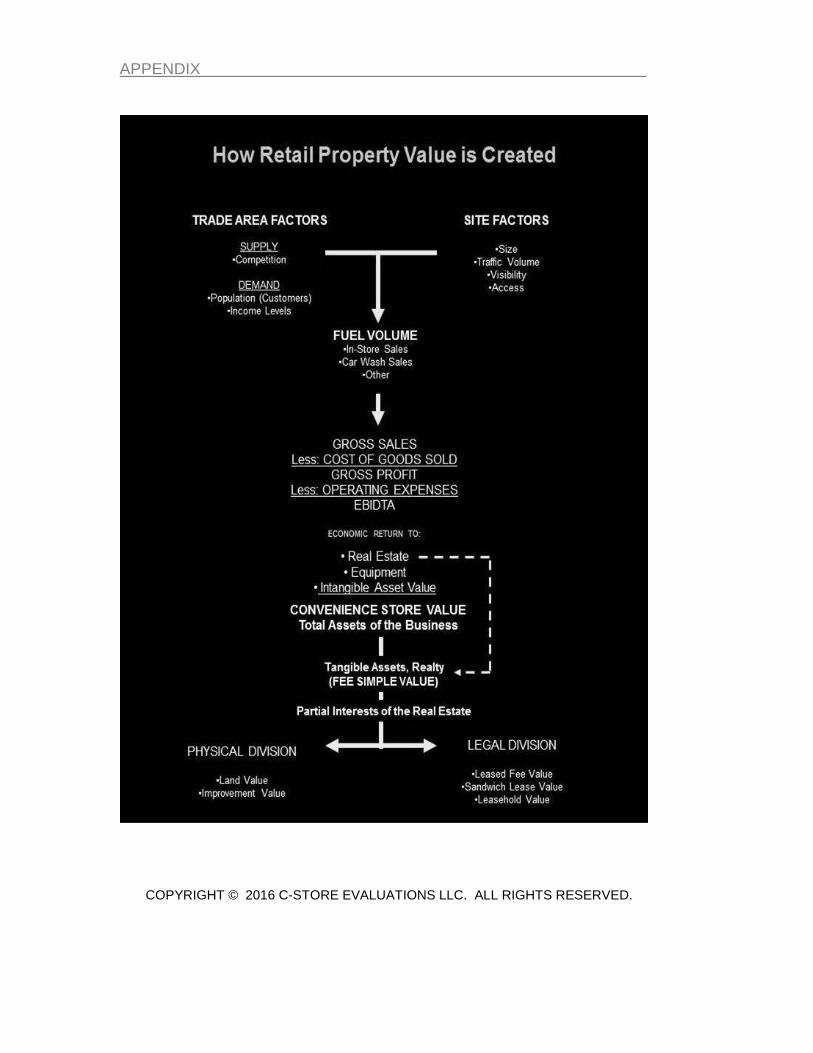
approach. An earnings capitalization approach best reflects the actions of actual buyers and sellers of convenience stores and gas stations. Stores and locations with poor earnings have lower real estate values than those with better. A graphic of this process is shown in the Appendix.

Proposed Pio Nono Avenue Site
SITE FEASIBILITY ANALYSIS 11
Step 1: Trade Area Analysis
Trade Area Characteristics
Primary Market Population 8,334
Secondary Market Population N/A
Primary Market Competition 6
Location Quotient 0.66
ESRI® Retail Spending Potential Index 0.42
Traffic Volume (Average Vehicles per Day) 25,000
Hypermarket Competition Yes
COPYRIGHT © 2016 C-STORE EVALUATIONS LLC. ALL RIGHTS RESERVED.
The Primary Trade Area for convenience retail property is generally the 3-minute drive-time or the 2-mile ring. The following population and competitive levels are sourced from ESRI® Business Analyst.
Hypermarket competition is the most significant threat to the profit of a traditional convenience store or gas station. A hypermarket is a large format discount retailer that sells department store merchandise, groceries and gasoline. Typically, hypermarkets sell three times the volume of gasoline of a traditional convenience store at a discount of 5 to 7 cents per gallon of the retail price. Often, the retail street price of gasoline at the hypermarket is less than the wholesale cost to the convenience store operator.
The characteristics for the subject store’s primary trade area, including supply and demand, resident demographics, and hypermarket competition, are summarized below. This trade area data is sourced from ESRI®. A map of the trade area is included in the appendix.

Proposed Pio Nono Avenue Site
SITE FEASIBILITY ANALYSIS 12
Step 2: Gallonage and Sales Projections
PetroMARK®
PHYSICAL FACTORS
Fuel Positions 8
Store Size 3,000
Access 2
Traffic Count 3
Day Parts 2
ECONOMIC FACTORS
Location Quotient 0.66
ESRI Supply/Demand 1
ESRI Spending Potential Index 0.42
PROJECTED ANNUAL GALLONAGE 1,005,000
PROJECTED FUEL MARGIN (CPG) $0.11
PROJECTED MERCHANDISE SALES (PSF) $410
OPTIONAL BRANDED FOOD SERVICE SALES (PSF) $534
OPTIONAL ANNUAL CAR WASH SALES $53,405
COPYRIGHT © 2016 C-STORE EVALUATIONS LLC. ALL RIGHTS RESERVED.
Gallonage and Sales Calculator
FEE SIMPLE INTEREST UNDER TYPCIAL OWNERSHIP AND MANAGEMENT
Using the subject’s physical features, such as site size, store size, age, fueling positions, and trade area characteristics which measure supply and demand, the subject’s gallonage and sales potential can be estimated. Our PetroMARK® Software uses this data along with operating statistics published by The National Association of Convenience Stores and the Oil Pricing Information Service to project the gallons of fuel sold (gallonage) and sales potential of the subject store assuming fee simple ownership and typical management.
These projections of gallonage and sales are not based on the actual ownership or existing branding agreements. The existing branding and management do not represent fee simple ownership, and therefore should not be the basis for a fair market value projection of gallonage and sales.
The following page summarizes our Adjusted EBITDA calculations based on the gallonage and sales projections in the table below.

Proposed Pio Nono Avenue Site
SITE FEASIBILITY ANALYSIS
Step 3: Calculation of Adjusted EBITDA
COST OF GROSS
GROSS SALES GOODS SOLD PROFIT
1 Motor Fuel2 Gallonage 1,005,0003 Price per Gallon $2.504 Gross Fuel Sales $2,512,5005 Cost of Goods Sold $2,401,6996 Motor Fuel Gross Profit $110,8017 Fuel Margin Cents per Gallon $0.11
8 Inside Sales9 In-Store Sales $1,229,287
10 Cost of Goods Sold $895,36111 In-Store Gross Profit $333,92712 In-Store Margin 27%13 In-Store Sales Per Sq. Ft. $410
14 Food Service Sales $015 Cost of Goods Sold $016 Food Service Gross Profit $017 Food Service Margin #DIV/0!
18 Inside Sales Gross Profit $333,92719 Inside Margin 27%
20 Car Wash Sales $021 Cost of Goods Sold $022 Car Wash Gross Profit $023 Car Wash Margin #DIV/0!
24 Total Gross Sales $3,741,787
25 Total Gross Profit $444,72826 Gross Profit Margin 12%27 Motor Fuel Contribution Ratio 25%27 In-Store Contribution Ratio 75%29 Car Wash Contribution Ratio 0%
30 Product Shrink 0.23% $8,419
31 Operating Expenses% GROSS PROFIT
32 Labor 35% $155,65533 Credit Card Fees 8% $35,57834 Utilities 6% $26,68435 Other 8% $36,46836 Sub-total Operating Expenses 57% $254,384
37 Adjusted EBITDA 41% $181,925
OPTION 1: Adjusted EBITDA Projection
COPYRIGHT © 2016 C-STORE EVALUATIONS LLC. ALL RIGHTS RESERVED.
13

Proposed Pio Nono Avenue Site
SITE FEASIBILITY ANALYSIS 14
Step 4: Capitalization of Earnings
ADJUSTED EBITDA $181,925
(Gross Return to Assets)
Asset Allocation of Earnings
Earnings to FF&E $18,239
Earnings to Accounting Profit $37,000
Earnings to Economic Profit $0
Residual Earnings to Real Estate $126,685
Less: Real Estate Operating Expenses $25,337
Add: Other Real Estate Net Income $0
Net Operating Income to Real Estate $101,348
Economic Gross Rent per Sq. Ft. $42.23
Economic Net Rent per Sq. Ft. $33.78
Capitalization of Fee Simple Earnings
CAPITALIZATION
RATE
1. Real Property Value 8.2%
TANGIBLE ASSETS, REALTY
(Site, Store Building, Canopy, Fuel Dispensers, USTs, Electronics)
2. FF&E Value 25%
TANGIBLE ASSETS, NON-REALTY
(Moveable Personal Property)
3. Business Enterprise Value 50%
INTANGIBLE ASSETS
(Capitalized Accounting and Economic Profit)
Going Concern Value
TOTAL ASSETS OF THE BUSINESS
$74,000
$1,368,000
COPYRIGHT © 2016 C-STORE EVALUATIONS LLC. ALL RIGHTS RESERVED.
VALUE
$1,236,000
$58,000
Adjusted EBITDA is the gross return to the assets of the business. These business assets include three categories: 1. tangible assets, realty; 2. tangible assets, non-realty; and 3. intangible assets.
The earnings allocation and capitalization rates are shown below.

Proposed Pio Nono Avenue Site
SITE FEASIBILITY ANALYSIS 15
National Transaction Statistics
The national 3-year rolling average value per square foot is: $546
The estimated value per square foot of the subject real estate is: $412
COPYRIGHT © 2016 C-STORE EVALUATIONS LLC. ALL RIGHTS RESERVED.
$800,000
$1,000,000
$1,200,000
$1,400,000
$1,600,000
$1,800,000
2010 2011 2012 2013 2014
USA AVERAGE C-STORE SALE PRICES(REAL ESTATE ONLY)
2010 TO 2014
Convenience store real estate prices are rising. In the first half of 2014, the average price of the real estate associated with convenience stores was $1.3 million. This includes the site, store building, and fuel service. This is an increase of 13% from the 2010 average price.
The median price showed a similar increase over the same period of 9%.(Source: CoStar)
CoStar’s Commercial Property Resale Price Index (CPRPI) indicates that retail property prices began stabilizing in 2012. We do not anticipate systemic price declines over the next 24 months.

Proposed Pio Nono Avenue Site
SITE FEASIBILITY ANALYSIS 16
Value Range Check: Peer Group Transaction Data
NAICS 4471
Georgia C-Store Real Estate Sales
SALE STORE YR BLT SITE PRICE
SALE DATE LOCATION PRICE SIZE REMO SIZE SQ.FT.
1 2014 Locust Grove $1,360,000 5,343 2004 1.95 $255
2 2014 Smyrna $1,375,000 2,471 1987 0.75 $556
3 2013 Atlanta $1,281,000 1,380 1984 0.72 $928
4 2013 Thomasville $1,500,000 8,393 199 0.84 $179
5 2013 Gainsville $1,600,000 5,200 2006 1.95 $308
6 2013 Lawrenceville $2,675,000 4,000 2003 1.74 $669
7 2012 Stone Mountain $1,300,000 3,299 1997 0.87 $394
8 2012 Smyrna $1,300,000 1,632 1988 1.2 $797
9 2012 Cumming $1,340,000 2,160 1997 0.98 $620
LOW $179
HIGH $928
MEDIAN $556
AVERAGE $523
The average value per square foot of store building area is: $556
The median value per square foot of store building area is: $523
The estimated value of the subject per square foot of store area is: $412
COPYRIGHT © 2016 C-STORE EVALUATIONS LLC. ALL RIGHTS RESERVED.
Peer group sales of convenience stores with gas stations (NAICS 4471) located near the subject property are summerized below.

Proposed Pio Nono Avenue Site
SITE FEASIBILITY ANALYSIS 17
Step 5: Estimated Development Costs
Improvement Development Cost Summary
SECTION A
Store Building
Base Cost Per Sq. Ft. $150.00
Local Multiplier 1
Current Cost Multiplier 1
Applicable Cost per Sq. ft. $150.00
Size: 3,000
Extension: $450,000
SECTION B
Fuel Service
Base Cost Per Fueling Position $56,000
Local Multiplier 1
Current Cost Multiplier 1
Applicable Cost per Sq. ft. $56,000
Fueling Positions 8
Extension: $448,000
SECTION C
Site Improvements
Base Cost Per Sq. Ft. $2.00
Local Multiplier 1
Current Cost Multiplier 1
Applicable Cost per Sq. ft. $2.00
Size: 51,450
Extension: $102,900
OTHER: CAR WASH $0
TOTAL SECTIONS A+B+C
Total Improvement Replacement Cost $1,000,900
COPYRIGHT © 2016 C-STORE EVALUATIONS LLC. ALL RIGHTS RESERVED.

Proposed Pio Nono Avenue Site
FEASIBILITY SUMMARY 18
Step 6: Economic Value of the SiteProposed Pio Nono Avenue Site
OPTION 1: Store and Fuel Sales Only
SITUSSite Size (acres) 1.25Store Size (SF) 3,000Fuel Positions 8Food Service Size (SF) 0Car Wash No
PROJECTED OPERATIONSProjected Annual Gallons 1,005,000Projected Merchandise Sales $1,229,287Projected Food Service Sales $0Projected Car Wash Sales $0Projected Gross Margin % 12%Projected Annual Gross Profit $ $444,728
SITE FEASIBILITYWhole Property Market Value at Completion $1,236,000Less: Cost of Store $450,000Less: Cost of Fuel Service $448,000Less: Cost of Site Improvements $102,900Less: Cost of Car Wash $0
Economic Value of the Proposed C-Store Site $ $235,100Economic Value of the Proposed C-Store Site PSF $4.32
COPYRIGHT © 2016 C-STORE EVALUATIONS LLC. ALL RIGHTS RESERVED.

Proposed Pio Nono Avenue Site
FEASIBILITY SUMMARY 19
Step 6: Economic Value of the SiteProposed Pio Nono Avenue Site
OPTION 2: Store, Fuel Sales + Car Wash
SITUSSite Size (acres) 1.25Store Size (SF) 3,000Fuel Positions 8Food Service Size (SF) 0Car Wash Yes
PROJECTED OPERATING METRICS FOR THIS SITEProjected Annual Gallons 1,005,000Projected Merchandise Sales $1,229,287Projected Food Service Sales $0Projected Car Wash Sales $53,405Projected Gross Margin % 13%Projected Annual Gross Profit $ $484,812
SITE FEASIBILITYWhole Property Market Value at Completion $1,363,000Less: Cost of Store $450,000Less: Cost of Fuel Service $448,000Less: Cost of Site Improvements $102,900Less: Cost of Car Wash $100,000
Economic Value of the Proposed C-Store Site $ $262,100Economic Value of the Proposed C-Store Site PSF $4.81
COPYRIGHT © 2016 C-STORE EVALUATIONS LLC. ALL RIGHTS RESERVED.

Proposed Pio Nono Avenue Site
FEASIBILITY SUMMARY 20
Step 6: Economic Value of the SiteProposed Pio Nono Avenue Site
OPTION 3: Store, Fuel Service + Branded Food Service
SITUSSite Size (acres) 1.25Store Size (SF) 2,000Fuel Positions 8Food Service Size (SF) 1,000Car Wash No
PROJECTED OPERATING METRICS FOR THIS SITEProjected Annual Gallons 1,005,000Projected Merchandise Sales $819,525Projected Food Service Sales $534,050Projected Car Wash Sales $0Projected Gross Margin % 15%Projected Annual Gross Profit $ $585,059
SITE FEASIBILITYWhole Property Market Value at Completion $1,653,000Less: Cost of Store $450,000Less: Cost of Fuel Service $448,000Less: Cost of Site Improvements $102,900Less: Cost of Car Wash $0
Economic Value of the Proposed C-Store Site $ $652,100Economic Value of the Proposed C-Store Site PSF $11.98
COPYRIGHT © 2016 C-STORE EVALUATIONS LLC. ALL RIGHTS RESERVED.

Proposed Pio Nono Avenue Site
FEASIBILITY SUMMARY 21
Step 6: Economic Value of the Site
Proposed Pio Nono Avenue SiteOPTION 4: Store, Fuel Service + Car Wash + Branded Fuel Service
SITUSSite Size (acres) 1.25Store Size (SF) 2,000Fuel Positions 8Food Service Size (SF) 1,000Car Wash Yes
PROJECTED OPERATING METRICS FOR THIS SITEProjected Annual Gallons 1,005,000Projected Merchandise Sales $819,525Projected Food Service Sales $534,050Projected Car Wash Sales $53,405Projected Gross Margin % 16%Projected Annual Gross Profit $ $625,143
SITE FEASIBILITYWhole Property Market Value at Completion $1,829,000Less: Cost of Store $450,000Less: Cost of Fuel Service $448,000Less: Cost of Site Improvements $102,900Less: Cost of Car Wash $100,000
Economic Value of the Proposed C-Store Site $ $728,100Economic Value of the Proposed C-Store Site PSF $13.37
COPYRIGHT © 2016 C-STORE EVALUATIONS LLC. ALL RIGHTS RESERVED.

Proposed Pio Nono Avenue Site
PROJECTED MARKET VALUE SUMMARY 22
Mortgage LoanTechnical Summary
Insurable Replacement Cost $875,500
Exposure Time 3 to 12 mo
Marketing Time 3 to 12 mo
Remaining Economic Life 50 yrs
NOI to Real Estate and Debt Service Analysis:
Estimated Value of Real Estate $1,236,000
Adjusted EBIDTA $181,925
Less: Return to Tangible Assets, Non-Realty $18,239
Less: Real Estate Operating Expenses (Property Taxes, Maintenance.etc) $25,337
Less: Return to Intangible Assets (Accounting and Economic Profit) $37,000
Add: Other Income to Real Estate $0
Equals: NOI to Real Estate $101,348
Targeted Debt Coverage Ratios
Low 1.25
High 1.6
Dollars Available for Debt Service (Low) $63,343
Dollars Available for Debt Service (High) $81,078
Mortgage Constant $0
Total Possible Mortgage, Real Estate Only (Low) $820,128
Total Possible Mortgage, Real Estate Only (High) $1,049,764
Calculated Loan-to-Value Ratios
Low 66%
High 85%
Source: Realty Rates.com
COPYRIGHT © 2016 C-STORE EVALUATIONS LLC. ALL RIGHTS RESERVED.

Proposed Pio Nono Avenue Site
EQUIPMENT VALUATION 23
Equipment List
DESCRIPTION QTY EACH % GOOD TOTAL
CO2 TANK W. VALVE CONNECTED W/ SODA MACHINE 1 $500 93% $467
DRINK DISPENSER W/ REMOTE TANK SYSTEM 1 $2,650 93% $2,473
COFFEE MAKER 1 $1,575 93% $1,470
HOT CHOCOLATE 1 $605 93% $565
CUP DISPENSERS 2 $170 93% $317
CASH REGISTER 1 $3,000 93% $2,800
TELEPHONE BOARD 1 $1,750 93% $1,633
PORTABLE FIRE EXTINGUISHER 2 $175 93% $327
STAINLESS STEEL SINK 2 $2,025 93% $3,780
ICE MACHINE 1 $2,700 93% $2,520
TIME RECORDER 1 $7,000 93% $6,533
CORNER CAP 1 $750 93% $700
BAG IN BOX 1 $250 93% $233
MICROWAVE 1 $375 93% $350
OVEN 1 $3,500 93% $3,267
POPCORN MACHINE 1 $995 93% $929
SLUSH PUPPY 1 $2,960 93% $2,763
PASTRY CASE 1 $2,000 93% $1,867
HOT DOG MACHINE 0 $670 93% $0
GONDOLAS W/ END CAP 3 $250 93% $700
2FT WIDE SHELVING/72 IN HIGH 12 $150 93% $1,680
GRILL COOKER 0 $2,000 93% $0
PAY PHONE 1 $750 93% $700
COMPUTER 1 $5,000 93% $4,667
SHELVES 3 $150 93% $420
UNDERCOUNTER SAFE 2 $1,500 93% $2,800
LOTTO MACHINE 1 $1,000 93% $933
RECEIPT MACHINE 1 $500 93% $467
CREDIT CARD MACHINE 1 $300 93% $280
CONDIMENT TRAY 1 $1,025 93% $957
ATM MACHINE 1 $4,500 93% $4,200
ICE CREAM COOLER 2 $705 93% $1,316
2-DOOR FREEZER 1 $3,000 93% $2,800
PRINTER 1 $500 93% $467
DISPLAY CASE 2 $475 93% $887
OVERHEAD CIGARETTE DISPENSER 1 $1,500 93% $1,400
DEEP SHELF WITH MOP HOLDERS 1 $750 93% $700
FOOD SERVICE EQUIPMENT 0 $50,000 93% $0
TOTAL ADJUSTED BOOK VALUE: Tangible Assets, Non-Realty$58,366
STORE BLDG SIZE (NON-FOOD SERVICE) 3,000
EQUIPMENT VALUE/SF $19.46
COPYRIGHT © 2016 C-STORE EVALUATIONS LLC. ALL RIGHTS RESERVED.

PREPARER'S CERTIFICATION
I certify to the best of my knowledge and belief:
1. The statements of fact contained in this report are true and correct.
6. I have not made a personal viewing of the property that is the subject of this report.
7. No one provided significant real property appraisal assistance to the person signing this report.
1. Checked and approved the assumptions in the model
2. Checked the input data in the model.
3. Checked the model output for reasonableness, based on the assumptions and input data.
4. Provided statistical testing of the model input variables and found a 93% coefficient of
determination, and a coefficient of variation of 11%.
January 6, 2016
Robert E. Bainbridge (Not a licensed apprasier in this State)
C-Store Evaluations LLC
Suite 110, Mail Box 237
4447 N. Central Expressway
Dallas, TX 75205
14. Robert E. Bainbridge, MAI developed the PetroMARK® software used in estimating the value of this property, and provided
consultation with the undersigned preparer of this evaluation report, in the following manner:
COPYRIGHT © 2016 C-STORE EVALUATIONS LLC. ALL RIGHTS RESERVED.
11. I am not licensed as an appraiser in this State. This is not a state-certified appraisal. This is an evaluation and evaluations do not
require a state appraiser license under state law.
12. My compensation for completing this assignment is not contingent upon the development or reporting of a predetermined value or
direction in value that favors the cause of the client, the amount of the value opinion, the attainment of a stipulated result, or the
occurrence of a subsequent event directly related to the intended use of this evaluation.
13. My analyses, opinions, and conclusions were developed, and this report has been prepared, in conformity with the Interagency
Appraisal and Evaluation Guidelines date December 10, 2010 jointly by the Office of the Comptroller of the Currency, The Board of
Governors of the Federal Reserve System, The Federal Deposit Insurance Corporation, and the Office of Thrift Supervision ("Federal
Guidelines"). Accordingly this Report may be relied upon by Customer in
9. As of the date of this report, I, Robert E. Bainbridge have completed the requirements of the continuing education program of the
Appraisal Institute.
10. I certify that I am competent with respect to knowledge of the local market and education and experience to complete and
evaluation of this property.
2. The reported analyses, opinions and conclusions are limited only by the reported assumptions and limiting conditions, and are my
personal, unbiased professional analyses, opinions and conclusions.
3. I have no present or prospective interest in the property that is the subject of this report, and I have no personal interest or bias with
respect to the parties involved.
4. My compensation is not contingent on an action or event resulting from the analyses, opinions, or conclusions in, or the use of this
report. This assignment was not based on a required minimum valuation, a specific valuation, or approval of a loan. Neither the
employment or future employment of the appraiser was conditioned on the appraisal producing a specific value. Future employment
prospects are not dependent upon the appraisal producing a specific value or whether the loan was approved.
5. My analyses, opinions, and conclusions in this evaluation report are not subject to the Uniform Standards of Professional Appraisal
Practice.
8. The use of this report is subject to the requirements of the American Institute of Real Estate Appraisers relating to review by its duly
authorized representatives.

APPENDIX
Sources of Data
How Retail Property Value is Created
Photographs
Trade Area Aerials and Maps
Supplemental Report Provisions

Sources
Sources consulted in preparing this report:
1. State of the Industry Report, National Association of Convenience Stores, published annually
2. Retail Fuel Watch, Oil Pricing and Information Service, published annually.
3. ESRI® Business Analyst
4. Claritas Retail Market Report
5. CoStar
6. PetroMARK® Valuation Software
APPENDIX
COPYRIGHT © 2016 C-STORE EVALUATIONS LLC. ALL RIGHTS RESERVED.

APPENDIX __ PHOTOGRAPHS Photographs provided by third-party.
COPYRIGHT © 2016 C-STORE EVALUATIONS LLC. ALL RIGHTS RESERVED.

APPENDIX __ PHOTOGRAPHS Photographs provided by third-party.
COPYRIGHT © 2016 C-STORE EVALUATIONS LLC. ALL RIGHTS RESERVED.

Site Map on Satellite Imagery - 0.4 Miles Wide1095 Pio Nono Ave, Macon, Georgia, 31204 Prepared by EsriDrive Times: 1, 3, 5 minute radii Latitude: 32.83624
Longitude: -83.66255
Source: ArcGIS Online World Imagery Basemap
January 07, 2016
©2015 Esri Page 1 of 1

Site Map on Satellite Imagery - 0.8 Miles Wide1095 Pio Nono Ave, Macon, Georgia, 31204 Prepared by EsriDrive Times: 1, 3, 5 minute radii Latitude: 32.83624
Longitude: -83.66255
Source: ArcGIS Online World Imagery Basemap
January 07, 2016
©2015 Esri Page 1 of 1

Site Map on Satellite Imagery - 1.6 Miles Wide1095 Pio Nono Ave, Macon, Georgia, 31204 Prepared by EsriDrive Times: 1, 3, 5 minute radii Latitude: 32.83624
Longitude: -83.66255
Source: ArcGIS Online World Imagery Basemap
January 07, 2016
©2015 Esri Page 1 of 1

Site Details Map1095 Pio Nono Ave, Macon, Georgia, 31204 Prepared by EsriDrive Times: 1, 3, 5 minute radii Latitude: 32.83624
Longitude: -83.66255
This site is located in:City: Macon city
County: Bibb County
State: Georgia
ZIP Code: 31204
Census Tract: 13021012300Census Block Group: 130210123001
CBSA: Macon, GA Metropolitan Statistical Area
January 07, 2016
©2015 Esri Page 1 of 1

Custom Map
Source: ©2015 Esri
January 06, 2016
©2015 Esri Page 1 of 1
APPENDIX _ ____ __
Evaluation Supplemental Report Provisions This Enhanced Property Valuation is the product of automated valuation technology, public record data, and human decisioning logic combined to provide a logical estimate of the most probable selling price of a petroleum marketing property. This valuation is not an appraisal. This valuation estimates property value assuming fee simple title ownership and the property condition as indicated on the PetroMARK® Questionnaire. This Enhanced Property Valuation is intended for use only for extensions of credit applicable with commercial property equity lending or as a screening tool for collateral risk exception management. Enhanced Property Valuations are not suitable for complex properties. This valuation contains no representations or warranties regarding marketability, functional or economical obsolescence, environmental contamination or flood insurance determination. This valuation does not warrant the accuracy of any public record information or data sources used to prepare this valuation. This data may not be re-sold. The market value, information, data, content and process to produce this report cannot be insured, warranted, or underwritten without the express written consent of C-Store Evaluations LLC. THE VALUATIONS ARE PROVIDED "AS IS" AND C-STORE EVALUATIONS LLC MAKES NO REPRESENTATION OR WARRANTY WITH RESPECT TO THEIR ACCURACY, COMPLETENESS, OR CURRENTNESS. C-STORE EVALUATIONS LLC SPECIFICALLY DISCLAIMS ANY OTHER WARRANTY, EXPRESS, IMPLIED OR STATUTORY, INCLUDING ANY WARRANTY OF MERCHANTABILITY OR FITNESS FOR A PARTICULAR PURPOSE. IN NO EVENT WILL C-STORE EVALUATIONS LLC BE LIABLE FOR THE RESULTS OF YOUR USE OR MISUSE OF THE VALUATIONS, INCLUDING ANY USE CONTRARY TO STATE AND FEDERAL LAW; YOUR INABILITY OR FAILURE TO CONDUCT YOUR BUSINESS; OR FOR ANY INDIRECT, SPECIAL, OR CONSEQUENTIAL DAMAGES. VALUES ARE PROVIDED “AS IS” AND ALL USES ARE AT THE USER’S SOLE RISK. ALL WARRANTIES CONCERNING THE VALUES AND ALL UNDERLYING DATA AND PROCESSES BOTH EXPRESSED AND IMPLIED ARE EXPRESSLY EXCLUDED INCLUDING WITHOUT LIMITATION ANY WARRANTIES OF MERCHANTABILITY, ACCURACY, OR FITNESS FOR A PARTICULAR PURPOSE. The estimated values are calculated using various models and techniques proprietary to C-Store Evaluations LLC. This report does not constitute an appraisal and has not been prepared by a certified or licensed appraiser. Values are dependent on the accuracy of any data supplied by the user. Values may not be used to produce or attempt to produce models used to generate the Values. The term Value is used in this report to mean the estimated market values generated by using the PetroMARK® proprietary models.
COPYRIGHT © 2016 C-STORE EVALUATIONS LLC. ALL RIGHTS RESERVED.

APPENDIX __ PHYSICAL CONDITION OF THE PROPERTY The physical condition of the improvements is estimated from the indicated date of construction and last major remodel; third-party inspection reports, if any; photographs of the interior and exterior; and itemized repairs shown on the Property & Operations Survey. The preparer of this Evaluation Report did not make an inspection of the property. CURRENT USE, PROPOSED USE, HIGHEST AND BEST USE The current and anticipated future use is convenience retail commercial. The highest and best use as currently improved is continuation as convenience retail commercial. PROPERTY-SPECIFIC DATA Property specific data is summarized on Page 4. Tangible Assets, realty includes the site, site improvements, buildings, fuel service including all retail dispensers, underground storage tanks, associated POS electronics and piping and canopy. It also includes the car wash and all related car wash systems. The Tangible Assets, Non-realty includes movable personal property as generally described on Page 30. No inventory of non-realty items has been made. NEIGHBORHOOD DATA Relevant Trade Area (neighborhood) data is summarized on Page 5. CURRENT TAX ASSESSMENT The current ad valorem tax assessment has been examined as part of this investigation. Our value conclusions in this Evaluation Report are not dependent upon, nor derived from the assessed value. Records of the assessed value for this property are retained in our work file. SOURCES OF DATA Sources consulted in preparing this report include the completed Property & Operations Survey; State of the Industry Report, National Association of Convenience Stores, published annually; Retail Fuel Watch, Oil Pricing and Information Service, published annually; ESRI® Business Analyst; Claritas Retail Market Report; CoStar; PetroMARK® Valuation Software; tax assessment records; photographs of the store exterior, store interior, fuel service and street scene.
SCOPE OF WORK This evaluation report is not a state-certified appraisal. The significant elements of scope included the following: This report has been prepared in accordance with the guidelines for an evaluation as specified in the Interagency Appraisal and Evaluation Guidelines issued on December 10, 2010. This is a specific appraisal product developed to meet the needs of this client and is not intended for any other use. This evaluation report is intended for use as evaluation of the collateral for a mortgage loan. Intended user(s) and client of the report are identified on Page 4. No other use is authorized. Physical information about the property is taken from the occupants/operator’s responses to the Property & Operations Survey, which is part of our work file, assessor’s records, third-party inspection reports, and a physical inspection of the property, when available. We did not make a physical inspection of this property.
COPYRIGHT © 2016 C-STORE EVALUATIONS LLC. ALL RIGHTS RESERVED.

APPENDIX __ The primary method estimating the value of the tangible and intangible assets is a capitalization of earnings income approach assuming typical management. This is the methodology recommended by Convenience Stores and retail Fuel Properties: Essential Appraisal Issues, 2012, Second Edition, published by the Appraisal Institute, and International Valuation Standards (IVS) for this type of property. Summary peer-group transaction data and a cost approach summary have been used to check the validity of the estimate value of the real estate. Source data consulted in this assignment includes. State of the Industry Report, National Association of Convenience Stores, published annually; Retail Fuel Watch, Oil Pricing and Information Service, published annually; ESRI® Business Analyst; Claritas Retail Market Report; CoStar; PetroMARK® Valuation Software. Robert E. Bainbridge, MAI developed the PetroMARK® software used in estimating the value of this property, and provided consultation with the undersigned preparer of this evaluation report, in the following manner:
1. Checked and approved the assumptions in the model 2. Checked the input data in the model. 3. Checked the model output for reasonableness, based on the assumptions and input data. 4. Provided statistical testing of the model input variables and found a 93% coefficient of determination, and a coefficient of variation of 11%.
SALE HISTORY (analyze all sales within the last 3 years, current options, listings, offers or purchase agreements) According to the local assessor’s office and the current owner, the property has not sold within the last three years The property does not appear to be listed for sale. The exterior signage indicated the property is owner-occupied.
ESTIMATED EXPOSURE TIME AND ESTIMATED MARKETING TIME The estimated exposure and estimated market time are six to 12 months based upon statistical data compiled by CoStar and interviews with buyers and sellers.
RELIABILITY The 21 variables used in our valuation estimates for C-Stores & Gas Stations have been statistically tested and shown to have high explanatory power at 93% (R2) and a low error 11% (coefficient of dispersion). For a full explanation of each variable and the related statistical output, please see Convenience Stores and Retail Fuel Properties: Essential Appraisal Issues, 2012, Second Edition, pp 275-288. Published by the Appraisal Institute, Chicago.
ASSUMPTIONS AND SPECIAL CONDITIONS This evaluation report has been made with the following general assumptions: 1. Title to the property is assumed to be good and marketable unless otherwise stated in this report. 2. The property value is estimated as though free and clear of any or all liens and encumbrances
unless otherwise stated in this report. 3. Responsible ownership and competent property management are assumed unless otherwise stated
in this report.
COPYRIGHT © 2016 C-STORE EVALUATIONS LLC. ALL RIGHTS RESERVED.

APPENDIX __
4. All engineering is assumed to be correct. The plot plans and illustrative material in this report are included only to assist the reader in visualizing the property.
5. It is assumed that there are no hidden or unapparent conditions of the property, subsoil, or structures that render it more or less valuable.
6. It is assumed that there is full compliance with all applicable federal, state, and local environmental
regulations and laws unless otherwise stated in this report. It is assumed that all applicable zoning and use regulations and restrictions have been complied with, unless nonconformity has been stated, defined, and considered in this evaluation report.
7. It is assumed that all required licenses, certificates of occupancy consents, or other legislative or
administrative authority from any local, state, or national governmental or private entity or organization have been or can be obtained or renewed for any use on which the value estimates contained in this report are based.
8. The preparer is not qualified to detect hazardous waste and/or toxic materials. Any comment by the preparer that might suggest the possibility of the presence of such substances should not be taken as confirmation of the presence of hazardous waste and/or toxic materials. Such determination would require investigation by a qualified expert in the field of environmental assessment. The presence of substances such as asbestos, urea-formaldehyde foam insulation or other potentially hazardous materials may affect the value of the property. The preparer’s value estimate is predicated on the assumption that there is no such material on or in the property that would cause a loss in value unless otherwise stated in this report. No responsibility is assumed for any environmental conditions, or for any expertise or engineering knowledge required to discover them. The appraiser's descriptions and resulting comments are the result of the routine observations made during the evaluation process.
9. Unless otherwise stated in this report, the subject property is appraised without a specific compliance survey having been conducted to determine if the property is or is not in conformance with the requirements of the Americans with Disabilities act. The presence of architectural and communications barriers that are structural in nature that would restrict access by disabled individuals may adversely affect the property's value, marketability, or utility.
This evaluation report has been made with the following general limiting conditions: 1. The intended user makes no express or implied representation or warranty of any kind, and expressly
disclaims any liability to any person or entity with respect to this evaluation report.
A. Market Value Definition: The term market value used herein is in accordance with the definition of the
office of the Comptroller of the Currency, under 12-CFR, part 34, subpart C-Appraisals, 34.42 Definitions [F]. Source: 12 CFR 34.42(g).
“Market value means the most probable price which a property should bring in a competitive and open market under all conditions requisite to a fair sale, the buyer and seller each acting prudently and knowledgeably, and assuming the price is not affected by undue stimulus. Implicit in this definition is the consummation of a sale as of a specified date and the passing of title from seller to buyer under conditions whereby: Buyer and seller are typically motivated; Both parties are well informed or well advised, and acting in what they consider to be their own best interests; A reasonable time is allowed for exposure to the open market; Payment is made in terms of cash in U.S. dollars or in terms of financial arrangements comparable thereto; and The price represents a normal consideration for the property sold unaffected by special or creative financing or sales concessions granted by anyone associated with the sale.”
COPYRIGHT © 2016 C-STORE EVALUATIONS LLC. ALL RIGHTS RESERVED.

APPENDIX _____
B. Unless otherwise stated herein:
i. The effective date of value coincides with the inspection date. ii. This Evaluation reflects the fee simple interest. iii. Exposure Time is one year or less. iv. The Highest and Best Use (HB&U) is believed to be essentially in accord with the current use (a thorough H&BU is beyond the scope of this Evaluation). v. The subject has been valued based upon its current use; no projected or proposed uses have been considered. vi. In addition to the Evaluation, this Review has considered the information presented in the Inspection including photographs (as applicable) and working papers contained in the work file. C. Confidentiality: Unless specifically stated otherwise, borrower and property information made
available should be considered as confidential and not used or disclosed outside the normal course of performing this assignment.
COPYRIGHT © 2016 C-STORE EVALUATIONS LLC. ALL RIGHTS RESERVED.
COPYRIGHT © 2016 C-STORE EVALUATIONS LLC. ALL RIGHTS RESERVED.

COPYRIGHT © 2016 C-STORE EVALUATIONS LLC. ALL RIGHTS RESERVED.
www.PetroREPORT.com