Embed Size (px)
Citation preview


Site Location Map Chevron Cincinnati Facility Site ;.
SCALE : FEET nooven.~amiitonmumy,~ i i o

Figure 2-2 Aerial Photograph of the Chevron Cincinnati Facility in March 1975.
@ Most above grade slructures were removed after 1986.

Monifonng Weii ,. . ....._... Vapor Monitoring Weii
" " Chevron ProductioniRecovsry Weii
I i
iioiizontai Soii Vapor Extiaaion Weii
'g3 Boiehoie Location (See Figure 2-51rCr
..--. s.' 0 - L? Twfisea (See Figure 2-4)
----- Chevron Cincinnati Facili* Boundary
1
300 0 160 300
SCALi IN FEET
600
I-1 Civil 8 EnvironmentalCincinnau, OHConsultants, Inc.
. . . . Pittsburgh, PA . Columbus, OH . Indianapolis, IH Nashville, TRI
DWN. BY: JK1 / SCALE: / DATE:1 AS SHOWN / A U ~2000
/ Far:ility Diagram 1 GFEVRON PRODUCTS COMPANY/ Cincinnati Faciiiw
Hoovsn Coun Ohio
/ PROJECT-NO 1 FIGLJRE-NO! 9905415 1 Fiaure 2-3
- -- -

D WEST
D' EAST
MW96S MW96D
520 -
500 -nal 9!
480 -::3
460 -% 8
440 -I-
2 nr 420 -
400 -
MW44
480
460
440
420
.- - - - - - - - - .- - - - - - - . 400
Lepend
Cincinnati Fadlity ' Hwven. Mtio
4898005 i-Figure 2-4I Interval Generalized Geologic Cross
Section, D-D' ?:and
Shale & Occasional (See Figure 2-3for Section Location)r--Z1 ~imestone Chewon Products~ompany 3
Sand Clayey Sand & Gravel
Sand and Gravel o I EnvironmentalScience &
aSilty Clay APPROXIMATESCALEINFEET Engineering, Inc. **rmc-.rs
F i
m W/lS/W ciwwm gR.,+..de pr.r2.

Permeabi l i ty vs. D e p t h - C H 2 Permeabi l i ty vs. Depth - C H 3 Permeabi l i ty vs. Depth - C H 61 I Permesbility (10E-3cmls) Permeability (10E3cmls) Permeability (10E-3c d s )
0 5 10 15 20 25 0 5 10 15 20 25 0 5 10 15 20 25 L- .--d7 0 ti---i-"&-.I
O/----L
....... ........
Permeability vs. Depth - C H 8 Permeability vs. Depth - CHI6 1 Permeability (1OE-3cmls) Permeability(10E-3c d s )
0 5 10 15 20 25 0 5 10 15 20 25 2-..-.,..--, 2 I 0 .i---..i i.-.__i
!
Figure 2-5 Permeability versus Depth from Borings CH2 - CH16.
(see Figure 2-3 for boring locations)
.....

Groundwater Corrective Meanaes Study October 26,2001
5-OF Elevation
k.;crihtion To~fioil
491.9 Br- silty clay with medim gravel (Fill)
Brow silty coarse sand, gravel and z-& fragmrnts
Dark gray silty coarse serd ad gravel (hydrocarbonodor throughom,]
Grades less silty at 23 Ft.
Large cobbles at 28 ft.
Gray cparse sand and Fine m M i -gmvel
Brarn fint sand Brm Fine m coarse sand
GrayiPih brom coarse send ad fine to d i m gravel, dense, wet with hydro- carban/watcr at 38 ft.
B r a n =dim m coarse gravel, s- send, "'et (hydracarban odor diminished st 43 Ft.1
Brom tnedim w coarse sand and Fine m m d i m gravel, same cobble lenses
B r a n Fine sand. media dewe
B r m silty coarse sane and $ravel
B r a n highly weathered shale (soFt, claye:
Gray weathered shale (very soft eMI claye:
d Sanple selected For
grain size analysis
-Y WEST O R I L L I S , I=.
Figure 2-6 Lithology Log of MW-20D


a CHEVRON ClNClNNATl FACILIN PROPERTY LINE
__---_--___--APPROXIMATE EXTENT OF I FREE-PHASE LNAPL
a
__1 ----A-.
b
MONiiORiNG WELL
CHEVRON PROOUCiiCIU RECOVERY WELL CI-EVRON PRODUCTS COMP FEEPHASE WWL " I I C ~ E S Si~ WEUS. F.

- LIQUID HWROCARBON PRESENT zone Concentrations in Groundwater - --- - = ESIIMTED M M OF DISSOLMD PHASE PLUME
NOIE: DATA P R E E N E D IN TABLE 1


HIGH WATER TABLE
PROPERTY LINE -
EXTENT OF LIQUID HYDROCARBON PLUME.
LOW WATER TABLE -
AREA OF CONCEPTUAL SITE MODEL -SEE FIGURE 2-19
ir
Figure 2-18. Site Map


CrouncIwater Corrective Meusures St~~cly Octobrr 26, 2001
LNAPL enters and Water table rises, At water table At water table floats on top of entrapping LNAPL maximum, LNAPL minimum, LNAPL the water table, at 2-phase residual may be entirely will be most
Saturation. Immobile. Mobile.
t 0.8 0.6 0.4 0.2 0
residual water
-C .-0
-2 w
0 0.2 0.4 0.6 0.8 t
S, sw Note: S, = Saturation of water, S, = Saturation of L U M L
Figure 2-20
Schematic of LNAPL Redistribution by a Fluctuating Water Table


Groundwater Production Wells
CHEVRON PRODUCTS COMPANY Cincinnati Facility
1

Groundwater CorrectiveMeasures Study October 26, 2001
controlled by measuring the effluent dissolved oxygen (DO) concentrationand the
oxygen feed is set so that the effluent DO remains at 1.5 mg 02/L(see Figure 4-2).
Figure 4-2
Chevron Cincinnati GAC-FBR System Schematic
for High Water Table Operation
During fall and winter, the focus of the pump-and-treat operation shifts to free-phase
LNAPL recovery. As a result, the groundwater pumping rate may double, to 3400 gpm,
of which 860 gpm is clean oxygen canier water from PW 4 or 5. This requires that both
treatment trains be used; in essence two of the systems depicted in Figure 4-2 are
operated in parallel. At times, the system is oxygen-limited, i.e., even with the N1340
cfh oxygen generating capacity in use, the water flow rate must be reduced to meet the
1.5 mg 02/L parameter in the system effluent.
The effluent from the FBR system is conveyed to an impoundment where it is polished
before dischargeto the Great Miami River.

Figure 4-3: Summary of Chevron Cincinnati Facility Free-Phase LNAPL Recovery

Figure 4-41: Cumulative Free-Phase LNAQLRecovery

EXTRACTION GREAT MIAMI
WAPL-FREE
Figure 6-1. Conceptual Design of Partially-Penetrating Barriers at the Chevron Cincinnati Faclilty

. . RECOVERYlDlSPOSAL
, : . . . ,.. . ,.'
*
BASE OF MLUVlALW F E R
Figure6-2. Conceptual Deslgn of Capillary Barrier System at the Chevron Clnclnnatl Facllity

------ - - - - - - - - -
- - - - - - - - - - - - - - - - - - - - - - - - - - - - - - - - - - - - - - - - - - - - - - -
-POTENT!AL HEAT
CONTAMINATED RECOVERY AND SOIL GAS REINJECTION
M!ZRkfAL ----iOXIDIZER AIR IN f?!. \ )
3 NOTE: A VERTICAL SVE SYSTEM IS SHOWN FOR CLARrrf. 1HORIZONTAL SVE WEUS MAY BE MORE
APPLICABLE FOR MIS sm. 8 iia
Figure 6-3. Conceptual Design of SVE at the Chevron Cincinnati Facility

SAND AND GRAVEL STRIPPED AWIFER MATERIAL I I /HYDROCARBONS I
SAND AND GRAVE!. W I F E R MATERIAL L,,,
INFLUENCE
REWIRED SVE SYSTEM NOTSHOWN;UPPER SILT ZONE NOT PRESENT E V E M E R E )
Figure 6-4. Conceptual Design of in-Situ Air Sparglng System at the Chevron Cincinnati Facility

AIR INJECTW4
TO VOC VAPOR
AIR INJECTION UNE
VOC CONTAMINATED AIR
PACKER OR DIVIDER
UPPER RECHARGE SCREEN
AIR STRIPPED
GROUNDWATER CIRCULATION ZONE
VOC CONTAMINATED GRWNDWATER
Figure 6-5. Conceptual Desi at the 8n for Groundwater Circulation Well Technology
hevron Cincinnati Facility

Extracted L
iquids
C -.O e
4 i.1
GS
.au
b--4 .2
35
$3
5 LZ h
i3 a '2
aA
A
0
C -
0
MI: .O*
* ~i .-
u
5 2
8 g
i
5 .Z
O.~
3-u
e 0 2
s a
8 Ej 0
g 3m Surfactant Injection W
ells 6 5 3 &'
9
4' +
Extracted L
iquids
i


. .
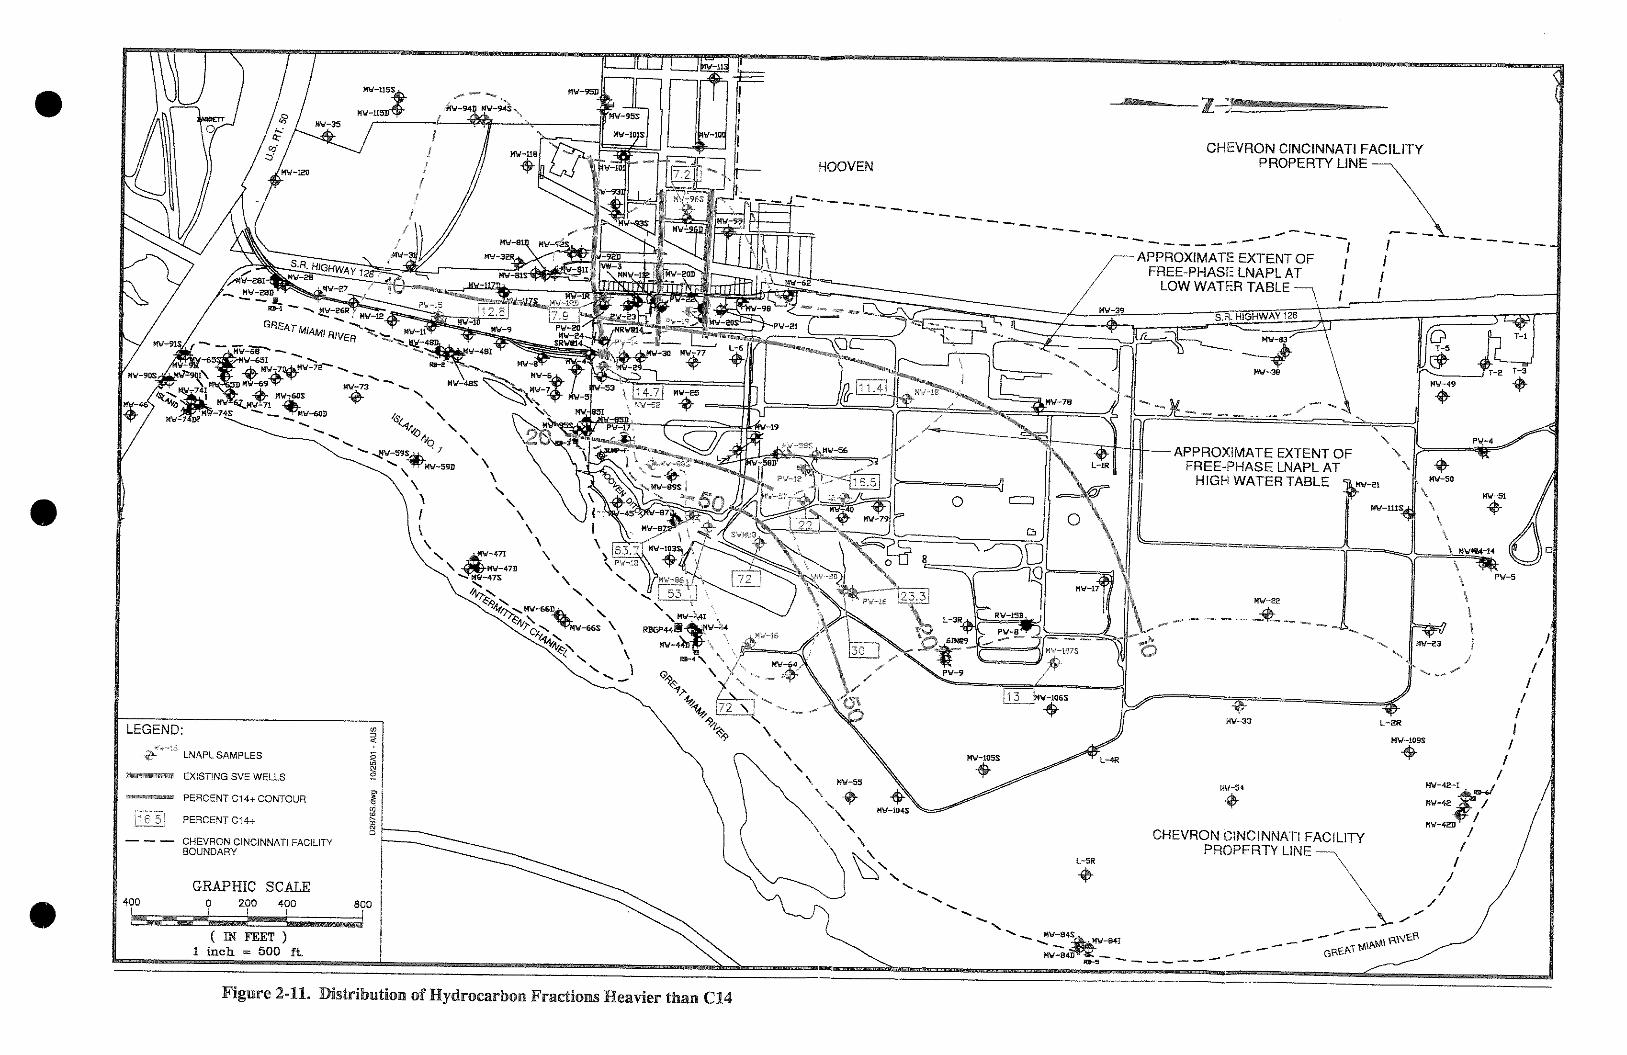
APPROXIMATE EXTENT OF
a
@ CURRENTIPOTENTiAL EXTRACTION WELL LOCATIONS GRAPHIC SCALE EXiSTlNG SVE WELLS
- -- CONCEPTUAL WATER TABLE CONTOURS
CONCEPTUAL GROUNDWATER FLOWPAT'H
Figure 7-1: Afternative I: Containment
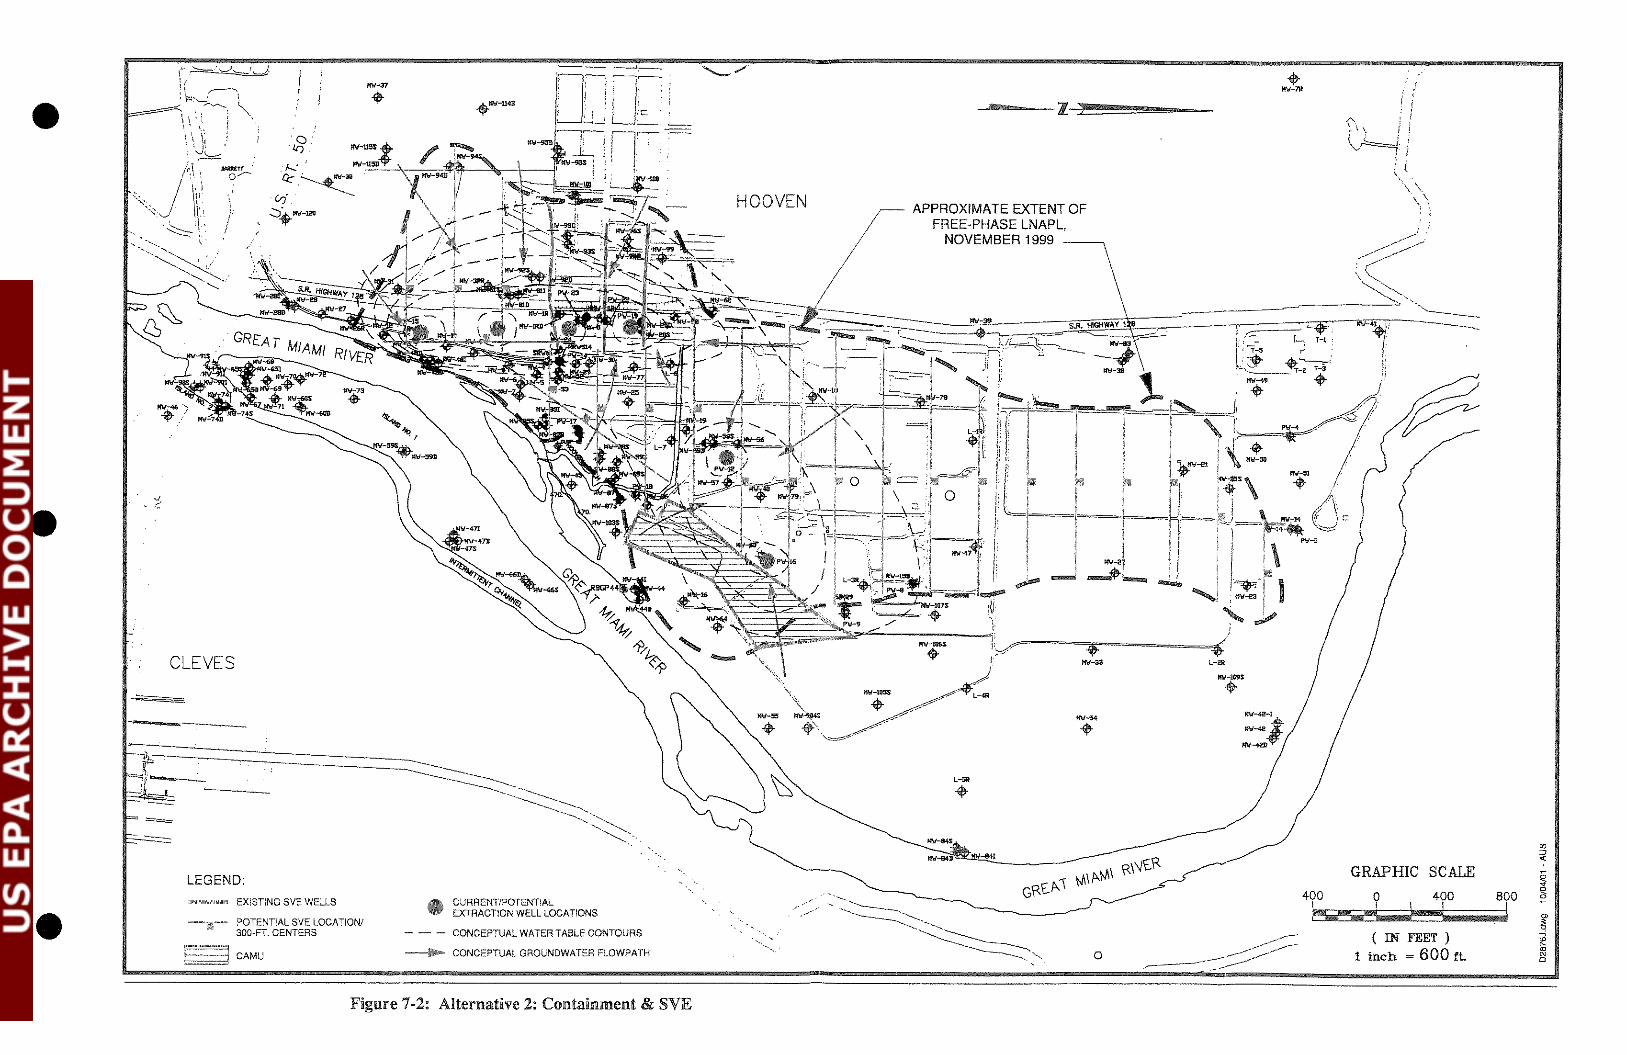
APPROXIMATE EXTENT OF FREE-PHASE LNAPL,
NOVEMBER 1999
. CLEVES
- ,
EXISTING SVE WELLS
FOTENTIAL SVE LOCATION 300-FT. CENTERS
--- @ CURRENTIPOTENT!AL EXTRACTION WELL LOCAT!ONS
- -- CONCEPTUAL WATER TASLE CONTOURS
GRAPHIC SCAJ.3
1 inch = 600 rt.
Figure 7-2: Alternative 2: Containment & SVE

APPROXIMATE EXTENT OF
NOVEMBER 1999
%
EXISTING SVE WELLS @ CURRENVPOTENTIAL EXTRACTION GRAPHIC SCALE WELL LOCATIONS
POTENTiAL SVE LOCATION1 300-F;. CENTERS - A - CONCEPTUAL WATER TABLE CONTOURS
. . . ~ ~ ~POTENTIAL iAS WELL GRID1 ~ ~ , ~ .. . .. . . 50-i-. CENTERS ~ CONCEPTUAL GROUNDWATER FLOWPATH
Figure 7-3: Alternative 3:Conlainanent & SVE & IAS I

* APPROXIMATE EXTENT OF
FREE-PHASE LNAPL, NOVEMBER 1999
e
EXISTING SVE WELLS
---rPOTENTIAL SVE LOCATION/ 300-Fr.CENTERS GRAPHIC SCALE
. . .. . . POTENTIAL SEAR WELL GRID1 CONCEPTUAL GROUNDWATER FLOWPATH i : i i i so-n.CENTERS HORIZONTAL. . . . , , 15-F. CENTERS VERTICAL
1 inch = 600 ft.
Figure 7-4: Alternative 4: Containment 6t SVE & SEAR

Groundwater CorrectiveMeaswe StuQ October 26.2001
Table 7-2
Estimated Time from Present Needed for the
Groundwater Benzene Concentration to Drop Below the MCL ( 5 w )
0
Containment Only SVE SVE + IAS W E + SEAR
Technology
Figure 7-5
Projected Durations from Present to 5 pg/L Benzene, versus Technology

GroundwaterCorrectiveMeasures SIudjt O c t h26,2001
Table 7 4
PresentWorth of All Costs Associated with Alternatives 1through 4
Containment mE SVE + IAS SVE + SEAR
Figure 7-6 PresentWorth of Alternatives
The following observationscanbe made:
Total present worth costs increase significantly as intxshgly aggressive
source removal technologies are applied:Alternative 1 (Containment)<
Alternative 2 (Containment + SVE) <Alternative 3 (Containment+SVE
+IAS)<Alternative4 (Containment+SVE +SEAR).
Alternative 4 (Containment +SVE +SEAR) is the fastestalternative,as
discussed in Section 7.4.1. It is also the most expensive altemative.

Figure 1 0 ~ 1 Chevron Cincirindti
Groundwater Remedy lrnplernentatiort Scheduie
ITask Name CMS Process
Chevron Submits Draft GWCMS to EPA
EPA Submits comments to Chevrori
Clievron Submits a response to comments
EPA approves the GWCMS
EPA subrnits Statement of Basis to Public
Public Hearing (probabiy corresponding with a (
End of Comment Period
Flnai Ueclsiori Response to Coirirnenis
3 Evaluation of Coritainment Options
Seiection of Containmelit Optioris
3 Uesign of Selected Option
Constructioii of Selected Option
Start of lono-term O&M
..
1 Rolled Up Task Project Surnniary
Roiled up Split , , , > , , , , , , , , , , ~ z , > External Miiestone
~ o i i o du p Milestone 0 i)8adiine
1 / Miiastone Hoiied Up Progress 1
Note: The actual design and construction times wiil be dependent uporl tile coinpiexity of the selected coiitailiinent optiori. -.