Embed Size (px)
Citation preview
Site Selection Methodologies
Jae K. (Jim) ParkDept. of Civil and Environmental
EngineeringUniversity of Wisconsin-Madison
1
Site Selection Methodologies
Refuse disposal facilities had been located in sites such as old gravel pits, in areas close to wetlands and other low-lying areas, or at previous dump sites.
Smoke and odor problem: stop burning Problems with rodents, insects, and
aesthetics: daily cover Differential and overall settling plus fire
potential: compaction Potential groundwater pollution: daily
cover, berming, liners and leachate collection systems
2
Site Selection Methodologies
Not In My Back Yard (NIMBY) Build Absolutely Nothing Anywhere Near
Anyone (BANANA) Not on Planet Earth (NOPE) Decision makers now need a
sophisticated understanding of why the public objects to many of the choices, and they need a defensible, thorough structure or methodology that will demonstrate why a particular site is selected as a disposal site.
An important aspect of the methodologies is the role of the public. 3
Site Selection Criteria
The site must be structurally sound and free from potential problems such as landslides, subsidence, and flooding
The effect on the neighborhood of heavy, large earthmoving equipment and significant traffic flow associated with the site operation must be assessed, as well as the need for additional facilities to be constructed.
The extent to which the landfill site affects the quality of groundwater and surface water in the vicinity of the site must be assessed.
4
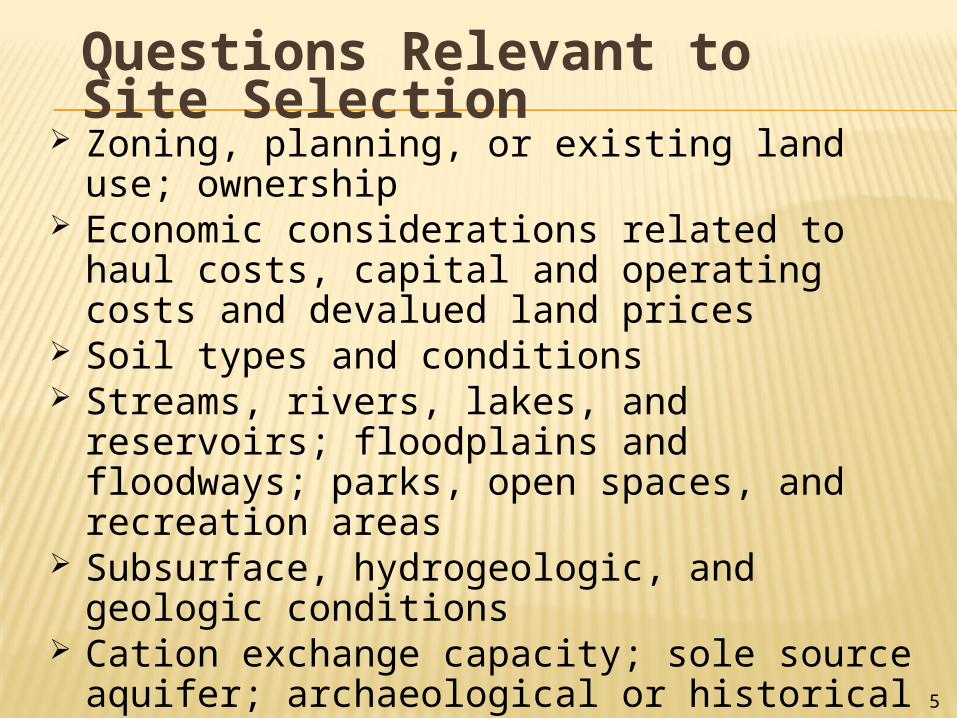
Questions Relevant to Site Selection
Zoning, planning, or existing land use; ownership
Economic considerations related to haul costs, capital and operating costs and devalued land prices
Soil types and conditions Streams, rivers, lakes, and reservoirs;
floodplains and floodways; parks, open spaces, and recreation areas
Subsurface, hydrogeologic, and geologic conditions
Cation exchange capacity; sole source aquifer; archaeological or historical significance; endangered species; wetlands
Traffic pattern, accessibility, airport Aesthetic considerations; potential ultimate
uses
5
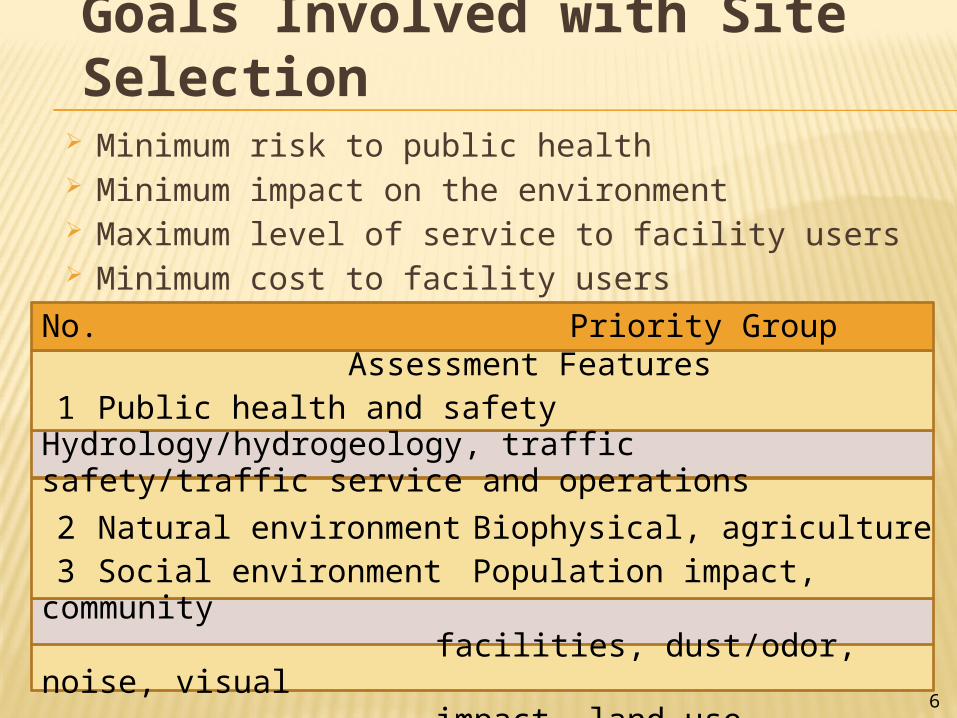
Goals Involved with Site Selection
Minimum risk to public health Minimum impact on the environment Maximum level of service to facility users Minimum cost to facility users
No. Priority Group Assessment Features1 Public health and safety Hydrology/hydrogeology,
traffic safety/traffic service and operations
2 Natural environment Biophysical, agriculture3 Social environment Population impact, community
facilities, dust/odor, noise, visual
impact, land use compatibility4 Cultural environment Heritage features,
archaeology
5 Economical cost Dollars
6
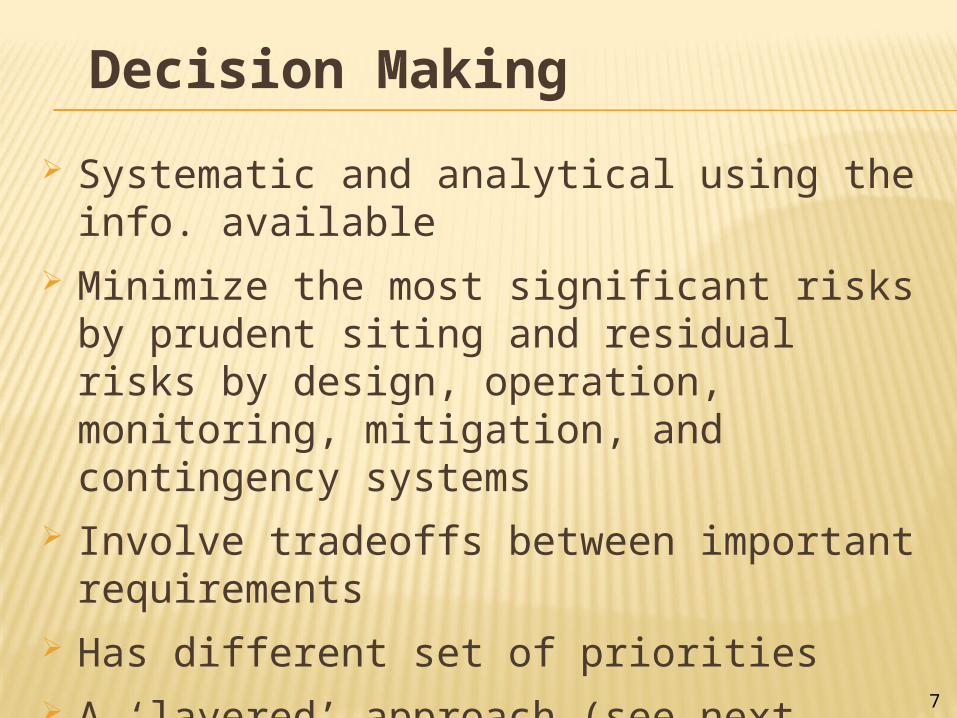
Decision Making
Systematic and analytical using the info. available
Minimize the most significant risks by prudent siting and residual risks by design, operation, monitoring, mitigation, and contingency systems
Involve tradeoffs between important requirements
Has different set of priorities A ‘layered’ approach (see next slide) for
site assessment is recommended. 7
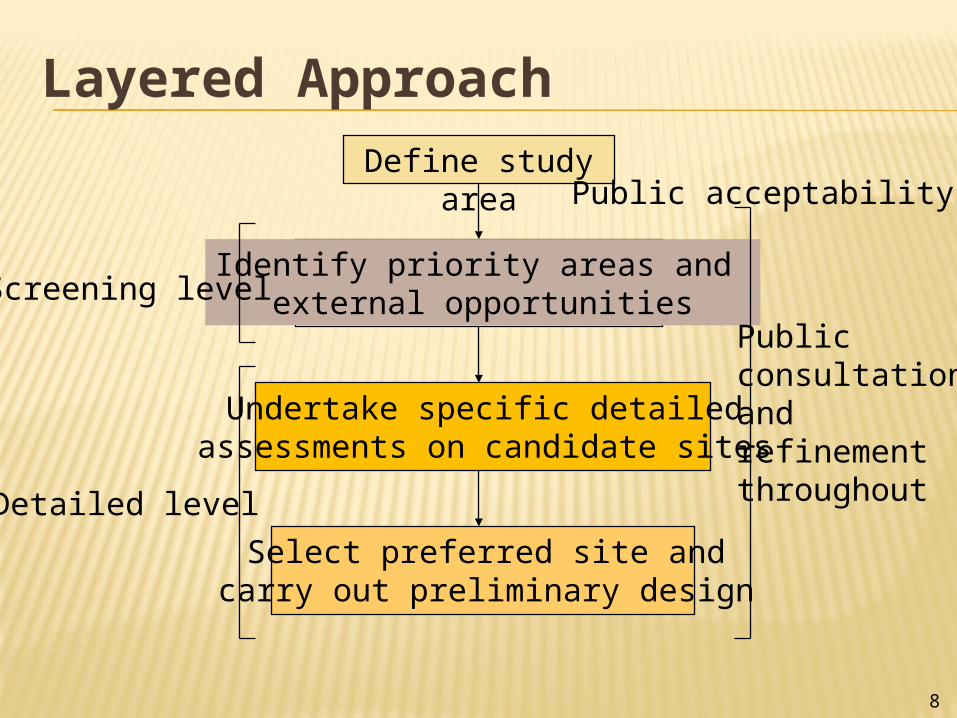
Layered ApproachDefine study
area
Identify priority areas and external opportunities
Undertake specific detailedassessments on candidate sites
Select preferred site andcarry out preliminary design
Publicconsultationandrefinementthroughout
Screening level
Detailed level
Public acceptability
8
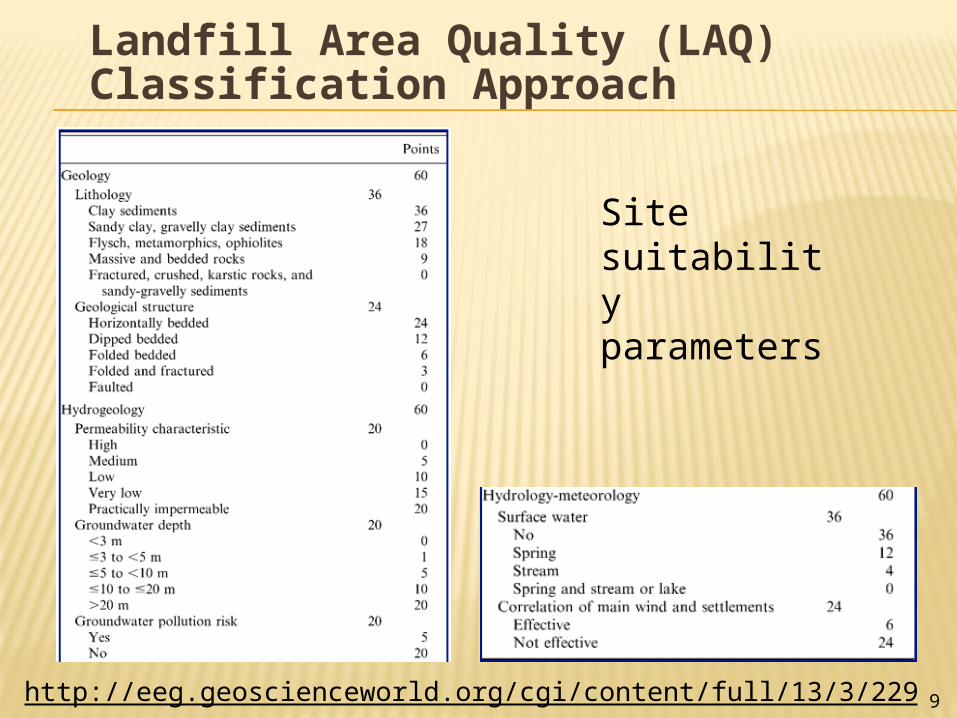
Landfill Area Quality (LAQ) Classification Approach
Site suitability parameters
http://eeg.geoscienceworld.org/cgi/content/full/13/3/229 9
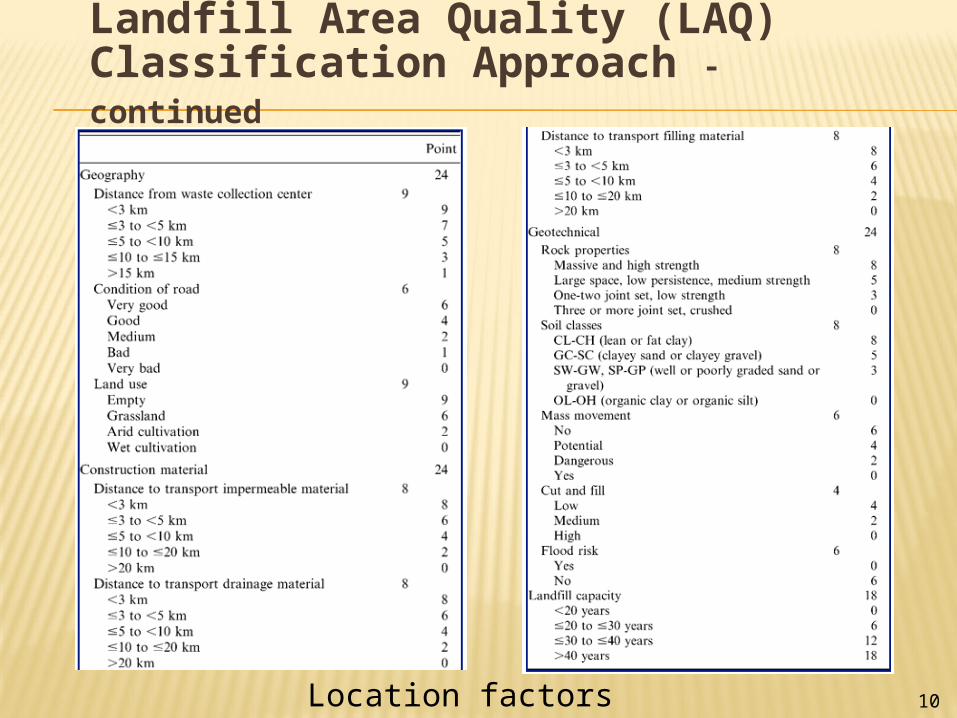
Location factors 10
Landfill Area Quality (LAQ) Classification Approach - continued
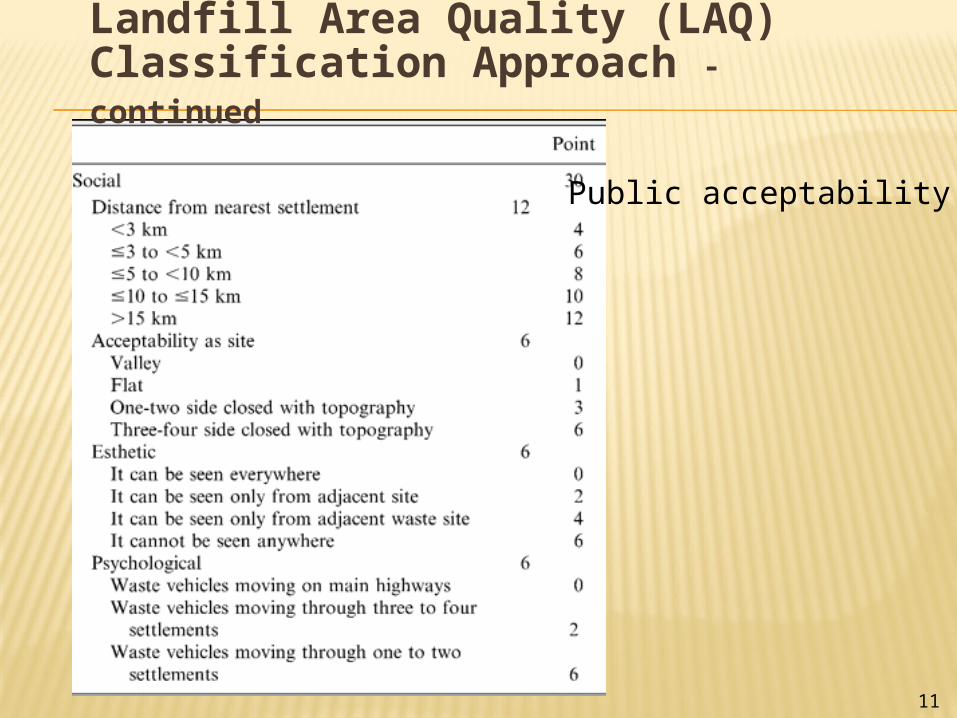
Public acceptability
11
Landfill Area Quality (LAQ) Classification Approach - continued
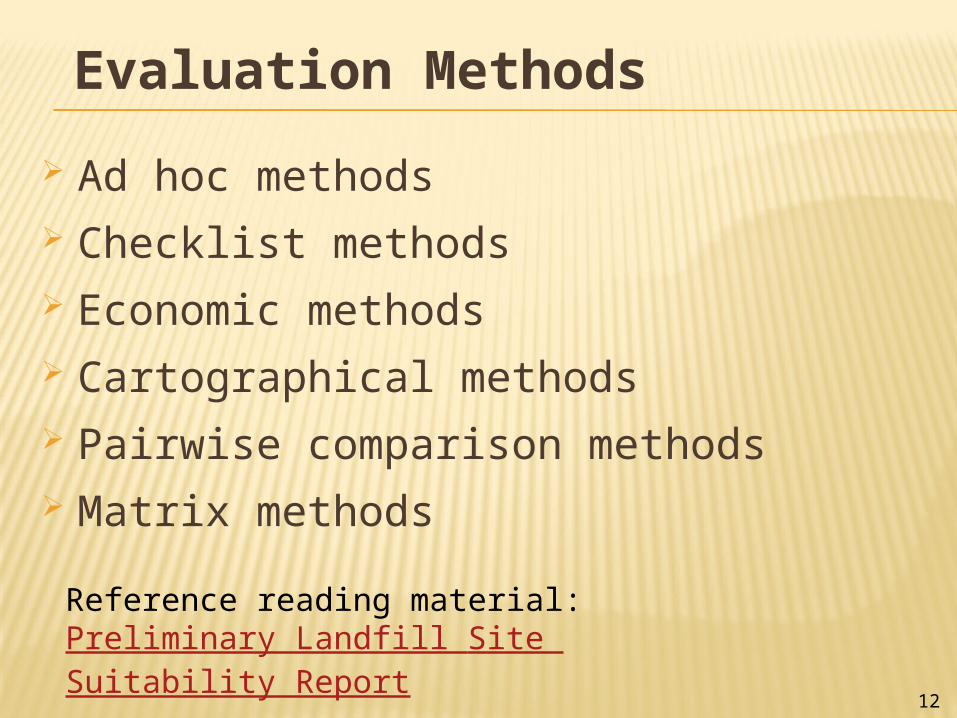
Evaluation Methods
Ad hoc methods Checklist methods Economic methods Cartographical methods Pairwise comparison methods Matrix methods
12
Reference reading material: Preliminary Landfill Site Suitability Report
Ad Hoc Methods
Based on professional judgment Narrative without specifying criteria,
ratings, or weights No assurance on systematic alternative
evaluation No assurance on dimensions of the
environment considered No assurance on addressing public
concerns Not traceable and lacking accountability Difficult to explain to the public Not acceptable in today’s environment
13
Checklist Methods Compare and evaluate alternatives
against a specified set of criteria (or list) with no tradeoffs
Expressed as yes/no responses Widely varying and complex Evaluation checklists: unordered
checklists of criteria/impacts; scaling-weighting checklists; satisficing checklist
Impact indentification checklists: simple checklists; questionnaire checklists
Used during screening alternatives14
Economic Evaluation Methods
Attempt to represent all aspects of a project in monetary terms
Costs and benefits are expressed in terms of the individual’s willingness to pay for the benefits.
Market prices are used for estimating the willingness-to-pay and willingness-to-accept values.
The estimation of externalities (effects on third parties), such as noise and loss of natural areas, is an important and difficult aspect of cost-benefit analyses.
The implementation of this procedure is very difficult and hard to defend in a public form.
15
Cartographic Methods Compare and evaluate alternatives using
maps and are used at the site-identification stages.
Constraint Mapping Defines characteristics undesirable for sites and
then systematically eliminates areas that possess these constraints.
Considerable time and expense, no allowance for ranking or comparison of remaining areas or sites
Overlay Mapping Similar to constraint mapping but with addition
of weighting and rating factors. Good for preliminary site-selection process 16
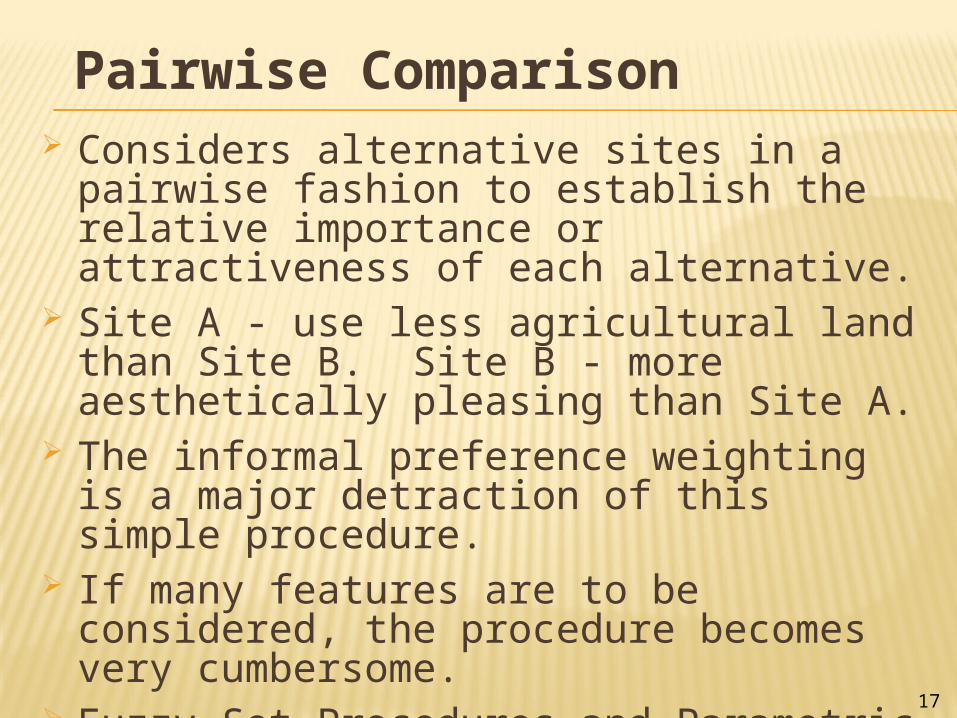
Pairwise Comparison Considers alternative sites in a pairwise
fashion to establish the relative importance or attractiveness of each alternative.
Site A - use less agricultural land than Site B. Site B - more aesthetically pleasing than Site A.
The informal preference weighting is a major detraction of this simple procedure.
If many features are to be considered, the procedure becomes very cumbersome.
Fuzzy-Set Procedures and Parametric Ranking 17
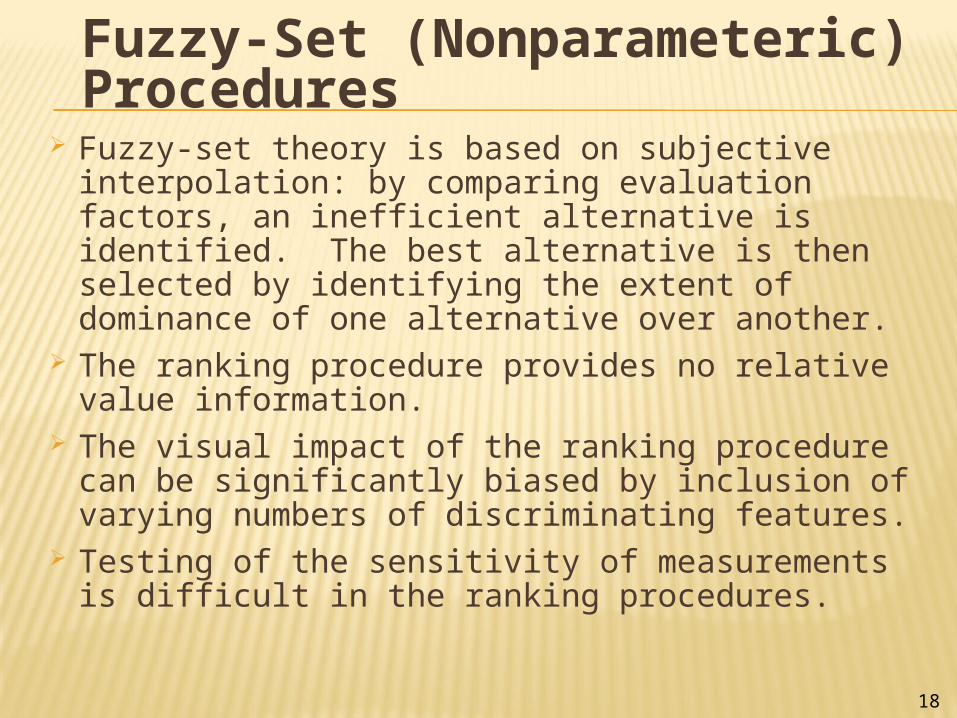
Fuzzy-Set (Nonparameteric) Procedures
Fuzzy-set theory is based on subjective interpolation: by comparing evaluation factors, an inefficient alternative is identified. The best alternative is then selected by identifying the extent of dominance of one alternative over another.
The ranking procedure provides no relative value information.
The visual impact of the ranking procedure can be significantly biased by inclusion of varying numbers of discriminating features.
Testing of the sensitivity of measurements is difficult in the ranking procedures.
18
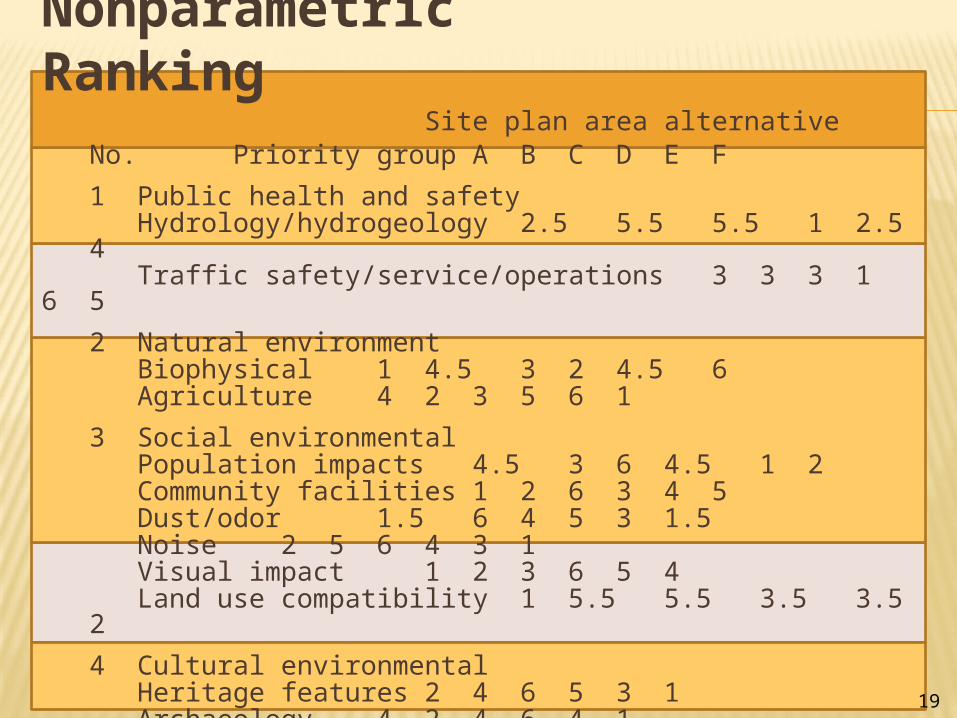
Nonparametric Ranking Site plan area alternative
No. Priority group A B C DE F
1 Public health and safetyHydrology/hydrogeology 2.5 5.5 5.5
1 2.5 4Traffic safety/service/operations 3 3
3 1 6 5
2 Natural environmentBiophysical 1 4.5 3 2
4.5 6Agriculture 4 2 3 5
6 1
3 Social environmentalPopulation impacts 4.5 3 6 4.5
1 2Community facilities 1 2 6 3
4 5Dust/odor 1.5 6 4 5
3 1.5Noise 2 5 6 4 3
1Visual impact 1 2 3 6
5 4Land use compatibility 1 5.5 5.5
3.5 3.5 2
4 Cultural environmentalHeritage features 2 4 6 5
3 1Archaeology 4 2 4 6
4 1
5 CostsCosts 1 5.5 5.5 2.5 2.5
4
19
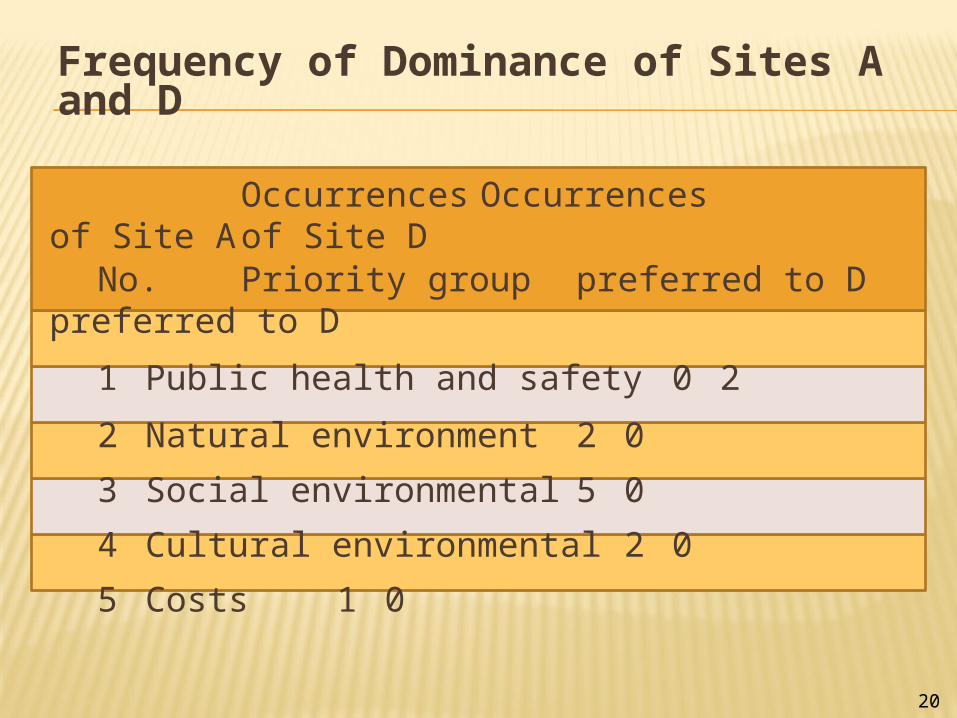
Frequency of Dominance of Sites A and D
Occurrences Occurrences of Site A of Site D
No. Priority group preferred to Dpreferred to D
1 Public health and safety 0 2
2 Natural environment 2 0
3 Social environmental 5 0
4 Cultural environmental 2 0
5 Costs 1 0
20
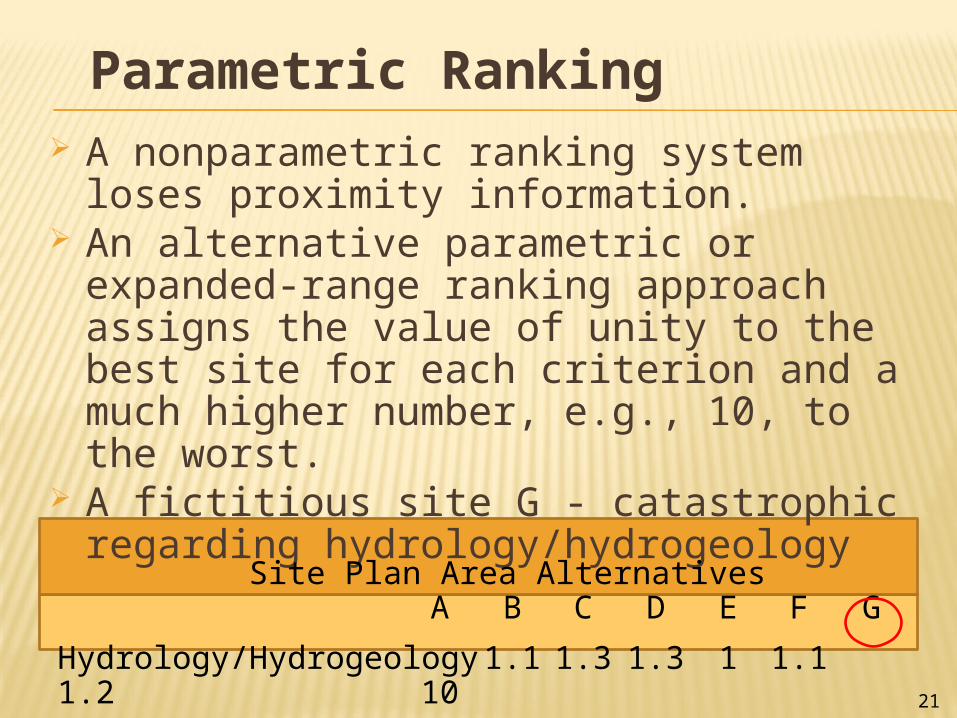
Parametric Ranking A nonparametric ranking system loses
proximity information. An alternative parametric or expanded-
range ranking approach assigns the value of unity to the best site for each criterion and a much higher number, e.g., 10, to the worst.
A fictitious site G - catastrophic regarding hydrology/hydrogeology
Site Plan Area Alternatives
A B C D E F G
Hydrology/Hydrogeology 1.1 1.3 1.3 1 1.1 1.210 21
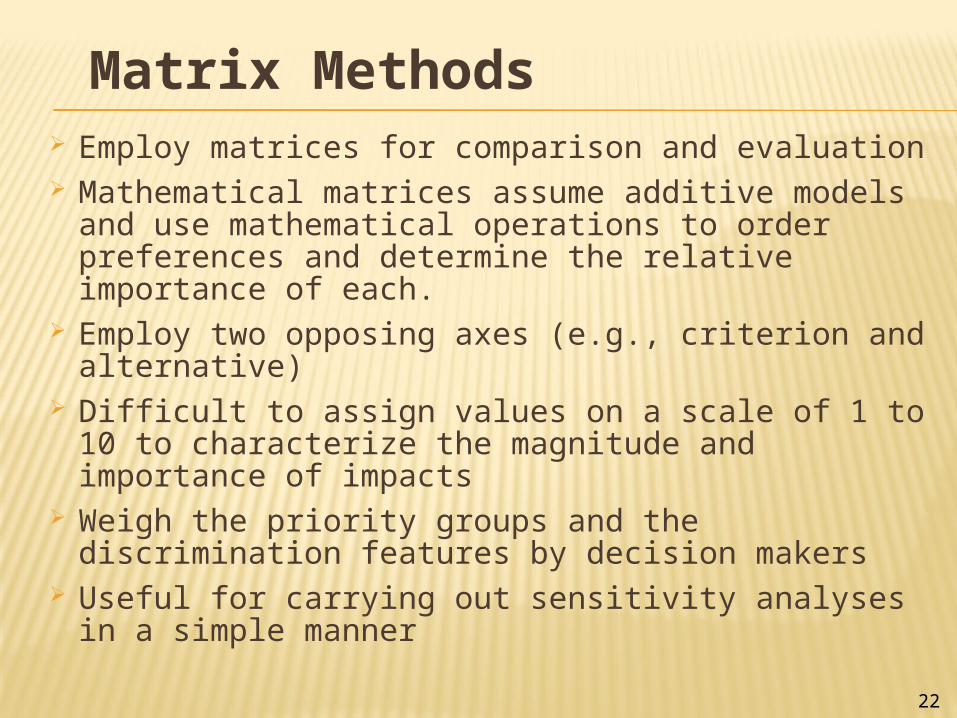
Matrix Methods Employ matrices for comparison and evaluation Mathematical matrices assume additive models
and use mathematical operations to order preferences and determine the relative importance of each.
Employ two opposing axes (e.g., criterion and alternative)
Difficult to assign values on a scale of 1 to 10 to characterize the magnitude and importance of impacts
Weigh the priority groups and the discrimination features by decision makers
Useful for carrying out sensitivity analyses in a simple manner
22
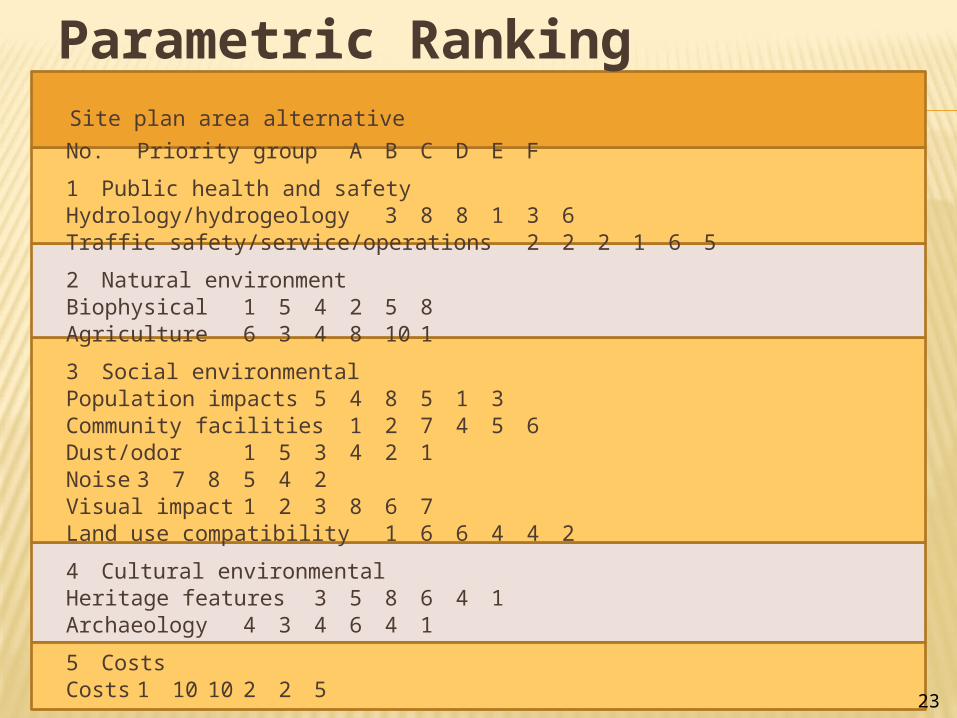
Parametric Ranking Site plan area
alternative
No. Priority group A B C D E F
1 Public health and safetyHydrology/hydrogeology 3 8 8 1 3 6Traffic safety/service/operations 2 2 2 1 6 5
2 Natural environmentBiophysical 1 5 4 2 5 8Agriculture 6 3 4 8 10 1
3 Social environmentalPopulation impacts 5 4 8 5 1 3Community facilities 1 2 7 4 5 6Dust/odor 1 5 3 4 2 1Noise 3 7 8 5 4 2Visual impact 1 2 3 8 6 7Land use compatibility 1 6 6 4 4 2
4 Cultural environmentalHeritage features 3 5 8 6 4 1Archaeology 4 3 4 6 4 1
5 CostsCosts 1 10 10 2 2 5 23
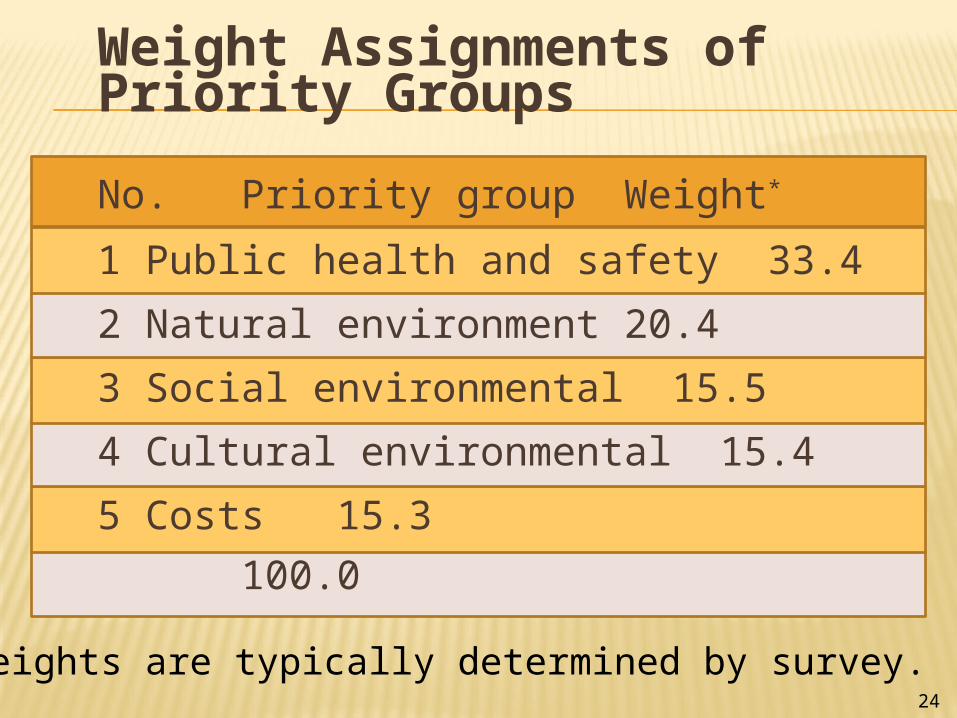
Weight Assignments of Priority Groups
No. Priority group Weight*
1 Public health and safety 33.4
2 Natural environment 20.4
3 Social environmental 15.5
4 Cultural environmental 15.4
5 Costs 15.3
100.0
24
* Weights are typically determined by survey.
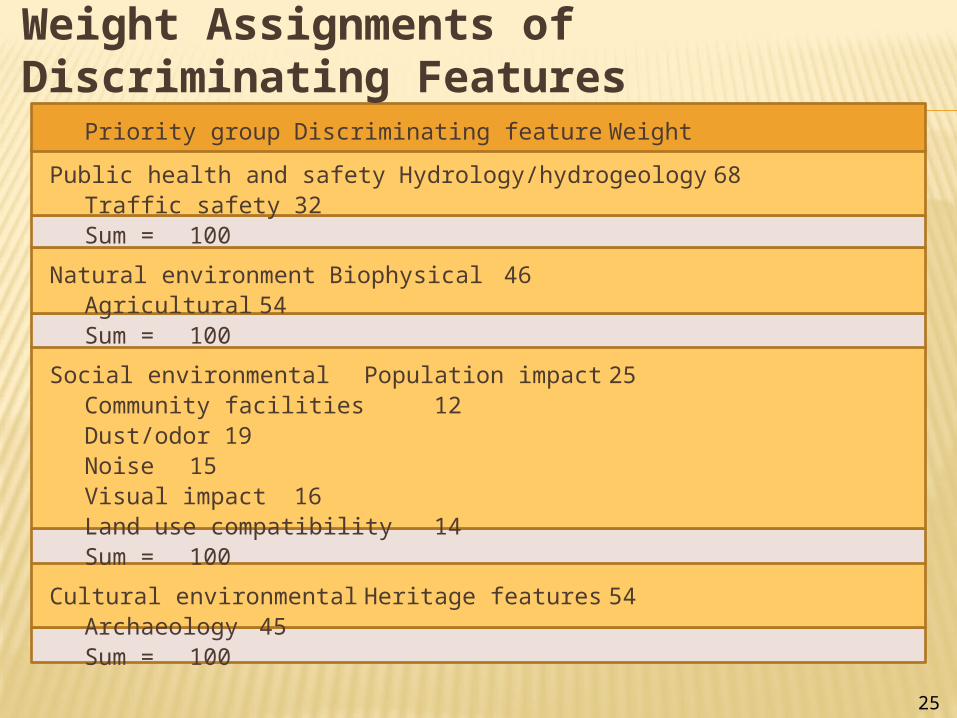
Weight Assignments of Discriminating Features
Priority group Discriminating feature Weight
Public health and safety Hydrology/hydrogeology 68Traffic safety 32
Sum = 100
Natural environment Biophysical 46Agricultural 54
Sum = 100
Social environmental Population impact 25Community facilities 12Dust/odor 19Noise 15Visual impact 16Land use compatibility 14
Sum = 100
Cultural environmental Heritage features 54Archaeology 45
Sum = 10025
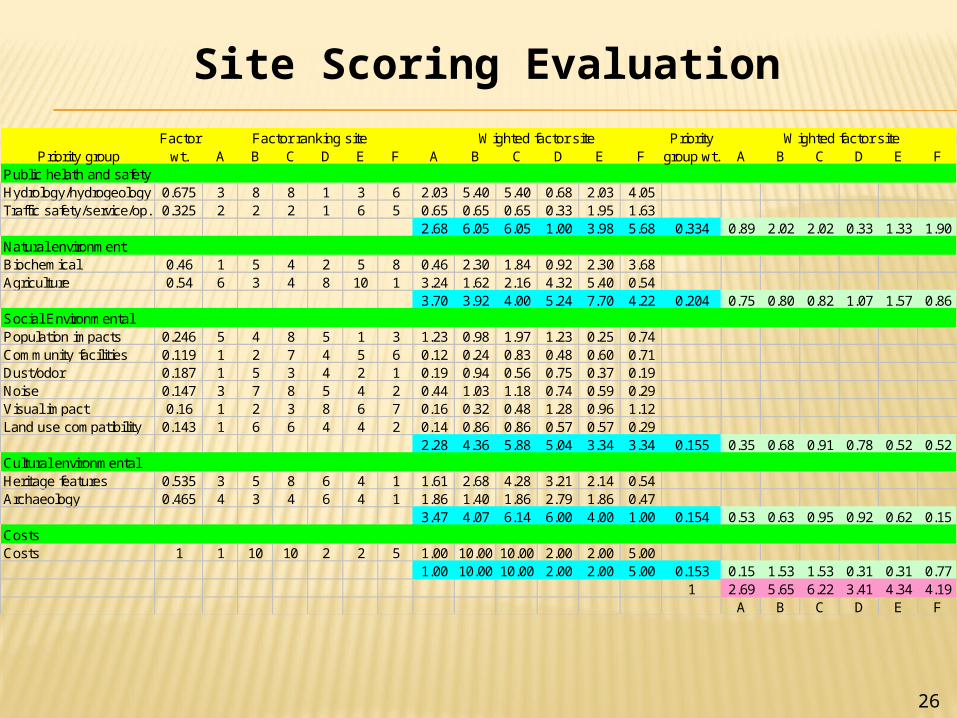
Factor Factor ranking site Wighted factor site Priority Wighted factor sitePriority group wt. A B C D E F A B C D E F group wt. A B C D E F
Public helath and safetyHydrology/hydrogeology 0.675 3 8 8 1 3 6 2.03 5.40 5.40 0.68 2.03 4.05Traffic safety/service/op. 0.325 2 2 2 1 6 5 0.65 0.65 0.65 0.33 1.95 1.63
2.68 6.05 6.05 1.00 3.98 5.68 0.334 0.89 2.02 2.02 0.33 1.33 1.90Natural environmentBiochemical 0.46 1 5 4 2 5 8 0.46 2.30 1.84 0.92 2.30 3.68Agriculture 0.54 6 3 4 8 10 1 3.24 1.62 2.16 4.32 5.40 0.54
3.70 3.92 4.00 5.24 7.70 4.22 0.204 0.75 0.80 0.82 1.07 1.57 0.86Social EnvironmentalPopulation impacts 0.246 5 4 8 5 1 3 1.23 0.98 1.97 1.23 0.25 0.74Community facilities 0.119 1 2 7 4 5 6 0.12 0.24 0.83 0.48 0.60 0.71Dust/odor 0.187 1 5 3 4 2 1 0.19 0.94 0.56 0.75 0.37 0.19Noise 0.147 3 7 8 5 4 2 0.44 1.03 1.18 0.74 0.59 0.29Visual impact 0.16 1 2 3 8 6 7 0.16 0.32 0.48 1.28 0.96 1.12Land use compatibility 0.143 1 6 6 4 4 2 0.14 0.86 0.86 0.57 0.57 0.29
2.28 4.36 5.88 5.04 3.34 3.34 0.155 0.35 0.68 0.91 0.78 0.52 0.52Cultural environmentalHeritage features 0.535 3 5 8 6 4 1 1.61 2.68 4.28 3.21 2.14 0.54Archaeology 0.465 4 3 4 6 4 1 1.86 1.40 1.86 2.79 1.86 0.47
3.47 4.07 6.14 6.00 4.00 1.00 0.154 0.53 0.63 0.95 0.92 0.62 0.15CostsCosts 1 1 10 10 2 2 5 1.00 10.00 10.00 2.00 2.00 5.00
1.00 10.00 10.00 2.00 2.00 5.00 0.153 0.15 1.53 1.53 0.31 0.31 0.771 2.69 5.65 6.22 3.41 4.34 4.19
A B C D E F
Site Scoring Evaluation
26
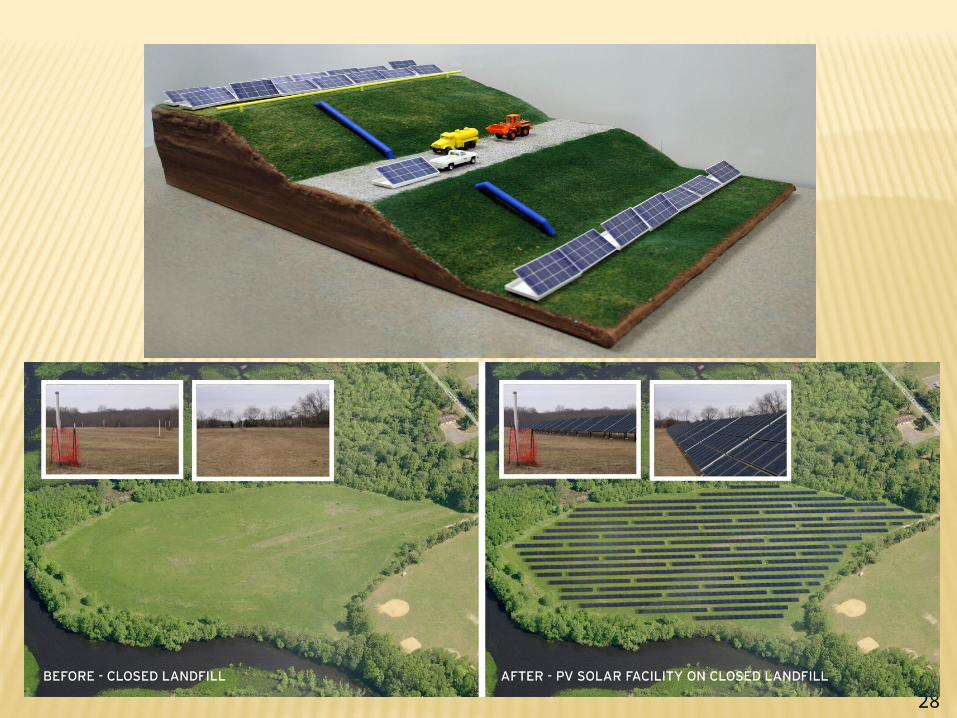
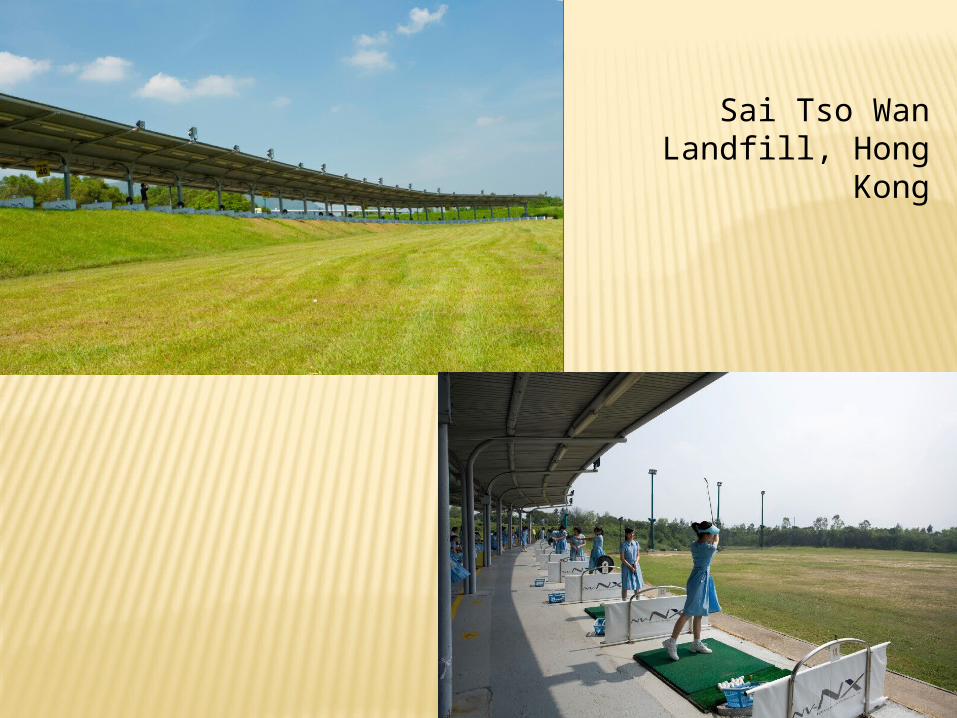
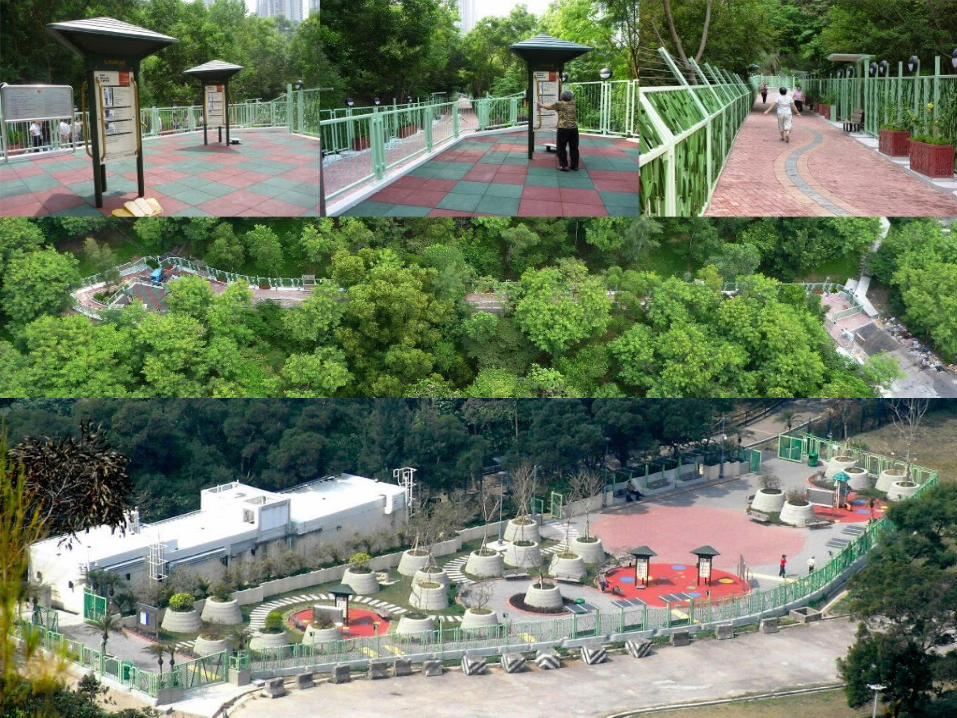
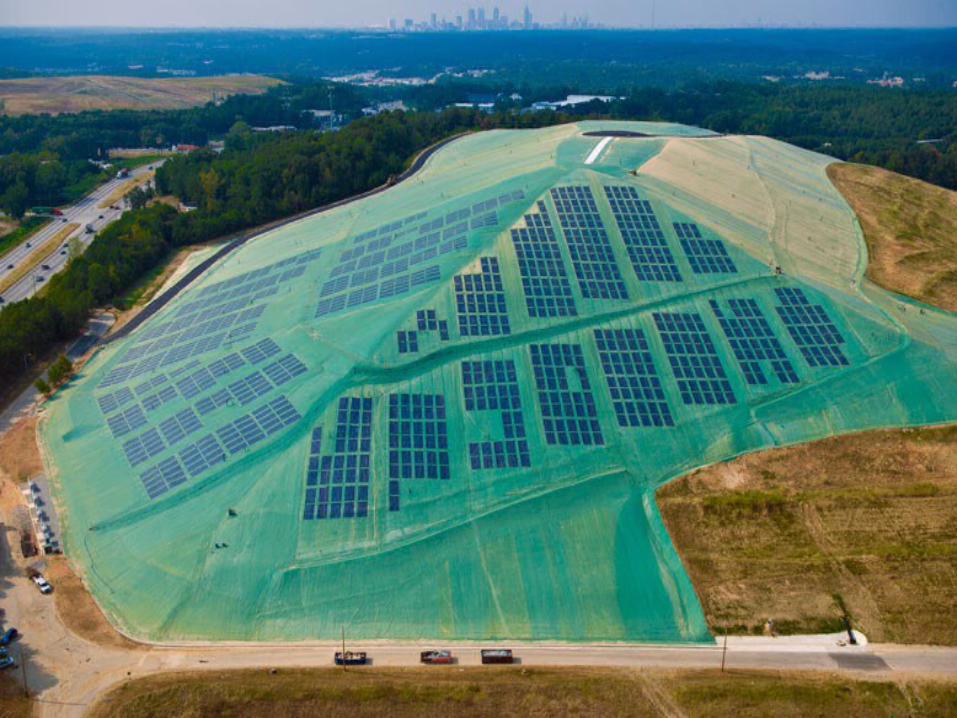
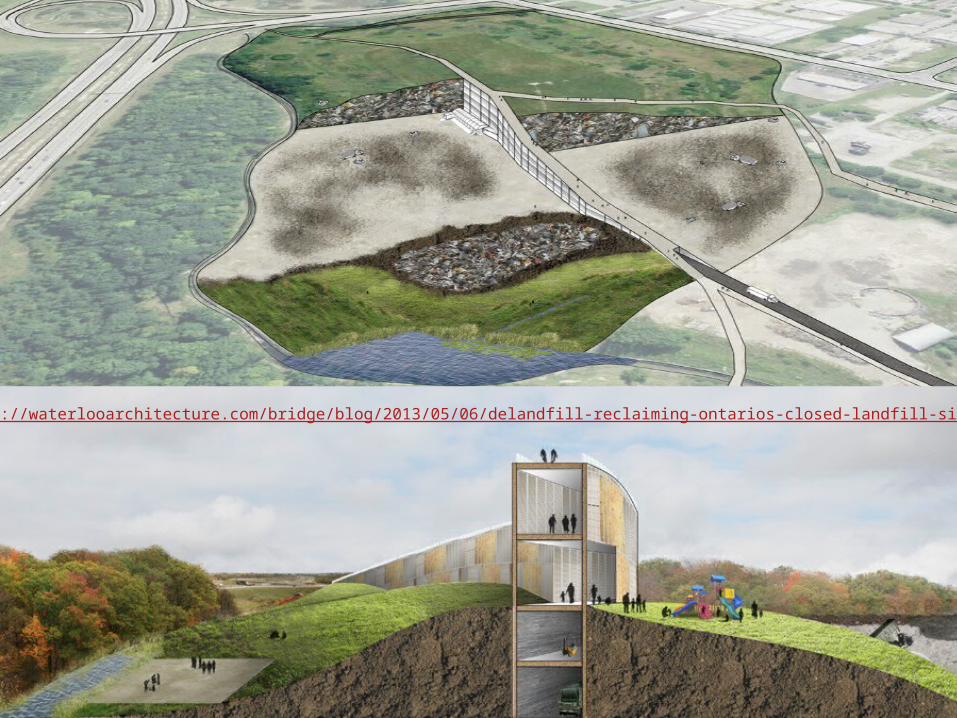
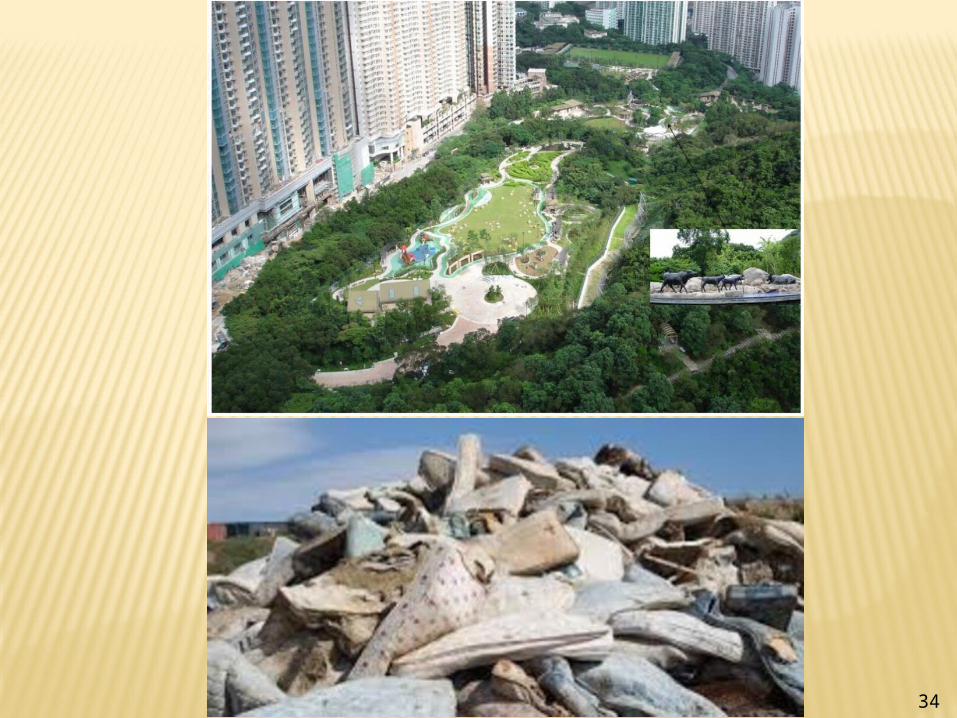
Site End Uses
Completed landfill sites - parks and recreation areas, such as ski slopes, toboggan runs, coasting hills, ball fields, golf courses, amphitheaters, and playgrounds; botanical gardens; residential and industrial development; parking areas
Considerations: Settlement, gas migration, ponding, cracking, and erosion of the cover material
27
28

29
The Gold Club at Newcastle, Newcastle, Washington
30
Sai Tso Wan Landfill, Hong Kong
31
32
33
http://waterlooarchitecture.com/bridge/blog/2013/05/06/delandfill-reclaiming-ontarios-closed-landfill-sites/
34
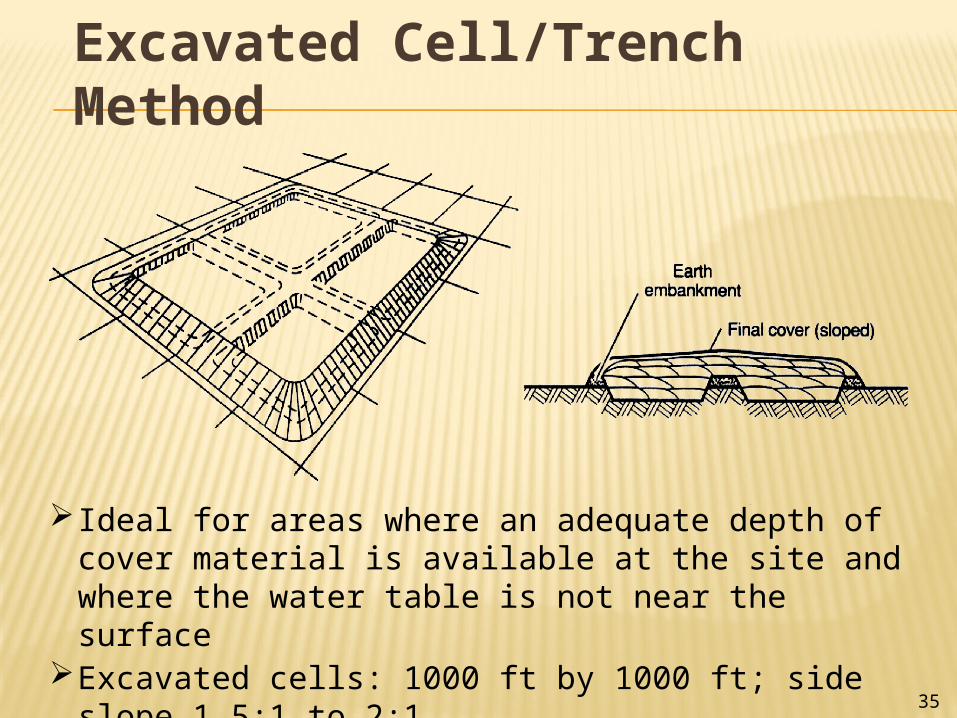
Excavated Cell/Trench Method
Ideal for areas where an adequate depth of cover material is available at the site and where the water table is not near the surface
Excavated cells: 1000 ft by 1000 ft; side slope 1.5:1 to 2:1
Trench: 200~1000 ft by 15~50 ft; 3~10 ft in depth35
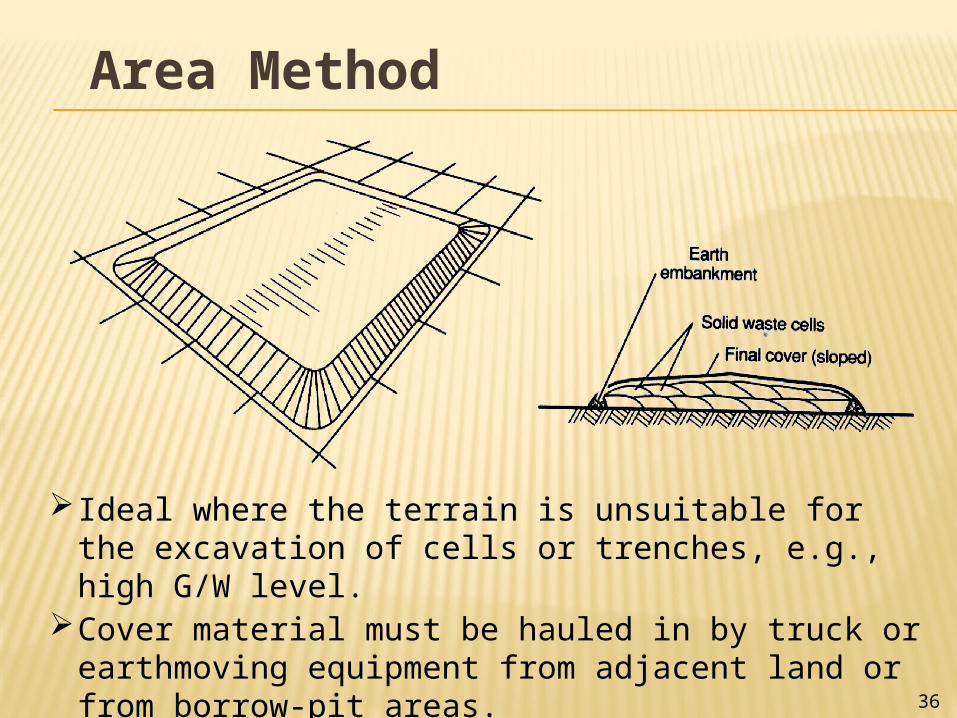
Area Method
Ideal where the terrain is unsuitable for the excavation of cells or trenches, e.g., high G/W level.
Cover material must be hauled in by truck or earthmoving equipment from adjacent land or from borrow-pit areas.
36
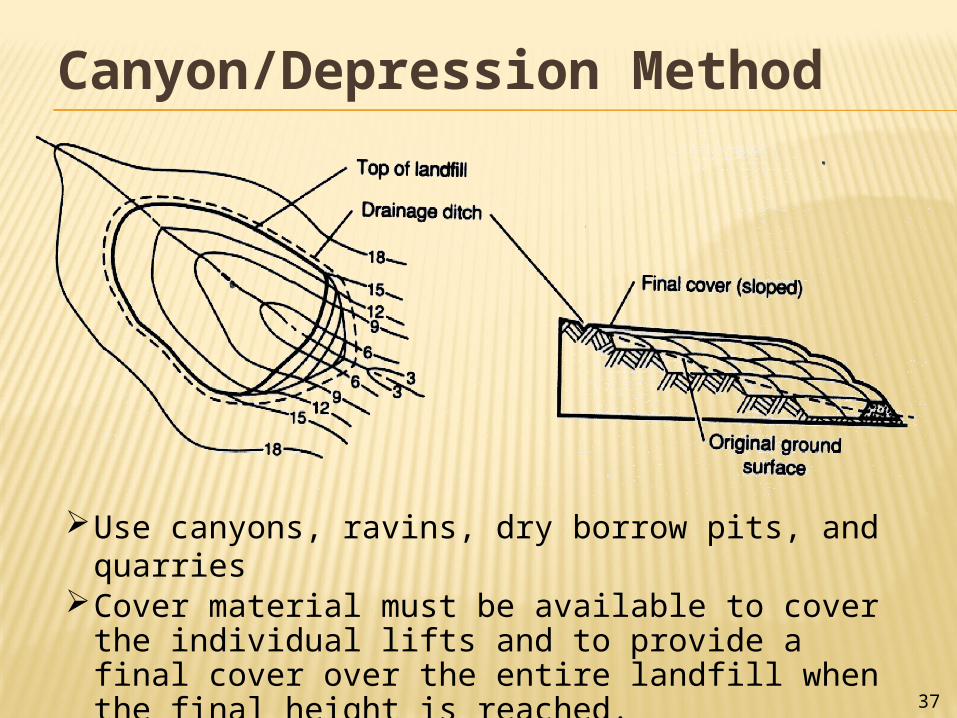
Canyon/Depression Method
Use canyons, ravins, dry borrow pits, and quarriesCover material must be available to cover the
individual lifts and to provide a final cover over the entire landfill when the final height is reached.
37


![lying Inn]]](https://img.pdfslide.net/doc/110x75/577d2f881a28ab4e1eb1fb5b/lying-inn.jpg)