Embed Size (px)
Citation preview

SITE SUITABILITY ANALYSIS FOR INDUSTRIES USING GIS AND
MULTI CRITERIA DECISION MAKING
Sarath.M 1* , Sameer Saran 2 , K.V.Ramana 3
1 Centre for Space Science and Technology Education in Asia and the Pacific, Dehradun, India - [email protected]
2 Geoinformatics Department, Indian Institute of Remote Sensing, Dehradun, India - [email protected] 3 Andhra Pradesh Space Applications Centre, Vijayawada, India - [email protected]
Commission V. SS: Infrastructure and Development Planning
KEY WORDS: GIS, Multi Criteria Decision Making, industries, Remote sensing, criteria, Sensitivity analysis, land use land cover
ABSTRACT:
Developing countries have to be very cautious in utilizing the land as they affect the food security, cause damage to environment and
an ecological imbalance might be created in the process of establishing industries to raise the standard of living of the people from
poverty. India, as a developing nation with sufficient amount of arable land at present is producing surplus food which is sufficient
for all the population, in the recent decades loosing productive agricultural land without proper scientific solution for industries.
This is a major concern because it causes not only food scarcity but dependency on the other nations even though we have lot of
industries. We need to maintain a balance between Agriculture and manufacturing sectors to have smooth run of the country’s
economy. The purpose of the study is to assess the land use changes in the areas for recent years which have potential for industrial
establishment through land suitability analysis (LSA) to emphasize both agriculture and industries with sustainable development.
Geographic information Systems (GIS) and Multi Criteria Decision Making (MCDM) are combined to distinctly identify the suitable
zones for industries. Six criteria in Analytical hierarchy Process (AHP) and nine criteria in Technique for Order of Preference by
Similarity to Ideal Solution (TOPSIS) are evaluated by spatial analysis using ArcGIS software. Considerable amount of productive
agricultural land is diverted to non agricultural purposes during last 12 years i.e., from 2004 – 2016, which is at first taken for
industrial establishment. Results obtained by the methodology we followed have given considerable accuracy by cross checking the
previously established industries with suitability regions. Thus GIS and MCDM can assist the policy makers and planning officials
to get a better overview with the resources they possess to carry forward with less damage to environment and agricultural land...
* Corresponding author
1. INTRODUCTION
Global trepidation for food security and quality of living for
succeeding generations and increasing cognizance of
environmental degradation pose serious questions to the
accomplishments of science and technology. Similar to many
other resource management plans, land resource planning
includes resource allocation difficulties and the challenge is to
devise complex, spatially and temporally interdependent
patterns of uses to achieve frequently conflicting goals. Solving
issues and making decisions about land resources, demand
integration of data and knowledge from various disciplines.
1.1 Need for site suitability
Establishment of industries is in the very interest of the societal
development but not for the individual or political gains. Some
of the industries established in the state during past decade
made this study inevitable. It is completely necessary to setup
industries as it generates employment which in turn increases
the income source of the people which makes not only the
individuals economically stable but also the economy of the
state at large. It is not exaggerating to say that it is of national
importance as it is directly related to stability of the national
economy. The rate of population growth of late has increased
drastically and people with unemployment has grown at a
proportionate scale which is a very critical thing to be thought
off otherwise it may lead to crisis in the country causing a
irreparable damage. With this kind of challenge ahead there is
complete necessity to setup industries and India being an
agriculture dependant nation and with lot of population has to
take care of agriculture lands while establishing the industries.
Ray (1998) stated that the agriculture sway for a huge chunk of
nationwide production in third world nations, it is essential for
this sector to prosper so as to contribute workforce to the other
sectors. Growth of the industrial sector will able to only flourish
if agricultural production is higher than its manufacturer’s
necessity.
1.2. GIS & Multi Criteria Decision Making (MCDM)
Successful formulation of policies for land usage requires
analysis of land usage details to make sure that site selected for
certain purpose is appropriate . Land use planning consists of
identification, suitability analysis, conflicting judgments in
comparative analysis. Many problems associated with real
world have spatial factor involved in them. MCDM and GIS can
be able to solve them efficiently with their computational
capabilities, which implicitly became a platform to the majority
of the problems that are required for better planning. Multi
criteria Decision Making can be classified into Multi Attribute
Decision Making (MADM) and Multi Objective Decision
Making (MODM). MCDM is used as a general term including
both attribute and objective. The objective of Multi Attribute
Decision Making (MADM) analysis is to select the most
preferable alternative. There are lots of decision making
ISPRS Annals of the Photogrammetry, Remote Sensing and Spatial Information Sciences, Volume IV-5, 2018 ISPRS TC V Mid-term Symposium “Geospatial Technology – Pixel to People”, 20–23 November 2018, Dehradun, India
This contribution has been peer-reviewed. The double-blind peer-review was conducted on the basis of the full paper. https://doi.org/10.5194/isprs-annals-IV-5-447-2018 | © Authors 2018. CC BY 4.0 License.
447

methods that can be used to solve the MADM problems.
Additive decision methods are widely accepted to solve the
MADM problems along with ideal point methods. Analytical
Hierarchy process (AHP) is one of the additive decision
methods which is used in lot of real world problems as well as
non spatial problems. Breaking complex problems to simple
form by hierarchy or levels and then integrate mathematical
computation for pair wise comparison and normalization which
results in priority vectors also known to be criteria weights.
1.3. Role of Remote Sensing and GIS
Availability of data is vital to perform any type of analysis.
Remote Sensing has made that vital component accessible at an
incredible level and GIS has played its part in analyzing the data
obtained through the former and combination of both has made
the primary task of analyzing very easy compared to the earlier
days, which used to take many number of days to manually
perform a field visit and then prepare a strategy to start the
work. Remote sensing has reduced the effort of man power by
the help of technology at an astounding manner.
Remote sensing can provide data of land use,
topography, drainage pattern, type of soil, etc.. GIS has the
capability to store, retrieve, manage and perform analysis using
both spatial and non spatial data. Integration of spatial and non-
spatial data and handling capacity made GIS a superior tool in
the field of geo-spatial world.
A set of criteria are considered to evaluate using
MCDM techniques. Data has to be prepared to process and
analyze. Cartosat-1 PAN & LISS IV Multi spectral (MSS) are
used to prepare some data. High spatial resolution and multi
spectral will make distinction in different features more precise.
2. STUDY AREA
The study is conducted in three districts of North coastal
Andhra Pradesh i.e., Visakhapatnam, Vizianagaram,
Srikakulam.
Fig 1: Study area
Visakhapatnam District is one of the North coastal districts of
Andhra Pradesh and it lies between 17°15' & 18°32' N and
18°54' & 83°30' E. It has two distinct geographic regions. The
district has rich deposits of Bauxite Apatite (Rock Phosphate)
Calcite, Crystalline limestone confined to tribal tracts. Bauxite
deposits at Sapparla, Jerrila and Gudem of G.K.Veedhi mandal
are known to be the largest in the country.
Vizianagaram district is a part of north coastal plains of Andhra
Pradesh and lies between 17015’ & 19015’N and 8300’ & 83045
E. The plain portion is a well cultivated tract while the hilly
region is dense forest and uneven. Nagavali, Gosthani,
Champavati, Vegavathi, Gomukhi rivers, which pass through
plains as well as hilly regions. The forests found in the district
are: Southern tropical moist mixed deciduous, north tropical dry
deciduous-Sal type, Southern tropical dry–mixed deciduous
forests, Dry deciduous forests, and Dry evergreen forests.
Srikakulam district is the extreme Northeastern district of
Andhra Pradesh situated between the geographic coordinates
18°20’ & 19°10’ N and 83°50’ & 84°50’ E. Around 60% of
land is under cultivation and 34% of the population is still
dependent on agriculture. The Nagavali, Vamsadhara,
Suvarnamukhi, Vegavathi, Mahendratanaya, Gomukhi,
Champavathi, Bahuda and Kumbikota Gedda are the important
rivers of the district. Vamsadhara, Nagavali and Suvarnamukhi
rivers rises in the Eastern Ghats and finally falls into the Bay of
Bengal. The major activities of the industries in Srikakulam
district are Pharma, Cashew, Jute, coir, Pesticide, Pistons,
Ammonium Nitrate, Rice mills, Granite, Stone crushers, Beach
Sand minerals, Power & Sugar. Palasa - Kasibugga is a famous
center of cashew industries in the district.
3. DATA USED
Land use and Land cover map is prepared using Linear Imaging
Self Scanner (LISS) IV multi spectral and Cartosat PAN. The
study area is clipped accordingly with the shape file of the area
and geo rectification is done using satellite image. It is prepared
at a scale of 1:10000 to have more detail of the area taken.
Unsupervised classification is performed as there will be lots of
classes are present in it.
Thematic layers Scale
District administrative
boundary
1:50000
District Major road network 1:10000
Water bodies 1:50000
Land use land cover map 1:10000
Flood map 1:50000
Digital elevation model
SRTM DEM
30m
Table 1: Thematic layers – Scale
Geology map is obtained from Andhra Pradesh Space
Applications Centre from the concerned department. North
Coastal Andhra Pradesh has rock types like Granite,
Khondalites, Charnockites, Quartz, Laterite, Shale stone, Gneiss
complex. Selection should be done carefully by watching out
the fault lines and avoid areas nearer to them to ensure stable
rock to build a structure.
Elevation of the area where potential locations for industries is
sited is to be known for better decision to be taken. Shuttle
Radar Topographic Mission (SRTM) DEM was downloaded
from a website www.dwtkns.com according to the study area
and classified to classes based on elevation present at that
ISPRS Annals of the Photogrammetry, Remote Sensing and Spatial Information Sciences, Volume IV-5, 2018 ISPRS TC V Mid-term Symposium “Geospatial Technology – Pixel to People”, 20–23 November 2018, Dehradun, India
This contribution has been peer-reviewed. The double-blind peer-review was conducted on the basis of the full paper. https://doi.org/10.5194/isprs-annals-IV-5-447-2018 | © Authors 2018. CC BY 4.0 License.
448
location. Sea level of an area is a very important factor during
identification of potential sites. Sites far above the sea level
increase the transportation cost are considered inappropriate
and sites below the sea level are prone to floods.
Slope map is generated using SRTM DEM. Areas with gentle
slope are considered more suitable for construction of large
structures. Moreover, stability issues during the construction
phase. Steeper slope areas are generally avoided to reduce the
risk of instability during construction.
Fig 2: Land use Land cover map
Land use and Land cover maps of 2004-05 and 2015-16 are
generated at level III i.e., to the level of type of crop lands and
waste lands using LISS IV and Cartosat I PAN merge images. It
was prepared and ground points were collected to validate the
prepared maps. These maps are to assess the situation before
and after the construction of industries during these years. The
land use and land cover maps will also help us to locate the
available locations of the established factories and land that was
transformed for non-agricultural practices.
River maps of the study area are prepared using the toposheets
and satellite images. Important rivers are Gosthani,
Champavathi, Nagavali, Sarada, Thandava, Varaha,
Vamshadhara. Flood prone areas are delineated using these
river maps and flood zone maps acquired from APSPDS,
Vijayawada.
Previously established industries GPS locations are collected to
assess the agricultural land diversion during the time frame
which I have considered. As shown in the map industries are
agglomerated in the urban areas of Visakhapatnam, in and
around Vizianagaram.
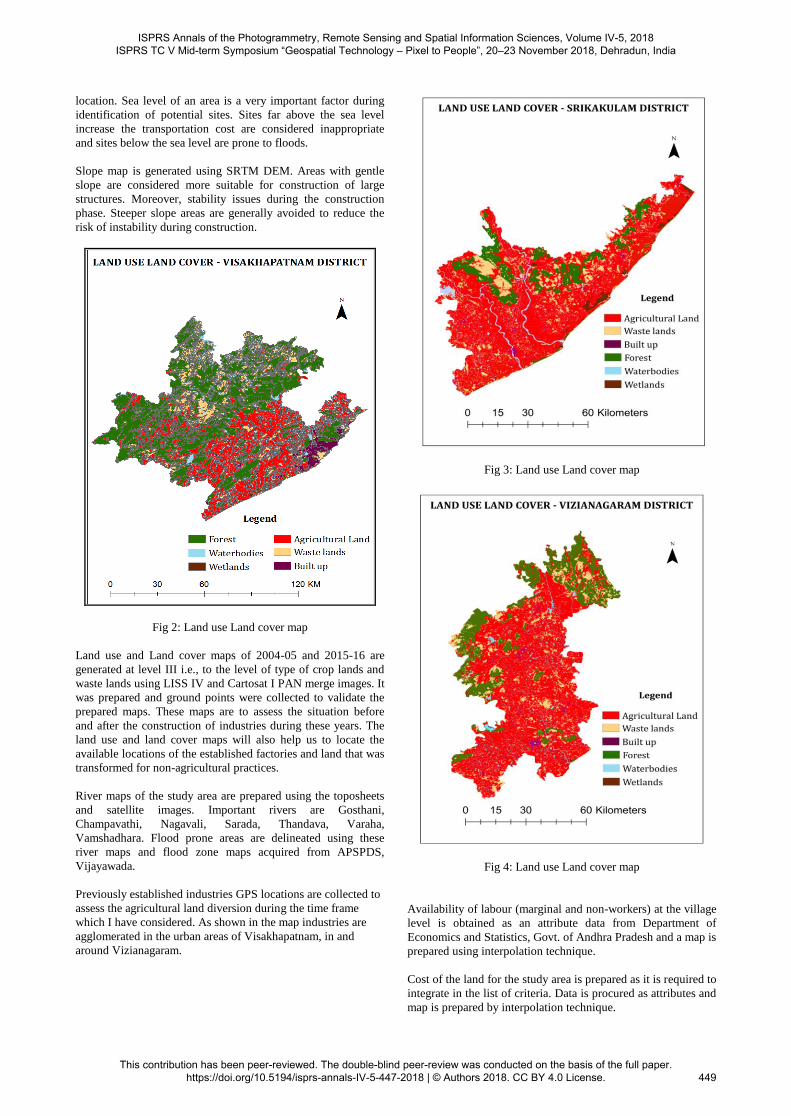
Fig 3: Land use Land cover map
Fig 4: Land use Land cover map
Availability of labour (marginal and non-workers) at the village
level is obtained as an attribute data from Department of
Economics and Statistics, Govt. of Andhra Pradesh and a map is
prepared using interpolation technique.
Cost of the land for the study area is prepared as it is required to
integrate in the list of criteria. Data is procured as attributes and
map is prepared by interpolation technique.
ISPRS Annals of the Photogrammetry, Remote Sensing and Spatial Information Sciences, Volume IV-5, 2018 ISPRS TC V Mid-term Symposium “Geospatial Technology – Pixel to People”, 20–23 November 2018, Dehradun, India
This contribution has been peer-reviewed. The double-blind peer-review was conducted on the basis of the full paper. https://doi.org/10.5194/isprs-annals-IV-5-447-2018 | © Authors 2018. CC BY 4.0 License.
449

Ground water level is vital aspect to assess the situation of
water availability to initiate any kind of construction.
Piezometer readings are collected and a map was prepared using
interpolation as we don’t have Piezometers located all over the
study area considered.
The problem of finding suitable land for establishing industries
is analyzed by the following method that utilizes advanced tools
to tackle the problems associated in best possible way to get the
most accurate outcome for sustainable land utilization. Any sort
of imbalance in land utilization can have very grave impact on
the land use system. It is known fact that land is exploited in
many ways and utilizing it judiciously is an achievement of a
decision maker.
The first phase deals with assessing agricultural land use by
Land use and Land cover map (LULC) of the time period taken
for the study and the locations of already established factories in
the region. Both data are analyzed along with land use before
the establishment of factories and can assess the effect of
improper setup of industries at improper locations without
scientific solution.
Data used is prepared using different inputs.
Firstly, Study area is delineated using the satellite image of
LISS (Linear Imaging Self Scanner) IV – MSS (Multi Spectral
Scanner) and Cartosat I PAN (Panchromatic).
Road network of minor, major, state and national highways
within the study area are drawn and a shape file is created.
According to the available sources of information, to establish
an industry different thresholds are to maintained. A new
industrial which comes under major pollution contributor
should be constructed at a suitable location which is greater
than 500 meters from national highways. Industries which
produce medium and low pollution can be setup at a distance of
100-500 meters from the national highways. A new industrial
which comes under major pollution contributor should be
constructed at a suitable location which is greater than 100
meters from state highways and other major roads. Industries
which produce medium and low pollution can be setup at a
distance of 50-100 meters from the state highways and other
major roads
Geology was considered as it plays an important in the
suitability decision of sites for industries. Strength of the rock
and absence of fault zones will make the site suitable at the first
place. Without this consideration, we cannot go forward in the
process of site selection at any cost. The following types are
present in our study area: Khondalites, Charnockites, Granite,
Gneiss complex, Shale stone, Alluvium, Laterite, Quartz. The
strength of the rocks is in this order.
Gneiss complex > Charnockites > Granite > Khondalites >
Laterite > Quartz > Shale stone > Alluvium
Flood maps of the region are considered as it is also one of the
important factors to select a site for establishing any firm. As
industries are meant to be generally with medium to high
investment, care should be taken in such a manner that
investment is not at stake with hasty decisions. So flood zones
are identified and categorized according to their scale of
inundation during floods. The data collected was from past 100
years to get a better output. With the available data, areas
nearer to rivers are classified into flood zones and non flood
zones along the river banks. Any site which is closer to river
bank may be at some time being a threat to industry; they are
avoided at all times.
Elevation is also considered as one of the criteria to identify the
area which is at an elevation suitable to locate a site as the
elevation goes on increasing, the cost of raw materials reaching
the site, cost of fuel, constructing difficulties etc., come into
picture. So using Shuttle Radar Topographic Mission (SRTM)
DEM- 30 meters, study area is segregated to classes. Area
which is under 100 meters is considered to be highly suitable,
100 and 200 meters as moderately suitable, 200 to 300 as less
suitable, more than 300 meters as not suitable.
Slope map provides us the information such as the slope of the
area which is also very crucial for ease for construction and
stability at later stages. Based on the steepness area is divided
into classes. Slope is calculated in percentage
0 – 2 as level or nearly level, 2 – 6 as Very gently sloppy, 6 –
12 strongly sloppy, 12 – 20 moderately steep sloppy, above 25
as steep sloppy.
3.1 Analytical Hierarchical Process (AHP)
Spatial AHP is termed by Siddique et al., 1996 for the
purpose of multi criteria decision analysis that integrates GIS
and AHP. In this project Spatial AHP is used to spot suitable
sites for industries and to quantify the levels through
categorization and usage of knowledge, facts based user
preference and data contained in GIS maps. The most difficult
assignment in carrying out land suitability analysis approach for
an exacting land use type is to assign the relative weights of the
entity criteria that are to be considered. Thus, the study limited
the criteria to the nine most important aspects.
Fig 5: Saaty’s nine point scale
AHP is divided into three stages:
I) Decomposition - Identify and structure the criteria
II) Comparative judgment - through pair wise
comparison
III) Aggregating the priorities - Calculate suitability index
This fig depicts whole procedure of AHP for establishing
industries. Structuring the ladder is comparatively subjective
activity and depends on decision maker’s skill and experience.
Criteria are to be considered based on the importance of user’s
requirement.
ISPRS Annals of the Photogrammetry, Remote Sensing and Spatial Information Sciences, Volume IV-5, 2018 ISPRS TC V Mid-term Symposium “Geospatial Technology – Pixel to People”, 20–23 November 2018, Dehradun, India
This contribution has been peer-reviewed. The double-blind peer-review was conducted on the basis of the full paper. https://doi.org/10.5194/isprs-annals-IV-5-447-2018 | © Authors 2018. CC BY 4.0 License.
450
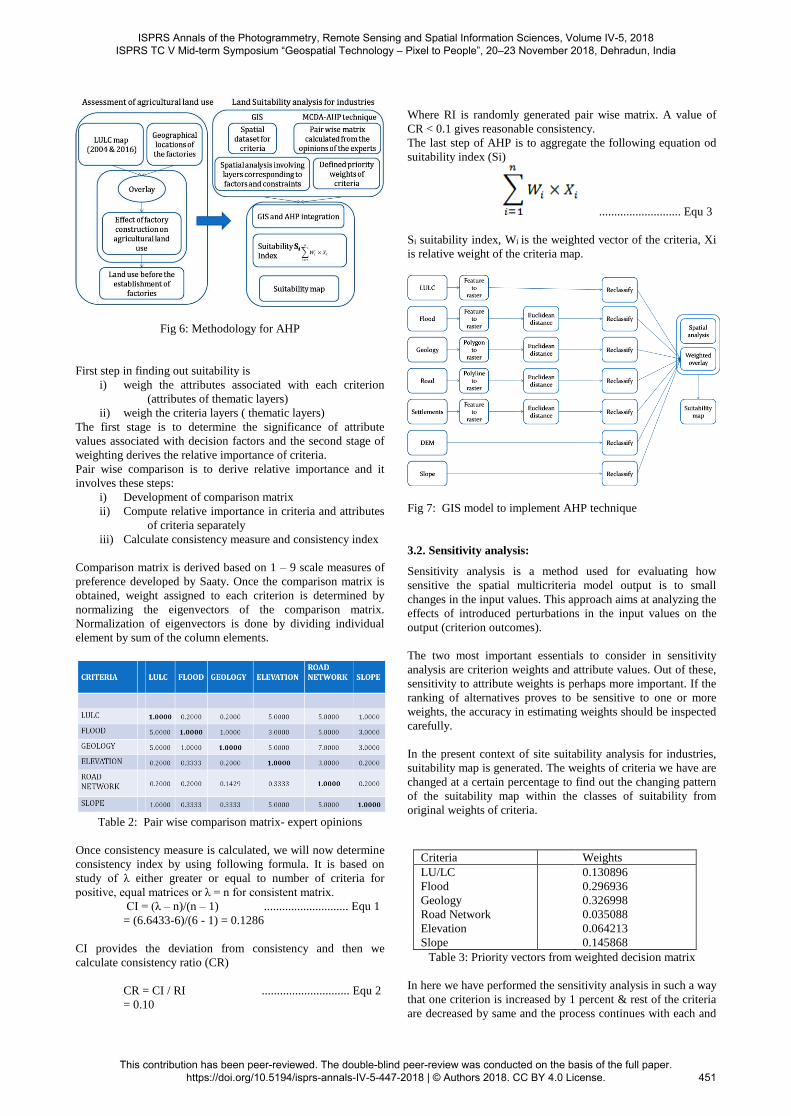
Fig 6: Methodology for AHP
First step in finding out suitability is
i) weigh the attributes associated with each criterion
(attributes of thematic layers)
ii) weigh the criteria layers ( thematic layers)
The first stage is to determine the significance of attribute
values associated with decision factors and the second stage of
weighting derives the relative importance of criteria.
Pair wise comparison is to derive relative importance and it
involves these steps:
i) Development of comparison matrix
ii) Compute relative importance in criteria and attributes
of criteria separately
iii) Calculate consistency measure and consistency index
Comparison matrix is derived based on 1 – 9 scale measures of
preference developed by Saaty. Once the comparison matrix is
obtained, weight assigned to each criterion is determined by
normalizing the eigenvectors of the comparison matrix.
Normalization of eigenvectors is done by dividing individual
element by sum of the column elements.
Table 2: Pair wise comparison matrix- expert opinions
Once consistency measure is calculated, we will now determine
consistency index by using following formula. It is based on
study of λ either greater or equal to number of criteria for
positive, equal matrices or λ = n for consistent matrix.
CI = (λ – n)/(n – 1) ............................ Equ 1
= (6.6433-6)/(6 - 1) = 0.1286
CI provides the deviation from consistency and then we
calculate consistency ratio (CR)
CR = CI / RI ............................. Equ 2
= 0.10
Where RI is randomly generated pair wise matrix. A value of
CR < 0.1 gives reasonable consistency.
The last step of AHP is to aggregate the following equation od
suitability index (Si)
........................... Equ 3
Si suitability index, Wi is the weighted vector of the criteria, Xi
is relative weight of the criteria map.
Fig 7: GIS model to implement AHP technique
3.2. Sensitivity analysis:
Sensitivity analysis is a method used for evaluating how
sensitive the spatial multicriteria model output is to small
changes in the input values. This approach aims at analyzing the
effects of introduced perturbations in the input values on the
output (criterion outcomes).
The two most important essentials to consider in sensitivity
analysis are criterion weights and attribute values. Out of these,
sensitivity to attribute weights is perhaps more important. If the
ranking of alternatives proves to be sensitive to one or more
weights, the accuracy in estimating weights should be inspected
carefully.
In the present context of site suitability analysis for industries,
suitability map is generated. The weights of criteria we have are
changed at a certain percentage to find out the changing pattern
of the suitability map within the classes of suitability from
original weights of criteria.
Table 3: Priority vectors from weighted decision matrix
In here we have performed the sensitivity analysis in such a way
that one criterion is increased by 1 percent & rest of the criteria
are decreased by same and the process continues with each and
Criteria Weights
LU/LC 0.130896
Flood 0.296936
Geology 0.326998
Road Network 0.035088
Elevation 0.064213
Slope 0.145868
ISPRS Annals of the Photogrammetry, Remote Sensing and Spatial Information Sciences, Volume IV-5, 2018 ISPRS TC V Mid-term Symposium “Geospatial Technology – Pixel to People”, 20–23 November 2018, Dehradun, India
This contribution has been peer-reviewed. The double-blind peer-review was conducted on the basis of the full paper. https://doi.org/10.5194/isprs-annals-IV-5-447-2018 | © Authors 2018. CC BY 4.0 License.
451

criteria to visualize the changes in the suitability map produced.
The same process is done by changing the weights by 2, 3, 5
percent.
This table shows the change in the suitability levels according
to the change in priority vectors.
Original
weights
1
percent
change
2
percent
change
3
percent
change
5
percent
change
Land use
& Land
cover
0.1308 0.1322 0.1335 0.1348 0.1374
Flood 0.2969 0.2939 0.2909 0.2880 0.2820
Geology 0.3269 0.3237 0.3204 0.3171 0.3106
Elevation 0.0642 0.0635 0.0629 0.0622 0.0610
Road
network
0.0350
0.0347
0.0343
0.0340
0.0333
Slope 0.1458 0.1444 0.1429 0.1414 0.1385
Table 4: Percentage of suitability areas from sensitivity analysis
4. RESULTS AND DISCUSSIONS
4.1. Suitability map using GIS and MCDM
The following result is from aggregate of all the criteria
considered i.e., individual thematic layers are multiplied to the
respective priority vectors obtained from pair wise comparison
matrix of Analytical Hierarchy Process. Suitability map of the
region is classified to classes from not suitable to highly
suitable based on the cumulative evaluation of the criteria and
weightages given to them at criterion level as well as attribute
level. In this analysis to obtain a suitability map, geology and
flood were given more weightages as they can’t be ignored
while considering any area for any industrial establishment.
Some of the area in Visakhapatnam and Srikakulam districts is
found suitable according to the criteria selected and evaluation
done but due to constitutional authority possessed by the land
which comes under agency area of this district cannot be
selected for any large scale industrial establishment as this area
is a place for indigenous tribes.
Fig 8: Suitability map to establish industries using AHP
4.2. Sensitivity Analysis
This is generally performed to check the uncertainties and
variations of the criteria. Naturally uncertainty prevails when we
deal real world problems. To analyze the situation in a better
possible way we take this sensitivity analysis as an option to
address the issue. This analysis is generally done because most
of the times the criterion values are provided by human beings
and they possess inherent bias towards some criteria selected in
any of the problem considered for MCDM. To understand the
change by which we can be able to get a better idea in decision
making. Here, we have done slight changes in the values of
priority vectors such that Land use and land cover’s priority
vector’s value is raised by 1 percent and values of remaining
priority vectors are reduced by 1 percent. Thus, a very slight
change in the suitability is noticed. Suitability area with 1
percent change in land use and land cover has increased by 1
percent. and rest of the classes remain almost same
Table 5: Percentage of suitability areas from sensitivity analysis
(1 percent change in land use land cover)
Suitability
levels
Suitability
map
1 percent change
suitability map
Not suitable 3.9610 3.9147
Less suitable 12.258 12.1664
Moderately
suitable
33.204
33.2439
Suitable 34.546 34.7575
Highly
suitable
16.030 15.9172
ISPRS Annals of the Photogrammetry, Remote Sensing and Spatial Information Sciences, Volume IV-5, 2018 ISPRS TC V Mid-term Symposium “Geospatial Technology – Pixel to People”, 20–23 November 2018, Dehradun, India
This contribution has been peer-reviewed. The double-blind peer-review was conducted on the basis of the full paper. https://doi.org/10.5194/isprs-annals-IV-5-447-2018 | © Authors 2018. CC BY 4.0 License.
452

Fig 9: Suitability map with 1 percent change
The same operation is performed at a change of 5 percent to
detect the change with considerable detection in the change of
suitability classes. LULC’s priority vector’s weight was reduced
by 5 percent and the remaining criteria are increased by 5
percent to observe the change occurring.
Fig 10: Suitability map with 5 percent change
Suitability levels Suitability
map
5 percent change
suitability map
Not suitable 3.9610 15.9823
Less suitable 12.258 24.0520
Moderately
suitable
33.204 24.2007
Suitable 34.546 25.7958
Highly suitable 16.030 9.9690
Table 6: Percentage of suitability areas from sensitivity analysis
(5 percent change in land use land cover)
Here, regions which came under suitable are at some places
changed to unsuitable or moderately suitable, making the task
meaningful which proves that this kind of analysis is required
when we address these kinds of problems.
4.3. Conclusions
The spatial way of identifying the potential industrial sites and
the necessity to include decision maker’s preferences in the
analysis require a combination of GIS and MCDA methods.
Their synergy resulted in the MC-SDSS, which is an efficient
tool for integrating DM’s preferences regarding industrial sites
analysis for feasible areas with the help of multi criteria
methods. A real world case study in the three districts of north
coastal Andhra Pradesh i.e., Visakhapatnam, Vizianagaram,
Srikakulam was conducted, enabling the performance of various
environmental and economic criteria in the screening of
industrial sites location problem. This region is selected
particularly as there is dire need to save the available land
which is productive and at the same time, remaining region of
the state which is productive is losing the land at a very rapid
rate. As the time is ripe to maintain both agriculture as well as
industries for smooth running of the region without any chaos
with unemployment and food scarcity, this area has gained my
attention to work. With the problem at hand and short listing the
important factors necessary for the solution are considered.
Main factors being land use and land cover detail, geology of
the area, elevation and slope of the region, viable road network
to make the work easier at least in the initial stages. Evaluation
process was conducted with the help of some expert opinions
and individual perspective who provided the necessary
judgment to fill the comparison matrix. Finally suitability maps
were generated by AHP. Finding the potential industrial sites
using different techniques gives us a better picture to assess the
problems associated in it. Uncertainty is an inherited feature
while we deal with real world problems. So, we performed
sensitivity analysis by changing the criterion weights to certain
percentage to estimate the area changes within the classes of
suitability and to decide the suitability area. The conducted
analysis is not measure to the method’s superiority in that
problem solving. Various methods work better way for different
inputs we have provided to them and the decision maker’s
necessity. A GIS based land suitability analysis extends the
utilization of overlay operators to the decision maker’s
preferences. Some of the multi criteria methods have to be
investigated later to get a better results. Development of new
computational methods in GIS environment makes it interesting
for improving the efficiency in evaluating the industrial
establishment process.
ISPRS Annals of the Photogrammetry, Remote Sensing and Spatial Information Sciences, Volume IV-5, 2018 ISPRS TC V Mid-term Symposium “Geospatial Technology – Pixel to People”, 20–23 November 2018, Dehradun, India
This contribution has been peer-reviewed. The double-blind peer-review was conducted on the basis of the full paper. https://doi.org/10.5194/isprs-annals-IV-5-447-2018 | © Authors 2018. CC BY 4.0 License.
453

ACKNOWLEDGEMENTS
First author is grateful to Centre for Space Science and
Technology Education in Asia and the Pacific (CSSTEAP),
Dehradun for supporting me to carry out my research. Authors
would be thankful to Director CSSTEAP, Dr. A.Senthil Kumar
and Programme coordinator CSSTEAP, Dr. S.P.Aggarwal for
their encouragement and support. First author acknowledges
Vice Chairman, Andhra Pradesh Space Applications Centre,
Dr. K.V.Ramana for providing necessary support and data for
the research. Authors acknowledge Department of Economics
and Statistics & Andhra Pradesh State Development Planning
Society, Vijayawada, Govt. of Andhra Pradesh.
REFERENCES
Agricultural statistics at a glance 2016, Ministry of Agriculture,
Govt. of India, 2017
Beinat, E., & Nijkamp, P. (Eds.). (1998). Multicriteria analysis
for land-use management (Vol. 9). Springer Science & Business
Media.
Berube, M. (2014). A GIS multi-criteria evaluation for
identifying priority industrial land in five connecticut cities.
Fataei, E., & Mohammadian, A. (2015). Industrial state site
selection using MCDM method and GIS in Germi, Ardabil,
Iran. Journal of Industrial and Intelligent Information Vol, 3(4)
Jensen, J. R., & Christensen, E. J. (1986). Solid and hazardous
waste disposal site selection using digital geographic
information system techniques. Science of the total
environment, 56, 265-276.
Kao, J. J., & Lin, H. Y. (1996). Multifactor spatial analysis for
landfill siting. Journal of environmental Engineering, 122(10),
902-908.
Keeney, R. L. (1976). Decision with multiple objectives.
Preference and Value Tradeoffs, 231-232.
Kumar, S., & Bansal, V. K. (2016). A GIS-based methodology
for safe site selection of a building in a hilly region. Frontiers of
Architectural Research, 5(1), 39-51.
Malczewski, J. (2000). On the use of weighted linear
combination method in GIS: common and best practice
approaches. Transactions in GIS, 4(1), 5-22.
Malczewski, J. (2004). GIS-based land-use suitability analysis:
a critical overview. Progress in planning, 62(1), 3-65.
Malczewski, J., & Rinner, C. (2005). Exploring multicriteria
decision strategies in GIS with linguistic quantifiers: A case
study of residential quality evaluation. Journal of Geographical
Systems, 7(2), 249-268.
Ohri, A., Singh, P. K., & Singh, P. K. SPATIAL MULTI
CRITERIA ANALYSIS FOR SITING INDUSTRIES.
Promoting industry in rural Andhra Pradesh. Taskforce on non
migratory rural employment generation CII Andhra Pradesh
Rikalovic, A., Cosic, I., & Lazarevic, D. (2014). GIS based
multi-criteria analysis for industrial site selection. Procedia
Engineering, 69, 1054-1063.
Triantaphyllou, E., Shu, B., Sanchez, S. N., & Ray, T. (1998)
Multi-criteria decision making: an operations research
approach. Encyclopedia of electrical and electronics
engineering, 15(1998), 175-186.
ISPRS Annals of the Photogrammetry, Remote Sensing and Spatial Information Sciences, Volume IV-5, 2018 ISPRS TC V Mid-term Symposium “Geospatial Technology – Pixel to People”, 20–23 November 2018, Dehradun, India
This contribution has been peer-reviewed. The double-blind peer-review was conducted on the basis of the full paper. https://doi.org/10.5194/isprs-annals-IV-5-447-2018 | © Authors 2018. CC BY 4.0 License.
454