Embed Size (px)
Citation preview

DEMOCRATIC DEFICITS: CHAPTER 3 5/8/2023 3:32 PM
Chapter 3
Evidence and methods
What benchmarks and indicators are appropriate to monitor and compare the health of
democratic governance? If the majority of Americans express dissatisfaction with the performance of
the federal government, for example, does this signal deep anger and disaffection among the public or
just routine mistrust? If only one in five British citizens express confidence in Westminster politicians, in
the wake of the 2009 MPs expenses scandal, is this a signal that something is seriously wrong with
parliament – or does this just reflecting healthy skepticism towards authority figures? 1 If two-thirds of
Italians persistently lack confidence in the courts and judiciary, this may appear problematic compared
with typical attitudes in Scandinavia, but what is the appropriate yardstick? Are Italians too cynical?
Perhaps Scandinavians are too trusting? 2 We should recognize that legitimate interpretations can and
do differ, on both normative and empirical grounds. Democratic theories offer alternative visions about
these matters, without any yardsticks etched in stone.
To understand these issues, the technical detail and research design used for this book need
clarification, including how the five-fold conceptual schema delineated in the previous chapter is
operationalized and measured, before the evidence can be interpreted. This chapter therefore describes
the primary data sources for analyzing public opinion, including the comparative framework and the
classification of regimes for the societies included in the pooled World Values Survey 1981-2005, used as
the main dataset for global cross-national comparisons, as well as the EuroBarometer, employed for the
annual time-series analysis from 1972-2008. The chapter then describes the indicators monitoring
government performance and the content analysis of the news media, as well as explaining the selection
of multilevel methods for analysis.
Evidence from the World Values Survey
Individual-level evidence about cultural values in many different societies is derived from
analysis of many cross-national social surveys. The broadest cross-national coverage is available from
the pooled World Values Survey/European Values Survey (WVS), a global investigation of socio-cultural
and political change conducted in five waves from 1981 to 2007. This project has carried out
representative national surveys of the basic values and beliefs of the publics in more than 90
independent countries, containing over 88 of the world’s population and covering all six inhabited
continents. It builds on the European Values Survey, first carried out in 22 countries in 1981. A second
wave of surveys was completed in 43 countries 1990-1991. A third wave was carried out in 55 nations in
1

DEMOCRATIC DEFICITS: CHAPTER 3 5/8/2023 3:32 PM
1995-1996, and a fourth wave, in 59 countries, took place in 1999-2001. The fifth wave covering 55
countries was conducted in 2005-2007.3 This dataset is best designed for a global cross-national
comparison although the sub-set of the eleven nations included in all five waves facilitates some
consistent time-series analysis over a twenty-five year period.
[Table 3.1 about here]
As Table 3.1 illustrates, the WVS survey includes some of the most affluent market economies in
the world, such as the U.S., Japan and Switzerland, with per capita annual incomes over $40,000;
together with middle-level countries including Mexico, Slovakia, and Turkey, as well as poorer agrarian
societies, such as Ethiopia, Mali and Burkina Faso, with per capita annual incomes of $200 or less. There
are also significant variations in levels of human development in the countries under comparison, as
monitored by the UNDP Human development Index combining per capita income with levels of
education, literacy and longevity. Some smaller nations also have populations below one million, such as
Malta, Luxembourg and Iceland, while at the other extreme both India and China have populations of
well over one billion people. The survey contains older democracies such as Australia, India and the
Netherlands, newer democracies including El Salvador, Estonia and Taiwan, and autocracies such as
China, Zimbabwe, Pakistan, and Egypt. The transition process also varies markedly: some nations have
experienced rapid process of democratization during the 1990s; today the Czech Republic, Latvia, and
Argentina currently rank as high on political rights and civil liberties as Belgium, the United States, and
the Netherlands, all of which have a long tradition of democratic governance. 4 The survey also includes
some of the first systematic data on public opinion in several Muslim states, including Arab countries
such as Jordan, Iran, Egypt, and Morocco, as well as in Indonesia, Iran, Turkey, Bangladesh and Pakistan.
The most comprehensive coverage comes from Western Europe, North America and Scandinavia, where
public opinion surveys have the longest tradition, but countries are included from all world regions,
including Sub Saharan Africa.
[Figure 3.2 about here]
For longitudinal data, we can compare the eleven countries included in all waves of the World
Values Survey since the early 1980s, as discussed in chapter 6. Other sources provide a regular series of
annual observations, suitable to monitor the responsiveness and sensitivity of public opinion to specific
events, variations in government performance, or major changes in regime. Accordingly to understand
longitudinal trends this book draws upon the EuroBarometer surveys, with national coverage expanding
from the original states to reflect the larger membership of the European Union. This survey has
2

DEMOCRATIC DEFICITS: CHAPTER 3 5/8/2023 3:32 PM
monitored satisfaction with democracy since 1973 and confidence in a range of national institutions
since the mid-1980s. In addition, since 2002 the European Social Survey provides added additional data
on 25 countries in this region. For the United States, the American National Election Survey conducted
almost every election year since 1958 (monitoring trust in incumbent government officials), and the
NORC General Social Survey since 1972 (monitoring institutional confidence), provide further resources
for longitudinal analysis. Other more occasional surveys, such as those for World Public Opinion and
Gallup International, allow the analysis to be expanded further.
The selection of indicators
The evidence for any decline in political support is commonly treated as straightforward and
unproblematic by most popular commentary, based on one or two simple questions reported in public
opinion polls. The conventional interpretation suggests that trust in parties, parliaments, and politicians
has eroded in established democracies and, by assumption, elsewhere as well. On this basis, recent
British studies have tried to explain why ‘we hate politics’ or why Europeans are ‘disenchanted’ with
democracy or ‘alienated’ from politics.5 Scholars in the United States, as well, have sought to understand
‘angry Americans’, or why Americans ‘hate’ politics. 6 Comparative work has also seen public doubts
about politicians, parties and political institutions spreading across almost all advanced industrialized
democracies.7 Yet the orientation of citizens towards the nation state, its agencies and actors is complex,
multidimensional, and more challenging to interpret than these headline stories suggest. Evidence of
public opinion towards government should ideally meet rigorous standards of reliability and validity
which characterize scientific research.8
Reliable empirical measures prove consistent across time and place, using standardized
measures and data sources which can be easily replicated, allowing scholars to build a cumulative body
of research. Indicators such as satisfaction with the performance of democracy, and confidence in public
sector agencies, have been carried in multiple surveys and employed in numerous comparative studies
over recent decades.9 The ANES series on trust in incumbent government officials, where trends can be
analyzed over half a century, has become the standard indicator used in studies of American politics. 10
The accumulation of research from multiple independent studies, where a community of scholars shares
similar indicators, builds a growing body of findings. This process generates the conventional text-book
wisdom in social science – and the authority established by this view within the discipline often makes it
difficult to recognize alternative perspectives.
3

DEMOCRATIC DEFICITS: CHAPTER 3 5/8/2023 3:32 PM
Empirical measures do not just need to prove reliable; they should also be valid, meaning that
they accurately reflect the underlying analytical concepts to which they relate. The empirical analysis of
critical citizens requires careful attention to normative ideas, including complex notions of trust,
legitimacy, and representative democracy, prior to the construction of appropriate operational empirical
indicators. Measurement validity is weakened by minimalist indicators which focus too narrowly upon
only one partial aspect of a broader phenomenon, limiting the inferences which can be drawn from the
evidence. The U.S. literature which relies solely upon the ANES series on trust in incumbent government
officials, for instance, can arrive at misleading conclusions if studies fail also to examine confidence in
the basic constitutional arrangements and deep reservoirs of national pride and patriotism characteristic
of the American political culture. 11 Maximalist or ‘thicker’ concepts and indicators commonly prove
more satisfactory in terms of their measurement validity, by capturing all relevant dimensions and
components of the underlying notion of political legitimacy. But they also have certain dangers; more
comprehensive measures raise complex questions about how best to measure each aspect, and how to
weigh the separate components in constructing any composite scales. In practice, multidimensional
measures also become more complex to analyze; it often proves necessary to compare similar but not
identical items contained in different surveys and time-periods, since few datasets monitor all
components of political support.
When selecting appropriate indicators, unfortunately there is often a trade-off between their
reliability and validity. The five-fold schema originally developed in Critical Citizens attempts to strike a
reasonable balance between these demands. One advantage is that this framework provides a
comprehensive way to map the separate elements involved in citizen’s orientations towards the nation
state, its agencies and actors, meeting the criteria of measurement validity. It has also now become
more standardized, through being widely adopted in the research literature, increasing the reliability of
the body of research and its cumulative findings. Figure 3.1 shows how the five-fold schema has been
operationalized in the research literature, and the variety of typical indicators used in many social
surveys.
[Figure 3.1 about here]
The five-fold conceptualization proposed for this study expands upon the Eastonian notions but
it still provides clear and useful theoretical distinctions among different major components. But does the
public actually make these distinctions in practice? Principle component factor analysis is the most
appropriate technique to test how tightly and consistently attitudes cluster together. 12 A coherent
4

DEMOCRATIC DEFICITS: CHAPTER 3 5/8/2023 3:32 PM
viewpoint would suggest that confidence in parliaments, for instance, would be closely related in the
public’s mind to similar attitudes towards parties, the civil service, and the government. Alternatively, if
the public is largely unaware of the overarching principles which connect these institutions, these
components would be seen as separate by the public. A series of items from the pooled World Values
Survey 1981-2005 were selected to test orientations towards the nation-state, its agencies and actors.
The WVS cannot be used to monitor attitudes towards incumbent officeholders, such as presidents and
party leaders in particular countries, and subsequent chapters analyze other surveys, such as World
Public Opinion, which are suitable for this purpose. Details about the specific questions and coding of all
variables are provided in the book’s Technical Appendix A.
[Table 3.2 about here]
The result of the factor analysis of the WVS pooled data, presented in Table 3.2, confirms that
the theoretical distinctions are indeed reflected in the main dimensions of public opinion. The first set of
items corresponds to generalized support for the nation, including feelings of national pride, the
strength of national identity and willingness to fight for one’s country. The second dimension reflects
approval of democratic regimes, including attitudes towards democracy at the best system for governing
the respondent’s country, and the importance of living in a country that is governed democratically. The
third dimension reflects a rejection of autocratic regimes, including the alternative of rule by the
military, dictatorships, and bureaucratic elites unconstrained by electoral accountability. This distinct
dimension suggests that the public may reject autocracy in some cultures, but this does not necessarily
mean that they whole heartedly embrace democratic regimes. The fourth dimension concerns
evaluations of regime performance by citizens in each country, including judgments about respect for
human rights and satisfaction with the performance of democracy in their own country. Both these
items ask for evaluations about practices in each state, rather than broader aspirations or values. The
fifth cluster of attitudes reflects confidence in regime institutions, including the legislative, executive, and
judicial branches, as well as political parties, the security forces, and the government as a whole. The
results of the factor analysis from the pooled WVS therefore demonstrates that citizens do indeed
distinguish among these aspects of systems support, as theorized, and a comprehensive analysis needs
to take account of each of these components. Most importantly, the analysis confirms the robustness of
the framework originally developed in Critical Citizens, even with a broader range of countries under
comparison and with the inclusion of additional survey questions drawn from the 5 th wave of the WVS.
5

DEMOCRATIC DEFICITS: CHAPTER 3 5/8/2023 3:32 PM
The survey items identified in each dimension were summed and standardized to 100-point continuous
scales, for ease of interpretation, where a higher rating represents a more positive response.
Comparing regimes
To understand global cultural attitudes, public opinion needs to be compared in a wide range of
social and political contexts, including those citizens living under different types of regimes, as well as in
many diverse regions worldwide. When classifying countries, the colloquial use of terms such as
“transitional states,” “consolidating democracies,” and even the classification of “newer” or younger”
democracies, often turns out to be remarkably slippery and complicated in practice. 13 Moreover public
opinion is expected to reflect both the current regime in power, as well the cumulative experience of
living under different types of regimes. People are expected to learn about democracy from their
experience of directly observing and participating in this political system, as well as from broader images
about how democracies work as learnt in formal civic education and conveyed in the mass media. To
develop a consistent typology of regimes, and to monitor historical experience of democratization, this
study draws upon the Gastil index of civil liberties and political rights produced annually by Freedom
House. The index has the advantage of providing comprehensive coverage of all nation-states and
independent territories worldwide, as well as establishing a long historical time-series of observations
conducted annually since 1972. The measure has also been widely employed by many comparative
scholars.14
Freedom House, an independent think tank based in the United States, first began to assess
political trends in the 1950s with the results published as the Balance Sheet of Freedom. In 1972,
Freedom House launched a new, more comprehensive annual study called Freedom in the World.
Raymond Gastil developed the survey’s methodology, which assigned ratings of their political rights and
civil liberties for each independent nation state (as well as for dependent territories) and then
categorized them as Free, Partly Free, or Not Free. Subsequent editions of the survey have followed
essentially the same format. The index monitors the existence of political rights in terms of electoral
processes, political pluralism, and the functioning of government. Civil liberties are defined by the
existence of freedom of speech and association, rule of law, and personal rights. The research team
draws upon multiple sources of information to develop the classifications based on a checklist of
questions, including ten separate items monitoring the existence of political rights and fifteen on civil
liberties.15 Each item is allocated a score from 0 to 4 and each is given equal weight when aggregated.
The raw scores for each country are then converted into a seven-point scale of political rights and a
6

DEMOCRATIC DEFICITS: CHAPTER 3 5/8/2023 3:32 PM
seven-point scale for civil liberties, and in turn these are collapsed by Freedom House to categorize each
regime worldwide as either ‘free’, ‘partly free’, or ‘not free’. The 14-point scales provided annually by
Freedom House are matched to the year of the WVS survey and standardized into a 100-point
democratization scale in this study, to facilitate ease of interpretation.
Historical index of democratization
Yet as well as contemporary patterns, it is clearly important to consider the accumulated years
which citizens have lived under different types of regimes. People can be expected to learn more about
the practice of democracy by living under conditions of freedom and human rights, where they have
opportunities to participate in civic life, as well as through political images and awareness conveyed by
schooling and the mass media. Through extended experience, attitudes towards democracy can be
expected to become more coherent, consistent, and stable, whereas those who have little experience of
living under this type of regime may have less structured attitudes. Popular and scholarly usage often
loosely refers to ‘newer’ or ‘younger’ democracies, but in practice there are several alternative ways to
operationalize these concepts. To measure the historical experience of living under democratic regimes
during the third wave era, several studies have used somewhat different rules. For example, in his classic
study, Lijphart compared three dozen countries which had been continuous uninterrupted democracies
for a twenty year period.16 Nevertheless the adoption of any particular time-period generates some
arbitrary cut-off dates; why twenty years, for example, rather than ten or thirty? Moreover although
these sorts of decisions appear technical, in fact they can have a critical impact upon the results of the
analysis. For example, the rule used by Lijphart automatically excluded countries which experienced
democratic breakdown during these two decades. By limiting the comparison to stable political systems,
Lijphart’s research design was unable to test the institutional conditions leading towards consolidation,
one of the key issues which the study sought to analyze. Historical events can also be used as
alternative benchmarks, but these too involve some arbitrary judgments; for example while the fall of
the Berlin wall is adopted as a commonsense watershed event for comparing pre- and post-Communist
societies, this does not work for the key date of transitions in Mediterranean Europe, Latin America, or
Asia.
As an alternative, this study uses the cumulative Freedom House ratings of political rights and
civil liberties during the third wave era, 1972-2006, to measure the historical experience of democratic
states. If citizens learn about democracy and acquire their political attitudes and values from living
within this form of regime, as socialization theories suggest, then historical patterns should leave a clear
7

DEMOCRATIC DEFICITS: CHAPTER 3 5/8/2023 3:32 PM
imprint upon contemporary public opinion. One advantage of using the cumulative annual score in the
historical index is that this is sensitive to short-term fluctuations over time, including back-tracking by
regimes such as Venezuela, Thailand, and Colombia, fluctuations in Nigeria and Russia, as well as
substantial and sustained advances which have occurred elsewhere, such as in Spain, Uruguay, and
South Korea. The historical democratization index is also standardized for easy of interpretation; hence,
countries with a 100% score have been governed continuously by democratic regimes throughout the
third wave era (since 1972). The classification of regimes uses this measure by subdividing liberal
democracies into older and younger categories, where the standardized 100-point historical
democratization index is divided; scores of 69 or less represent younger democracies, whereas scores
from 70 and above represent older democracies with the most extensive cumulative experience of
democracy.
Classifying contemporary types of regimes
Based on this source, “liberal democracies” are defined in this study as independent nation
states with regimes which the Freedom House survey Freedom Around the World 2006 classifies as
“free” in terms of a wide range of political rights and civil liberties. The concept of liberal democracy has
been most clearly articulated by Robert Dahl, who argued that this type of regime is characterized by
two main attributes—contestation and participation.17 In practice, multiparty competition for elected
office and suffrage for all adult citizens represent the essential conditions, and, to ensure that electoral
competition is meaningful, liberal democracies also respect freedom of expression, the availability of
alternative sources of information (freedom of the media), and associational autonomy (freedom to
organize political parties, interest groups and social movements). Based on their assessments of these
characteristics, Freedom House suggests that today almost half (46%) of all independent nation states
worldwide (89) fall into this category, with institutions meeting the full panoply of civil liberties and
political rights. The expansion in the number of liberal democracies during the third wave era has been
dramatic; in 1978, only 47 states fell into this category (30%). As shown in Table 3.3, a wide range of
liberal democracies are included in the pooled WVS. This includes 28 older democracies which expanded
the franchise to all citizens during the late nineteenth and early twentieth century, with a high historical
democratization index throughout the third wave era, such as Australia, Canada, Norway, the
Netherlands, and New Zealand. The comparison also includes 29 younger liberal democracies which
made the transition since the early-1970s, exemplified by Mali, South Africa, Mexico, and Indonesia, all
with a lower historical democratization index.
8

DEMOCRATIC DEFICITS: CHAPTER 3 5/8/2023 3:32 PM
[Table 3.3 about here]
The broader category of “electoral democracies” used in this research is defined as those
contemporary independent nation-states which Freedom House defines as ‘partly free’. Out of 193
independent nation states worldwide, on third (62) fell into this category in 2006. 18 This middle group
of regimes represents a grey area which proves more difficult to classify; they are neither absolute
autocracies, such as military juntas, personal dictatorships, and monarchies which lack even the fig leaf
of an elected legislature, nor do they meet the full conditions of political rights and civil liberties to
qualify as liberal democracies. Commentators have termed this intermediate category, alternatively,
‘illiberal democracies’, ‘semi-free’, and ‘hybrid regimes’, as well as ‘electoral autocracies’. 19 In this study,
electoral democracies represent contemporary states which have adopted contests for the national
legislature, and where there is a universal franchise for all citizens, but where there remain serious
restrictions on civil liberties and political rights. There are almost two dozen contemporary electoral
democracies contained in the pooled World Values Survey, including Venezuela, Colombia, and Thailand
which have regressed sharply in human rights during the third wave era, as well as others like Albania,
Tanzania, and Georgia which have made considerable progress in democratization during these decades.
In states such as Singapore and Uganda there are major restrictions on party competition; others such
Pakistan, Nigeria, Thailand and Bangladesh have experienced interrupted periods of military rule
temporarily suspending democratic politics.
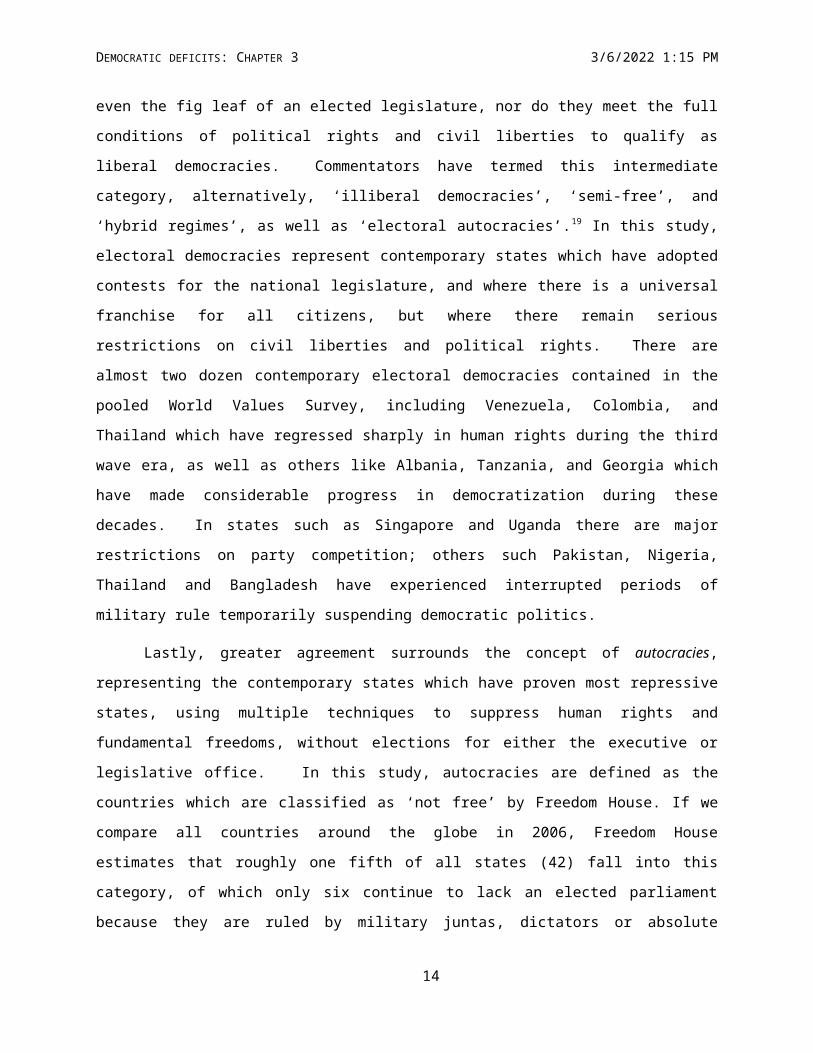
Lastly, greater agreement surrounds the concept of autocracies, representing the contemporary
states which have proven most repressive states, using multiple techniques to suppress human rights
and fundamental freedoms, without elections for either the executive or legislative office. In this study,
autocracies are defined as the countries which are classified as ‘not free’ by Freedom House. If we
compare all countries around the globe in 2006, Freedom House estimates that roughly one fifth of all
states (42) fall into this category, of which only six continue to lack an elected parliament because they
are ruled by military juntas, dictators or absolute monarchs with appointed consultative assemblies.
Other autocracies hold legislative elections, but with conditions so restricted, and with results so flawed
and manipulated, that they fail to meet international standards, especially the need for multiparty
competition, universal adult franchise, regular free and fair contests, and open political campaigning.
The pooled World Values Survey allows comparison of public opinion in diverse contemporary
autocracies, including Zimbabwe, Egypt, Russia, China, and Saudi Arabia.
9

DEMOCRATIC DEFICITS: CHAPTER 3 5/8/2023 3:32 PM
Table 3.3 shows all the states contained in at least one wave of the pooled World Values Survey,
categorized into the contemporary type of regime (in 2006) as older liberal democracies, younger liberal
democracies, electoral democracies, and autocracies. For comparison, the table lists the level of
democracy for each state as measured by the Freedom House Gastil index in the mid-1970s (the
conventional start of the third wave era), the contemporary level of this index (in 2006), and the
historical democratization index during the third wave era. The results highlight the diversity of the
regime types, and pathways of change, which are included in societies under comparison. It is important
to monitor public opinion within this broader context, especially if we hope to analyze how far
orientations towards the political system relate systematically to historical experiences.
Polity IV
Despite the advantages of the Freedom House index in terms of continuity over time and
replicability in the research literature, the measure has been criticized on a number of methodological
grounds.20 To have confidence that the results of the analysis are reliable and robust, therefore, this
research replicates the core models where the Polity IV scale of democracy-autocracy is substituted for
the Freedom House index. The Polity project was initiated by Ted Robert Gurr in the 1970s. The latest
version, Polity IV, provides annual time series data in country-year format covering 161 countries from
1800 to 2006.21 Coders working on the Polity IV project classify democracy and autocracy in each nation-
year as a composite score of different characteristics relating to authority structures. Democracy is
conceived of conceptually as reflecting three essential elements: the presence of institutions and
procedures through which citizens can express preferences about alternative policies and leaders; the
existence of institutionalized constraints on the power of the executive; and the guarantee of civil
liberties to all citizens (although not actually measured). The classification emphasizes the existence or
absence of institutional features of the nation state. The dataset constructs a ten-point democracy scale
by coding the competitiveness of political participation (1-3), the competitiveness of executive
recruitment (1-2), the openness of executive recruitment (1), and the constraints on the chief executive
(1-4). Autocracy is measured by negative versions of the same indices. The two scales are combined into
a single democracy-autocracy score varying from -10 to +10. Polity has also been used to monitor and
identify processes of major regime change and democratic transitions, classified as a positive change in
the democracy-autocracy score of more than 3 points. Replicating models using alternative Freedom
House and Polity IV indices lends greater confidence to the major findings but, given limited space, the
10

DEMOCRATIC DEFICITS: CHAPTER 3 5/8/2023 3:32 PM
full results of the latter are not presented in tables, unless they differ significantly in certain important
regards.
Indicators of Regime Performance
Recent decades have witnessed a burgeoning array of approaches and indicators designed to
evaluate the performance of the state and its core institutions. Indicators are particularly valuable to
analyze whether public opinion reflects the actual performance of the regime. Trends over time, and
also cross-national average benchmarks and rankings, provide readings on the health of democratic
governance in any state. The era since the early-1970s has seen important gains in the level of
conceptual sophistication, methodological transparency, scope, and geographic coverage of these
measures. Literally dozens of indicators, of varying quality and coverage, are now widely available to
gauge the quality of democracy in general, as well as multiple measures of ‘good governance’, human
rights, corruption, women’s empowerment, civic engagement, legislative power, and many other related
issues.22
Many of these measures are constructed from surveys of national and international ‘experts’,
exemplified by Transparency International’s Corruption Perception Index, as well as various assessments
of political risk, such as the team of editors who generate the International Country Risk Guide index.23
Various composite measures have drawn heavily upon a variety of expert survey resources, as
exemplified by the World Bank Institute’s six indicators of good governance, developed by Daniel
Kaufmann, Aart Kraay, and colleagues.24 Other indicators have relied solely upon aggregate national
data, exemplified by the Inter-Parliamentary union’s database on the proportion of women in national
parliaments, used to evaluate gender equality in elected office; International IDEA’s dataset on electoral
turnout worldwide since 1945, to document trends in voter participation; and CIRI’s human rights index,
monitoring national ratification and implementation of major international conventions and treaties.25
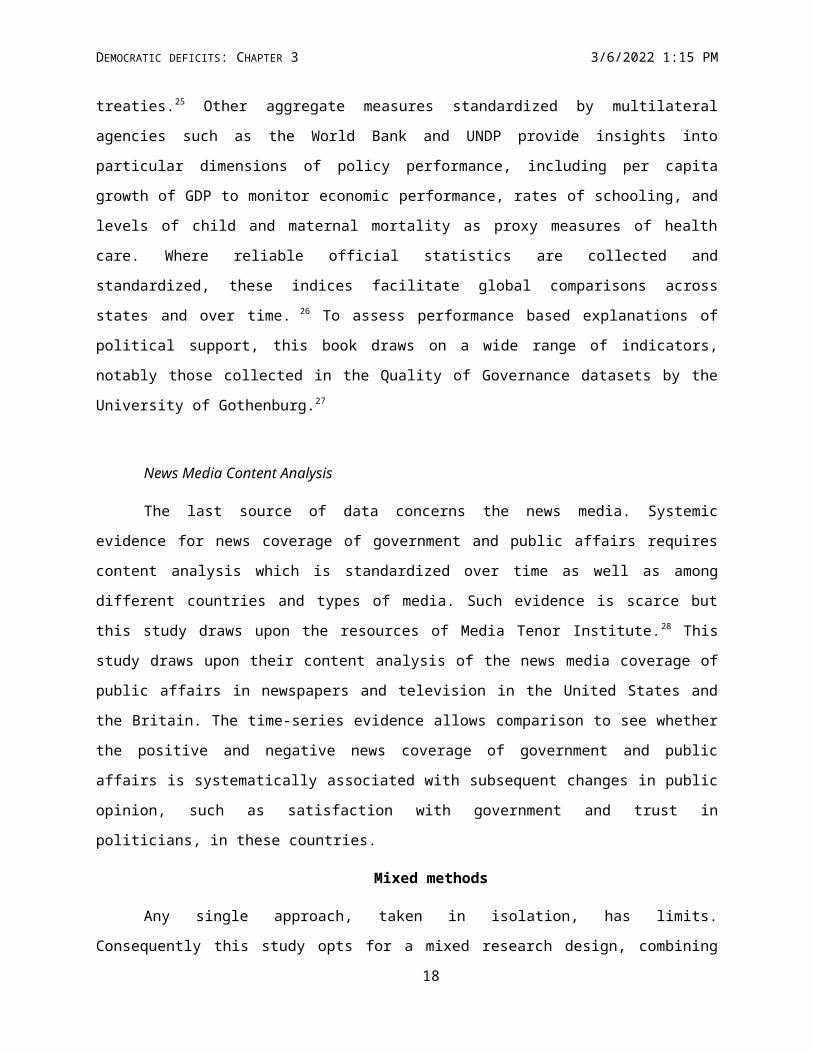
Other aggregate measures standardized by multilateral agencies such as the World Bank and UNDP
provide insights into particular dimensions of policy performance, including per capita growth of GDP to
monitor economic performance, rates of schooling, and levels of child and maternal mortality as proxy
measures of health care. Where reliable official statistics are collected and standardized, these indices
facilitate global comparisons across states and over time. 26 To assess performance based explanations of
political support, this book draws on a wide range of indicators, notably those collected in the Quality of
Governance datasets by the University of Gothenburg.27
11

DEMOCRATIC DEFICITS: CHAPTER 3 5/8/2023 3:32 PM
News Media Content Analysis
The last source of data concerns the news media. Systemic evidence for news coverage of
government and public affairs requires content analysis which is standardized over time as well as
among different countries and types of media. Such evidence is scarce but this study draws upon the
resources of Media Tenor Institute.28 This study draws upon their content analysis of the news media
coverage of public affairs in newspapers and television in the United States and the Britain. The time-
series evidence allows comparison to see whether the positive and negative news coverage of
government and public affairs is systematically associated with subsequent changes in public opinion,
such as satisfaction with government and trust in politicians, in these countries.
Mixed methods
Any single approach, taken in isolation, has limits. Consequently this study opts for a mixed
research design, combining the virtues of pooled survey data in more than 90 nations with rich and
detailed narrative studies of contrasting paired cases.29 A large-N pooled dataset is used to establish the
overall picture. All variables are described in Technical Appendix A, including the key dependent
variables used to construct the democratic deficit scale. The list of countries and surveys included in the
study is described in Technical Appendix B. The use of Hierarchical Linear Models, in particular multilevel
regression analysis, is described in detail in Technical Appendix C.
The key models in the book involve measurement at two distinct levels. A representative sample
of individual respondents (level 1) is nested within national-level contexts (level 2). The World Values
Survey was conducted among a representative random sample of the adult population within each
nation-state. Given the use of multilevel data, hierarchical linear models (HLM) are most appropriate for
analysis, including multilevel regression analysis.30 Those who are interested in the multilevel regression
methods employed should look at Technical Appendix C for a more detailed description. The study
draws upon cross-sectional time-series (CS-TS) panel data, consisting of repeated observations (each
wave of the survey) on a series of random units (the countries included in the WVS). The analysis of
panel datasets through regression faces certain important challenges and the interpretation of the
results is quite sensitive to the choice of specification issues, alternative models, and diagnostic tests. 31
Ordinary least squares regression estimates assume that errors are independent, normally distributed,
and with constant variance. Panel data violates these assumptions and raises potential problems of
heteroscedasticity, autocorrelation, robustness, and missing data. In particular, autocorrelations are
generated because, with time-series data, the same countries are being counted repeatedly and the
12

DEMOCRATIC DEFICITS: CHAPTER 3 5/8/2023 3:32 PM
additional observations do not provide substantially new information. The danger of OLS analysis is that
the beta coefficients will remain unbiased but the disturbance terms from the errors (i.e. omitted
variables) are likely to be correlated. In other words, if OLS regression models are used, the significance
of any coefficients may be inflated, generating Type II errors, suggesting that significant relationships
exist when in fact they do not. Various techniques have been designed to handle panel datasets,
including Ordinary Least Squares linear regression with Panel Corrected Standard Errors (PCSE), and the
use of robust regression.32 In this study, we extend the use of generalized linear models (HLM). Our
multilevel regression models include both subjects (countries) and repeated variables (waves) with
correlated residuals within the random effects.
Lastly, we also use selected narrative paired case studies to illustrate the underlying causal
mechanisms at work, taking account of historical developments and processes of cultural change within
particular nations.33 Cases allow researchers to develop theories, to derive hypothesis, and to explore
causal mechanisms. This approach is particularly useful with outliers which deviate from the generally
observed pattern. The case comparison examine societies that are similar in certain important regards,
such as sharing a cultural tradition and level of socio-economic development, while differing in their
levels of system support. Case studies must always be sensitive to problems of selection bias, and it
remains difficult to determine how far broader generalizations can be drawn from the particular
countries.34 Nevertheless the combination of cross-national large-N comparisons with selected cases is a
strong design that maximizes the potential benefits of each approach. If the two contrasting approaches
point to similar conclusions, it increases confidence in the robustness of the findings.
To go further, the next section of the book examines evidence for trends in system support and
the distribution and size of any democratic deficits. The study seeks to understand aspirations to
democracy, in particular whether support for democratic values and principles is now widespread in
many regions of the world, as earlier studies suggest, as well as considering what people understand
when they express support for democratic governance. We also contrast support for democratic ideals
with evaluations of democratic practices, to explore the tensions between these sets of attitudes.
13
DEMOCRATIC DEFICITS: CHAPTER 3 5/8/2023 3:32 PM
Figure 3.1: Operationalizing indicators of system support
Levels of support Survey measures and operational indicators<<
MO
ST
SP
EC
IFIC
---
----
----
----
----
----
----
----
----
-- M
OS
T D
IFF
US
E >
>
Support for the nation-state Feelings of national pride, such as in national
achievements in the arts, sports, or the economy,
feelings of national identity, and willingness to fight for
country.
Support for regime principles Adherence to democratic values and principles, such as
the importance of democracy, respect for human rights,
separation of religious and state authorities, and
rejection of autocratic principles.
Evaluations of regime
performance
Judgments about the workings of the regime, including
satisfaction with the democratic performance of
governments, and approval of decision-making
processes, public policies, and policy outcomes within
each nation-state.
Confidence in regime institutions Confidence and trust in public sector institutions at
national, regional, and local levels within each nation
state, including the legislature, executive and civil
service, the judiciary and courts, the security forces, and
political parties.
Approval of incumbent office-
holders
Approval of specific incumbents including popular
support of individual presidents and prime ministers,
ministers, opposition party leaders, and elected
representatives.
14

DEMOCRATIC DEFICITS: CHAPTER 3 5/8/2023 3:32 PM
Table 3.1: Countries in the World Values Survey by levels of developmentHigh income societies
($15,000+) GDP per
capita ppp 2006 (World Bank 2007)
Human development
index 2005 (UNDP 2007)
Medium income societies($2,000-14,999)
GDP per capita ppp
2006 (World Bank 2007)
Human development
index 2005 (UNDP 2007)
Low income societies($1,999 and below)
GDP per capita ppp
2006 (World Bank 2007)
Human development
index 2005 (UNDP 2007)
1 Luxembourg $54,779 0.944 Korea, Rep. $13,865 0.921 Macedonia, FYR $1,940 0.8012 Norway $40,947 0.968 Greece $13,339 0.926 Guatemala $1,771 0.6893 Japan $40,000 0.953 Slovenia $12,047 0.917 Bosnia and Herzegovina $1,741 0.8034 Andorra $38,800 . Portugal $11,124 0.897 Egypt, Arab Rep. $1,696 0.7085 United States $38,165 0.951 Trinidad and Tobago $10,268 0.814 Albania $1,604 0.8016 Iceland $35,782 0.968 Saudi Arabia $9,910 0.812 China $1,595 0.7777 Switzerland $35,696 0.955 Malta $9,618 0.878 Azerbaijan $1,576 0.7468 Denmark $32,548 0.949 Argentina $8,695 0.869 Serbia and Montenegro $1,455 .9 Ireland $31,410 0.959 Czech Republic $7,040 0.891 Morocco $1,439 0.64610 Sweden $31,197 0.956 Uruguay $6,987 0.852 Armenia $1,284 0.77511 Taiwan $29,500 . Estonia $6,945 0.860 Philippines $1,175 0.77112 Singapore $27,685 0.922 Mexico $6,387 0.829 Georgia $1,071 0.75413 United Kingdom $27,582 0.946 Hungary $6,126 0.874 Ukraine $1,040 0.78814 Finland $27,081 0.952 Chile $5,846 0.867 Indonesia $983 0.72815 Austria $26,110 0.948 Latvia $5,683 0.855 India $634 0.61916 Canada $25,562 0.961 Poland $5,521 0.870 Pakistan $623 0.55117 Netherlands $25,333 0.953 Croatia $5,461 0.850 Vietnam $576 0.73318 Germany $24,592 0.935 Venezuela $5,427 0.792 Moldova $492 0.70819 Belgium $24,541 0.946 Lithuania $5,247 0.862 Bangladesh $454 0.54720 France $23,899 0.952 Slovak Republic $5,126 0.863 Nigeria $439 0.4721 Australia $23,372 0.962 Malaysia $4,623 0.811 Zimbabwe $409 0.51322 Cyprus $22,699 0.903 Brazil $4,055 0.800 Zambia $365 0.43423 Italy $19,709 0.941 Iraq $3,600 . Tanzania $335 0.46724 Israel $18,367 0.932 Turkey $3,582 0.775 Kyrgyz Republic $326 0.69625 Spain $16,177 0.949 South Africa $3,562 0.674 Ghana $300 0.55326 New Zealand $15,458 0.943 Dominican Republic $2,694 0.779 Uganda $274 0.50527 Russian Federation $2,621 0.802 Rwanda $268 0.45228 Thailand $2,549 0.781 Burkina Faso $267 0.3729 Peru $2,489 0.773 Mali $250 0.3830 Romania $2,443 0.813 Ethiopia $155 0.40631 Colombia $2,317 0.79132 Bulgaria $2,256 0.82433 Jordan $2,193 0.77334 El Salvador $2,173 0.73535 Algeria $2,153 0.73336 Belarus $2,070 0.80437 Iran, Islamic Rep. $2,029 0.759Note: The 93 countries in the World Values Survey, 1981-2007 are classified and ranked by GDP Per Capita in PPP, 2006. Source: World Bank Development Indicators, 2007.
15

DEMOCRATIC DEFICITS: CHAPTER 3 5/8/2023 3:32 PM
Table 3.2: Components of systems support
Var Period of measurement
Survey items (i)Nationalis
m
(ii)Approval of democratic
values
(ii) Rejection of
autocratic values
(iii) Evaluations
of regime performanc
e
(iv) Confidence
in regime institutions
V209 1981-2005 Strength of feelings of national pride .739V212 2005 Strength of identification with nation .694V75 1981-2005 Willing to fight for country in a war .593
V151 1995-2005 Approve of having a democratic system as ‘very/fairly good’ .804V162 2005 Importance of living in a country governed democratically .734
V149 1995-2005 Anti-bureaucratic elite rule (experts take decisions) .803V148 1995-2005 Anti-dictatorship (strong leader rules without elections) .765V150 1995-2005 Anti-military rule .619
V163 2005 Evaluation of performance of democracy in own country .803V164 1995-2005 Evaluations of respect for human rights in own country .787
V140 1981-2005 Confidence in parliament .809V139 1990-2005 Confidence in parties .749V138 1990-2005 Confidence in government (in nation’s capital) .787V137 1981-2005 Confidence in courts .760V141 1981-2005 Confidence in civil service .744V136 1981-2005 Confidence in police .723V132 1981-2005 Confidence in armed forces .577
Percentage of variance explained 9% 9% 10% 9% 24%Note: The coefficients represent the loadings of Principal Component Factor Analysis with varimax rotation and Kaiser normalization. Coefficients under .45 were excluded. The factor analysis was run with individual-level data.
Source: World Values Survey pooled 1981-2005
16

DEMOCRATIC DEFICITS: CHAPTER 3 5/8/2023 3:32 PM
17
DEMOCRATIC DEFICITS: CHAPTER 3 5/8/2023 3:32 PM
Table 3.3: Regimes in the World Values SurveyOlder liberal democracies Younger liberal democracies Electoral democracies Autocracies
1975 2006 Historical Index
1975 2006 Historical index
1975 2006 Historical index
1975 2006 Historical index
1 Australia 100 100 86 Andorra 57 100 75 Venezuela 86 57 66 Pakistan 43 36 302 Austria 100 100 86 Dominican Rep 71 86 66 Colombia 79 71 57 Zimbabwe 36 21 253 Canada 100 100 86 India 64 79 61 Philippines 43 71 49 Egypt 43 36 254 Denmark 100 100 86 Uruguay 43 100 59 Thailand 79 36 49 Russia 21 36 235 Iceland 100 100 86 Argentina 71 88 57 Turkey 79 71 48 Kyrgyzstan 21 50 216 Netherlands 100 100 86 Antigua Barbuda 71 86 57 Bangladesh 29 57 43 Algeria 21 36 177 New Zealand 100 100 86 El Salvador 79 79 55 Guatemala 64 64 43 Ethiopia 21 43 178 Norway 100 100 86 Brazil 50 86 54 Malaysia 64 57 42 Iran 29 29 169 Switzerland 100 100 86 Mexico 64 79 51 Zambia 43 64 35 Azerbaijan 21 36 1610 United States 100 100 86 Korea, Rep 43 93 51 Morocco 43 50 34 Belarus 21 21 1511 Sweden 93 100 86 Hungary 29 100 50 Singapore 43 50 33 Rwanda 29 36 1312 Luxembourg 93 100 85 Poland 29 100 50 Burkina Faso 43 57 32 China 14 21 713 Germany 100 96 85 Chile 29 100 49 Nigeria 36 57 30 S.Arabia 29 21 714 Belgium 100 100 84 Czech Republic 21 100 49 Jordan 29 50 28 Viet Nam 14 29 315 Ireland 93 100 84 Slovak Republic 21 100 49 Bosnia-Herz 21 71 28 Iraq 14 29 316 UK 100 100 83 Taiwan 36 93 47 Macedonia 21 71 2817 Italy 93 100 80 South Africa 50 86 47 Moldova 21 64 2718 Japan 93 93 80 Peru 43 79 47 Georgia 21 71 2519 France 93 100 80 Slovenia 21 100 42 Tanzania 29 64 2520 Finland 86 100 79 Lithuania 21 100 41 Armenia 21 50 2421 Malta 100 100 78 Estonia 21 100 41 Uganda 14 50 2422 Cyprus 57 100 75 Latvia 21 100 40 Albania 14 71 2323 Portugal 57 100 75 Ghana 29 93 3724 Trinidad Tobago 86 86 74 Bulgaria 14 93 3525 Spain 43 100 71 Mali 14 79 3326 Israel 79 93 71 Romania 21 86 3227 Greece 86 93 71 Indonesia 43 79 3028 Croatia 29 86 2929 Ukraine 21 79 2930 Serbia 29 79 28
Total 89 99 81 40 91 48 39 60 35 30 30 19Notes: Nations in the WVS pooled survey are classified by the type of regime in 2006 (the year closest to fieldwork the 5 th wave of the WVS) and liberal democracies are further sub-divided by their historical experience of democracy. The 1975 and 2006 democracy scales are the annual Gastil 14-point index of civil liberties and political rights, estimated by Freedom House, standardized to 100 points. The historical democratization index represents the sum of the annual Gastil index of civil liberties and political rights, by Freedom House, from 1972 to 2006, standardized to 100 points.
18

DEMOCRATIC DEFICITS: CHAPTER 3 5/8/2023 3:32 PM
19

1 See the Ipsos/MORI 29-31st May 2009 commissioned by the BBC.
http://www.ipsos-mori.com/content/home-features/three-in-four-believe-britains-governance-needs-
im.ashx
2 Jan Delhey and Kenneth Newton. 2005. ‘Predicting cross-national levels of social trust: Global pattern or
Nordic exceptionalism?’ European Sociological Review. 21(4): 311-327. For a comparison of confidence in
parliaments in EU member states, see Ola Listhaug and Matti Wiberg. 1995. ‘Confidence in political and
private institutions.’ In Citizens and the State, eds. Hans-Dieter Klingemann and Dieter Fuchs. Oxford:
Oxford University Press; Pedro G. Magalhaes. 2006. ‘Confidence in parliaments: performance,
representation and accountability.’ In Mariano Torcal and José R. Montero. (Eds). 2006. Political
Disaffection in Contemporary Democracies: Social Capital, Institutions, and Politics. London: Routledge.
3 Full methodological details about the World Values Surveys, including the questionnaires, sampling
procedures, fieldwork procedures, principle investigators, and organization can be found at:
http://wvs.isr.umich.edu/wvs-samp.html.
4 These countries are ranked as equally ‘free’ according to the 2008 Freedom House assessments of political
rights and civil liberties Freedom House. 2008. Freedom in the World. www.freedomhouse.org.
5 Colin Hay. 2007. Why We Hate Politics. Cambridge: Polity Press; Gerry Stoker. 2006. Why Politics Matters:
Making Democracy Work. London: Palgrave/Macmillan.
6 Susan J. Tolchin. 1996. The Angry American: How Voter Rage Is Changing the Nation. Boulder, CO:
Westview Press; E.J. Dionne, Jr., 1991. Why Americans Hate Politics. New York: Simon and Schuster.
7 Russell J. Dalton, 2004. Democratic Challenges, Democratic Choices: The Erosion of Political Support in
Advanced Industrial Democracies. New York: Oxford University Press.p3.
8 Geraldo L. Munck and Jay Verkuilen. 2002. ‘Conceptualizing and measuring democracy: Evaluating
alternative indices.’ Comparative Political Studies. 35 (1): 5-34
9 Jonas Linde and Joakim Ekman. 2003. ‘Satisfaction with democracy: A note on a frequently used indicator
in comparative politics.’ European Journal of Political Research 42(3): 391 – 408.
10 See, for example, Marc J. Hetherington and Thomas J. Rudolph. 2008. ‘Priming, performance, and the
dynamics of political trust.’ Journal of Politics. 70(2): 498-512.
11 Jack Citrin and Samantha Luks. 2001. ‘Political trust revisited: Déjà vu all over again?’ In John R. Hibbing
and Elizabeth Theiss-Morse. (eds). What Is It About Government That Americans Dislike? Cambridge:
Cambridge University Press.
12 Hans-Dieter Klingemann. 1999. ‘Mapping political support in the 1990s.’ In Pippa Norris (ed). 1999.
Critical Citizens: Global Support for Democratic Governance. Oxford: Oxford University Press Table 2.1;
Russell J. Dalton, 2004. Democratic Challenges, Democratic Choices: The Erosion of Political Support in

Advanced Industrial Democracies. New York: Oxford University Press. Table 3.1.
13 Ariel C. Armony and Hector E. Schamis. 2005. ‘Babel in democratization studies.’ Journal of Democracy
16 (4): 113-128.
14 Larry Diamond. 1996. Developing Democracy: Toward Consolidation. Baltimore: Johns Hopkins University
Press; Robert J. Barro. 1999. ‘Determinants of democracy.’ Journal of Political Economy 107 (6): 158–183;
Ronald Inglehart and Christopher Welzel. 2005. Modernization, Cultural Change, and Democracy: The
Human Development Sequence. New York: Cambridge University Press.
15 David Collier and Robert Adcock. 1999. ‘Democracy and dichotomies: A pragmatic approach to choices
about concepts.’ Annual Review of Political Science 1: 537-565.
16 Arend Lijphart. 1999. Patterns of Democracy: Government Forms and Performance in Thirty-six Countries.
New Haven: Yale University Press.
17 Robert A. Dahl. 1956. A Preface to Democratic Theory. Chicago: Univ. Chicago Press; Robert A. Dahl. 1971.
Polyarchy. New Haven, CT: Yale Univ. Press.
18 Freedom House. 2007. Freedom in the World 2006. Washington, DC: Freedom House.
www.freedomhouse.org.
19 Fareed Zakaria. 1997. ‘The Rise of Illiberal Democracy.’ Foreign Affairs 76(6): 22-41; Larry Diamond. 2002.
‘Thinking about Hybrid Regimes.’ Journal of Democracy 13(2): 21-35; Steven Levitsky and Lucan A. Way.
2002. ‘The Rise of Competitive Authoritarianism.’ Journal of Democracy 13(2): 51-65; Lucan A.Way and
Steven Levitsky. 2006. ‘The dynamics of autocratic coercion after the Cold War.’ Communist And Post-
Communist Studies 39(3): 387-410.
20 See Geraldo L. Munck and Jay Verkuilen. 2002. ‘Conceptualizing and measuring democracy: Evaluating
alternative indices.’ Comparative Political Studies. 35 (1): 5-34; Pippa Norris. 2008. Driving Democracy. New
York: Cambridge University Press. Chapter 3.
21 Monty Marshall and Keith Jaggers. 2003. Polity IV Project: Political Regime Characteristics and Transitions,
1800-2003. http://www.cidcm.umd.edu/inscr/polity/; Monty Marshall, Ted Robert Gurr, Christian
Davenport and Keith Jaggers. 2002. ‘Polity IV, 1800-1999: Comments on Munck and Verkuilen.’
Comparative Political Studies 35(1): 40-45.
22 UNDP. 2007. Governance Indicators: A Users' Guide (2nd Edition) Oslo: UNDP.
http://www.undp.org/oslocentre/flagship/governance_indicators_project.html; see also the University of
Goteborg’s Quality of Governance dataset http://www.qog.pol.gu.se/
23 http://www.prsgroup.com/

24 Daniel Kaufmann, Aart Kraay, and M. Mastruzzi. May 2003. ‘Governance Matters III:
Governance Indicators 1996-2002.’; Daniel Kaufmann, Aart Kraay, and Massimo Mastruzzi. 2007.
Governance Matters VI: Aggregate and Individual Governance Indicators, 1996-2006. Washington DC: The
World Bank, Policy Research Working Paper; Daniel Kaufmann, Aart Kraay, Massimo Mastruzzi. 2007.
‘Growth and governance: A rejoinder. Journal of Politics 69 (2): 570-572. For a critical discussion, see
Merilee S. Grindle, 2004. ‘Good Enough Governance: Poverty Reduction and Reform in Developing
Countries.’ Governance 17 (4): 525–548; Ved P. Nanda. 2006. ‘The good governance concept revisited.’
Annals American Association of the Political and Social Sciences 603: 263-283; Merilee S. Grindle. 2007.
‘Good enough governance revisited.’ Development Policy Review 25 (5): 553-574.
25 CIRI. Human Rights Data Project. http://ciri.binghamton.edu/
26 For a collection of these resources, see Pippa Norris. 2008. Democracy Cross-national Data and
Democracy Time-Series Data both available at www.pippanorris.com.
27 See the Quality of Governance dataset available at the University of Goteborg:
http://www.qog.pol.gu.se/
28 Media Tenor uses professionally trained analysts, not software solutions, for the entire process of media
content analysis. Analysts identify and categorize each report, sentence by sentence and issue by issue,
according to a set of more than 700 defined criteria. Each report’s content is then appropriately coded and
entered into a globally linked database. Analyst remuneration is based on the results of inter-coder
reliability, validity and sample check tests. For more details about the methodology and data, see
http://www.mediatenor.com/
29 For a discussion of the advantages of mixed research designs, see Henry Brady and David Collier. 2004.
Rethinking social inquiry: Diverse tools, shared standards. New York: Rowman & Littlefield Publishers.
30 Robert Bickel.2007. Multilevel Analysis for Applied Research: Its Just Regression! New York: The Guilford
Press.
31 James A. Stimson. 1985. ‘Regression in time and space: A statistical essay.’ American Journal of Political
Science 29:914–47; Cheng M. Hsiao. 1986. Analysis of panel data. Cambridge: Cambridge University Press;
Sven E. Wilson and David M. Butler. 2007. ‘A lot more to do: The sensitivity of time-series cross-section
analyses to simple alternative specifications.’ Political Analysis 15 (2): 101-123.
32 Nathaniel Beck and Jonathan Katz. 1995. ‘What to do (and not to do) with Time-Series Cross-Section
Data.’ American Political Science Review. 89: 634-647; Nathaniel Beck and Jonathan Katz. 1996. ‘Nuisance
vs. substance: Specifying and estimating time-series cross-sectional models.’ In Political Analysis Ed. J.
Freeman. Ann Arbor: University of Michigan Press.

33 See Alexander L. George and Andrew Bennett. 2004. Case Studies and Theory Development. Cambridge,
MA: The MIT Press.
34 For a discussion of the potential problem of selection bias in comparative politics, see Barbara Geddes.
2003. Paradigms and Sand Castles: Theory building and research design in comparative politics. Chapter 3.
Ann Arbor, MI: The University of Michigan Press; David Collier, James Mahoney and Jason Seawright. 2004.
‘Claiming too much: Warnings about selection bias.’ In Rethinking Social Inquiry: Diverse Tools, Shared
Standards. Ed. Henry E. Brady and David Collier. Lanham, MD: Rowman and Littlefield.