Embed Size (px)
Citation preview
WATER RESOURCES BULLETIN VOL. 14, NO. 2 AMERICAN WATER RESOURCES ASSOCIATION APRIL 1978
SITING OF A WATER POLLUTION CONTROL FACILITY AT JAMESTOWN. RHODE ISLAND'
David 0. Cook, James W. Demenkow, Pnya J. Wickramaratne, and John T. Hannigan'
ABSTRACT: The town of Jamestown, Rhode Island, located on Conanicut Island in Narragan- sett Bay, is constructing a secondary treatment plant in order to comply with NPDES regula- tions. Twelve candidate sites for the plant and marine outfall were initially proposed, and ability to meet State water quality standards at these sites was evaluated using an EPA buoyant plume model. A final outfall site, Taylor Point, was selected by the Town from among the sites considered acceptable. Taylor Point was then subjected to field hydrographic studies in- cluding drogue tracking, current recording, and tracer dye surveys. Results of the measurement program served as input to a twodimensional effluent dispersion model which predicted excess BOD, coliform, and suspended solids resulting from effluent discharge off Taylor Point. The model predictions demonstrated that State water quality standards can be maintained outside the initial discharge plume. (KEY TERMS: outfall siting; water quality modeling; hydrographic measurements.)
INTRODUCTION
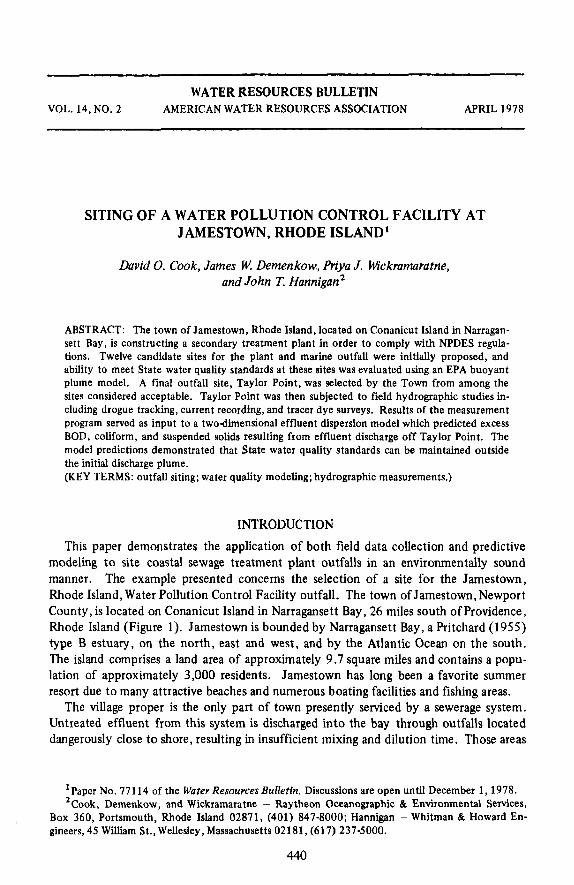
This paper demonstrates the application of both field data collection and predictive modeling to site coastal sewage treatment plant outfalls in an environmentally sound manner. The example presented concerns the selection of a site for the Jamestown, Mode Island, Water Pollution Control Facility outfall. The town of Jamestown, Newport County, is located on Conanicut Island in Narragansett Bay, 26 miles south of Providence, Rhode Island (Figure 1). Jamestown is bounded by Narragansett Bay, a F'ritchard (1955) type B estuary, on the north, east and west, and by the Atlantic Ocean on the south. The island comprises a land area of approximately 9.7 square miles and contains a popu- lation of approximately 3,000 residents. Jamestown has long been a favorite summer resort due to many attractive beaches and numerous boating facilities and fishing areas.
The village proper is the only part of town presently serviced by a sewerage system. Untreated effluent from this system is discharged into the bay through outfalls located dangerously close to shore, resulting in insufficient mixing and dilution time. Those areas
'Paper No. 771 14 of the Wafer Resources Bulktin. Discussions are open until December 1,1978. *Cook, Demenkow , and Wickramaratne - Raytheon Oceanographic & Enviionmental Services,
Box 360, Portsmouth, Rhode Island 02871, (401) 847-8000; Hannigan - Whitman & Howard En- gineers, 45 William St., Wellesley, Massachusetts 02181, (617) 237-5000.
440
Cook, Demenkow, Wickramaratne and Hannigan
adjacent to these discharges have been classified as unsuitable for shellfish harvesting and bathing (Class SC) by the State of Rhode Island. The town is presently under a pollution abatement implementation schedule, issued by the Environmental Protection Agency, which stipulates that the town must complete the construction of a secondary wastewater treatment facility by June 1978 t o eliminate its present raw waste discharge. According- ly, a facilities plan was developed for Jamestown which addresses collection, treatment, and disposition of the final effluent. Basically, three possibilities existed for the dis- charge of treatment plant effluent: ocean outfall, discharge to land, and reuse. Each alternative was evaluated, and ultimately, a secondary treatment plant with an ocean outfall was shown to be the most costeffective pollution control facility.
NARRAGANSETT
0 =ALTERNATIVE STP LOCATIONS
0 1 2 MILES 1
Figure 1 . Location Map.
441
Siting of a Water Pollution Control Facility at Jamestown, Rhode Island
Although engineering and economic factors played a major role in the selection of a treatment plant and outfall location, our paper is focused on water quality considerations. It was essential that the final site have hydrographic characteristics which would allow ad- herence to State water quality standards outside the immediate outfall area. Accordingly, the 12 candidate sites were compared by analytical modeling of effluent dilution, leading to the rejection of 6 sites because of insufficient mixing. After a preferred site was chosen by the town, a detailed hydrographic field study was conducted there and a model of effluent dispersion was applied to finalize outfall depth and location.
PRELIMINARY SCREENING OF OUTFALL SITES
The original 12 potential treatment plant locations are shown in Figure 1 , and it was assumed that associated outfalls would be directly offshore. Thus, six discharge sites were in West Passage, five were in East Passage, and one was in Rhode Island Sound. Of primary concern was whether Rhode Island class SA water (suitable for all uses) could be maintained in the vicinity of the potential outfall sites.
The maintenance of water quality standards is dependent upon sufficient dilution of the effluent by jet mixing in the vicinity of the outfall (near field) and by effluent dispersion by the local current system (far field). The use of multiport diffusers pro- duces large dilutions which ensures that water quality standards are attained in the near- field, and far-field effects than become important only in governing the buildup and ulti- mate dispersal of the waste water field. In this study, an investigation of the near-field effects was made using the Baumgartner, Trent, and Byram (1971) buoyant plume model to predict dilutions at the potential outfall sites. The near-field plume model is designed to solve the geometric and dynamic behavior of a buoyant round plume discharging into stagnant (worst case), stratified receiving waters. The model computes the centerline dilution, trajectory and maximum height of rise as a function of depth, port characteris- tics, effluent parameters, and stratification of the receiving waters. Because the waters of Narragansett Bay are not stagnant but subject to moderate tidal currents, the plume model is a conservative estimating tool for the Jamestown application (Jerka and Harle- man, 1973).
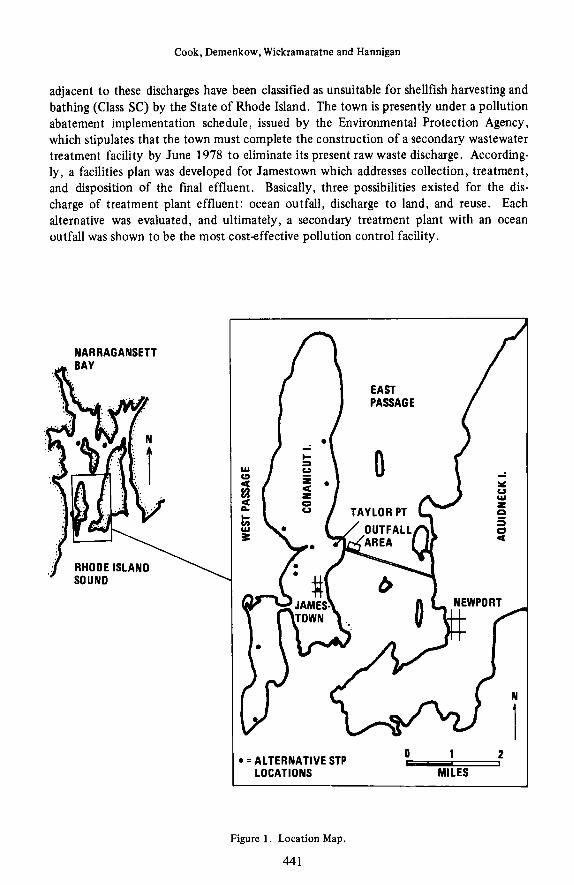
The buoyant plume model was run for depths of 30, 40, and 50 feet (9.1, 12.2, and 15.2 m), an effluent flow of 0.75 mgd (.033 cu mlsec), and an effluent density of 1 .OOO g/cm3. Seasonal density profiles used in the model were obtained from Hicks (1963) and the University of Rhode Island Baywatch program (Le Blanc, personal communication). Profiles were chosen to represent conditions in the East Passage, West Passage and in Rhode Island Sound (Figure 2a). Dilution factors predicted by the model for specified depths and seasons in the three water bodies were plotted as a function of the number of diffuser ports. Figures 2b and 2c show dilution curves for the 30 and 40 ft. (9.1 and 12.2 m) depths during summer and winter.
Several general features are discernible from the dilution curves. 1 . Dilution factors are sensitive t o the density stratification of the water column.
When receiving waters are stratified, dilution factors are somewhat less than for non- stratified waters and trapping levels may occur below the surface.
2. The placement of the outfall in deeper waters generally increases the dilution. This increased dilution results from the increased distance the jet must travel before it en- counters the surface or a trapping level.
442
RH
OO
E IS
LAllO
Em
PA
SSAG
E
NE
SI P
ASSA
GE
JULY
1111
in
- ia
- - *
-
= u
-
- I-
nnoo
t IS
LAN
O
NE
SlP
A%
AO
E
g 1.w
4 D
JULY
1I72
FEIR
UA
RY
1157
1.- 1
1
I1
,
. .
. ,
, I
14’ .
RH
OO
E IS
LAN
D S
OU
ND
FEB
RU
AR
Y 1%7
In .
I*
~
L
P-
I- : u
-
u-
1-
RH
OO
E IS
LAN
D S
OU
ND
FEB
RU
AR
Y 1%7 /
ll
5 7
¶ 1
11
31
5
WU
YE
R O
F W
ORTS
b
I
11
IU
11
1*
!*
“1 0)
1
3 5
1 1
11
11
15
m
umtn
OF w
nn
C
P)
a
Figu
re 2
. Pl
ume
Mod
elin
g D
ata:
a)
Sum
mer
and
Win
ter
Den
sity
Pro
files
for
Eas
t Pas
sage
, Wes
t Pas
sage
, and
Rho
de Is
land
Sou
nd;
b) D
ilutio
n C
urve
s for
a 3
0 ft
. (9.
1 m
) D
eep
Out
fall;
c) D
ilutio
n C
urve
s fo
r a 4
0 ft
. (12
.2 m
) D
eep
Out
fall.
The
das
hed
line
in b
and
c
repr
esen
ts t
he m
inim
um d
ilutio
n re
quir
ed f
or m
eetin
g St
ate
SA w
ater
qua
lity
crite
ria.
Siting of a Water Pollution Control Facility at Jamestown, Rhode Island
3 . Larger densities produce larger dilutions. This results because larger densities produce larger buoyancy forces on the effluent which increases both the jet velocity and the resulting entrainment of ambient waters.
4. Dilutions are larger for outfalls closer to Rhode Island Sound than for outfalls located in either the East or West Passage. T h s is because the water at the mouth of the bay is usually better mixed and more saline (denser) than the water within the bay.
5. Dilutions are generally similar or greater in the East Passage than the West Passage. The salinity in the East Passage is usually greater than the West Passage, resulting in greater dilutions in the East Passage.
Based on State water quality standards, the secondary treatment effluent requiring the greatest dilution is BOD. A dilution of 30 should be attained in the near-field to maintain the 6.0 mg/1 dissolved oxygen level required for class SA water, and this dilu- tion factor was used to rate the 12 potential outfall sites. The six West Passage sites were categorized as unacceptable or marginal because a dilution of 30 could not be attained during periods of strong stratification. The critical dilution could always be reached in East Passage, provided the outfall was placed in a minimum depth of 40 ft. (1 2.2 m), and in Rhode Island Sound, so these six sites were considered acceptable.
After collating engineering and economic factors with the water quality considerations, four of the sites which were deemed acceptable locations for both the pollution control facility and outfall were presented to the town. The site selected by town residents in a public ballot was Taylor Point, located on East Passage just north of the Jamestown Bridge (Figure 1).
FIELD STUDIES AT TAYLOR POINT
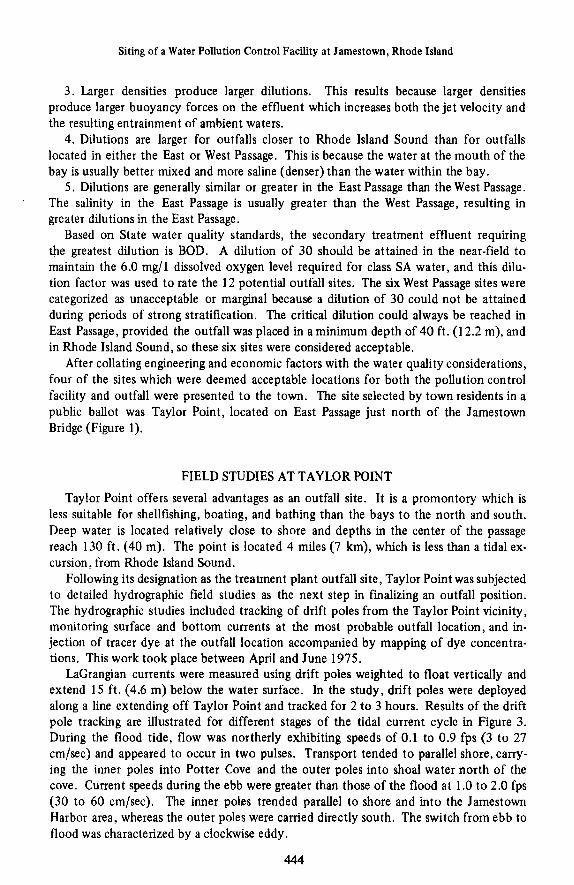
Taylor Point offers several advantages as an outfall site. It is a promontory which is less suitable for shellfishing, boating, and bathing than the bays to the north and south. Deep water is located relatively close to shore and depths in the center of the passage reach 130 ft. (40 m). The point is located 4 miles (7 km), which is less than a tidal ex- cursion, from Rhode Island Sound.
Following its designation as the treatment plant outfall site, Taylor Point was subjected to detailed hydrographic field studies as the next step in finalizing an outfall position. The hydrographic studies included tracking of drift poles from the Taylor Point vicinity, monitoring surface and bottom currents at the most probable outfall location, and in- jection of tracer dye at the outfall location accompanied by mapping of dye concentra- tions. This work took place between April and June 1975.
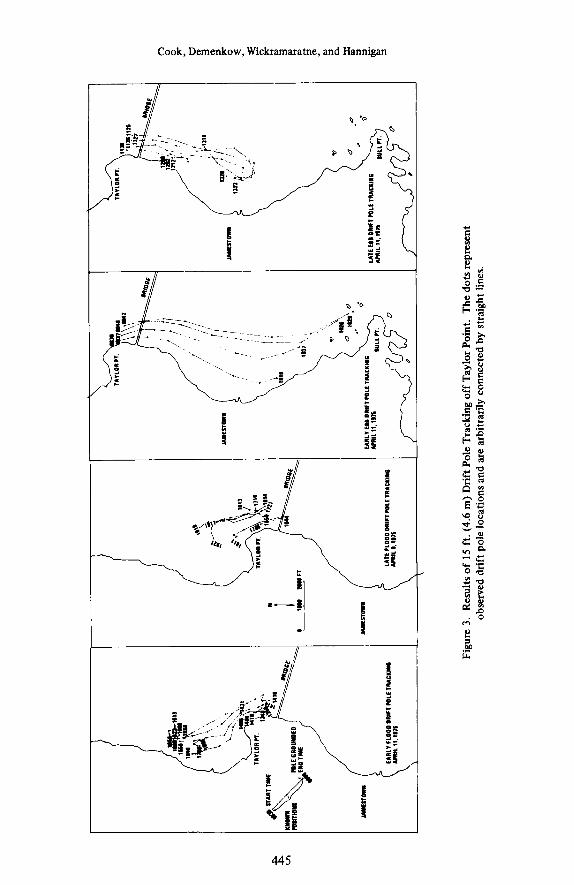
LaCrangian currents were measured using drift poles weighted to float vertically and extend 15 ft. (4.6 m) below the water surface. In the study, drift poles were deployed along a line extending off Taylor Point and tracked for 2 to 3 hours. Results of the drift pole tracking are illustrated for different stages of the tidal current cycle in Figure 3. During the flood tide, flow was northerly exhibiting speeds of 0.1 to 0.9 fps (3 to 27 cm/sec) and appeared to occur in two pulses. Transport tended to parallel shore, carry- ing the inner poles into Potter Cove and the outer poles into shoal water north of the cove. Current speeds during the ebb were greater than those of the flood at 1.0 to 2.0 fps (30 to 60 cmlsec). The inner poles trended parallel to shore and into the Jamestown Harbor area, whereas the outer poles were carried directly south. The switch from ebb to flood was characterized by a clockwise eddy.
444
/ U
TE
FLO
OD
DR
IFT m
LE T
RA
CK
IIE
MI
L 8.11
11
Figu
re 3
. R
esul
ts o
f 15
ft.
(4.6
m) D
rift
Pol
e T
rack
ing
off T
aylo
r Po
int.
The
dot
s rep
rese
nt
obse
rved
dri
ft p
ole
loca
tions
and
are
arb
itrar
ily c
onne
cted
by
stra
ight
line
s.
Siting of a Water Pollution Control Facility at Jamestown, Rhode Island
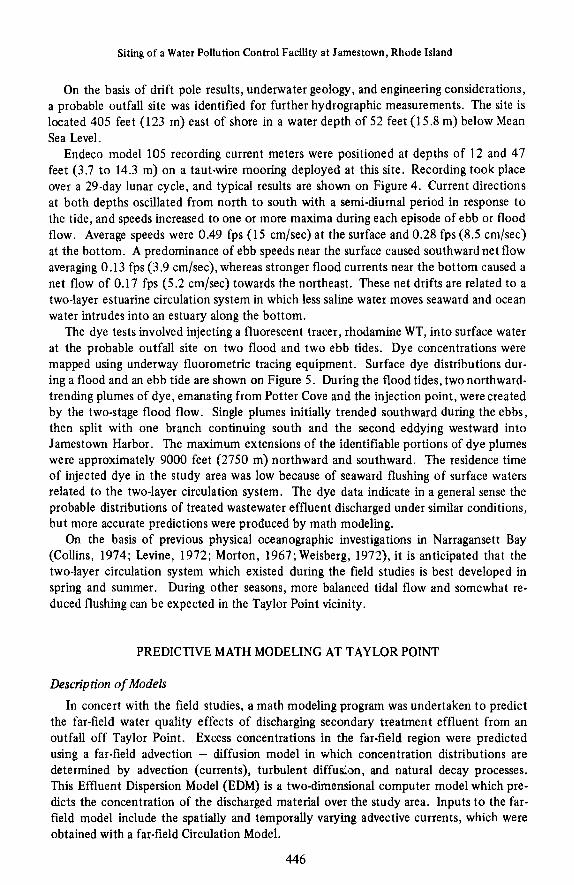
On the basis of drift pole results, underwater geology, and engineering considerations, a probable outfall site was identified for further hydrographic measurements. The site is located 405 feet (123 m) east of shore in a water depth of 52 feet (1 5.8 m) below Mean Sea Level.
Endeco model 105 recording current meters were positioned at depths of 12 and 47 feet (3.7 to 14.3 m) on a taut-wire mooring deployed at this site. Recording took place over a 29-day lunar cycle, and typical results are shown on Figure 4. Current directions at both depths oscillated from north to south with a semi-diurnal period in response t o the tide, and speeds increased to one or more maxima during each episode of ebb or flood flow. Average speeds were 0.49 fps (1 5 cmlsec) at the surface and 0.28 fps (8.5 cmlsec) at the bottom. A predominance of ebb speeds near the surface caused southward net flow averaging 0.13 fps (3.9 cmlsec), whereas stronger flood currents near the bottom caused a net flow of 0.17 fps (5.2 cmlsec) towards the northeast. These net drifts are related to a two-layer estuarine circulation system in which less saline water moves seaward and ocean water intrudes into an estuary along the bottom.
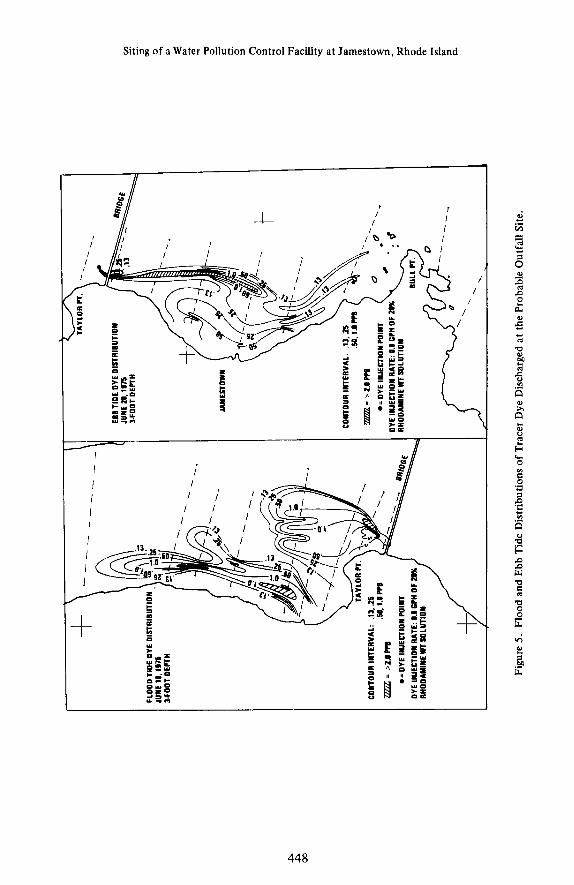
The dye tests involved injecting a fluorescent tracer, rhodamine WT, into surface water at the probable outfall site on two flood and two ebb tides. Dye concentrations were mapped using underway fluorometric tracing equipment. Surface dye distributions dur- ing a flood and an ebb tide are shown on Figure 5. During the flood tides, two northward- trending plumes of dye, emanating from Potter Cove and the injection point, were created by the two-stage flood flow. Single plumes initially trended southward during the ebbs, then split with one branch continuing south and the second eddying westward into Jamestown Harbor. The maximum extensions of the identifiable portions of dye plumes were approximately 9000 feet (2750 m) northward and southward. The residence time of injected dye in the study area was low because of seaward flushing of surface waters related to the two-layer circulation system. The dye data indicate in a general sense the probable distributions of treated wastewater effluent discharged under similar conditions, but more accurate predictions were produced by math modeling.
On the basis of previous physical oceanographic investigations in Narragansett Bay (Collins, 1974; Levine, 1972; Morton, 1967; Weisberg, 1972), it is anticipated that the two-layer circulation system which existed during the field studies is best developed in spring and summer. During other seasons, more balanced tidal flow and somewhat re- duced flushing can be expected in the Taylor Point vicinity.
PREDICTIVE MATH MODELING AT TAYLOR POINT
Description of Models In concert with the field studies, a math modeling program was undertaken to predict
the far-field water quality effects of discharging secondary treatment effluent from an outfall off Taylor Point. Excess concentrations in the far-field region were predicted using a far-field advection - diffusion model in which concentration distributions are determined by advection (currents), turbulent diffushn, and natural decay processes. This Effluent Dispersion Model (EDM) is a two-dimensional computer model which pre- dicts the concentration of the discharged material over the study area. Inputs t o the far- field model include the spatially and temporally varying advective currents, which were obtained with a far-field Circulation Model.
446
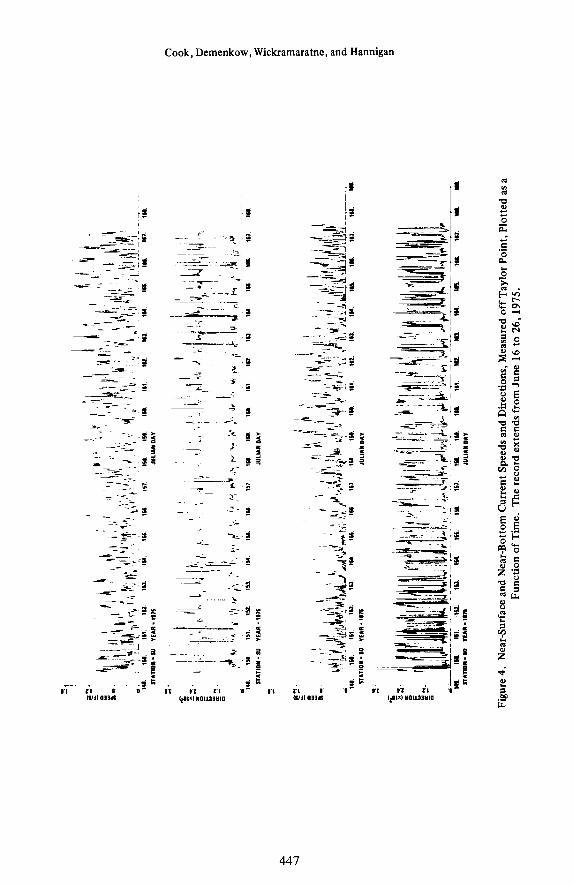
Cook, Demenkow, Wickrarnaratne, and Hannigan
447
FLO
OD
TID
E O
VE O
ISTR
IBU
TIO
N
JUNE
11,
1175
IF001
DEP
TH
CONT
OUR
INTE
RVA
L:
.13,
25
m =
.ra
m
.=O
VE
IUE
CTI
ON
MIN
T
DYE
INJE
CTI
ON
RA
TE 0
.1 6
PH O
F R
HO
OA
YlN
EW
l SO
LUTI
ON
TAYL
OR
PT.
\ c . . . .-
El
l TI
DE
DYE
OlS
TRllU
TlO
N h
<
___
___
JUNE
20,
1975
3-
FOO
T D
EPTH
IMIE
SrO
WN
-- +
CONT
OUR
INTE
RVA
L:
.13
,2
m =
2.1 m
.=
OVE
INJE
CTI
ON
MIN
T
RHO
OAM
lNE
WT
SOLU
TIO
N
\
\
\
0
Lf,
W
Figu
re 5
. Fl
ood
and
Ebb
Tid
e D
istr
ibut
ions
of
Tra
cer
Dye
Disc
harg
ed a
t the
Pro
babl
e O
utfa
ll Si
te.
Cook, Demenkow, Wickramaratne, and Hannigan
The Circulation Model predicts the currents throughout a vertically well-mixed, two- dimensional embayment from a knowledge of the tide heights and/or currents at the open boundaries of the embayment. The model is “dynamic” in that time-varying currents can be predicted from time-varying boundary currents or tide heights. Once calibrated, the model can be used to predict circulation patterns for a wide variety of conditions. The circulation model consists of a digital computer algorithm which yields a numerical solution to the vertically-averaged hydrodynamic equations of motion. The equations of motion describe water currents which are driven by horizontal pressure gradients pro- duced by tidally-induced changes in surface elevation.
The Effluent Dispersion Model (EDM) predicts the vertically-averaged excess concen- trations of coliforms, BOD and suspended solids throughout a horizontal two-dimensional plane, assuming the effluent remains in a fixed surface layer. The ambient transport processes of advection and turbulent diffusion are included in the model, along with the internal decay mechanisms. The spatial grid over the study areas used in the circulation model is also used for the EDM, and the dynamic current distributions predicted by the circulation model are used as inputs to the EDM model. The EDM translates the steady effluent discharge into time-varying excess constituent concentration patterns throughout the study area. The model is executed until steady-state saturation concentrations are reached over a tidal cycle (i.e., when flushing rate equals the effluent source rate). Similar two-dimensional models have been described by Leendertse (1970), March, et al. (1 97 l) , Laevastu,ef al. (1974), and Fair,ef al. (1968).
Application of Models
The vertically-integrated circulation model has been previously adapted to Narragan- sett Bay (Hess and White, 1974; Spaulding and Swanson, 1976), with good agreement obtained between predicted and measured currents. Predictions of currents off Taylor Point made in our study correspond to the integrated surface and bottom currents measured in the field. Although the bay is weakly stratified, vertically-averaged current predictions compare well with field data because the flow is tidally-dominated.
In the EDM model, the eddy diffusion coefficient D was estimated from tracer dye data using the following approximation (Ahn, 1974):
n
where u equals the transport velocity, L equals the dye plume width, x equals the dis- tance from the dye source, and the subscript i corresponds to a particular location in the plume. The diffusion coefficients completed from the dye data by this approximation range from 0.5 to 10.0 ft2/sec.
The decay coefficient for BOD was taken to be 0.35/day (Hydroscience Inc 1971). In order to obtain conservative estimates of coliform concentr ’ ‘m, a low decay ratc cf 1 .5/day was used (Guzman and Associates, 1970; Stewart, e f al., 1971). The decay of suspended solids was assumed to be zero.
For the Taylor Point application, a spatial grid with a length of 1216 feet (370 m) be- tween points was used in the models. The Effluent Dispersion Model was used to in- vestigate two source locations, one directly off Taylor Point (near-shore source) and the
449
Siting of a Water Pollution Control Facility at Jarnestown, Rhode Island
other approximately 1200 ft. (366 m) further off shore (off-shore source). The model was applied to three situations:
1. Neap tide conditions with near-shore source. 2. Neap tide conditions with off-shore source. 3. Spring tide conditions with near-shore source.
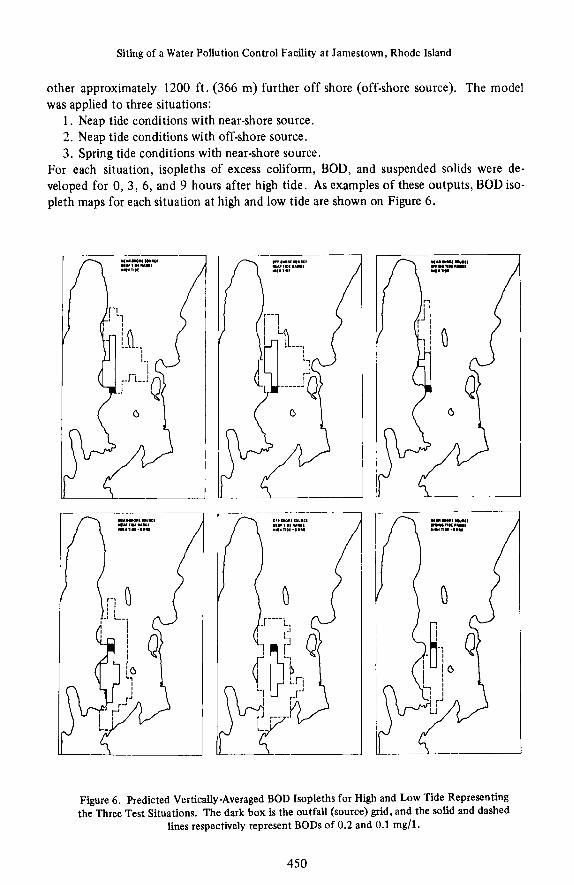
For each situation, isopleths of excess coliform, BOD, and suspended solids were de- veloped for 0, 3 , 6 , and 9 hours after high tide. As examples of these outputs, BOD iso- pleth maps for each situation at high and low tide are shown on Figure 6.
Figure 6. Predicted Vertically-Averaged BOD Isopleths for High and Low Tide Representing the Three Test Situations. The dark box is the outfall (source) grid, and the solid and dashed
lines respectively represent BODS of 0.2 and 0.1 mg/l.
450
Cook, Demenkow, Wickramaratne, and Hannigan
Modeling hedict ions A comparison of results for the two source locations demonstrates that the wastewater
field produced by the near-shore source tends to be less elongated than that produced by the off-shore source. The wastewater field from the near-shore source also tends to stay closer to shore and extend further into the coves north and south of Taylor Point, al- though neither source has any appreciable effect on these coves. The dilution charac- teristics of the off-shore locations are found to be better than those of the near-shore location due to the higher flushing rates obtained further off-shore. It is also observed that neap tide conditions produced higher concentrations of excess effluent than spring tide conditions; this is due to the lower flushing rates associated with the slower currents prevailing during neap tide,
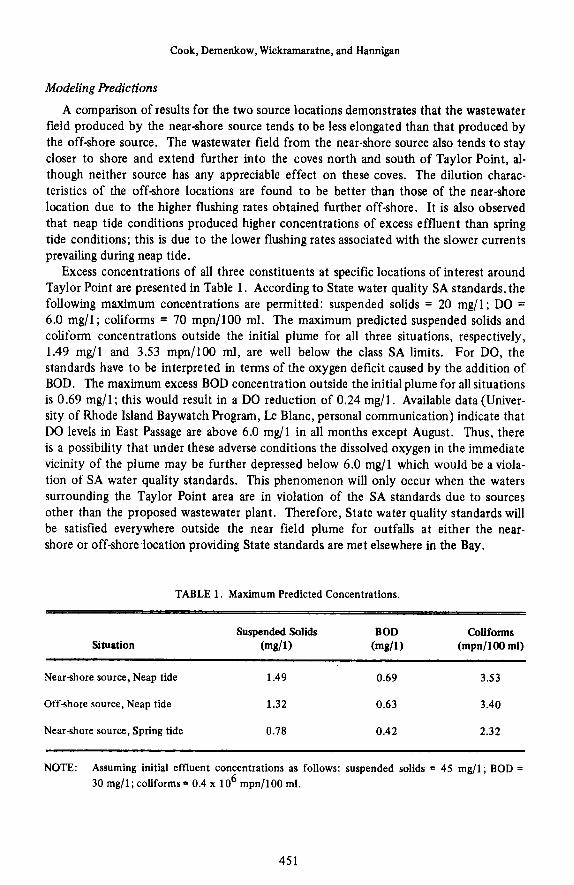
Excess concentrations of all three constituents at specific locations of interest around Taylor Point are presented in Table 1. According to State water quality SA standards, the following maximum concentrations are permitted: suspended solids = 20 mg/l; DO = 6.0 mg/l ; coliforms = 70 mpn/100 ml. The maximum predicted suspended solids and coliform concentrations outside the initial plume for all three situations, respectively, 1.49 mg/l and 3.53 mpn/100 ml, are well below the class SA limits. For DO, the standards have to be interpreted in terms of the oxygen deficit caused by the addition of BOD. The maximum excess BOD concentration outside the initial plume for all situations is 0.69 mg/l; this would result in a DO reduction of 0.24 mg/l . Available data (Univer- sity of Rhode Island Baywatch Program, Le Blanc, personal communication) indicate that DO levels in East Passage are above 6.0 mgll in all months except August. Thus, there is a possibility that under these adverse conditions the dissolved oxygen in the immediate vicinity of the plume may be further depressed below 6.0 mg/l which would be a viola- tion of SA water quality standards. This phenomenon will only occur when the waters surrounding the Taylor Point area are in violation of the SA standards due to sources other than the proposed wastewater plant. Therefore, State water quality standards will be satisfied everywhere outside the near field plume for outfalls at either the near- shore or off-shore location providing State standards are met elsewhere in the Bay.
TABLE 1. Maximum Predicted Concentrations.
Situation Suspended Solids BOD colifonns
(mdl ) (mgll) (mpnl100 ml)
Near-shore source, Neap tide 1.49
Offshore source, Neap tide 1.32
Near-shore source, Spring tide 0.78
0.69 3.53
0.63 3.40
0.42 2.32
NOTE: Assuming initial effluent concentrations as follows: suspended solids = 45 mg/l; BOD = 30 mg/l; coliforms = 0.4 x lo6 mpn/100 ml.
45 1
Siting of a Water Pollution Control Facility at Jamestown, Rhode Island
CONCLUSIONS Predictive math modeling, supported by field measurements, demonstrates that State
water quality SA standards can be maintained by releasing the secondary treatment effluent through an outfall located off the Taylor Point site designated by Jamestown residents. The EPA and the State of Mode Island have accordingly approved plans for construction of a diffuser type outfall discharging at the 52-foot (15.8 m) depth. The outfall and treatment plant are scheduled to be constructed and operational by June 1978.
ACKNOWLEDGMENTS
Design and general construction administration of the Jamestown Water Pollution Control Facility is being undertaken by Whitman & Howard Engineers. The outfall water quality field and analytical studies were performed by Raytheon Oceanographic & Environmental Services under contract to Whitman & Howard.
LITERATURE CITED
Ahn, C., 1974. Pollutant Dispersion in Shallow Coastal Water. IEEE Conference and Engineering in the Ocean Environment 1:411417.
Baumgartner, D. J . , D. S. Trent, and K. V. Byram, 1971. User’s Guide and Documentation for Outfall Plume Model. Working Paper 80, Environmental Protection Agency, Corvallis, Oregon.
Collins, B. P., 1974. Suspended Material Transport in Lower Narragansett Bay and Western Rhode Island Sound. M. Sc. Thesis. University of Rhode Island, Kingston, Rhode Island.
Fair, G. M., J. C. Geyer, and D. A. Okum, 1958. Elements of Water Supply and Wastewater Disposal. John Wiley & Sons, New York, New York.
Guzman and Associates, 1970. Sanitary Survey and Oceanographic Study for Proposed El Mani Wastewater Treatment Plant at Mayaguez, Puerto Rico. Tech. Rep., San Juan, Puerto Rico.
Hess, K . and F. White, 1974. A Numerical Tidal Model of Narragansett Bay. Marine Tech. Rep. 20. University of Rhode Island, Kingston, Rhode Island.
Hicks, S.D., 1963. Physical Oceanographic Studies of Narragansett Bay, 1957 and 1958. U.S. Fish and Wildlife Service Special Scientific Report. Fisheries No. 457, Washington, D.C.
Hydroscience, Inc., 1971. Simplified Mathematical Modeling of Water Quality. Tech. Rep., West- wood, New Jersey.
Jerka, S. and D. Harleman, 1973. The Mechanics of Submerged Multiport Diffusers for Buoyant Dis- charges in Shallow Water. Massachusetts Institute of Technology Rep. No. 169. Cambridge, Massachusetts.
Laevastu, T. and Staff, 1974. A Vertically Integrated Hydrodynamic Numerical Model, Part 14. U.S. Naval PostGraduate School, Monterey, California.
Leendertse, J. J., 1967. Aspects of a Computational Model for Long Period Water Wave Propagation. Rand Corp. Rep. No. RM-5294-PR, Santa Monica, California.
Leendertse, J. J., 1970. A Water Quality Simulation Model for Well-Mixed Estuaries and Coastal Seas: Volume I, Principles of Computation. Rand Corp. Rep. No. RM-6230-RC, Santa Monica, Califor- nia.
Levine, E. R., 1972. The Tidal Energetics of Narragansett Bay. M A . Thesis. University of Rhode Island, Kingston, Rhode Island.
March, F. D., N. Narayanan, and R. J. Brandes. A Short-Term Conservative Transport Model for Shallow Estuaries. Univ. Texas Report Hyd. 12-7104, Austin, Texas.
Morton, R. W., 1967. Spatial and Temporal Observations of Suspended Sediment: Narragansett Bay and Rhode Island Sound. Naval Underwater Weapons Research and Engineering Station, Tech. Mem. 396, Newport, Rhode Island, 33 pp.
Pritchard, D. W., 1955. Estuarine Circulation Patterns. Proc. Hydraulics Division, ASCE, 717-1 to 7 17-1 1 .
452

Cook, Demenkow, Wickramaratne, and Hannigan
Spaulding, M. and C. Swanson, 1976. Tides and Tidal Currents of Narragansett Bay. Marine Tech.
State of Rhode Island, 1973. Standards of Water Quality for Classification of Waters of the State.
Stewart, R. E., H. D. Putnam, R. H. Jones, and T. N. Lee, 1971. Diffusion of Sewage Effluent from
Weisberg, R. H., 1972. The Net Circulation in the West Passage of Narragansett Bay. M.Sc. Thesis.
Rep. 35, University of Rhode Island, Kingston, Rhode Island.
Dept. of Health, Division of Water Supply and Pollution Control, Providence, Rhode Island.
Ocean Outfall. J. Sanitary Eng. Div., ASCE, pp. 485-503.
University of Rhode Island, Kingston, Rhode Island.
453