Embed Size (px)
Citation preview
1 | P a g e
NIGERIA
SITUATION ANALYSIS AND NEEDS ASSESSMENT
OF SWEET POTATO AND OFSP
The authors accept sole responsibility for this report drawn up on behalf of HKI Nigeria.
The report does not reflect the views of HKI Nigeria.
-----------------------
2 | P a g e
CONTENTS
Acknowledgements 5
Acronyms and Abbreviations 6
List of Tables 7
Executive Summary 8
CHAPTER 1: INTRODUCTION 10
1.1. Objectives and Scope of the Study 10
1.2. Methodology/Strategy 11
1.3. Literature Search and Desk Review 11
1.4. Data Collection and Data Analysis 11
1.5. Output/Deliverables 12
CHAPTER 2: BACKGROUND AND CONTEXT 13
2.1 DEMOGRAPHIC INFORMATION 13
2.1.1. Location and Land Area 13
2.1.2. Population Dynamics 13
2.1.3. Peoples and Governance 14
2.1.4. Economy and Natural Resources 14
2.1.5. Formal Education 15
2.1.6. Literacy (Disaggregated By Sex; Rural/Urban) 15
2.2 HEALTH INFORMATION 15
2.2.1 Basic Health Indicators 15
2.3 NUTRITION 15
2.3.1. Food Consumption Patterns 16
2.3.2. Food Availability and Affordability 16
2.3.3. National Policy on Food and Nutrition 17
2.3.4. Food based nutrition interventions 18
3 | P a g e
2.3.4.1.International Organisations and Partner Agencies 18
2.3.4.2 National Institutions and Government Agencies 18
2.3.4.3 Federal Government School Feeding and Health programme 19
2.4 OVERVIEW OF THE NATIONAL AGRICULTURAL POLICY ENVIRNMENT
2.4.1. Fertilizer Policy
2.4.2. Seed Policy
2.4.3. Crop Protection Products Policy
2.4.5. Analysis of the Nigerian Agricultural Policy
2.4.5.1. The Main Features of the Policy
2.4.5.2. The Objectives of the Policy
2.4.5.3. Policy Strategies
2.4.5.4. Institutional framework and Policy Stakeholders
2.4.5.5. Review of Agricultural Development Supportive and Service Delivery Programs
2.4.5.6. Effectiveness of Policies, regulations and Institutions on Nigeria’s Agriculture
2.4.5.7. Agricultural Input Markets in Nigeria
CHAPTER 3: CASE STUDIES NARASARWA, KWARA AND BENUE STATES 20
3.1 Geographical Location and land Area 20
3.2. NASARAWA STATE 20
3.2.1. Literacy 20
3.2.2. Existing Interventions/Projects Addressing VAD, Nutrition, and Poverty 21
3.2.3. Average Major Crop Production Figure for 2010 -2011 in Nasarawa State 21
3.2.4 Extension System 21
3.2.5. Gender Differences in Decision Making.in Percentages 22
3.2.6. Sweet Potato for Livelihoods and Food Security 22
3.2.7. Sweet Potato Production for Food Security Production at Household 22
3.2.8. Marketing and Processing 23
3.2.9. Opportunities for Increased Utilization 23
3.2.10. Sweet Potato Agronomy and Breeding, Pests and Diseases 24
3.2.11. Sweet Potato Research and Multiplication System 24
4 | P a g e
3.2.12. Potentials for OFSP 25
3.2.13. Policy Environment 25
3.2.14. Stakeholders/Funding Agencies/Donors 25
3.2.15. Mobilization/Advocacy 25
3.3. KWARA STATE 26
3.3.1 Demographic Information 26
3.3.2. Arable Land Area 26
3.3.3. Type of Cropping Systems 26
3.3.4. Sweet Potato Farming and Production in Kwara State 27
3.3.5. Processing of Sweet Potato in Kwara State 27
3.3.6. Marketing of sweet potato in Kwara State 27
3.3.7. Challenges 28
3.4. BENUE STATE 28
3.4.1. Demographic Information 28
3.4.2. Production and Cropping System 29
3.4.3. Marketing Sweet Potatoes 29
CHAPTER 4: RECOMMENDATION and CONCLUSION 30
4.1.Recommendations 30
4.2. Conclusion 31
REFERENCES 32
ANNEX 36
5 | P a g e
ACKNOWLEDGEMENTS
This report has benefited immensely from the support of HKI Nigeria. The office has been very
supportive in responding to the required information and literature sources from partners and
counterparts, which have aided the detailed review and primary and secondary data collection
processes. This report acknowledges the efforts of the field officers who visited the various states
to collect the required information which have been used to put together this report.
6 | P a g e
ACRONYMS AND ABBREVIATIONS
ADP Agricultural Development Projects
AIBDF Agricultural Inputs Business Development Fund
AIIF Agricultural Inputs Import Fund
BASAC Bauchi State Agricultural Company
BNARDA Benue Agricultural and Rural Development Authority
ECOWAS Economic Community of West African States
FAO Food and Agricultural Organisation
FAO Food and Agriculture Organization of the United Nations
FASCOM Farmer Supply Company
FASCKT Farmer Supply Company, Katsina
FFD Federal Fertilizer Department
FGN Federal Government of Nigeria
FMARD Federal Ministry of Agriculture and Rural Development
FOS Federal Office of Statistics
FPDD Fertilizer Procurement and Distribution Division
FSCs Farm Service Centers
FSFC Federal Superphosphate Fertilizer Company Limited
GDP Gross Domestic Product
HKI Helen Keller International
IARCs international agricultural research centers
ICI Chemical and Allied Products
ICRISAT International Crops Research Institute for Semi-Arid
Tropics
IFDC International Fertilizer Development Center
IITA International Institute for Tropical Agriculture
IPC International Potato Centre
KASCO Kano Agricultural Supply Company
KADP Kwara State Agricultural Development Programme
KNARDA Kano State Agricultural and Rural Development Authority
7 | P a g e
LC letter of credit
LGA local Government Area
MIS Market Information Systems
NAFCON National Fertilizer Company of Nigeria
NARIs National agricultural research institutes
NGOs Nongovernmental organizations
NSS National Seed Service of the FMARD
NADP Nasarawa State Agricultural Development Programme
NAFDAC National Food and Drugs Administration and Control
NCFN National Committee on Food and Nutrition
NRCRI National Root Crops research Institute
NGO Non-Governmental Organisation
NPC National Population Commission
OFSP Orange Flesh Sweet Potato
PCU Project Coordinating Unit of the FMARD
PTF Petroleum Trust Fund
RAC Reaching Agent of Change
SPMMV Sweet Potato Mild Mottle Virus
SON Standard Organisation of Nigeria
SFI Soil fertility initiative
SG 2000 Sasakawa-Global 2000
SO Strategic Objective
UNICEF United Nations Children’s Fund
UNDP United Nations Development Program
USAID United States Agency for International Development
VAD Vitamin A deficiency
WHO World Health Organisation
VAT Value-added tax
WARDA West Africa Rice Development Association
8 | P a g e
LIST OF TABLES
Table 1. Formal Education (Disaggregated By Sex, Enrolment & Completion Rates
Table 2. Literacy (Disaggregated By Sex; Rural/Urban)
Table 3. Basic Health Indicators
Table 5. School Enrolment for Male and Female
Table 6. Nutrition Information
Table 7 Literacy Rate in Nasarawa State
Table 8. Average Health and Nutrition Status of Nasarawa State
Table 9. Average Major Crop Production Figure for 2010 -2011
Table 10. OFSP
Table 11. Varieties of Sweet Potato Grown
Table 12. Profile of Sweet Potato Farmers in Kwara State
Table 13. Summary of Descriptive Statistics of Sweet Potato Farmers in Kwara State
Table 14. Sweet Potato Production in Offa LGA, Kwara State
Table 15. Processing of Sweet Potato Offa LGA, Kwara State
Table 16. Sweet Potato Production in Offa LGA, Kwara State
Table 17. Processing of Sweet Potato Offa LGA, Kwara State
Table 18. Marketing of sweet potato in Offa LGA
9 | P a g e
EXECUTIVE SUMMARY
The situation Analysis examined the literature and both secondary and primary data on Sweet
Potato and Orange Fleshed Sweet Potato in Northern Nigeria, namely Benue, Kwara and
Nasarawa States. The broad objective of this situation analysis provides clear understanding of
the agricultural policy, and programme issues involved in up scaling sweet potato and OFSP in
Nigeria. Data were collected from exiting survey literature and the data bases of the States
Ministries of Agriculture and Natural Resources, Ministry of Economic Planning and Budget
National Population Commission, Ministries of Health, States Health Management Board,
Ministries of Education, Farmers and Sweet Potato Producers, etc. A focus Group Discussions
were also organized for groups in the various Agricultural Zones to foster better understanding
and interpretation of data. Most data from the reviewed literature were already analysed, while
the primary data were manually collated and tabulated for each state and used to either confirm
or update and fill the gaps in the secondary data.
The study reviewed the demographic, health and nutrition information in Nigeria as the basis for
unravelling the situation of sweet potato and OFSP in Nigeria. It examined the population
dynamics, land area and arable land, education and literacy, administration, the economy and
natural resource distribution in Nigeria. The health indicators especially those related to maternal
mortality, infant and child mortality and life expectancy are also reviewed. It addresses women’s
health and its effects on agricultural productivity. Furthermore, the study examined food
consumption patterns, food availability, and affordability within the framework of the national
nutrition policy. The study reviews the status of food based interventions in Nigeria and outlines
the local and international partnerships and institutional structure and systems that have been
established to facilitate improvements in nutrition in Nigeria.
The study reviews the national policy environment within the framework of the national
agricultural policy. These include the national fertilizer policy, seed policy, and the crop
protection products policy. The poor implementation of agricultural and nutritional policies is a
major obstacle to sweet potato and OFSP production in Nigeria. Most of the policies targeted
root and tuber crops in general and there are no specific policies targeted at sweet potato or
OFSP in particular. It was also found that the demand for sweet potato, availability of improved
10 | P a g e
technology and efficient dissemination of information by ADPS are critical to increase demand
generation and supply improvements in sweet potato and OFSP production and marketing.
It was further observed that literacy, health and nutrition status and location of intervening
projects favour urban areas more than rural areas. More so, females are worse off in most of the
parameters when compared to their males counter parts in the distribution of farming resources
and crop production. Major policy initiatives of the Federal Government had led to significant
increase in the demand for roots and tuber crops, which has created opportunities for the states in
the production of sweet potato and OFSP. The situation analysis shows that most of the data
available are not specific to sweet potatoes and OFSP but groups all root-crops (Cassava, yams,
and sweet potatoes) together as roots and in other instances just as potatoes. The study observed
that increase investment in Sweet Potato and OFSP will be enhanced the strengthening of formal
and informal education for the youths and mass literacy campaigns for adults. OFSP campaign
should target the rural poor especially the women. The high rate of illiteracy prevailing among
the women in rural areas poses a major constraint to advocacy. The situation suggests that the
introduction of OFSP programme must be coupled with mass literacy to facilitate understanding
of the need to invest in OFSP. High illiteracy in all the states suggests that simples’ methods
should be pushed in rural areas especially among women.
The study reviewed the situation in three states of Nigeria, Nasarawa, Kwara and Benue States.
The study shows marked similarities in the three states in terms of overall policy and institutional
structures for the expansion of sweet potato and OFSP. The challenges include the lack of access
to finance and modern technology. The recommendations focus on pro-poor interventions
targeted at women. It recommends improved access to finance and equipment for expanded
farming of sweet potatoes and OFSP in the three states and other parts of Nigeria.
11 | P a g e
CHAPTER 1
INTRODUCTION
The Reaching Agent of Change (RAC) is a three (3) year project funded by Bill and Melinda
Gates Foundation in collaboration with the International Potato Centre (CIP). The overall vision
of the project is to see substantially increased investments and commitment to the dissemination
and use of Orange Flesh Sweet Potatoes (OFSP) as a means to combat Vitamin A deficiency
(VAD) and food insecurity in Nigeria. The objectives of RAC are:
1. To increase investment in orange-fleshed sweet potato (OFSP) through advocacy and
capacity building;
2. To put in place policy and institutional arrangements to upscale OFSP; and
3. Develop best practices for OFSP advocacy. This advocacy effort will be spearheaded by
a cadre of dynamic African advocates who are committed to achieving better nutrition
impact through agricultural innovation.
1.1. Objectives and Scope of the Study
Broadly, this situation analysis provides understanding of the policy, gender and agricultural
issues involved in the up scaling of sweet potato and OFSP in Nigeria.
Specifically, objectives of the situation analysis are as follows:
1. Identify the environment, policies, gender issues, and stakeholders, farming system,
organizations, and VAD and funding opportunities for sweet potato and OFSP.
2. Determine federal and State level policies affecting sweet potato cultivation and
consumption in the areas.
3. Identify gaps in knowledge/information regarding sweet potato and Orange Fleshed
Sweet Potato.
4. Identify potential stakeholders to Orange Fleshed Sweet Potato advocacy strategy in
Nigeria.
12 | P a g e
1.2. Methodology/Strategy
The situation analysis covered three States of Northern Nigeria namely Benue, Kwara and
Nasarawa States, which were purposely chosen by Helen Keller International. The three states
have large number of sweet potato producers and potentials of increased productivity of sweet
potato and OFSP.
1.3. Literature Search and Desk Review
The study relied extensively on available evidence on sweet potatoes and OFSP in Nigeria in
general and specifically on the three selected states. There is a gamut of literature on the subject
based on extensive surveys conducted by researchers and agricultural institutions in the state and
the federal government departments and agencies on agriculture. International organisations such
as UNICEF, FAO, WHO and the World Bank have published a number of data bases that
provide useful and extensive information on the subject. These materials were consulted and
referenced in this report.
1.4. Data Collection
Both Primary and Secondary data were collected from the three States of Benue, Kwara and
Nasarawa. The secondary data were collected from literature and data sets from the States
Ministries of Agriculture and Natural Resources, Ministry of Economic Planning and Budget,
National Population Commission, Ministries of Health, States Health Management Board,
Ministries of Education, Central Bank of Nigeria and Federal Office of Statistics.
The primary data were collected from the states using field assistants. Each State was divided
into three Agricultural zones with the aid of Agricultural Development Programme (ADP). A
multi-Stage sampling procedure was used. In each agricultural zone, three Local Government
Areas were purposely selected due to importance in Sweet Potato Production. In the second
stage, twenty households were randomly selected from each Local Government Area, which
gave a total of 60 households in each agricultural zone. In each State therefore, a total of 180
farmers were used in eliciting information on the situation and policy issues regarding Sweet
Potato and other farming activities of each State. A total of 540 Farmers were interviewed,
comprising 180 from Benue, Kwara and Nasarawa respectively.
13 | P a g e
1.5. Data Analysis
Most data from the reviewed literature were already analysed and described while the primary
data were manually collated and tabulated for each state and used to either confirm or update and
fill the gaps in the secondary data.
1.6. Output/Deliverables
The deliverables are; to conduct the situation analysis for use during an upcoming advocacy
policy analysis workshop, and deliver a completed situation analysis report.
14 | P a g e
CAHPTER 2
BACKGROUND AND CONTEXT
2.1 DEMOGRAPHIC INFORMATION
2.1.1. Location and Land Area
Nigeria is the most populous country in Africa. It is situated on the Gulf of Guinea in West
Africa. Its neighbors are Benin, Niger, Cameroon, and Chad. The lower course of the Niger
River flows south through the western part of the country into the Gulf of Guinea. Swamps and
mangrove forests border the southern coast; inland are hardwood forests. Nigeria’s land area
covers a total of 92.4 million hectares including 91.1 million hectares of land mass and 1.3
million hectares of water bodies. The agricultural land area of 83.6 million hectares is classified
as 28.2 million hectares arable, 2 million hectares of irrigable land, 2.5 million hectares
permanent crops, 10.9 hectares forest/wood, and 40 million hectares pasture. The agricultural
gross domestic product is contributed by crops 85%, livestock 10%, fisheries 4%, and forestry
1%. More than 90% of the agricultural output is accounted for by small-scale farmers with less
than 2 hectares under cropping. It is estimated that about 75%t (68 million hectares) of the total
land area has potential for agricultural activities with about 33 million hectares under cultivation.
However, of the estimated 3.14 million hectares of irrigable land area, only about 220,000
hectares 7% is utilized (NPC, 2009).
2.1.2. Population Dynamics
The population of the country, based on the 2010 estimate is 152,217,341 with an urban
population of 50% of total population. It has a population growth rate of 1.9%; birth rate of
36.0/1000; infant mortality rate of 92.9/1000; life expectancy of 47.2; and a population density
of 151 per km2. The age of the population is as follows: 0-14 years: 42.3% (male
27,466,766/female 27,045,092), 15-64 years: 54.6% (male 35,770,593/female 34,559,414), and
65years and over: 3.1% (male 1,874,157/female 2,055,966). The median age in Nigeria is an
average of 18.63 years for the total population, while it is 18.71 years for the male population,
and 18.55 years for the female population. The country has a total population sex ratio of 1.02
male(s)/female. Sex ratio at birth is 1.03 male(s)/female; under 15 years: 1.02 male(s)/female;
15 | P a g e
15-64 years: 1.04 male(s)/female; 65 years and over: 0.91 male(s)/female; and. Nigeria has a net
migration rate of 0.27 migrant(s)/1,000 population (NPC, 2009)
2.1.3. Peoples and Governance
Nigeria is composed of more than 250 ethnic groups; the following are the most populous and
politically influential: Hausa and Fulani 29%, Yoruba 21%, Igbo (Ibo) 18%, Ijaw 10%, Kanuri
4%, Ibibio 3.5%, Tiv 2.5%. English language is the official administrative language, while local
vernacular are predominantly Hausa, Yoruba, Igbo (Ibo), and Fulani, Ibibio, Efik, Ijaw, and more
than 200 others. Administratively, the country consists of 36 states, a federal capital territory,
and 774 local government areas (LGAs). The country is governed under a three-tier government
structure of the federal, state, and local governments. This administrative structure is meant to
promote development at the community level. The states include, Abia, Adamawa, Akwa Ibom,
Anambra, Bauchi, Bayelsa, Benue, Borno, Cross River, Delta, Ebonyi, Edo, Ekiti, Enugu,
Gombe, Imo, Jigawa, Kaduna, Kano, Katsina, Kebbi, Kogi, Kwara, Lagos, Nassarawa, Niger,
Ogun, Ondo, Osun, Oyo, Plateau, Rivers, Sokoto, Taraba, Yobe, Zamfara (NPC, 2009).
2.1.4. Economy and Natural Resources
The economy of Nigeria has an estimated Gross Domestic Product GDP (purchasing power
parity) of $357.2 billion. The real GDP growth rate is 6.2%, GDP - per capita and purchasing
power parity is $2,400, inflation is 11.5%, unemployment rate is 4.9% and rate of urbanization is
3.5%. The disaggregated GDP by sector is as follows: agriculture: 36.3%, industry: 30.5%,
services: 33.3%. The labour force is an estimated 55.67 million. The occupational distribution of
the Labor force is; agriculture 70%, industry 10%, services 20%. 60% of the population lives
below poverty line. The major natural resources are natural gas, petroleum, tin, columbite, iron
ore, coal, limestone, lead, zinc, and arable land. The main agricultural products include, cocoa,
peanuts, palm oil, corn, rice, sorghum, millet, cassava, potato, yams, rubber; cattle, sheep, goats,
pigs; timber; and fish. Similarly, the main industrial products are , crude oil, coal, tin, columbite,
palm oil, peanuts, cotton, rubber, wood, hides and skins, textiles, cement and other construction
materials, food products, footwear, chemicals, fertilizer, printing, ceramics, steel, small
commercial ship construction and repair (FOS, 2009) .
16 | P a g e
2.1.5. Formal Education
Primary school participation, net enrolment ratio in the period 2007-2010 is 66% for males and
60% for females. Net enrolment ratio for secondary school participation in the same period is
29% for male and 22% for female Seex table 1 Annex 1.
2.1.6. Literacy (Disaggregated By Sex; Rural/Urban)
Nigeria’s literacy rate for the total population is 68%, male: 75.7%, female: 60.6%. Literacy rate
among young people age 15-24 is 78% for male and 65% for female. Adult literacy rate is 61%.
Primary school net enrolment ration 2007-2009 is 63% (See table 2 Annex 1) (NPC, 2009).
2.2. HEALTH INFORAMATION
2.2.1 Basic Health Indicators
Under 5 Mortality Rate in 2010 Is 143/1000 Live Birth. Infant Mortality Rate (Under 1) In Same
period is 88/1000 live births. Neonatal mortality rate, 2010 is 40. Life expectancy at birth
(years), 2010 is 51. Maternal mortality ratio, 2006-2010 is 550/10000. Antenatal care coverage
(%), at least once, 2006-2010 is 58%. Life expectancy for females as a % of males, 2010 is 103
(See Table 3, Annex 1) (NPC, 2009).
2.3. NUTRITION
Food insecurity and malnutrition in rural areas of Nigeria result from non-implementation and
inadequate implementation of the National Food and Nutrition Policy and National Plan of
Action for Food and Nutrition.75% of children (2006-2010) are introduced to solid, semi-solid or
soft foods, (6-8 months), Vitamin-A supplementation coverage rate (6-59 months) 2010, full
coverage is 91%. Early initiation of breastfeeding (%), (2006-2010) is 38. Percentage of children
(2006-2010) who are exclusively breastfed, (<6 months) is 13%. Percentage of children (2006-
2010) who are: introduced to solid, semi-solid or soft foods, (6-8 months). Percentage of under-
fives (2006-2010) suffering from: stunting moderate & severe is 41%. Vitamin A
supplementation coverage rate (6-59 months) 2010, full coverage (%) is 100% (See table 6
Annex) (NPC, 2009).
17 | P a g e
2.3.1. Food Consumption Patterns
A majority of the households residing in the rural areas consumed fruit, leafy vegetables, meat
products, and dairy products between once and twice a week. 2.2% of households in the rural
areas do not consume meat products. The trend in frequency of consumption of non-staple foods
by households in the rural is similar to the observed pattern in the rural sector. A majority of the
households consume more non-staple foods once or twice a week. For almost all the non-staple
foods with the exception of fats and oils, their percentage frequency of consumption are known
to decreased after the once or twice a week. In all the sectors, a relatively significant percentage
of the households did not consume meat products (2%) or fruit (1%). Non-leafy vegetables
followed by fats and oils, fruit, and fish products are consumed over four times a week in the
urban areas (FOS, 2010).
2.3.2. Food Availability and Affordability
According to the Federal Office of Statistics (2009), the most available staple foods that are
major sources of energy (calories) were rice (14.8%), cassava (12.9%), maize (10.6%), and yam
(10.1%). Cowpea, groundnut, and soybean are major sources of plant proteins. Cowpea was the
most available, followed by groundnut, and soybean. The most available non-staple foods were
meat products (14%), non-leafy vegetables (13%), leafy vegetables (9.5%), and fats and oils
(8.9%). The least available and affordable were banana, bakery products, fruit, and beverages.
Within the 9–12 month period, rice was more available (16.4%) and affordable (13%) in the dry
savanna zone, followed by maize at 12.7% (availability) and 10.5% (affordability), and sorghum
at 11.6% (availability) and 10.3% (affordability). Cassava and yam were the least available and
affordable. In the dry savanna, the most available non-staple foods were meat products (12.4%),
non-leafy vegetables (15.4%), dairy products (8.2%), and fats and oils (10.6%). The least
available and affordable were bakery products, fruit, and beverages. In the moist savanna rice
was more available (12%) and affordable (9%), followed by cassava and maize (11%) and yam
(10.5%). Soybean, plantain, and sorghum are the least available and affordable. Among legumes,
cowpea was the most available and affordable followed by groundnut and soybean. The most
available staple foods that are major sources of energy (calories) were rice (15.7%), cassava
(18.0%), maize (9.3%), potatoes and yam (12%) in the humid forest. Cowpea, soybean, and
groundnut are major sources of plant proteins. Cowpea is the most available, followed by
18 | P a g e
groundnut. Soybean is the least available. Cassava is the most affordable, followed by rice, yam,
and maize. For legumes, cowpea is the most affordable followed by groundnut. In the humid
forest zone, the most available non-staple foods are meat products (15.2%), non-leafy vegetables
(11.8%), leafy vegetables (10.8%), fats and oils (8.0%), and fish (8.5%). The same trend is
observed for affordability. The least available and affordable are banana, bakery products, fruit,
and dairy products (FOS, 2009).
2.3.3. National Policy on Food and Nutrition
Nigeria launched its National Policy on Food and Nutrition in 2002, with the overall goal of
improving the nutritional status of all Nigerians. This policy sets specific targets, which include
reduction of severe and moderate malnutrition among children under five by 30% by 2010, and
reduction of micronutrient deficiencies (principally of vitamin A, iodine and iron) by 50% by
2010. To tackle malnutrition, Nigeria has identified the following strategies:
Improving Food Security through programmes and projects in the agricultural and
nonagricultural sectors to increase household income especially in the poorer segment of
the population.
Enhancing care-givers’ capacity by promoting optimal infant feeding practices and
reducing the workload of women to create more time for childcare, through the
development of labour saving technologies
Improving Health services to provide essential maternal and child health care
Controlling micronutrient deficiency and anemia through a strategy comprising vitamin
and mineral supplementation, food fortification and dietary diversification.
Eliminating Iodine Deficiency Disorder through salt iodization programme
Institutionalizing general consumer protection measures to safeguard food quality and
consumer health.
19 | P a g e
4.2.1. Food based nutrition interventions
4.2.1.1.International Organisations and Partner Agencies
Major interventions and projects aimed at improving nutrition including food based nutrition
interventions are implemented by the government of Nigeria and international partners. These
include, UNICEF, FAO, WHO, UN, NGOS, international organizations, federal, state and local
governments. It is important to note that most of these agencies operate through federal, states
and Local Governments ministries. Take for instance, the National Programme for food security
is jointly assisted by World Bank, FAO, USAID and it is coordinated by UN. National
Agricultural Marketing Information System is jointly assisting the States in Agricultural
Marketing and Information. UNICEF and WHO are involved in Nutrition and health related
projects in all the States and it administered through the States Ministry of Health. None of the
Agencies is directly funding sweet potato in any of the States. Supported by UNICEF and the
Micronutrient Initiative of the Canadian Government, this programme works through the
establishment of an effective partnership with the private sector food industries, media houses,
the consumer association and development partners.
2.3.4.2 National Institutions and Government Agencies
The National Planning Commission through the National Committee on Food and Nutrition
(NCFN) serves as the focal point for the co-ordination and harmonization of all food and
nutrition related policies and programmes in the country. The Federal Ministry of Health, the
Federal Ministry of Industry, the National Agency for Food and Drugs Administration and
Control (NAFDAC), the Standards Organization of Nigeria (SON), the National Primary Health
Care Development Agency are also involved in the Government nutrition programmes. The
initiative to control and reduce micronutrient deficiency disorders in Nigeria goes back to 1990.
In 2002, the Government adopted a new strategy: the fortification of staple food with Vitamin A,
so that children will naturally consume Vitamin A in their food. The Ministry of Industry and
Standards Organization of Nigeria published mandatory standards for vitamin A fortification in
flour, sugar, and vegetable oil in 2002. By 2004, 70% of the sugar, 100% of wheat flour and 55%
of vegetable oil sold on the market, were fortified with Vitamin A. Nigeria is also fortifying
wheat flour with iron, thereby helping to protect children and mother’s physical and mental
health (UNICEF, 2006).
20 | P a g e
2.3.4.3 Federal Government School Feeding and Health programme
A combination of social marketing techniques and enforcement of quality standards by
NAFDAC and SON ensure both the demand for fortified food and the compliance of producers
and importers. To improve the nutritional status of school children, the Federal Government
launched the Home-Grown School Feeding and Health programme in September 2005 under the
coordination of the Federal Ministry of Education. The programme aims to provide a
nutritionally-adequate meal during the school day. The pilot phase (Sept 2005-July 2006)
involved 12 States and the Federal Capital Territory in the six geopolitical zones (UNICEF,
2006).
21 | P a g e
2.4. OVERVIEW OF THE NATIONAL AGRICULTRAL POLICY ENVIRONMENT
According to (IITA//IFDC/WARDA, 2000), assessment of the Agricultural Input Markets in
Nigeria, shows that the Federal Government of Nigeria formulated its first comprehensive
agricultural policy in 1985. The policy instruments, which remained valid for the next 15 years,
composed of macro-economic policies, agricultural-sector policies, and policies for the support
services. The macro-economic policies included pricing, trade, exchange rate, and agricultural
land policies. The sector-specific policies included food production, input supply and subsidy
policies while the support services policies included agricultural technology generation and
extension, agricultural credit, insurance, produce marketing, and research policies. The primary
objective of these policies was to reinforce agriculture’s contribution to food security,
employment, and provision of raw materials and foreign exchange in the Nigerian economy.
2.4.1. Fertilizer Policy
Prior to 1976, the state governments were responsible for the procurement and distribution of
fertilizer until the Federal government established the Fertilizer Procurement and Distribution
Division (FPDD) within the Federal Ministry of Agriculture as the central procurement and
distribution unit. Two granulation plants, Federal Superphosphate Fertilizer Company Limited
(FSFC) and National Fertilizer Company of Nigeria (NAFCON), were established in 1976 and
1988, respectively. These were set up as a strategy to develop domestic production capacity to
meet a significant proportion of fertilizer demand. A later development in the fertilizer
production scene was the installation of many bulk blending plants in various parts of the
country through public and private sector initiatives. Between 1976 and 1995, several variants of
the procurement and distribution arrangements between the FGN and the States were
experimented. They included the involvement of the states and state organs in the transportation
and distribution of imported and domestically produced fertilizers, the establishment of fertilizer
depots as distribution points to the States, and the involvement of NAFCON in the distribution of
locally produced fertilizers. As consumption of fertilizer increased, the inadequacies of public
sector controlled procurement and distribution arrangements began to manifest in leakage and
transit losses, late and non-deliveries of fertilizers to designated depots, artificial scarcity, and
unsustainable subsidy burden. Realizing that an efficient and sustainable agricultural input
supply system could be achieved through the participation of the private sector, the Government
22 | P a g e
started reforming the fertilizer sector in 1994 and adopted a fertilizer liberalization policy in
1996. That policy aimed at improving production, procurement and marketing efficiency and
encouraging transparency and competition. The Federal government completely withdrew from
procurement and distribution activities and discontinued the subsidization of fertilizer. To give
relief to farmers, it reduced the import tariff on fertilizers from 10% in 1996 to 5% in 1997 and
zero percent in 2000; it also abolished the value-added tax (VAT) and excise duty. However,
because the reform process was not supported by developments in institutional capacity and
human capital formation, fertilizer use decreased from over 500,000 nutrient tons in 1994 to
approximately 100,000 nutrient tons in 1999 (IITA//IFDC/WARDA, 2000). The private sector
and some states have now assumed greater responsibilities for production, procurement and
marketing activities. Most of the states have established blending plants to increase the local
supply of blended products while others such as Oyo State procure fertilizers from the main
private sector producers and importers at market prices and distribute them to farmers at
subsidized prices.
2.4.2. Seed Policy
According to the (Federal Ministry of Agriculture and Rural Development 2001), the national
seed policy, formulated in 1992, provides guidelines for the development of the seed sector. The
national agency responsible for coordinating development, monitoring policy, and implementing
quality control in the national seed system is National Seed Service (NSS) of the Federal
Ministry of Agriculture and Rural Development (FMARD). To give a legal backing to the seed
policy, a National Agricultural Seed Decree No. 72 (1992) was enacted for regulating the various
aspects of seed production, marketing, and quality control activities in Nigeria. The national seed
policy is in line with regional/international standards and makes provisions for the withdrawal of
public sector agencies in favor of the private sector in key areas of the seed industry. However,
in practice, public- and private-sector roles are not clearly delineated. Today, the NSS roles are
limited to seed technology training, quality control, and the coordination of breeder seed
production. The production of breeder seed is the responsibility of agricultural research
institutes, while that of foundation seed is handled by both the NSS and the private sector.
Certified seed production is now in the domain of the private sector, using contract farmers.
23 | P a g e
2.4.3. Crop Protection Products CPP Policy
According to (IITA//IFDC/WARDA, 2000), Government strategy on agro-chemicals supply is to
encourage the establishment of plants to manufacture or process agro-chemicals in Nigeria. For
imported agro-chemicals the government’s strategy is to ensure the timely supply in adequate
quantities by providing the necessary assistance for their importation. The marketing of CPPs in
Nigeria is much unorganized and lacks proper legislative control. The deregulation policy has
attracted many unprofessional dealers in CPPs subsector with serious implications for quality,
human health, and the environment. Agricultural Development Projects (ADPs) are directly
involved in the pricing or marketing of CPPs.
2.4.5. ANALYSIS OF NIGERIAN AGRICULTURAL POLICY
According to the (Federal Ministry of Agriculture and Rural Development 2001), the assessment
of the national agricultural policy and investment in Nigeria covers an assessment of the
performance of Nigeria’s agriculture sector, a review of past policies affecting agriculture, an
assessment of investment processes in Nigerian agriculture, an analysis of constraints to private
sector investment in Nigerian agriculture, and an evaluation of investment options. Nigeria's
agricultural policy is the synthesis of the framework and action plans of Government designed to
achieve overall agricultural growth and development. The policy aims at the attainment of self-
sustaining growth in all the sub-sectors of agriculture and the structural transformation necessary
for the overall socioeconomic development of the country as well as the improvement in the
quality of life of Nigerians.
2.4.5.1. Main Features of the National Agricultural Policy
The main features of the national agricultural policy include the evolution of strategies that
ensure self-sufficiency and the improvement of the level of technical and economic efficiency in
food production, the introduction and adoption of improved seeds and seed stock, husbandry and
appropriate machinery and equipment. Others are the efficient utilization of resources,
encouragement of ecological specialization and recognition of the roles and potentials of small
scale farmers as the major production of food in the country. The policy proposed a reduction in
risks and uncertainties through the introduction of the agricultural insurance scheme to reduce
natural hazards factor militating against agricultural production and security of credit outlay
through indemnity of sustained losses. A nationwide, unified and all-inclusive extension delivery
24 | P a g e
system under the Agricultural Development Programme (ADP) was put in place in a joint
Federal and State Government collaborative effort. Agro -allied industries were actively
promoted. Other incentives such as rural infrastructure, rural banking, primary health care, and
cottage industries were provided, to encourage agricultural and rural development and attract
youth, including school leavers, to engage in farming. The agricultural policy is supported by
sub-policies that facilitate the growth of the sector.
2.4.5.2. Policy Objectives
According to the (Federal Ministry of Agriculture and Rural Development 2001), the broad
policy objectives are:
i. The achievement of self-sufficiency in basic food supply and the attainment of food
security;
ii. Increased production of agricultural raw materials for industries;
iii. Increased production and processing of export crops, using improved production and
processing technologies;
iv. Generating gainful employment;
v. Rational utilization of agricultural resources, improved protection of agricultural land
resources from drought, desert encroachment, soil erosion and flood, and the general
preservation of the environment for the sustainability of agricultural production;
vi. Promotion of the increased application of modern technology to agricultural production;
vii. Improvement in the quality of life of rural dwellers.
viii. Creation of more agricultural and rural employment Opportunities to increase the income of
farmers and rural dwellers and to productively absorb an increasing labour force in the
nation;
ix. Protection and improvement of agricultural land resources and preservation of the
environment for sustainable agricultural production;
x. Establishment of appropriate institutions and creation of administrative organs to facilitate
the integrated development and realization of the country's agricultural potentials.
25 | P a g e
2.4.5.2. Policy Strategies
i) Creating a more conducive macro-environment to stimulate greater private sector
investment in agriculture;
ii) Rationalizing the roles of the tiers of government and the private sector in their
promotional and supportive efforts to stimulate agricultural growth;
iii) Reorganizing the institutional framework for government intervention in the
agricultural sector to facilitate the smooth and integrated development of the sector;
iv) Articulating and implementing integrated rural development programs to raise the
quality of life of the rural people;
v) Increasing budgetary allocation and other fiscal incentives to agriculture and
promoting the necessary developmental, supportive and service-oriented activities to
enhance agricultural productivity, production and market opportunities; and
vi) Rectifying import tariff anomalies in respect of agricultural products and promoting
the increased use of agricultural machinery and inputs through favourable tariff
policy.
2.4.5.3. Institutional Framework and Policy Stakeholders
The successful implementation of the agricultural policy is contingent upon the existence of
appropriate institutional structures that guarantee the effectiveness of agricultural enterprises and
the welfare of farmers through the provision of access to credit and investment funds, subsidies,
and budgetary allocation. The national agricultural policy is based on the administrative structure
of the government. It outlines the stakeholders as the federal, state and local governments as well
as the private sector. These institutional stakeholders are the main actors that drive the
implementation of the national agricultural policy. Within the framework of the national policy,
the federal government is responsible for research and development of appropriate technology
for agriculture, including biotechnology; seed industry development, seed law enforcement and
seed quality control; support for input supply and distribution, including seeds, seedlings, brood
stock and fingerlings; continued support for agricultural extension services; promotion of micro-
and rural credit institutions; promotion of agricultural commodity development and marketing.
26 | P a g e
The state governments are responsible for the promotion of the primary production of all
agricultural commodities through the provision of a and efficient and effective extension service;
the production of inputs for crops, livestock, fish and forestry; access to land for all those
wishing to engage in farming; development and management of irrigation facilities and dams;
training and manpower development; promotion of appropriate institutions for administering
credit to smallholder farmers; maintenance of buffer stocks of agricultural commodities;
investment in rural infrastructure, including rural roads and water supply in collaboration with
federal and local governments; and, ownership, management and control of forest estates held in
trust for local communities. The local governments are responsible for the provision of effective
extension service; rural infrastructure to complement federal and state governments' efforts;
management of irrigation areas of dams; mobilization of farmers for accelerated agricultural and
rural development through cooperative organizations, local institutions and communities;
provision of land for new entrants into farming in accordance with the provision of the Land Use
Act; and, coordination of data collection at primary levels. According to the policy document,
private sector is responsible for agricultural production; processing, storage and marketing are
essentially private sector activities Federal Ministry of Agriculture and Rural Development
2001).
2.4.5.4. Review of Agricultural Development, Supportive and Service Delivery Programs
The agricultural development programmes include research and development, biotechnology
development, animal vaccine production, veterinary drug manufacture, agro-chemicals
manufacture, water management, adaptive technology promotion, and the creation and operation
of an Agricultural Development Fund. The supportive activities include input incentive support
and commodity marketing and export activities. The Service Delivery Activities include input
supply and distribution, agricultural extension, micro-credit delivery, cooperatives and
farmer/commodity associations, commodity processing and storage, agro-allied industry and
rural enterprise development, and export promotion of agricultural and agro-industrial products.
2.4.5.5. Effectiveness of Policies, Regulations and Institutions on Nigerian’s Agriculture
According to (Manyong et. al. 2005), constraints to agricultural policy effectiveness are
identified to include those of policy instability, policy inconsistencies, and narrow base of policy
27 | P a g e
formulation, poor policy implementation, and weak institutional framework for policy
coordination. The policies aimed at stimulating on-farm production, which includes those
policies aimed at stimulating agricultural production for domestic market, agricultural input
demand by farmers, domestic agricultural commodity trade, agricultural input supply to farmers
and domestic investment in agriculture. According to the (Federal Ministry of Agriculture and
Rural Development 2001), the national agricultural policy notes that the most effective
agricultural policies and regulations are those targeted to upstream agricultural production
activities and geared towards the domestic market. Policies geared towards enhanced post-
production activities such as commodity storage, commodity processing, transportation and
distribution services as well as commercialization of agriculture are generally ranked low in
terms of effectiveness. Other policies and regulations associated with improved human welfare
ranked very low, while policies on foreign investment ranked lowest in terms of effectiveness of
policies, regulations. The facilitating factors for the effectiveness of policies and regulations on
agriculture include high demand for agricultural produce, availability of improved technology,
efficient dissemination of information by the ADPs, and value added leading to improved
income. On the other hand, the common factors responsible for ineffectiveness of policies and
regulations, especially on the downstream segment of agriculture, include instability of the
political climate, insecurity of investment, non-standardized product quality, non-competitive
nature of agricultural products from the country in the export market due to high cost of
production and lack of adequate processing facilities.
.
2.4.5.6. Agricultural Input Markets in Nigeria
According to IITA (2000), agricultural input markets are fragmented and underdeveloped in
Nigeria. During the 1990s, Nigeria introduced input market reforms without adequate supporting
developments in institutional capacity and human capital formation. As a result, fertilizer use
decreased from over 500,000 nutrient tons in 1993/94 to approximately 100,000 nutrient tons in
1999/2000. The use of improved seed and pesticides also decreased. Because the input markets
are not functioning properly, the transaction cost of acquiring inputs is high and even then inputs
are not readily available on time and in good quality. Quality control regulations are not enforced
properly. In the seed sector, funding arrangements for the National Seed Service (NSS) remain
inadequate and uncertain for performing training and quality control functions. Dealer networks
28 | P a g e
in rural areas are not well developed, and farmers must travel long distances to acquire inputs.
Access to finance for developing medium and small-scale enterprises is prohibitive. Market
information is nearly absent. The Federal Fertilizer Department (FFD, formerly Fertilizer and
Procurement Division (FPD) responsible for collecting and disseminating agronomic data
(fertilizer response rates) and market information (input and crop output prices), is severely
constrained to perform its functions. The lack of reliable data makes it difficult to calculate
value-cost ratios and other relevant parameters for proper business planning. Although the
production of certified seed is managed by the private sector, arrangements for the production of
foundation seed are not clearly defined. The lack of clarity about intellectual property rights
discourages breeder seed production in the private sector. Lack of proper monitoring and
regulation has led to the widespread sales of outdated pesticides by untrained and unscrupulous
traders endangering human health and the environment.
29 | P a g e
CHAPTER 3: CASE STUDY OF NASARAWA, KWARA AND BENUE STATES
3.1 Geographical Location and land Area
Nasarawa, Kwara and Benue States are located in the north central zone of Nigeria within the
sub-humid region which lies south of the semi-arid and arid zones. The region occupies about 43
million hectares with rainfall ranging from 1000 to 2000 mm. 71% of the arable area is not
cultivated due to low population density. The vegetation consists of open forest in the south and
savannah grassland in the northernmost parts of the zone. Rainfall ranges from 1000 to 2000
mm. This region produces the largest quantities of sweet potato as well as yam, cassava,
sorghum, maize, rice and onions (FOS, 2009)
3.2. NASARAWA STATE
Nasarawa state is located in the north central zone of Nigeria. It is located on latitude of 70 and
90N and longitude of 70 and 100E. Nasarawa state was carved out of Plateau state in 1st October,
1996. It has a land area of about 27118 km2. Major crops produced in the state include Yam,
Cassava, Maize Sweet Potatoes, Rice, Sorghum, Groundnut, Benniseed, Sugarcane, Cowpea and
Millet. The State is divided into three administrative regions. Nasarawa Central comprises
Nasarawa Eggon, Akwanga; and Wamba; Nasarawa East comprises, Keffi, Kokona, Nasarawa,
Toto, and Karo. Nasarawa South comprises Lafia, Doma, Awe, Keona, and Obi. The formal
enrolment and completion of primary education in Nasarawa state is 70% for male and 56% for
female. Primary education completion rate is 80% among males and 60% among females.
Similarly, the formal enrolment and completion of secondary education in Nasarawa state is 75%
for males and 60% for females. The tertiary education completion rate is 55% for males and 63%
for females (See table 4 Annex) (NPC, 2009).
3.2.1. Literacy
The literacy level among the males in all the Local Government Area ranges from24% - 37%
while that of the female’s ranges from 19% to 27%. Keffi Local Government Area is the most
literate in both sexes with 37% for male and 27% for females. This implies that about 63% and
73% of both males and females in the area are illiterates See table 7 Annex (NPC, 2009).
Life expectancy in Nasarawa is 55 for males and 53 for females in rural areas, while in urban
areas it is 56 for males and 54 for females. In rural areas, infant and child mortality is 18/1000
30 | P a g e
and 20/1000 respectively for male and female children respectively. In urban areas, infant and
child mortality is 10/1000 and 20/1000 for male and female children Seee table 8 Annex (NPC,
2009).
3.2.2. Existing Interventions/Projects Addressing VAD, Nutrition, and Poverty
There are a number of intervention projects on nutrition in Nasarawa State. There is the Special
Programme on Food Security aimed at increased agricultural and food production and poverty
reduction and the Root and Tuber expansion Programme are being implemented in Nasarawa
State. The focus of these programmes is on increase productivity in all root crops, processing and
marketing. The New Rice for Africa Initiative with focus on increase productivity of rice is
functional in Nasarawa. The Rural Institutional Building Programme with the mandate of linking
farmers to Microfinance Institutions. The Badakoshi Agricultural Scheme Programme focuses on
loans to farmers in form of cash and kind; similarly the Fadama component with focus Poverty
reduction and the Child Education and Community Development Initiatives are also key
interventions in the state. A part from Badakoshi Agric Scheme, Federal Government initiated
the rest and Nasarawa State Government adapted. All the programmes were implemented
through ADP in the State. ADP is strategically positioned for dissemination of innovations,
advocacy and implementation. This has policy implication for increase investment in OFSP
(NADP, 2009).
3.2.3. Average Major Crop Production Figure for 2010 -2011 in Nasarawa State
Sweet Potato ranks 7th among major crop production by land area planted and 4th by mean field
(tons per hectare) in Nasarawa State See table 9 Annex.
3.2.4 Extension System
There were two types of agricultural extension systems in the State - public and the private
System in Nasarawa State. The ADP in the State administers the public system. It uses training
and visits. The Young Men Christian Association, (YMCA), and the Project Agape are two
private extension systems operate in the state. These organizations use a person-to-person
31 | P a g e
approach in addition to training and visit. The ratio of extension agents to farmers in the State is
1:1388. 20% of the extension agents are females.
3.2.5. Gender Differences in Decision Making.in Percentages
Yam production enterprise is predominantly dominated by men, especially in decisions regarding
farm size, inputs to be used, technology to be applied, control of income and access to credit.
About 90% of the decisions in arable crop production in the state are determined by men. It
implies that men are a critical group in the promotion of OFSP in the state.
3.2.6. Sweet Potato for Livelihoods and Food Security
Sweet potato is one of the crops processed by the rural women for income generation. It has
tremendous potentials for providing food for human beings. It is consumed as part of the main
meal or as a snack. They are fried into chips or roasted as whole roots. Though processed
products are very attractive to customers, fresh use is the major form of utilization in Nigeria
Sweet potato is high in calorific value and can be processed into flour, fortified with wheat flour,
and fried into puff-puff, chin-chin, cake and buns, industrial alcohol, vinegar, yeast and acetone.
It therefore has a potential of playing an important role as a food security crop and provides a
variety of human food, animal feed and industrial products for empowering the low-income
women producers in the state.
3.2.7. Sweet Potato Production for Food Security Production at Household
Nasarawa land area for Sweet Potato and OFSP farming is about 1429 hectares, and the annual
production is 160680 metric tons. Productivity is 11.24 metric tons per hectare, while annual per
capita consumption is 8.26 kg. Sweet Potato is planted twice in a year at household levels. It is
planted between June/July and October/November each year. It could be planted solely or
intercropped with cereals such as maize, millet, and sorghum. Two institutions have been
particularly active in improving the production and utilization of sweet potato in Nigeria,
namely, the National Root crop Research Institute (NRCRI) in Umudike and the International
Institute of Tropical Agriculture (IITA) in Ibadan. The OFSP variety produces higher yield than
other varieties of the white fleshed potatoes See table 11 Annex.
32 | P a g e
The distribution of sweet potato processors or producers in Nasarawa State is skewed toward age
specific groups in the range of 30-39 years and people with non-formal education. The extension
training activities of the Women-In-Agriculture unit of the Agricultural Development
Programme conducts training on sweet potato processing, several uses of sweet potato nutritional
value of sweet potato and identification of sweet potato products. The Women-In-Agriculture
(WIA) unit of the Agriculture Development Project (ADP) is to improve the standard of living
standard of rural women farmers in the areas of increased crop production, introduction of
improved technology for food crops processing and marketing of farm produce.
3.2.8. Marketing and Processing
Local markets are in place for sweet potato and other products. Most villages hold the market
every five days. Surplus sweet potato is sold in the farms directly to buyers or in the market
places or along major roads. Sweet Potato is marketed in both local and urban markets as tubers
and processed products. The urban markets contained more than 2000 persons while rural
markets contained not more than 1000 persons ,Agyaragu, Assakio and obi Markets for urban
while Agarago, Alamis, sabungida Markets are for rural. The major trade routes are: Lafia –
Doma; Lafia – Nasarawa Eggon; and Agarago Routes. Some dominant markets include Bida
market in Niger State, Bukuru, Kuara rata, Gargann, Bokkos and Terminal market in Plateau
State and the Offa market in Kwara State. Traders transport sweet potato from this region to
other states including Lagos, Oyo in the southwestern region, Enugu in the southeast region and
Sokoto, Kano and Bauchi in the northern regions.
3.2.9. Opportunities for Increased Utilization
Most of the sweet potato produced in the region is consumed boiled, roasted or fried and may
also be boiled with beans or rice. Sweet potato is also used to make kunu drinks. It is a very
popular traditional staple in Nasarawa and Abuja. Sweet potato flour, which is prepared from
sundried chips, is mixed with cassava and then pounded into foofoo. There are great
opportunities for increased utilization especially as it is becoming widely accepted in the area
especially chips, kunu sweetening, and snacks for school children. In urban areas of the state, the
roots are boiled, sliced and sun dried for about one week. This product is called usinsin dankali,
33 | P a g e
which may be preserved and later boiled with rice or beans, or eaten as snacks. One major use of
sweet potato in the state is for the production of sweet potato flour called tsiro. It is prepared by
peeling the roots, slicing, sun drying and pounding using a mortar to obtain flour. The flour is
then used as sweetener for kunu or pap. Sweet potato is used for making meat pies. The leaves
and vines of sweet potato are also used in the fresh or sun-dried forms to feed sheep and goats.
3.2.10. Sweet Potato Agronomy and Breeding, Pests and Diseases
Sweet Potato is planted in plots with ridges. Weeding and fertilization is used in the husbandry.
Some farmers use pre-emergence herbicides. It was either planted solely or intercropped with
cereals such as maize and millet. The major pest was Sweet Potato weevil known as cylas
puncticolis and branneus. Sweet Potato Virus known as Mild Mottle Virus (SPMMV). Two
plantings are practised in this region. In the first planting between May and July, the crop is
rainfed. The second planting is done under irrigated or arable land conditions and in the flood
plains between August and December. Only a few farmers are able to have a second planting
because of limited arable land areas. Planting under well-organised irrigation systems takes place
in Talata Mafara in Sokoto in the northwest. Sweet potato is planted usually as a sole crop.
However, it is sometimes inter-planted with crops such as maize, soybean, sorghum and millet.
Planting materials (vines) are usually obtained from nurseries maintained by some local
governments or from previously harvested farms. Varieties are distinguished by skin or flesh
colour, leaf shape and sweetness of roots when boiled.
3.2.11. Sweet Potato Research and Multiplication System
Currently National Root Crop Research Institute (NRCRI), Umudike has on-going research in
Nasarawa State on OFSP. There are on-farm trials in Nasarawa Eggon, Keffi, Lafia, and Obi.
NRCRI has contact farmers who are working with them in OFSP. The institute is working on the
following varieties of OFSP: 4401, 99-2 which is a light -deep colour, 440199-4 (light deep
colour) and 4402393 (deep coloured OFSP). Sweet Potato is currently multiplied in the area
through vines and seed. In Nasarawa State, it is the ADP and the National Root Crops Research
Institute that were involved in the OFSP multiplication efforts. It is jointly promoted by the
Ministry of Agriculture and Natural Resources, Ministry of Health, and State Health
Management Board.
34 | P a g e
3.2.12. Potentials for OFSP
Observing the enthusiasm among farmers and other stakeholders in the state, there is great
potential for OFSP especially among the rural poor who cannot afford to consume the highly
bioavailable animal foods on a regular basis. Also being used as staple food will provide an
advantage over most vegetables in the supply of significant amounts of Vitamin A and energy
concurrently among the most vulnerable groups, especially mainly infant and mothers. OFSP has
great potential for improving nutrition, which enhances its adoption, and increase investment in
the area. It was observed that sweet potato is not gender discriminating and could be adopted by
both sexes. The value addition OFSP brings is already making waves in the Ministry of
Agriculture and Natural Resources, and even among the farmers in the state.
3.2.13. Policy Environment
The major thrust of the government on OFSP is the provision of right policy environment and the
incentives for private investment, strengthening the capacity of Women and Youths in OFSP
production, empowering women and reducing violence against women, and increased integration
of women social and economic activities.
3.2.14. Stakeholders/Funding Agencies/Donors
The major stakeholders in Nasarawa State are the federal, state and local governments,
international organisations, the producers and famers, the marketers, processors and non-
governmental organisations. Among the international organisations are UNICEF, FAO, NGOs,
and WHO. UNICEF and WHO are assisting the state government in mass literacy programme,
HIV/AIDS, Poverty alleviation programme while FAO is involved in agriculture. These
stakeholders are important in mobilization and advocacy for increased investment in OFSP.
3.2.15. Mobilization/Advocacy
The following groups have been identified as helpful in mobilization and advocacy for sweet
potato and OFSP. They include; Ministry of Agriculture & Natural Resources; Farmers
Associations; Influential Opinion Leaders; and Christian/Moslem Leaders; and Political Leaders
35 | P a g e
3.3. KWARA STATE
3.3.1 Demographic Information
Kwara State is located in the north central zone of Nigeria. The total population of the state was
about 2.36 million in 2006 out of which farmers account for about 80% (KWADP, 1996). The
state shares boundaries with Oyo, Osun, Ondo, Kogi, Ekiti, and Niger states. It shares an
international boundary with the Republic of Benin. The state presently comprises of sixteen
Local Government Areas. A humid tropical climate prevails over the state and it has two distinct
seasons; the rainy and dry seasons. The rainy season lasts between April and October and the dry
season between November and March. The rainfall ranges between 50.8mm during the driest
months to 2413.3mm in the wettest period. The mean annual rainfall is about 1500mm. The
minimum average temperature throughout the state ranges between 21.1oc and 25.0oc while,
maximum averages temperature ranges from 30oc to 35oc.
3.3.2. Arable Land Area
The state is primarily agrarian with great expanse of arable land and rich fertile soils. The state
has a total land area of about 66,900km2, which is 7.24% of the total land area of the country,
which is put at 923,770km2 (FAO, 1995). 75.9% (50,782 km2) of the land is arable, 14.1%
(9,425 km2) is forest and 10% (6,693 km2) is not available for use. Agricultural production is
largely peasant and small-scale relying heavily on the use of manual labour equipped with crude
implements, while fertilizers, mechanical implement, improved seeds and agrochemicals are also
used to some extent.
3.3.3. Type of Cropping Systems
The typical cropping systems in the state are maize-based system, yam-based system, cassava-
based system, sweet potato-based system, and rice system in areas located along river Niger, the
major river in the state. Mixed cropping, shifting cultivation and crop rotation are the
predominant methods of cropping in the state. The major crops cultivated in the state include
yam, maize, rice, cassava, groundnut, cowpeas, sorghum, melon, okra, pepper and some leafy
vegetables (KWADP, 1996). Most of the food crops cultivated are consumed by the household
and small proportion is sold to earn some cash income.
36 | P a g e
3.3.4. Sweet Potato Farming and Production in Kwara State
Offa Local Government Area is one of the major sweet-potato growing areas of Nigeria. Sweet
potato is grown mainly on smallholder farms and concentrated particularly in communities in
Offa Local Government Area (Fawole, 2000). Offa LGA has an annual rainfall of 1000mm and a
relative humidity that ranges between 65% and 80% in the dry and rainy seasons respectively.
From a list of 890 sweet potato farmers, 90 who are producers, processors and marketers were
purposively selected for data collection. Farmers’ engagement in sweet potato production is
between 1-10 years (72.2%) and above 20 years (4.4%). Pattern of land acquisition indicates that
majority (67.8%) of the farmers inherited farmland, while a few (4.4%) purchased theirs
(Fawole, 2007). This tenure system usually does not encourage increased production, as those
interested in purely commercial production may not have access to land. The high proportion of
farmers (63.3%) who grow sweet potato is encouraging. This suggests enormous capacity for
adoption of improved technologies and increased production. Typically, most of the farmers
(19.1%) adopt mixed cropping pattern. Only a few (8.9%) are into sole sweet potato production.
Sweet potato is cultivated either in intercrops with cassava, maize, sorghum, as vegetables or as
mono-crops in small farm lots and peri-urban holdings. Procurement of planting materials is
mainly vines from harvested crops (54.4%). Friends (31%) and extension agents (14.4%) are the
other sources. This procurement pattern may not be the best as it may encourage the spread of
pests and diseases thus causing depression in yield and income levels. Among the sources of
labour, family labour is predominant, (52.2%) followed by hired labour (43.3%) (Tayo, 2000).
3.3.5. Processing of Sweet Potato in Kwara State
The traditional processing technique is the preferred (83.3%) processing method. Potato flour
(72.2%) is the main processed form of sweet potato of sweet potato and is supported by the
confectionary factories and the preparation of local foods See table 12, 13, 14 and 15 Annex.
3.3.6. Marketing of sweet potato in Offa LGA, Kwara State
The main package materials for sweet potatoes are baskets (55.5%) and sacks (44.4%) are sweet
potato. About 82% and 17.8% of sweet potato produced are sold in the markets and farm gates
respectively. The annual profit margin is low, considering that the profit accruable to majority
(89.00%) of the farmers is less than 10, 000 naira after every planting season. Very few (19.9%)
37 | P a g e
of the farmers make profit between 11, 000 – 20,000 Naira. The unit price of sweet potato ranges
between 50 – 300 Naira per basket and 5, 000- 1000 Naira per sack See table 17 and 18 Annex.
3.3.7. Challenges
Some of the challenges faced by sweet potato farmers include inadequate government aid, high
labour cost, limited access to credit and poor storage, poor market outlets, lack of access to
improved technologies, and high incidence of pest and diseases (Fawole, 2007).
3.4. BENUE STATE
3.4.1. Demographic Information
Benue State is one of the states in North Central Nigeria. The state has a land area of 300,955
square kilometers. The State is located approximately between latitudes 61/2°N to 81/2°N and
longitude 71/2°E to 10°E. It is bounded by the following states: Nassarawa to the north, Taraba
to the east, Cross-River to the south east, Enugu to the south west and Kogi to the west (Figure
1). The South eastern part of the state also shares border with the Republic of Cameroon. Most of
the state is in the southern guinea savannah. The 2006 population census puts the population of
Benue State at 4,219,244. Between 70 to 80% of the population live in rural areas. Agriculture
accounts for over 75% of economic activities. The state has a total of twenty three Local
Government Areas (LGA) out of which seven are in the Northern zone. The zone lies between
latitudes 6°50` North and longitude 7°50` to 10° East. The zone covers an estimated land area of
about 10,318.2 km2 and has an estimated population of about 959,512 persons (Federal Office of
Statistics, 1996). The zone comprises seven LGAs namely: Gboko, Buruku, Tarka, Guma,
Makurdi, Gwr East and Gwer West. The zone has tropical climate with two distinct seasons
(rainy and dry seasons). The rainy season commence from April to October, while the dry season
is from November to March. Two rainfall peaks are observed with an annual average rainfall of
about 1500 mm (BNARDA, 1997). The lower peak occurs in May – June, while the higher peak
occurs in August – September. The higher peak is followed by 3 – 4 months of dry season
(December – March), which is noted by harmattan winds. According to BNARDA (1997), the
daily mean temperature during the rainy season is 28°C while in dry season the average
temperature is 35°C.
.
38 | P a g e
3.4.2. Production and Cropping System
In Benue State, approximately 212,840 ha was subjected to sweet potato production with a mean
yield of 9.80 t/ ha in 2008 (BNARDA, 2008). Recently, several improved varieties of sweet
potato have been introduced into the cropping systems of smallholder farmers in Benue State,
particularly from International Institute of Tropical Agriculture (IITA), Ibadan and the National
Root Crops Research Institute (NRCRI), Umudike. Farmers in Benue State who intercrop or mix
sweet potato with pigeon pea do so in highly variable planting patterns with resultant low
productivity.
3.4.3. Marketing Sweet Potatoes
Local markets are in place for sweet potato and other products. Most villages hold the market
every five days. Surplus sweet potato is sold in the farms directly to buyers or in the market
places or along major roads. Some dominant markets include Makurdi, Gboko, Buruku, Tarka,
Guma, Otukpo, Nsukka and Enugu, Aba and Port Harcourt in South Eastern Nigeria.
39 | P a g e
CHAPTER 4
RECOMMENDADTION AND CONCLUSION
4.1. Recommendations
1. Formal education for the youths and Mass literacy campaigns for adults are required as
necessary conditions for demand generation and supply improvements in Sweet Potato
and OFSP production and intervention.
2. OFSP campaign should target the rural poor especially the women and young people.
The high rate of illiteracy prevailing among the women in rural areas poses a major
constraint to advocacy.
3. The situation analysis suggests that there is substantial scope for increasing sweet potato
productivity, and the introduction of OFSP programme must be coupled with advocacy
increase understanding of the nutritional and economic advantages of OFSP.
4. High illiteracy in all the states suggests that simple methods should be advocated for rural
areas, especially among women.
5. There is need for improved access to farming and potato processing technology for
improved production, processing and supply of Sweet Potato and OFSP in rural and
urban areas.
6. Improved access to finance targeted at sweet potato framers and OFSP is needed to
increase arable land use and cultivation of OFSP for increased yield and marketing.
7. Government policy on tubers should include specific aspects that mobilize all partners to
support sweet potato and OFSP farming in Nigeria.
40 | P a g e
4.2. Conclusion
The sub-humid region of Nigeria, which lie south of the semi-arid and arid zones, occupies about
43 million hectares, with rainfall ranging from 1000 to 2000 mm. This region produces the
largest quantities of sweet potato. Cultivation of sweet potato in this region is largely undertaken
by farm families whose farms range from one to three hectares in size. The farms are cleared and
ridges 20-40 meters long are made mainly with the use of family labour.
In Nigeria, sweet potato (Ipomoea batatas) production, marketing and utilization have expanded
beyond the traditional areas of the central and riverine zones to the humid, sub-humid and semi-
arid regions in the last two-and-a-half decades. The national production figures reported by FAO
showed a rapid increase in production and area harvested in the 1990s, surpassing two million
tons harvested from more than 300,000 hectares annually by the end of the decade. However,
estimates of sweet potato in Nigeria vary widely among different sources, and as such these
statistics should be interpreted with caution.
FAO estimates of average sweet potato yield of 5 to 8 t/ha are similar with estimates from farm
surveys conducted by state agricultural development projects which reported yields of popular
local varieties from 7 t/ha in the southeastern zone, 3.5 t/ha in the northern zone, and 7 to 8 t/ha
north central area. Farm yields remain far below that obtained from research plots with improved
varieties, however. Estimated yields in the research stations vary from 40 to 70 t/ha for improved
varieties while multi locational trials for improved varieties registered 23.5 t/ha yield across
seasons and locations. Production cost of N32, 000/ha yields an average of 5.16 tons, or N6.2/kg.
With market prices varying from N5/kg to N15/kg throughout the year, farmers may sell at a loss
when prices are at their lowest. Market prices of sweet potato compare with maize and yam and
are much higher than cassava. Transportation accounts for the largest share of distribution cost of
sweet potato. These suggest there is substantial scope for increasing sweet potato productivity in
Nigeria. Sweet potato is traditionally consumed in boiled form with varying accompaniments
including cowpea, rice, and millet and Benniseed. In the semi-arid zone, sweet potato flour is
popularly used for sweetening local foods while in the urban markets of the humid south, sweet
potato fried chips are produced and marketed. Return on investments in sweet potato production
is currently marginal, but promises huge returns as access to technology and finance improves.
41 | P a g e
REFERENCES
Abubakar, H.N, Olayiwola, I.O., Sanni. S. A. and Idowu, M. A. (2010) Chemical composition of
sweet potato (Ipomea batatas Lam) dishes as consumed in Kwara state, Nigeria, International
Food Research Journal 17: 411-416 Abuja, Nigeria.
Agbo, F.M.O. and Ene, L.S.O. (1999) Status of sweet potato production Research in Nigeria.
Paper presented the conference on sweet potato for West and Central Africa, July – 29th Douala,
Cameroun
Agwu A. E., J. Ellah, E. Ekweagwu, and J. C. Iwuchukwu (2009) Consumption patterns and
intra-household roles in the production, processing and marketing of soya beans in the Northern
Agricultural Zone of Benue State, Nigeria, African Journal of Biotechnology Vol. 8 (4), pp. 605-
613
Akinyele, Isaac O. (2009) Ensuring Food and Nutrition Security in Rural Nigeria: An
Assessment of the Challenges, Information Needs, and Analytical Capacity, Nigeria Strategy
Support Program (NSSP), Background Paper No. NSSP 007, International Food Policy Research
Institute, IFPRI-ABUJA
Akoroda, M.O. and Nwokocha, H.N. (1996) Sweet potato in Nigeria Production problems and
prospects, Papers presented at the African Sweet potato seminar, Libreville, Gabon.
Babatunde, T.O, E.O Olorunsanya, J.S. Orebiyi, and A Falola (2007) Optimal Farm Plan in
Sweet potato Cropping Systems: Case of Offa and Oyun Local Government Areas of Kwara
State, North Central Nigeria; Journal of Agriculture 2(2): 285-289
BNARDA (1997) Annual Report Benue State Agricultural and rural Development Authority
Makurdi
BNARDA (2000) Agricultural production recommendation for Benue State, Ext. Bull. 3: 30-33.
42 | P a g e
CBN (1998) Issues in agricultural input policy: an empirical evaluation of fertilizer production,
distribution and price subsidy in Nigeria, Central bank of Nigeria, Abuja, Nigeria
Educational attainment (state and local government area) priority table volume VII,
Egbe,O.Moses (2012) Relative Performance of Three Sweet Potato Varieties in Sole and
Intercrop Systems in Southern Guinea Savanna Ecology of Nigeria Global Journal of Science
Frontier Research Agriculture & Biology Volume 12 Issue 3 Version 1.0 March
FAO (1995) Irrigation in Africa in Figures; Water Report, Macmillan Publishers, Rome, Italy
FAO (2002) Production Year Book, Rome, Italy
Fawole, O.P. (2007) Constraints to Production, Processing and Marketing of Sweet-Potato in
Selected Communities in Offa Local Government Area, Kwara State Nigeria
Federal Government of Nigeria (FGN) (2009) Nigerian Agricultural Policy, Federal Government
Federal Office of Statistics (1996) Annual Abstract of Statistics, 1996 Edition, FOS Lagos,
Nigeria
FMARD (2001) New Agricultural Policy, Federal Ministry of Agriculture and Rural
Development, Abuja, Nigeria
Ibrahim H. Y. and Onuk, E.G (2010) The Impact of Root and Tuber Expansion Programme
(RTEP) On Root and Tuber Crops Production In Nasarawa State, Nigeria PAT December 2010;
6 (2): 26-34
IFDC (2001) Agricultural input markets in Nigeria: an assessment and a strategy for
development. IFDC, USA.
Ikpi, A.E. (2000) Nigeria’s agricultural sector assessment: issues of technology development and transfer.
Prepared for USAID/AFR/SD, Washington, DC, USA
Jan Low, Regina Kapinga, Donald Cole, Cornelia Loechi, John Lynam and Maris Andrade
(2008),
Manyong, V.M; A. Ikpi, J.K. Olayemi, S.A. Yusuf, B.T. Omonona, V. Okoruwa, and F.S.
Idachaba (2005) Agriculture in Nigeria: Identifying opportunities for increased
43 | P a g e
commercialization and investment; International Institute of Tropical Agriculture (IITA), Ibadan,
Nigeria
Nasarawa Agricultural Development Programme (2003) RTEP Annual report. NADP, Lafia
Nasarawa Agricultural Development Programmes Root and Tuber Expansion Programme
Implementation Manual (2000-2001), Lafia
Nasarawa State Ministry of Information (2006): Briefs on Nasarawa State. PIM (2001) RTEP-
Project Implementation Manual Nasarawa State Agricultural Development Programme. Lafia
National Population Commission (2009) Nigeria Food Consumption and Nutrition Survey 2001–
2003, Federal government of Nigeria and ICF Macro, Abuja, Nigeria
National Population Commission (NPC) (2008). Kwara state: population distribution by Age,
sex and literacy status (state and local government area), NPC, Abuja, Nigeria.
National Population commission (NPC) (2008). Nigeria: Demographic and Health Survey. NPC,
Abuja, Nigeria.
National population commission (NPC) (2008). Population distribution by Age, Sex and
Nigerian Academic of Science (NAS) (2011), “Agriculture for Improved Nutrition of Women
and Children – Policy Considerations. Advocacy Brief No. 2
Odebode S. O., N. Egeonu, and M. O. Akoroda (2008). “Promotion of the Sweet Potato for the
Food Industry in Nigeria” Bulgarian Journal of Agricultural Science, 14 (3) 300 – 300F
Omotesho, O.A and A. Muhammed-Lawal, (2010). Optimal Food Plan for Rural Households’
Food Security in Kwara state, Nigeria: The Goal Programming Approach, Journal of
Agricultural Biotechnology and sustainable Development, Vol. 2, Abuja, Nigeria.
44 | P a g e
Tayo T.O. (2000) Opportunities for increased potato and sweet potato production in West
African African Potato Association Conference Proceedings, 5: 27-30
Tewe, O.O., F.E. Ojeniyi, and O.A. Abu (2003) Sweet Potato Production, Utilization, and
Marketing in Nigeria, International Potato Center (CIP)
Ukpabio U. J., E. N. Ekeledo, and V. U. Ezigbo (2012) “Potential Use of roots of Orange
Fleshed Sweet Potato genotypes in the production of B- Carotene rich chips in Nigeria” African
Journal of Food Science Vol. 6 (2)
UNICEF (2006), “Information Sheet Nutrition Nigeria, UNICEF
World Bank (2006) “Repositioning Nutrition as Central to Development: A Strategy for Large-
Scale Actions: Washington D. C. 246
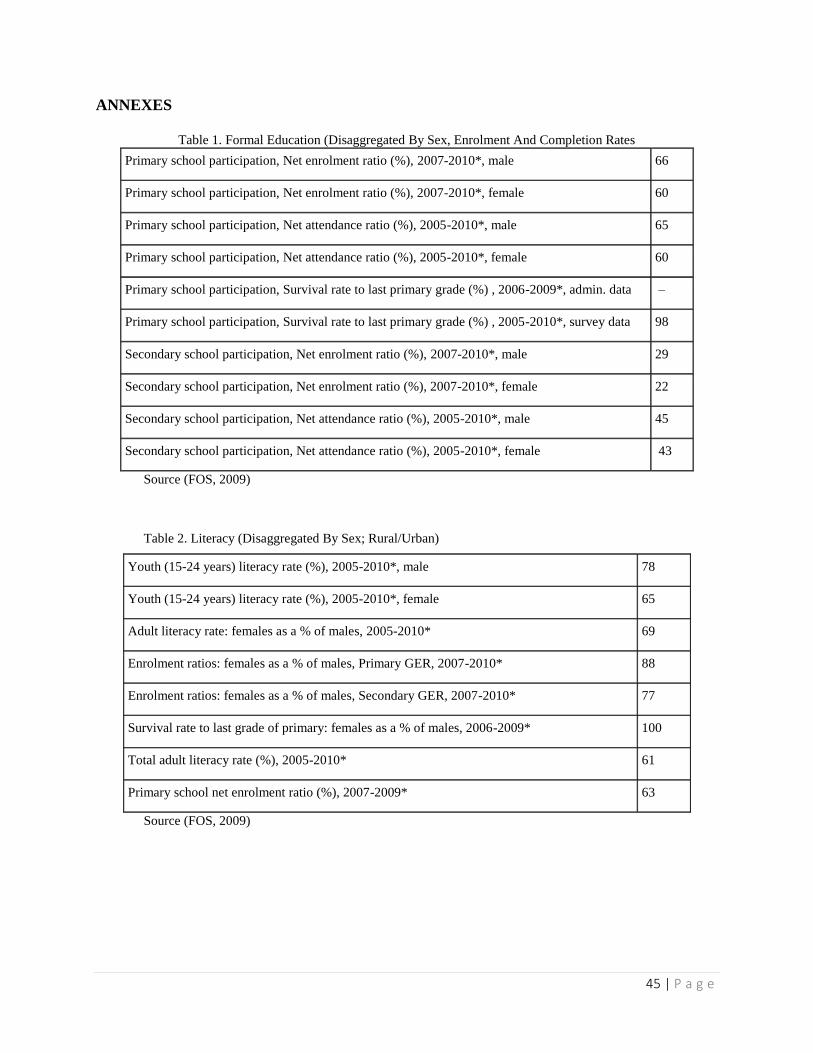
45 | P a g e
ANNEXES
Table 1. Formal Education (Disaggregated By Sex, Enrolment And Completion Rates
Primary school participation, Net enrolment ratio (%), 2007-2010*, male 66
Primary school participation, Net enrolment ratio (%), 2007-2010*, female 60
Primary school participation, Net attendance ratio (%), 2005-2010*, male 65
Primary school participation, Net attendance ratio (%), 2005-2010*, female 60
Primary school participation, Survival rate to last primary grade (%) , 2006-2009*, admin. data –
Primary school participation, Survival rate to last primary grade (%) , 2005-2010*, survey data 98
Secondary school participation, Net enrolment ratio (%), 2007-2010*, male 29
Secondary school participation, Net enrolment ratio (%), 2007-2010*, female 22
Secondary school participation, Net attendance ratio (%), 2005-2010*, male 45
Secondary school participation, Net attendance ratio (%), 2005-2010*, female 43
Source (FOS, 2009)
Table 2. Literacy (Disaggregated By Sex; Rural/Urban)
Youth (15-24 years) literacy rate (%), 2005-2010*, male 78
Youth (15-24 years) literacy rate (%), 2005-2010*, female 65
Adult literacy rate: females as a % of males, 2005-2010* 69
Enrolment ratios: females as a % of males, Primary GER, 2007-2010* 88
Enrolment ratios: females as a % of males, Secondary GER, 2007-2010* 77
Survival rate to last grade of primary: females as a % of males, 2006-2009* 100
Total adult literacy rate (%), 2005-2010* 61
Primary school net enrolment ratio (%), 2007-2009* 63
Source (FOS, 2009)
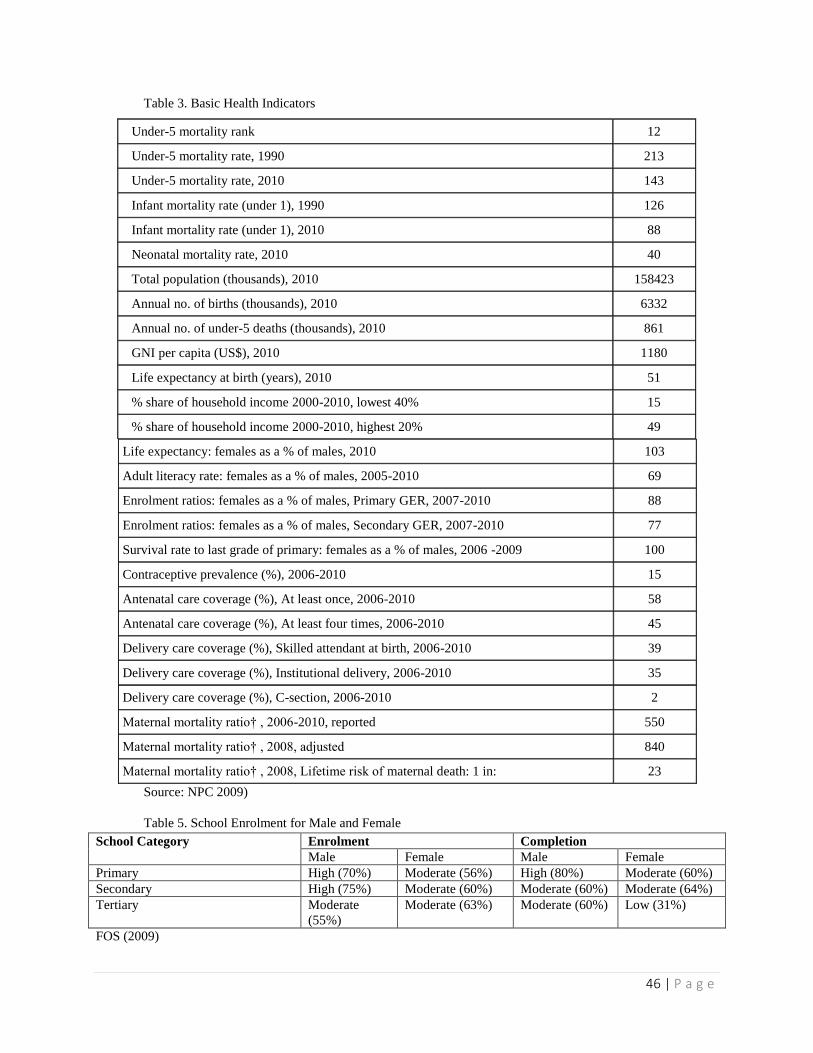
46 | P a g e
Table 3. Basic Health Indicators
Under-5 mortality rank 12
Under-5 mortality rate, 1990 213
Under-5 mortality rate, 2010 143
Infant mortality rate (under 1), 1990 126
Infant mortality rate (under 1), 2010 88
Neonatal mortality rate, 2010 40
Total population (thousands), 2010 158423
Annual no. of births (thousands), 2010 6332
Annual no. of under-5 deaths (thousands), 2010 861
GNI per capita (US$), 2010 1180
Life expectancy at birth (years), 2010 51
% share of household income 2000-2010, lowest 40% 15
% share of household income 2000-2010, highest 20% 49
Life expectancy: females as a % of males, 2010 103
Adult literacy rate: females as a % of males, 2005-2010 69
Enrolment ratios: females as a % of males, Primary GER, 2007-2010 88
Enrolment ratios: females as a % of males, Secondary GER, 2007-2010 77
Survival rate to last grade of primary: females as a % of males, 2006 -2009 100
Contraceptive prevalence (%), 2006-2010 15
Antenatal care coverage (%), At least once, 2006-2010 58
Antenatal care coverage (%), At least four times, 2006-2010 45
Delivery care coverage (%), Skilled attendant at birth, 2006-2010 39
Delivery care coverage (%), Institutional delivery, 2006-2010 35
Delivery care coverage (%), C-section, 2006-2010 2
Maternal mortality ratio† , 2006-2010, reported 550
Maternal mortality ratio† , 2008, adjusted 840
Maternal mortality ratio† , 2008, Lifetime risk of maternal death: 1 in: 23
Source: NPC 2009)
Table 5. School Enrolment for Male and Female
School Category Enrolment Completion
Male Female Male Female
Primary High (70%) Moderate (56%) High (80%) Moderate (60%)
Secondary High (75%) Moderate (60%) Moderate (60%) Moderate (64%)
Tertiary Moderate
(55%)
Moderate (63%) Moderate (60%) Low (31%)
FOS (2009)
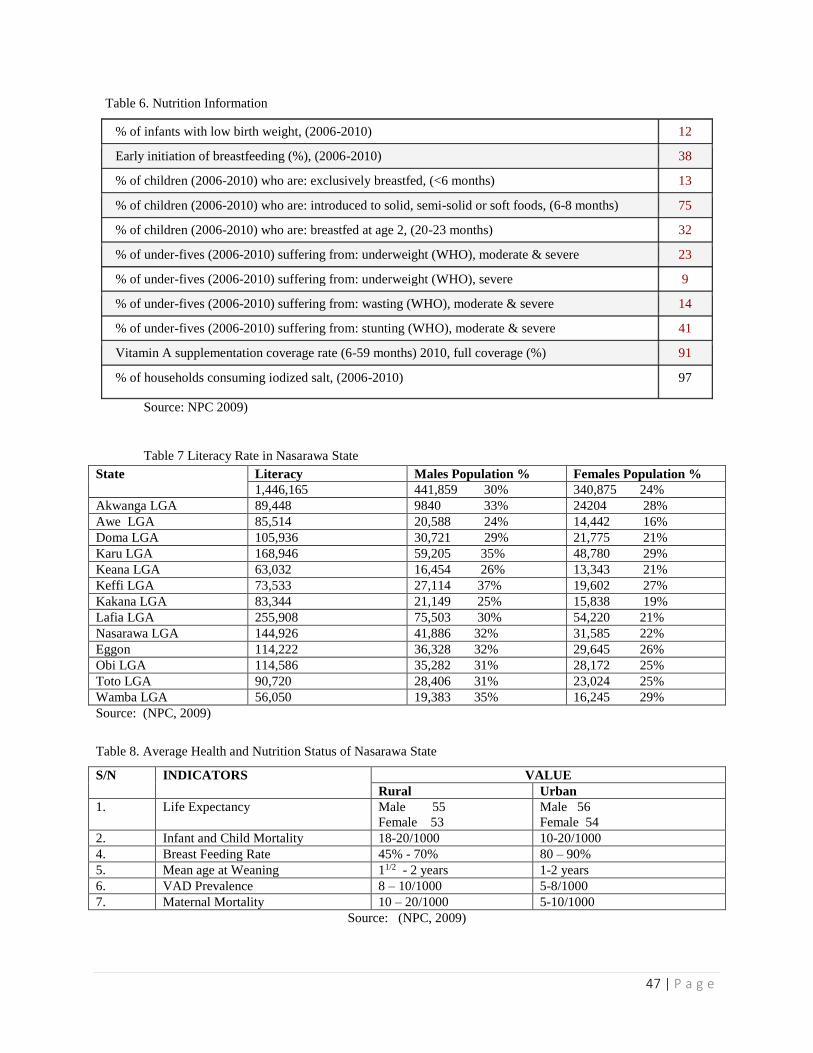
47 | P a g e
Table 6. Nutrition Information
% of infants with low birth weight, (2006-2010) 12
Early initiation of breastfeeding (%), (2006-2010) 38
% of children (2006-2010) who are: exclusively breastfed, (<6 months) 13
% of children (2006-2010) who are: introduced to solid, semi-solid or soft foods, (6-8 months) 75
% of children (2006-2010) who are: breastfed at age 2, (20-23 months) 32
% of under-fives (2006-2010) suffering from: underweight (WHO), moderate & severe 23
% of under-fives (2006-2010) suffering from: underweight (WHO), severe 9
% of under-fives (2006-2010) suffering from: wasting (WHO), moderate & severe 14
% of under-fives (2006-2010) suffering from: stunting (WHO), moderate & severe 41
Vitamin A supplementation coverage rate (6-59 months) 2010, full coverage (%) 91
% of households consuming iodized salt, (2006-2010) 97
Source: NPC 2009)
Table 7 Literacy Rate in Nasarawa State
State Literacy Males Population % Females Population %
1,446,165 441,859 30% 340,875 24%
Akwanga LGA 89,448 9840 33% 24204 28%
Awe LGA 85,514 20,588 24% 14,442 16%
Doma LGA 105,936 30,721 29% 21,775 21%
Karu LGA 168,946 59,205 35% 48,780 29%
Keana LGA 63,032 16,454 26% 13,343 21%
Keffi LGA 73,533 27,114 37% 19,602 27%
Kakana LGA 83,344 21,149 25% 15,838 19%
Lafia LGA 255,908 75,503 30% 54,220 21%
Nasarawa LGA 144,926 41,886 32% 31,585 22%
Eggon 114,222 36,328 32% 29,645 26%
Obi LGA 114,586 35,282 31% 28,172 25%
Toto LGA 90,720 28,406 31% 23,024 25%
Wamba LGA 56,050 19,383 35% 16,245 29%
Source: (NPC, 2009)
Table 8. Average Health and Nutrition Status of Nasarawa State
S/N INDICATORS VALUE
Rural Urban
1. Life Expectancy Male 55
Female 53
Male 56
Female 54
2. Infant and Child Mortality 18-20/1000 10-20/1000
4. Breast Feeding Rate 45% - 70% 80 – 90%
5. Mean age at Weaning 11/2 - 2 years 1-2 years
6. VAD Prevalence 8 – 10/1000 5-8/1000
7. Maternal Mortality 10 – 20/1000 5-10/1000
Source: (NPC, 2009)
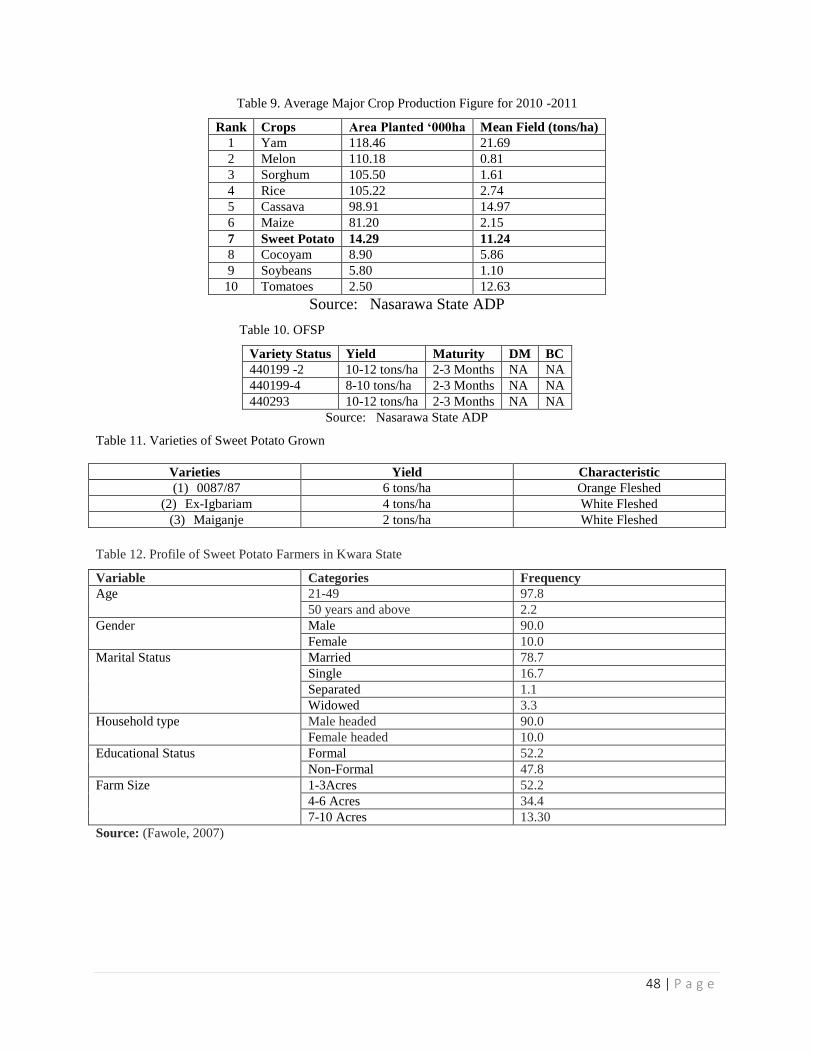
48 | P a g e
Table 9. Average Major Crop Production Figure for 2010 -2011
Rank Crops Area Planted ‘000ha Mean Field (tons/ha)
1 Yam 118.46 21.69
2 Melon 110.18 0.81
3 Sorghum 105.50 1.61
4 Rice 105.22 2.74
5 Cassava 98.91 14.97
6 Maize 81.20 2.15
7 Sweet Potato 14.29 11.24
8 Cocoyam 8.90 5.86
9 Soybeans 5.80 1.10
10 Tomatoes 2.50 12.63
Source: Nasarawa State ADP
Table 10. OFSP
Variety Status Yield Maturity DM BC
440199 -2 10-12 tons/ha 2-3 Months NA NA
440199-4 8-10 tons/ha 2-3 Months NA NA
440293 10-12 tons/ha 2-3 Months NA NA
Source: Nasarawa State ADP
Table 11. Varieties of Sweet Potato Grown
Varieties Yield Characteristic
(1) 0087/87 6 tons/ha Orange Fleshed
(2) Ex-Igbariam 4 tons/ha White Fleshed
(3) Maiganje 2 tons/ha White Fleshed
Table 12. Profile of Sweet Potato Farmers in Kwara State
Variable Categories Frequency
Age 21-49 97.8
50 years and above 2.2
Gender Male 90.0
Female 10.0
Marital Status Married 78.7
Single 16.7
Separated 1.1
Widowed 3.3
Household type Male headed 90.0
Female headed 10.0
Educational Status Formal 52.2
Non-Formal 47.8
Farm Size 1-3Acres 52.2
4-6 Acres 34.4
7-10 Acres 13.30
Source: (Fawole, 2007)
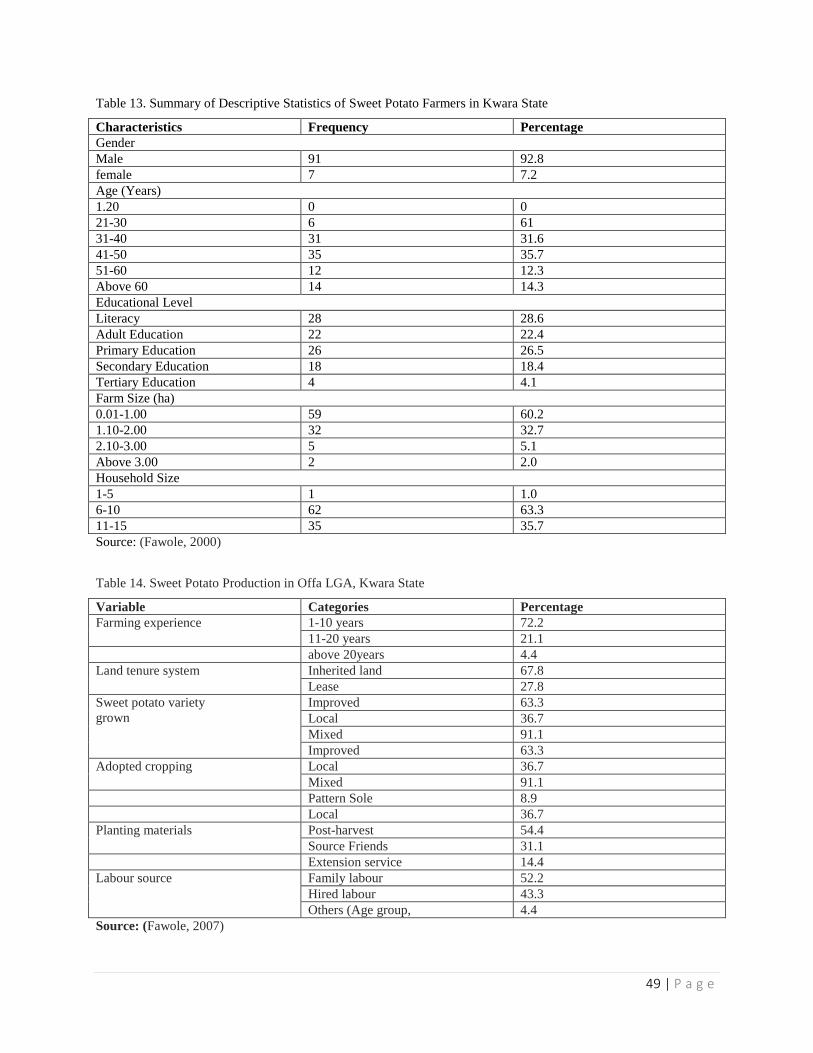
49 | P a g e
Table 13. Summary of Descriptive Statistics of Sweet Potato Farmers in Kwara State
Characteristics Frequency Percentage
Gender
Male 91 92.8
female 7 7.2
Age (Years)
1.20 0 0
21-30 6 61
31-40 31 31.6
41-50 35 35.7
51-60 12 12.3
Above 60 14 14.3
Educational Level
Literacy 28 28.6
Adult Education 22 22.4
Primary Education 26 26.5
Secondary Education 18 18.4
Tertiary Education 4 4.1
Farm Size (ha)
0.01-1.00 59 60.2
1.10-2.00 32 32.7
2.10-3.00 5 5.1
Above 3.00 2 2.0
Household Size
1-5 1 1.0
6-10 62 63.3
11-15 35 35.7
Source: (Fawole, 2000)
Table 14. Sweet Potato Production in Offa LGA, Kwara State
Variable Categories Percentage
Farming experience 1-10 years 72.2
11-20 years 21.1
above 20years 4.4
Land tenure system Inherited land 67.8
Lease 27.8
Sweet potato variety
grown
Improved 63.3
Local 36.7
Mixed 91.1
Improved 63.3
Adopted cropping Local 36.7
Mixed 91.1
Pattern Sole 8.9
Local 36.7
Planting materials Post-harvest 54.4
Source Friends 31.1
Extension service 14.4
Labour source Family labour 52.2
Hired labour 43.3
Others (Age group, 4.4
Source: (Fawole, 2007)
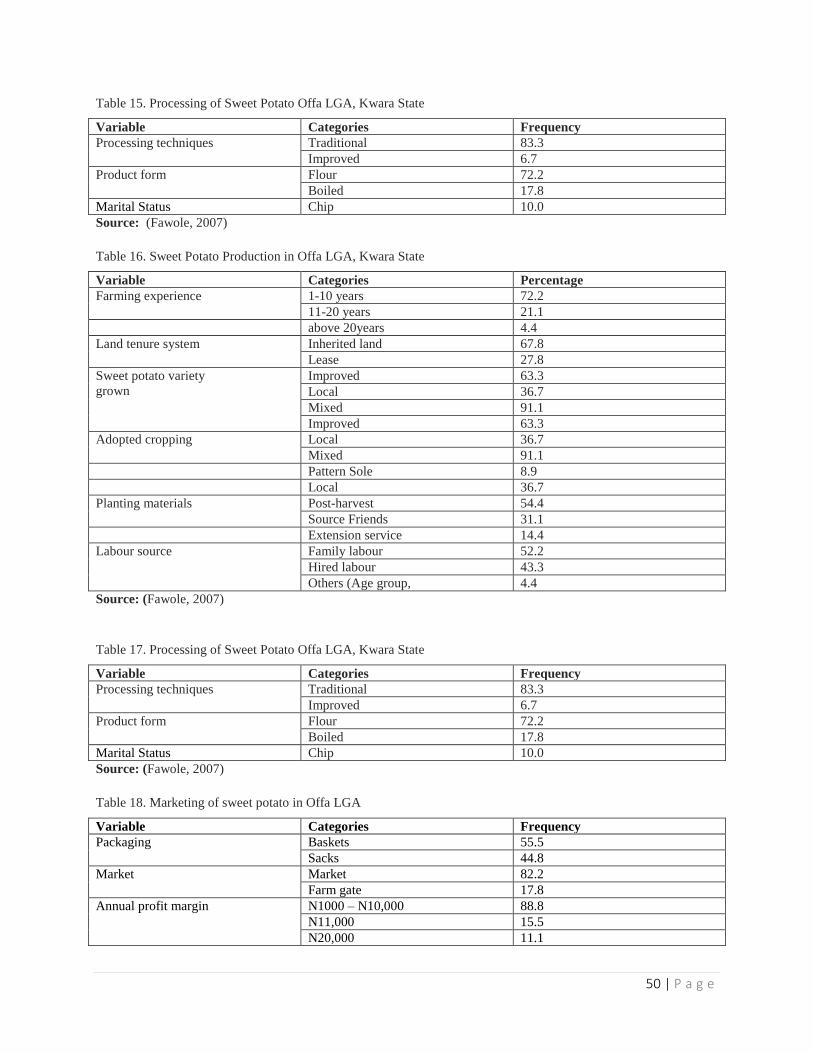
50 | P a g e
Table 15. Processing of Sweet Potato Offa LGA, Kwara State
Variable Categories Frequency
Processing techniques Traditional 83.3
Improved 6.7
Product form Flour 72.2
Boiled 17.8
Marital Status Chip 10.0
Source: (Fawole, 2007)
Table 16. Sweet Potato Production in Offa LGA, Kwara State
Variable Categories Percentage
Farming experience 1-10 years 72.2
11-20 years 21.1
above 20years 4.4
Land tenure system Inherited land 67.8
Lease 27.8
Sweet potato variety
grown
Improved 63.3
Local 36.7
Mixed 91.1
Improved 63.3
Adopted cropping Local 36.7
Mixed 91.1
Pattern Sole 8.9
Local 36.7
Planting materials Post-harvest 54.4
Source Friends 31.1
Extension service 14.4
Labour source Family labour 52.2
Hired labour 43.3
Others (Age group, 4.4
Source: (Fawole, 2007)
Table 17. Processing of Sweet Potato Offa LGA, Kwara State
Variable Categories Frequency
Processing techniques Traditional 83.3
Improved 6.7
Product form Flour 72.2
Boiled 17.8
Marital Status Chip 10.0
Source: (Fawole, 2007)
Table 18. Marketing of sweet potato in Offa LGA
Variable Categories Frequency
Packaging Baskets 55.5
Sacks 44.8
Market Market 82.2
Farm gate 17.8
Annual profit margin N1000 – N10,000 88.8
N11,000 15.5
N20,000 11.1
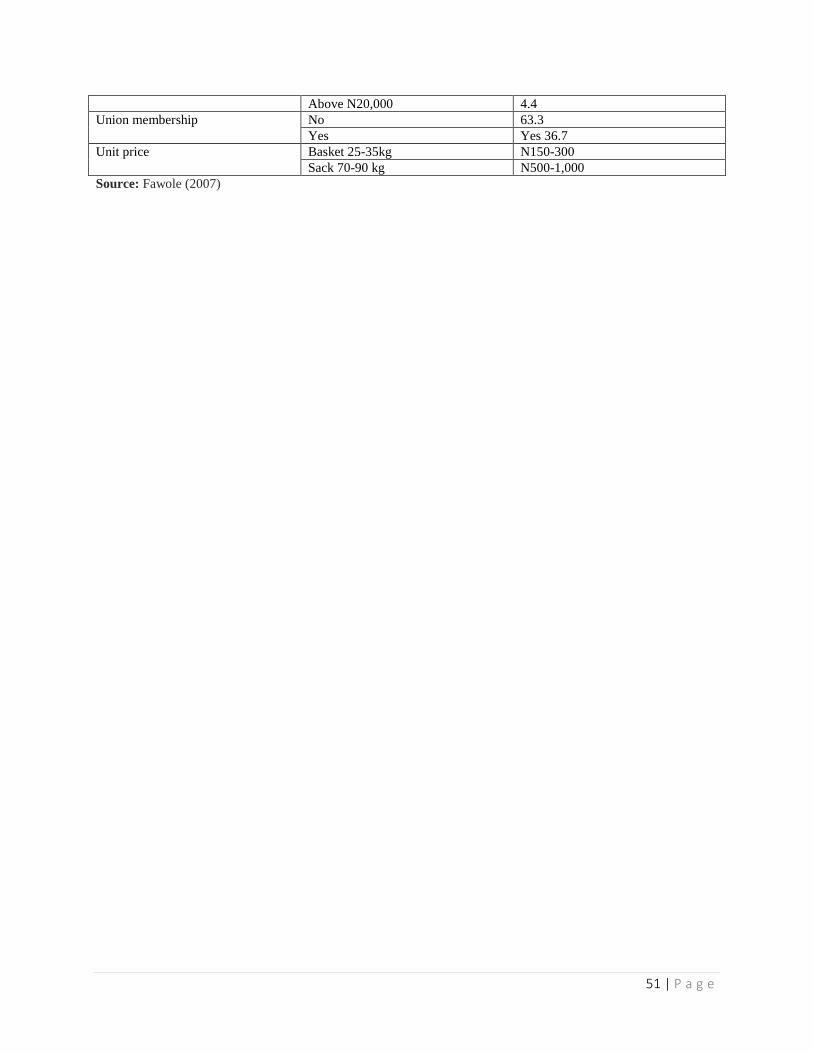
51 | P a g e
Above N20,000 4.4
Union membership No 63.3
Yes Yes 36.7
Unit price Basket 25-35kg N150-300
Sack 70-90 kg N500-1,000
Source: Fawole (2007)


![Counterparts (1)[1] eliana niebles tatiana ramos](https://img.pdfslide.net/doc/110x75/558d53eed8b42a87338b4663/counterparts-11-eliana-niebles-tatiana-ramos.jpg)