Embed Size (px)
DESCRIPTION
six sigma BB2
Citation preview

1These materials contain information that is proprietary and confidential to Bank of America. These materials shall not be duplicated. 2005 Bank of America. All rights reserved.
January 3 2005 ver.4.4 - Action Legal Copy Service.
Central Limit Theorem and
Confidence Intervals

2These materials contain information that is proprietary and confidential to Bank of America. These materials shall not be duplicated. 2005 Bank of America. All rights reserved.
January 3 2005 ver.4.4 - Action Legal Copy Service.
Objectives
• Understand the Central Limit Theorem and why it is important to other statistical tools.
• Understand and calculate confidence intervals.

3These materials contain information that is proprietary and confidential to Bank of America. These materials shall not be duplicated. 2005 Bank of America. All rights reserved.
January 3 2005 ver.4.4 - Action Legal Copy Service.
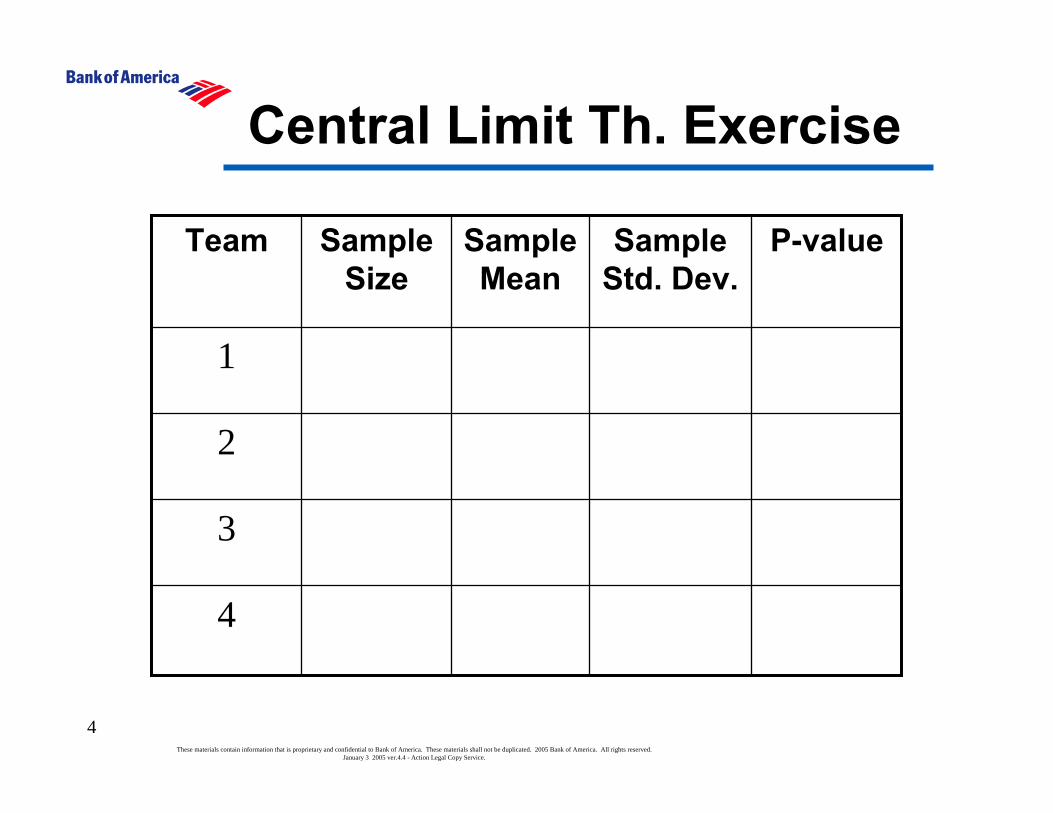
Central Limit Th. Exercise
• Divide into four teams.• Each team will be given a process that
delivers an output.• Run the process and measure the output to
get 30 data points.• Calculate the statistics of the process output:
– Mean– Standard Deviation– P-value for Anderson-Darling Normality Test– Show histogram
4These materials contain information that is proprietary and confidential to Bank of America. These materials shall not be duplicated. 2005 Bank of America. All rights reserved.
January 3 2005 ver.4.4 - Action Legal Copy Service.
Central Limit Th. Exercise
Sample Std. Dev.
4
3
2
1
P-valueSample Mean
Sample Size
Team
5These materials contain information that is proprietary and confidential to Bank of America. These materials shall not be duplicated. 2005 Bank of America. All rights reserved.
January 3 2005 ver.4.4 - Action Legal Copy Service.
Central Limit Theorem• Given a population with a mean of µ and a variance of
σ2, if we sample that population repeatedly using a sample size of n, and further plot a distribution of the means of those samples, then the following will be true:– The mean of the sampling distribution will be µ.– The variance of the sampling distribution will be
σ2 / n.– The shape of the sampling distribution will
approach a normal distribution as n gets larger regardless of the shape of the original population.

6These materials contain information that is proprietary and confidential to Bank of America. These materials shall not be duplicated. 2005 Bank of America. All rights reserved.
January 3 2005 ver.4.4 - Action Legal Copy Service.
Central Limit Theorem
Reference: The Black Belt Memory Jogger, p. 139ff.Dice animation: http//www.stat.sc.edu/~west/javahtml/CLT.htmlSimulation with various distributions: http//www.statisticalengineering.com/central_limit_theorem.htm
n = 6
n = sample size used to calculate the x-bars that are plotted in the histograms.
Population Distribution
x
Population Distribution
x
n = 2 n = 25n = 6
n = 25
x
n = 2
Distributions of x
Distributions of x
x x
x x x

7These materials contain information that is proprietary and confidential to Bank of America. These materials shall not be duplicated. 2005 Bank of America. All rights reserved.
January 3 2005 ver.4.4 - Action Legal Copy Service.
Central Limit Theorem• How can we use the Theorem to our advantage?
– A sample average is an estimate of the population mean.– If we wanted to estimate the population mean of a set of
dice that were numbered something different from 1-6 (but numbered consecutively), and we could only take one sample, what sample size would you choose: 1, 2, 5, or 10? Why?
– Could we estimate the maximum expected difference between the the sample average and the population mean?
– To the 95% confidence level, how far off might the true mean be from the sample mean based on your dice exercise?

8These materials contain information that is proprietary and confidential to Bank of America. These materials shall not be duplicated. 2005 Bank of America. All rights reserved.
January 3 2005 ver.4.4 - Action Legal Copy Service.
Confidence Interval
sample 2sample 3sample 1
population(the truth)
true mean
sample 4
9These materials contain information that is proprietary and confidential to Bank of America. These materials shall not be duplicated. 2005 Bank of America. All rights reserved.
January 3 2005 ver.4.4 - Action Legal Copy Service.
Confidence Intervals

10These materials contain information that is proprietary and confidential to Bank of America. These materials shall not be duplicated. 2005 Bank of America. All rights reserved.
January 3 2005 ver.4.4 - Action Legal Copy Service.
• Statistics such as the sample mean and standard deviation are only estimates of the population Mu (µ) and Sigma (σ) and are based upon a limited amount of data.
• Because there is variability in these estimates from sample to sample, we can quantify our uncertainty using statistically grounded confidence intervals based on the Central Limit Theorem. Confidence intervals provide a range of plausible values for the population parameters (µ and σ).
Confidence Intervals

11These materials contain information that is proprietary and confidential to Bank of America. These materials shall not be duplicated. 2005 Bank of America. All rights reserved.
January 3 2005 ver.4.4 - Action Legal Copy Service.
• Most of the time, we calculate 95% confidence intervals (CIs) for a parameter (occasionally 90% or 99%).
• The CI is interpreted as:– We are 95% certain that our calculated interval surrounds
the true population parameter (e.g., µ or σ).– In technical terms it would be more correct to say, the
method we use for calculating the interval will yield correct results 95% of the time.
Confidence Intervals

12These materials contain information that is proprietary and confidential to Bank of America. These materials shall not be duplicated. 2005 Bank of America. All rights reserved.
January 3 2005 ver.4.4 - Action Legal Copy Service.
What is a Confidence Interval?
Estimate ± margin of error
Sample statistic ± [ ___ X ___ ]
Confidence
factor
Measure of
variability
e.g.,
x, s, ...
Usually, confidence intervals have a ‘±’ uncertainty:
In some cases the uncertainty is not symmetrical and the ‘+’ term is different from the ‘-’ term; e.g., for σ.
13These materials contain information that is proprietary and confidential to Bank of America. These materials shall not be duplicated. 2005 Bank of America. All rights reserved.
January 3 2005 ver.4.4 - Action Legal Copy Service.
CI Exercise 1• To see the variability in sample estimates, let’s define a
process that has a normal distribution with:– known (true) mean value = 70– known (true) standard deviation = 5
• Each member in the class will generate 20 observations from this process, with mean = 70 and standard deviation = 5 (In Minitab, use Calc>Random Data>Normal).
• Use the graphical descriptive statistics procedure in Minitab to calculate the 95% confidence interval for the mean and sigma based on your sample of 20 data points. Do they cover the true mean 70 and the true sigma 5?
• Based on a class size of 30, we would expect 1 or 2 CI’s NOT to contain 70 for the mean, and also 1 or 2 that do NOT contain 5 for sigma.

14These materials contain information that is proprietary and confidential to Bank of America. These materials shall not be duplicated. 2005 Bank of America. All rights reserved.
January 3 2005 ver.4.4 - Action Legal Copy Service.
Luck of the DrawWe want to be certain that our confidence interval contains the population parameters. But certainty only comes with measuring the entire population. Therefore, for the vast majority of cases, we have to live with being 95% certain that our samplehas captured the population parameters inside the confidence intervals. We say that we are 95% confident.
In reality we will never know whether our sample was one of the lucky 95% that actually contained the true parameter, or one of the unlucky 5% that did not.
µ, σX, s

15These materials contain information that is proprietary and confidential to Bank of America. These materials shall not be duplicated. 2005 Bank of America. All rights reserved.
January 3 2005 ver.4.4 - Action Legal Copy Service.
CIs from Minitab• When Minitab has raw data, it is simple to
calculate the confidence intervals.• Mean, Standard Deviation
– Stat>Basic Statistics>Display Descriptive Statistics (with Graphical Summary)
• Proportion– Stat>Basic Statistics>1 Proportion
16These materials contain information that is proprietary and confidential to Bank of America. These materials shall not be duplicated. 2005 Bank of America. All rights reserved.
January 3 2005 ver.4.4 - Action Legal Copy Service.
CI Exercise 2
1. Find CI for Mean and Standard Deviation for data in: CI_Exercise_2.MTW– Note also that Minitab calculates the CI
for the Median.– Repeat at the 90% confidence level.
2. Calculate the 95% CI for the proportion of defects from a process based on a sample of 431 items where 48 were found to be defective.

17These materials contain information that is proprietary and confidential to Bank of America. These materials shall not be duplicated. 2005 Bank of America. All rights reserved.
January 3 2005 ver.4.4 - Action Legal Copy Service.
CIs without Raw Data• Without raw data, Minitab cannot calculate CIs.• For continuous data given the mean, standard
deviation, sample size and confidence level, the formulas are pretty straight forward.
• A formula also exists for CIs for proportions using the summarized count data for defects and sample size.
• Reference:– Quality Engineering Statistics by Robert A.
Dovich.– The Black Belt Memory Jogger, p. 143ff.
18These materials contain information that is proprietary and confidential to Bank of America. These materials shall not be duplicated. 2005 Bank of America. All rights reserved.
January 3 2005 ver.4.4 - Action Legal Copy Service.
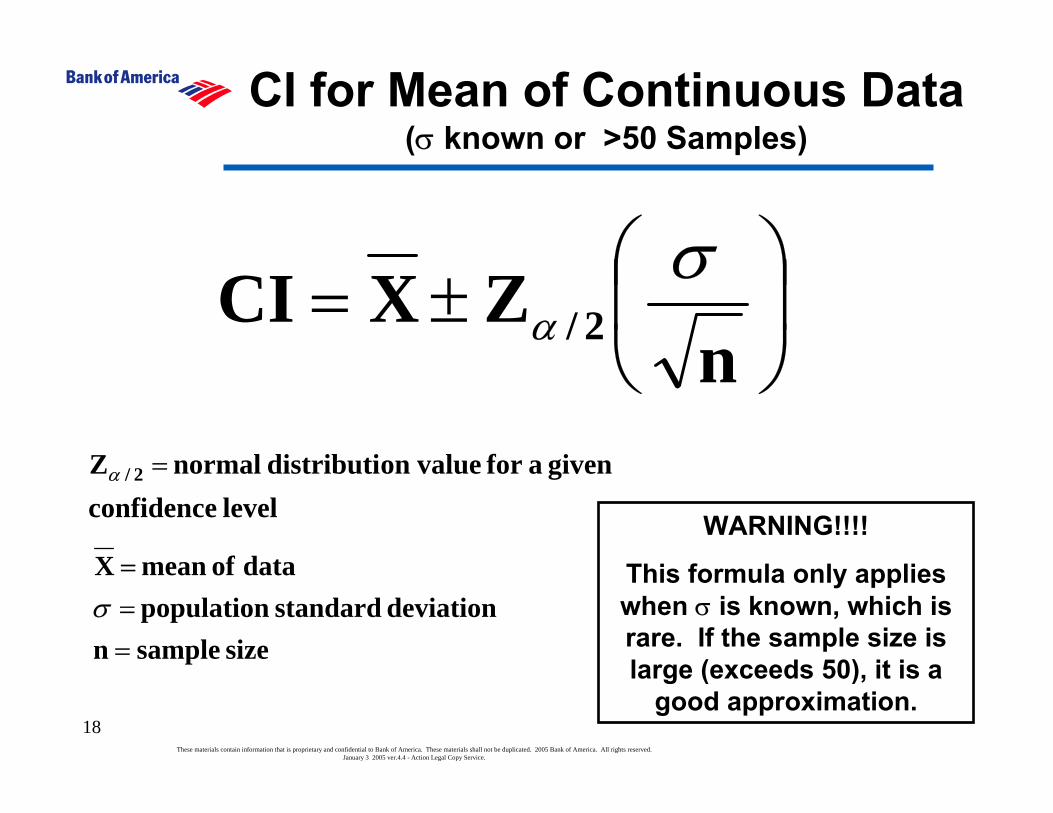
CI for Mean of Continuous Data(σ known or >50 Samples)
⎟⎠
⎞⎜⎝
⎛±=n
ZXCI 2/σ
α
size samplendeviation standard population
data of mean X
===
σ
level confidencegiven afor value ondistributi normal Z 2/ =α
WARNING!!!!
This formula only applies when σ is known, which is rare. If the sample size is large (exceeds 50), it is a
good approximation.

19These materials contain information that is proprietary and confidential to Bank of America. These materials shall not be duplicated. 2005 Bank of America. All rights reserved.
January 3 2005 ver.4.4 - Action Legal Copy Service.
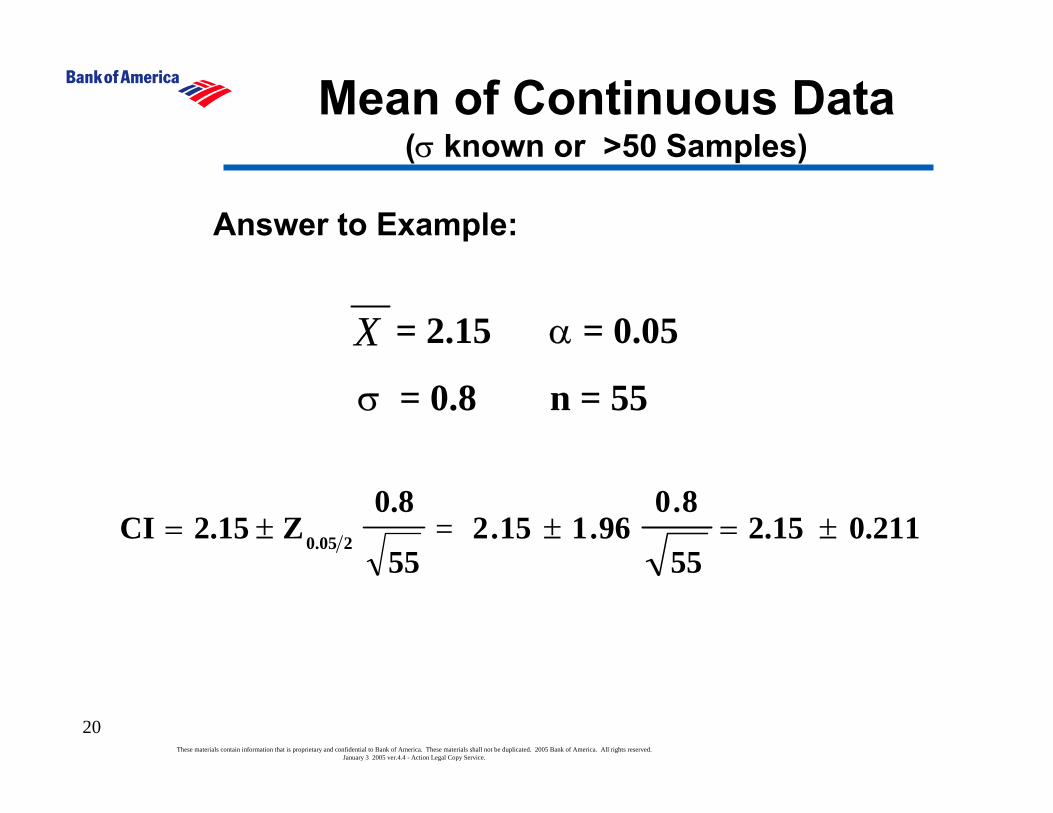
Example
• Mean = 2.15• Standard Deviation = 0.8• Sample Size = 55• α = 0.05
• What is the confidence interval of the mean for this situation?
20These materials contain information that is proprietary and confidential to Bank of America. These materials shall not be duplicated. 2005 Bank of America. All rights reserved.
January 3 2005 ver.4.4 - Action Legal Copy Service.
= 2.15 α = 0.05
σ = 0.8 n = 55
X
55
8.0Z15.2CI 205.0±= 0.2112.15
55
8.096.115.2 ±=±=
Mean of Continuous Data(σ known or >50 Samples)
Answer to Example:

21These materials contain information that is proprietary and confidential to Bank of America. These materials shall not be duplicated. 2005 Bank of America. All rights reserved.
January 3 2005 ver.4.4 - Action Legal Copy Service.
nstXCI 1n,2 −±= α
This formula has no restrictions on sample size. It is based on the Student’s t Distribution.
= mean
s = standard deviation
n = sample size
υ = degrees of freedom, used in some tables and calculated as n-1 for this test.
tα/2,n-1 = value from t distribution
X
CI for Mean of Continuous Data
This t value comes from the t table using the column for the alpha risk divided by 2 (risk divided between each tail) and the row for the degrees of freedom, n-1.

22These materials contain information that is proprietary and confidential to Bank of America. These materials shall not be duplicated. 2005 Bank of America. All rights reserved.
January 3 2005 ver.4.4 - Action Legal Copy Service.
What is this t-distribution?• The t-distributions comprise a family of distributions with one extra
parameter (“degrees of freedom” where df = sample size -1).• They are similar in shape to the normal distribution (symmetric and
bell-shaped), although wider, and flatter in the tails.• Used for estimating population parameters when the sample size is
small (<50).• The smaller the sample size, the flatter the distribution tails.
3210-1-2-3
0 .4
0 .3
0 .2
0 .1
0 .0
t
frequ
ency
2 .78
0 .025A rea =
t-distributionwith 4 d.f.(n=5)
For smaller sample sizes, the uncertainty (as a multiple of s), is larger because:
(a) the 1/sqrt(n) factor is larger
(b) the t critical point is larger
23These materials contain information that is proprietary and confidential to Bank of America. These materials shall not be duplicated. 2005 Bank of America. All rights reserved.
January 3 2005 ver.4.4 - Action Legal Copy Service.
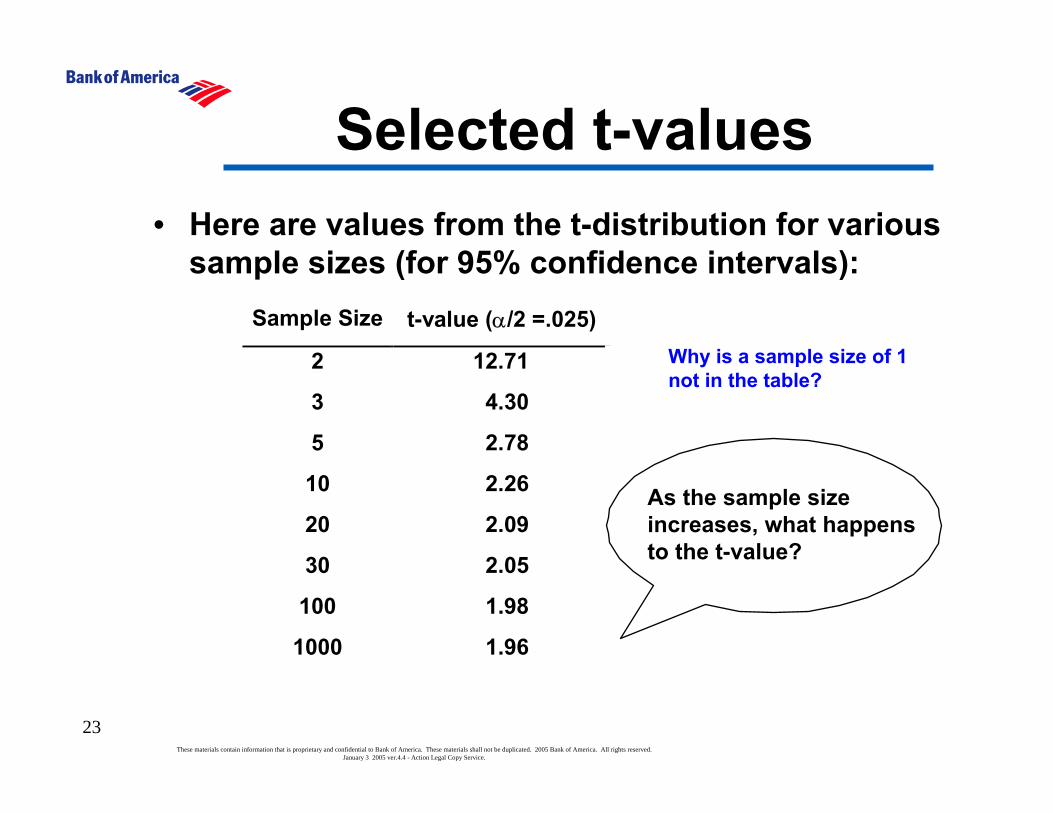
Selected t-values• Here are values from the t-distribution for various
sample sizes (for 95% confidence intervals):Sample Size t-value (α/2 =.025)
2 12.71
3 4.30
5 2.78
10 2.26
20 2.09
30 2.05
100 1.98
1000 1.96
As the sample size increases, what happensto the t-value?
Why is a sample size of 1 not in the table?

24These materials contain information that is proprietary and confidential to Bank of America. These materials shall not be duplicated. 2005 Bank of America. All rights reserved.
January 3 2005 ver.4.4 - Action Legal Copy Service.
Mean of Continuous Data
= 2.15 α = 0.05
s = 0.8 n = 25
X
258.0t15.2CI 24,205.0±= 0.3302.15 ±=±
258.0064.215.2=
Same example as before, but what if only 25 samples instead of 55:

25These materials contain information that is proprietary and confidential to Bank of America. These materials shall not be duplicated. 2005 Bank of America. All rights reserved.
January 3 2005 ver.4.4 - Action Legal Copy Service.
Now You Try!• Mean = 15.82• Standard Deviation = 6.54• Sample Size = 30• α = 0.01
• What is the confidence interval of the mean for this situation?

26These materials contain information that is proprietary and confidential to Bank of America. These materials shall not be duplicated. 2005 Bank of America. All rights reserved.
January 3 2005 ver.4.4 - Action Legal Copy Service.
Variance of Continuous Data
The variance CI is based on the χ2 Distribution. Since it is based on this distribution, the CI will not be symmetrical!
( )( ) ( )
( )( ) ( )2
1,2/1
22
21,2/
2 11
−−−
−≤≤
−
nn
snsn
αα χσ
χ
Where…
n = sample size
s2 = variance
α = risk
( ) ( )2
1,2/ −nαχ = χ2 lookup value
( ) ( )2
1,2/1 −− nαχ = χ2 lookup valueSimilar to the t table, the alpha term indicates which column ofthe table to use and the degrees of freedom term which row.
27These materials contain information that is proprietary and confidential to Bank of America. These materials shall not be duplicated. 2005 Bank of America. All rights reserved.
January 3 2005 ver.4.4 - Action Legal Copy Service.
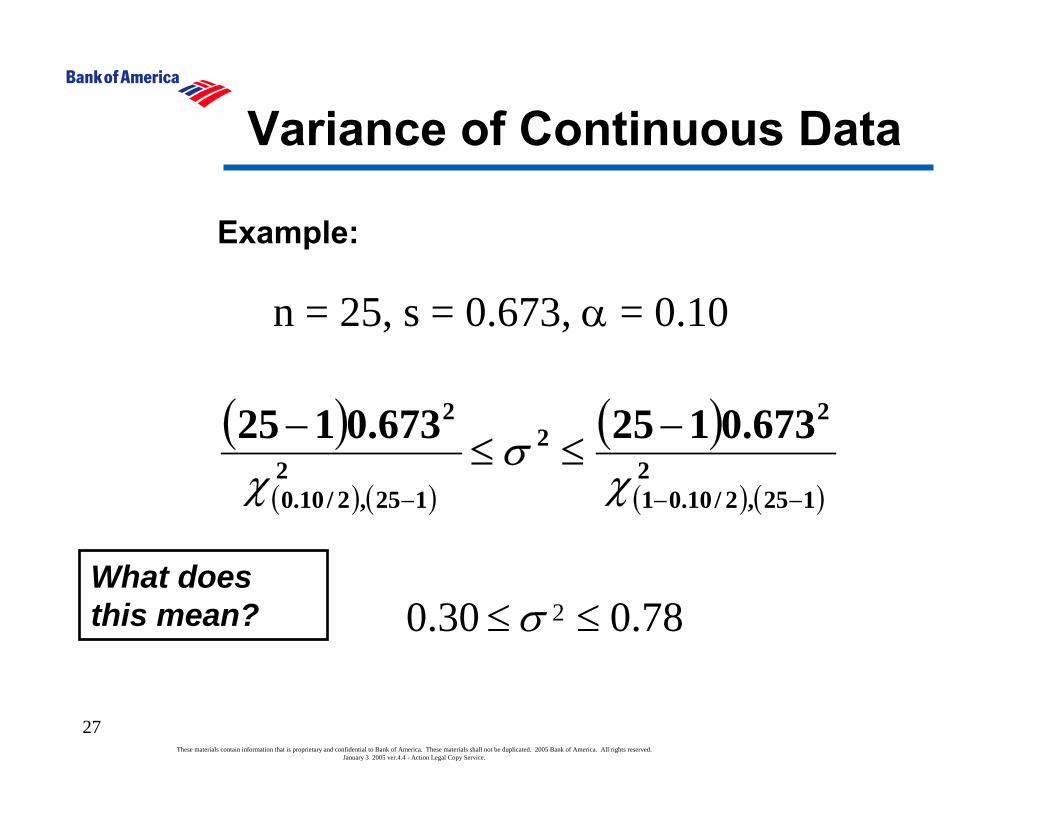
Variance of Continuous Data
( )( ) ( )
( )( ) ( )2
125,2/10.01
22
2125,2/10.0
2 673.0125673.0125
−−−
−≤≤
−χ
σχ
n = 25, s = 0.673, α = 0.10
78.030.0 2 ≤≤ σWhat does this mean?
Example:

28These materials contain information that is proprietary and confidential to Bank of America. These materials shall not be duplicated. 2005 Bank of America. All rights reserved.
January 3 2005 ver.4.4 - Action Legal Copy Service.
ProportionsThe proportion CI is based on the fact that the Z Distribution is a fairly good approximation of the binomial distribution at reasonable sample sizes. This formula only applies to sample sizes of 30 or more. Minitab does an exact calculation and is a better tool.
( )n
ppZp −±
12α
Where…
p = average proportionseen in the sample
n = sample size
α = risk

29These materials contain information that is proprietary and confidential to Bank of America. These materials shall not be duplicated. 2005 Bank of America. All rights reserved.
January 3 2005 ver.4.4 - Action Legal Copy Service.
Proportions Examplen = 700, # defectives = 16, α = 0.10
What does this mean?
( )700
023.01023.0023.0 210.0−
± Z
( )700
023.01023.0645.1023.0 −±
0094.0023.0 ±
30These materials contain information that is proprietary and confidential to Bank of America. These materials shall not be duplicated. 2005 Bank of America. All rights reserved.
January 3 2005 ver.4.4 - Action Legal Copy Service.
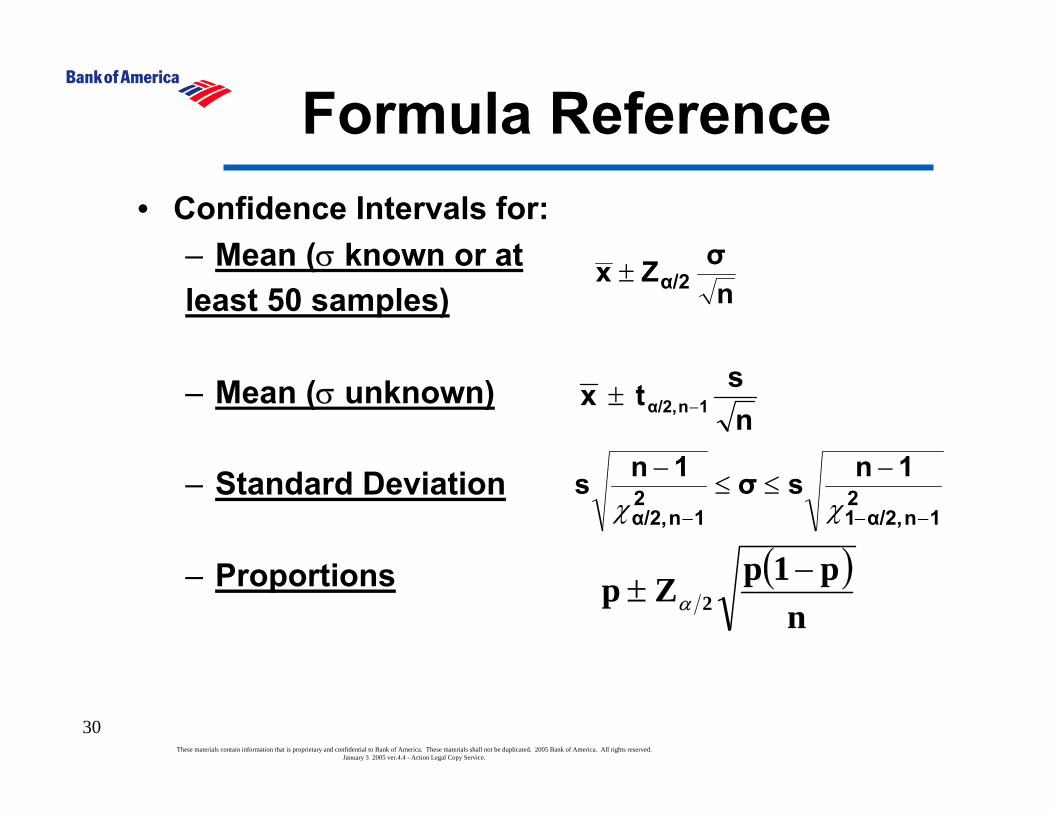
Formula Reference• Confidence Intervals for:
– Mean (σ known or atleast 50 samples)
– Mean (σ unknown)
– Standard Deviation
– Proportions
nσZx α/2±
nstx 1nα/2, −±
21nα/2,1
21nα/2,
1nsσ1ns−−−
−≤≤
−χχ
( )n
p1pZp 2−
± α

31These materials contain information that is proprietary and confidential to Bank of America. These materials shall not be duplicated. 2005 Bank of America. All rights reserved.
January 3 2005 ver.4.4 - Action Legal Copy Service.
Summary of Confidence Intervals
• Confidence Intervals provide realistic bounds for parameter estimates, i.e., an interval of “plausible values”.
• If we have raw data, Minitab will calculate CI for us.• If we don’t have the raw data, using the mean, standard
deviation, sample size, and confidence level we can still calculate confidence intervals for parameters such as the mean and standard deviation of the population. We can also use the sample size and number defective to calculate the CI for proportions.
• The factors that affect the width of a CI are:– Variation– Sample Size– Risk

32These materials contain information that is proprietary and confidential to Bank of America. These materials shall not be duplicated. 2005 Bank of America. All rights reserved.
January 3 2005 ver.4.4 - Action Legal Copy Service.
CI Exercise 3• In the top 25 markets, the Government reports the $
value of mortgages funded each month. This value is fairly inaccurate the first time it is reported, but the numbers are revised monthly as the figures firm up.
• We need to calculate our market share in these markets, but since the Government’s numbers keep changing, we are not sure when it is safe to do it.
• The numbers keep changing, so who really knows the truth? We have made a decision that surely by five months after the fact, the numbers are good. But do we have to wait a full five months to calculate our market share?
33These materials contain information that is proprietary and confidential to Bank of America. These materials shall not be duplicated. 2005 Bank of America. All rights reserved.
January 3 2005 ver.4.4 - Action Legal Copy Service.
CI Exercise 3• Using confidence intervals, determine in which month
we can first have 95% confidence that on average 90% of the final mortgage values have been reported.
• The data we are using are for the month of February 2003 and are found in: CI_Exercise_3.MTW.
• All of the data are for the month of Feb-03. The columns represent the Feb-03 $s as updated and reported in the month indicated by the column label.

34These materials contain information that is proprietary and confidential to Bank of America. These materials shall not be duplicated. 2005 Bank of America. All rights reserved.
January 3 2005 ver.4.4 - Action Legal Copy Service.
CI Exercise 3• Since we have decided that the fifth month (Jul-03) is
as accurate as Feb-03 will ever get, we have divided the reported amount for each month by the July amount to get the proportion that was reported in that month. Therefore July is 1.000.
• As an example, in Atlanta only 27.6% of the final value was reported in March. 81.8% of the final value was reported in April, 92.8% in May, and 99.6% in June.
• Using the data and confidence intervals, determine how many months we would have to wait to be 95% confident that in worst case a minimum of 90% of the final value (based on July) has been reported.

35These materials contain information that is proprietary and confidential to Bank of America. These materials shall not be duplicated. 2005 Bank of America. All rights reserved.
January 3 2005 ver.4.4 - Action Legal Copy Service.
Black Belt Key Learnings
Does this tool have an application to my current project? __________________________________________________________________________
__________________________________________________________________________
This tool can help me answer the following questions:__________________________________________________________________________
__________________________________________________________________________
What are the key learnings about this tool and/or subject? __________________________________________________________________________
__________________________________________________________________________
How comfortable will I be in training my team on this tool?__________________________________________________________________________
__________________________________________________________________________