Embed Size (px)
DESCRIPTION
Mathematics Grade 11 Open Textbook
Citation preview


EVERYTHING MATHS
GRADE 11 MATHEMATICSVERSION 1 CAPS
WRITTEN BY VOLUNTEERS

COPYRIGHT NOTICE
You are allowed and encouraged to copy any of the Everything Maths and Everything Science textbooks. You can legally photocopy any page or even the entire book. You can download it from www.everythingmaths.co.za and www.everythingscience.co.za, read it on your phone, tablet, iPad, or computer. You can burn it to CD, put on your flash drive, e-mail it around or upload it to your website.
The only restriction is that you have to keep this book, its cover, title, contents and short-codes unchanged.
This book was derived from the original Free High School Science Texts written by volunteer academics, educators and industry professionals. Everything Maths and Everything Science are trademarks of Siyavula Education.
For more information about the Creative Commons Attribution-NoDerivs 3.0 Unported (CC BY-ND 3.0) license see http://creativecommons.org/licenses/by-nd/3.0/
Your freedom to legally copy this book

AUTHORS AND CONTRIBUTORS
Siyavula Education is a social enterprise launched in 2012 with capital and support from the PSG Group Limited and the Shuttleworth Foundation. The Everything Maths and Science
series is one of the titles developed and openly released by Siyavula. For more information about the writing and distribution of these or other openly licensed titles:
www.siyavula.com [email protected]
021 469 4771
Siyavula AuthorsAlison Jenkin; Marina van Zyl; Dr. Carl Scheffler
Siyavula and DBE teamNeels van der Westhuizen; Leonard Gumani Mudau; Ewald Zietsman; Bridget Nash; Pertunia Mpho Letwaba; Josephine Mamaroke Phatlane; William Buthane Chauke;
Nicola du Toit; Heather Williams
Siyavula and Free High School Science Text contributorsDr. Mark Horner; Dr. Samuel Halliday; Dr. Sarah Blyth; Dr. Rory Adams; Dr. Spencer Wheaton
Iesrafeel Abbas; Sarah Abel; Dr. Rory Adams; Andrea Africa; Wiehan Agenbag; Matthew Amundsen; Ben Anhalt; Prashant
Arora; Amos Baloyi; Bongani Baloyi; Raymond Barbour; Caro-Joy Barendse; Richard Baxter; Tara Beckerling; Tim van Beek;
Mariaan Bester; Jennifer de Beyer; Dr. Sarah Blyth; Sebastian Bodenstein; Martin Bongers; Thinus Booysen; Gareth Boxall;
Stephan Brandt; Hannes Breytenbach; Alexander Briell; Wilbur Britz; Graeme Broster; Craig Brown; Michail Brynard; Deanne
de Bude; Richard Burge; Bianca Bˆhmer; Jan Buys; George Calder-Potts; Eleanor Cameron; Mark Carolissen; Shane Carollis-
son; Richard Case; Sithembile Cele; Alice Chang; Richard Cheng; Fanny Cherblanc; Dr. Christine Chung; Brett Cocks; RochÈ
Compaan; Willem Conradie; Stefaan Conradie; Rocco Coppejans; Tim Craib; Andrew Craig; Tim Crombie; Dan Crytser; Jock
Currie; Dr. Anne Dabrowski; Laura Daniels; Gareth Davies; Sandra Dickson; Sean Dobbs; Buhle Donga; William Donkin; Esmi
Dreyer; Matthew Duddy; Christel Durie; Fernando Durrell; Dr. Dan Dwyer; Frans van Eeden; Alexander Ellis; Tom Ellis; Andrew
Fisher; Giovanni Franzoni; Olivia Gillett; Ingrid von Glehn; Tamara von Glehn; Lindsay Glesener; Kevin Godby; Dr. Vanessa
Godfrey; Terence Goldberg; Dr. Johan Gonzalez; Saaligha Gool; Hemant Gopal; Dr. Stephanie Gould; Umeshree Govender;
Heather Gray; Lynn Greeff; Jaco Greyling; Martli Greyvenstein; Carine Grobbelaar; Suzanne GrovÈ; Dr. Tom Gutierrez; Brooke
Haag; Kate Hadley; Alex Hall; Dr. Sam Halliday; Asheena Hanuman; Dr. Melanie Dymond Harper; Ebrahim Harris; Dr. Nicho-
las Harrison; Neil Hart; Nicholas Hatcher; Jason Hayden; Laura Hayward; Dr. William P. Heal; Pierre van Heerden; Dr. Fritha
Hennessy; Dr. Colleen Henning; Shaun Hewitson; Millie Hilgart; Grant Hillebrand; Nick Hobbs; Chris Holdsworth; Dr. Benne
Holwerda; Dr. Mark Horner; Robert Hovden; Mfandaidza Hove; Jennifer Hsieh; George Hugo; Laura Huss; Prof. Ed Jacobs
Siyavula Education

Hester Jacobs; Stefan Jacobs; Rowan Jelley; Grant Jelley; Clare Johnson; Francois Jooste; Luke Jordan; Tana Joseph; Corli
Joubert; Dr. Fabian Jutz; Brian Kamanzi; Herman Kamper; Dr. Lutz Kampmann; Simon Katende; Natalia Kavalenia; Rabia
Khan; Nothando Khumalo; Paul Kim; Lizl King; Melissa Kistner; Dr. Jennifer Klay; Andrea Koch; Grove Koch; Bishop Komo-
lafe; Dr. Timo Kriel; Lara Kruger; Sihle Kubheka; Andrew Kubik; Luca Lategan; Dr. Jannie Leach; Nkoana Lebaka; Dr. Marco
van Leeuwen; Dr. Tom Leinster; Ingrid Lezar; Henry Liu; Christopher Loetscher; Linda Loots; Michael Loseby; Bets Lourens;
Chris Louw; Amandla Mabona; Malothe Mabutho; Stuart Macdonald; Dr. Anton Machacek; Tshepo Madisha; Batsirai Ma-
gunje; Dr. Komal Maheshwari; Michael Malahe; Masoabi Malunga; Kosma von Maltitz; Masilo Mapaila; Bryony Martin; Nicole
Masureik; Jacques Masuret ; John Mathew; Dr. Will Matthews; Chiedza Matuso; JoEllen McBride; Nikolai Meures; Margaretha
Meyer; Riana Meyer; Filippo Miatto; Jenny Miller; Rossouw Minnaar; Abdul Mirza; Colin Mkhize; Mapholo Modise; Carla Mo-
erdyk; Tshwarelo Mohlala; Relebohile Molaoa; Marasi Monyau; Asogan Moodaly; Jothi Moodley; Robert Moon; Calvin Moore;
Bhavani Morarjee; Kholofelo Moyaba; Nina Gitau Muchunu; Christopher Muller; Helgard Muller; Johan Muller; Caroline Mu-
nyonga; Alban Murewi; Kate Murphy; Emmanuel Musonza; Tom Mutabazi; David Myburgh; Johann Myburgh; Kamie Naidu;
Nolene Naidu; Gokul Nair; Vafa Naraghi; Bridget Nash; Eduan NaudÈ; Tyrone Negus; Theresa Nel; Huw Newton-Hill; Buntu
Ngcebetsha; Towan Nothling; Dr. Markus Oldenburg; Adekunle Oyewo; Thomas OíDonnell; Dr. Jaynie Padayachee; Poveshen
Padayachee; Masimba Paradza; Quinton Paulse; Dave Pawson; Justin Pead; Carli Pengilly; Nicolette Pekeur; Joan Pienaar;
Petrus Pieter; Sirika Pillay; Jacques Plaut; Jaco du Plessis; Barry Povey; Barry Povey; Andrea Prinsloo; David Prinsloo; Joseph
Raimondo; Sanya Rajani; Alastair Ramlakan; Thinus Ras; Dr. Matina J. Rassias; Ona Rautenbach; Dr. Jocelyn Read; Jonathan
Reader; Jane Reddick; Robert Reddick; Dr. Matthew Reece; Chris Reeders; Razvan Remsing; Laura Richter; Max Richter;
Sean Riddle; Dr. David Roberts; Christopher Roberts; Helen Robertson; Evan Robinson; Christian Roelofse; Raoul Rontsch;
Dr. Andrew Rose; Katie Ross; Jeanne-MariÈ Roux; Karen Roux; Mark Roux; Bianca Ruddy; Heinrich Rudman; Nitin Rug-
hoonauth; Katie Russell; Steven Sam; Jason Avron Samuels; Dr. Carl Scheffler; Nathaniel Schwartz; Duncan Scott; Christo
van Schalkwyk; Rhoda van Schalkwyk; Helen Seals; Relebohile Sefako; Prof. Sergey Rakityansky; Sandra Serumaga-Zake;
Paul Shangase; Cameron Sharp; Ian Sherratt; Dr. James Short; Cho Hee Shrader; Roger Sieloff; Brandon Sim; Bonga Sko-
zana; Clare Slotow; Bradley Smith; Greg Solomon; Nicholas Spaull; Hester Spies; Dr. Andrew Stacey; Dr. Jim Stasheff; Mike
Stay; Nicol Steenkamp; Dr. Fred Strassberger; Mike Stringer; Stephanie Strydom; Abdulhuck Suliman; Masixole Swartbooi;
Tshenolo Tau; Tim Teatro; Ben Thompson; Shen Tian; Xolani Timbile; Liezel du Toit; Nicola du Toit; Dr. Francois Toerien; RenÈ
Toerien; Dr. Johan du Toit; Robert Torregrosa; Jimmy Tseng; Pieter Vergeer; Rizmari Versfeld; Nina Verwey; Mfundo Vezi;
Mpilonhle Vilakazi; Wetsie Visser; Alexander Volkwyn; Mia de Vos; Dr. Karen Wallace; John Walmsley; Helen Waugh; Leandra
Webb; Dr. Dawn Webber; Michelle Wen; Dr. Rufus Wesi; Francois Wessels; Wessel Wessels; Neels van der Westhuizen; Sabet
van der Westhuizen; Dr. Alexander Wetzler; Dr. Spencer Wheaton; Vivian White; Dr. Gerald Wigger; Harry Wiggins; Heather
Williams; Wendy Williams; Julie Wilson; Timothy Wilson; Andrew Wood; Emma Wormauld; Dr. Sahal Yacoob; Jean Youssef;
Ewald Zietsman; Johan Zietsman; Marina van Zyl

This text book was developed with corporate social investment funding from MMI
Holdings.
Well structured, impactful Corporate Social Investment (CSI) has the ability to
contribute positively to nation building and drive positive change in the com-
munities. MMI’s commitment to social investment means that we are constant-
ly looking for ways in which we can assist some of South Africa’s most vulnerable
citizens to expand their horizons and gain greater access to life’s opportunities.
This means that we do not view social investment as a nice to have or as an exercise
in marketing or sponsorship but rather as a critical part of our contribution to society.
The merger between Metropolitan and Momentum was lauded for the complementary fit
between two companies. This complementary fit is also evident in the focus areas of CSI
programmes where Metropolitan and Momentum together cover and support the most
important sectors and where the greatest need is in terms of social participation.
HIV/AIDS is becoming a manageable disease in many developed countries but in a country
such as ours, it remains a disease where people are still dying of this scourge unnecessar-
ily. Metropolitan continues to make a difference in making sure that HIV AIDS moves away
from being a death sentence to a manageable disease. Metropolitan’s other focus area is
education which remains the key to economic prosperity for our country.
Momentum’s focus on persons with disabilities ensures that this community is included and
allowed to make their contribution to society. Orphaned and vulnerable children are another
focus area for Momentum and projects supported ensure that children are allowed to grow
up safely, to assume their role along with other children in inheriting a prosperous future.
SPONSOR

EVERYTHING MATHS AND SCIENCE
The Everything Mathematics and Science series covers Mathematics, Physical Sciences,
Life Sciences and Mathematical Literacy.
The Siyavula Everything Science textbooks
The Siyavula Everything Maths textbooks

You can read all of the Everything Series textbooks on your mobile phone. Visit the
Everything Maths and Everything Science mobi sites at:
All Mxit users can read their Everything Series textbooks on Mxit Reach. Add Everything
Maths and Everything Science as Mxit contacts or browse to the books on Mxit Reach.
READ ON MOBILE
MOBI-WEB
m.everythingmaths.co.za and m.everythingscience.co.za
MXIT
mxit>tradepost>reach>education>everything maths or everything science

The on-line books feature videos, presentations, simulations and fully worked solutions
to the questions and exercises found in the book.
For off-line reading on your PC, tablet, iPad and Kindle you can download a digital copy
of the Everything Series textbooks. Visit the Everything Maths and Everything Science
websites and download the books.
DIGITAL TEXTBOOKS
READ ONLINE
www.everythingmaths.co.za and www.everythingscience.
DOWNLOAD FOR TABLETS
www.everythingmaths.co.za and www.everythingscience.co.za

You can check your answer to any question in this textbook on your mobile phone by
entering the shortcode found in the textbook into the search box on the mobi-site.
To do well in tests and exams you need practice. Practise the exercises from this text-
book, additional exercises and questions from past exam papers on m.everythingmaths.
co.za and m.everythingscience.co.za and Mxit Reach.
PRACTISE INTELLIGENTLY
CHECK YOUR ANSWERS ON YOUR PHONE
m.everythingmaths.co.za and m.everythingscience.co.za
PRACTISE FOR TESTS AND EXAMS ON YOUR PHONE
m.everythingmaths.co.za and m.everythingscience.co.za

If you complete you practice homework and test questions at m.everythingmaths.co.za
or m.everythingscience.co.za, you can track of your work. Your dashboard will show you
your progress and mastery for every topic in the book and help you to manage your stud-
ies. You can use your dashboard to show your teachers, parents, universities or bursary
institutions what you have done during the year.
MANAGE YOUR STUDIES
YOUR DASHBOARD

EVERYTHING MATHS
Mathematics is commonly thought of as being about numbers but mathematics is actu-
ally a language! Mathematics is the language that nature speaks to us in. As we learn to
understand and speak this language, we can discover many of nature’s secrets. Just as
understanding someone’s language is necessary to learn more about them, mathemat-
ics is required to learn about all aspects of the world – whether it is physical sciences, life
sciences or even finance and economics.
The great writers and poets of the world have the ability to draw on words and put them
together in ways that can tell beautiful or inspiring stories. In a similar way, one can draw
on mathematics to explain and create new things. Many of the modern technologies that
have enriched our lives are greatly dependent on mathematics. DVDs, Google searches,
bank cards with PIN numbers are just some examples. And just as words were not created
specifically to tell a story but their existence enabled stories to be told, so the mathemat-
ics used to create these technologies was not developed for its own sake, but was avail-
able to be drawn on when the time for its application was right.
There is in fact not an area of life that is not affected by mathematics. Many of the most
sought after careers depend on the use of mathematics. Civil engineers use mathematics
to determine how to best design new structures; economists use mathematics to describe
and predict how the economy will react to certain changes; investors use mathematics to
price certain types of shares or calculate how risky particular investments are; software
developers use mathematics for many of the algorithms (such as Google searches and
data security) that make programmes useful.
But, even in our daily lives mathematics is everywhere – in our use of distance, time and
money. Mathematics is even present in art, design and music as it informs proportions
and musical tones. The greater our ability to understand mathematics, the greater our
ability to appreciate beauty and everything in nature. Far from being just a cold and ab-
stract discipline, mathematics embodies logic, symmetry, harmony and technological
progress. More than any other language, mathematics is everywhere and universal in its
application.

Contents
1 Exponents and surds 41.1 Revision . . . . . . . . . . . . . . . . . . . . . . . . . . . . . . . . . . 41.2 Rational exponents and surds . . . . . . . . . . . . . . . . . . . . . . . 81.3 Solving surd equations . . . . . . . . . . . . . . . . . . . . . . . . . . 191.4 Applications of exponentials . . . . . . . . . . . . . . . . . . . . . . . 231.5 Summary . . . . . . . . . . . . . . . . . . . . . . . . . . . . . . . . . 25
2 Equations and inequalities 302.1 Revision . . . . . . . . . . . . . . . . . . . . . . . . . . . . . . . . . . 302.2 Completing the square . . . . . . . . . . . . . . . . . . . . . . . . . . 382.3 Quadratic formula . . . . . . . . . . . . . . . . . . . . . . . . . . . . . 442.4 Substitution . . . . . . . . . . . . . . . . . . . . . . . . . . . . . . . . 482.5 Finding the equation . . . . . . . . . . . . . . . . . . . . . . . . . . . 502.6 Nature of roots . . . . . . . . . . . . . . . . . . . . . . . . . . . . . . 522.7 Quadratic inequalities . . . . . . . . . . . . . . . . . . . . . . . . . . 602.8 Simultaneous equations . . . . . . . . . . . . . . . . . . . . . . . . . . 672.9 Word problems . . . . . . . . . . . . . . . . . . . . . . . . . . . . . . 742.10 Summary . . . . . . . . . . . . . . . . . . . . . . . . . . . . . . . . . 80
3 Number patterns 863.1 Revision . . . . . . . . . . . . . . . . . . . . . . . . . . . . . . . . . . 863.2 Quadratic sequences . . . . . . . . . . . . . . . . . . . . . . . . . . . 903.3 Summary . . . . . . . . . . . . . . . . . . . . . . . . . . . . . . . . . 99
4 Analytical geometry 1044.1 Revision . . . . . . . . . . . . . . . . . . . . . . . . . . . . . . . . . . 1044.2 Equation of a line . . . . . . . . . . . . . . . . . . . . . . . . . . . . . 1134.3 Inclination of a line . . . . . . . . . . . . . . . . . . . . . . . . . . . . 1244.4 Parallel lines . . . . . . . . . . . . . . . . . . . . . . . . . . . . . . . . 1324.5 Perpendicular lines . . . . . . . . . . . . . . . . . . . . . . . . . . . . 1364.6 Summary . . . . . . . . . . . . . . . . . . . . . . . . . . . . . . . . . 142
5 Functions 1465.1 Quadratic functions . . . . . . . . . . . . . . . . . . . . . . . . . . . . 1465.2 Average gradient . . . . . . . . . . . . . . . . . . . . . . . . . . . . . 1645.3 Hyperbolic functions . . . . . . . . . . . . . . . . . . . . . . . . . . . 1705.4 Exponential functions . . . . . . . . . . . . . . . . . . . . . . . . . . . 1845.5 The sine function . . . . . . . . . . . . . . . . . . . . . . . . . . . . . 1975.6 The cosine function . . . . . . . . . . . . . . . . . . . . . . . . . . . . 2095.7 The tangent function . . . . . . . . . . . . . . . . . . . . . . . . . . . 2225.8 Summary . . . . . . . . . . . . . . . . . . . . . . . . . . . . . . . . . 235
6 Trigonometry 2406.1 Revision . . . . . . . . . . . . . . . . . . . . . . . . . . . . . . . . . . 2406.2 Trigonometric identities . . . . . . . . . . . . . . . . . . . . . . . . . . 2476.3 Reduction formula . . . . . . . . . . . . . . . . . . . . . . . . . . . . 253

6.4 Trigonometric equations . . . . . . . . . . . . . . . . . . . . . . . . . 2666.5 Area, sine, and cosine rules . . . . . . . . . . . . . . . . . . . . . . . . 2806.6 Summary . . . . . . . . . . . . . . . . . . . . . . . . . . . . . . . . . 301
7 Measurement 3087.1 Area of a polygon . . . . . . . . . . . . . . . . . . . . . . . . . . . . . 3087.2 Right prisms and cylinders . . . . . . . . . . . . . . . . . . . . . . . . 3117.3 Right pyramids, right cones and spheres . . . . . . . . . . . . . . . . . 3187.4 Multiplying a dimension by a constant factor . . . . . . . . . . . . . . 3227.5 Summary . . . . . . . . . . . . . . . . . . . . . . . . . . . . . . . . . 326
8 Euclidean geometry 3328.1 Revision . . . . . . . . . . . . . . . . . . . . . . . . . . . . . . . . . . 3328.2 Circle geometry . . . . . . . . . . . . . . . . . . . . . . . . . . . . . . 3338.3 Summary . . . . . . . . . . . . . . . . . . . . . . . . . . . . . . . . . 363
9 Finance, growth and decay 3749.1 Revision . . . . . . . . . . . . . . . . . . . . . . . . . . . . . . . . . . 3749.2 Simple and compound depreciation . . . . . . . . . . . . . . . . . . . 3779.3 Timelines . . . . . . . . . . . . . . . . . . . . . . . . . . . . . . . . . 3889.4 Nominal and effective interest rates . . . . . . . . . . . . . . . . . . . 3949.5 Summary . . . . . . . . . . . . . . . . . . . . . . . . . . . . . . . . . 398
10 Probability 40210.1 Revision . . . . . . . . . . . . . . . . . . . . . . . . . . . . . . . . . . 40210.2 Dependent and independent events . . . . . . . . . . . . . . . . . . . 41110.3 More Venn diagrams . . . . . . . . . . . . . . . . . . . . . . . . . . . 41910.4 Tree diagrams . . . . . . . . . . . . . . . . . . . . . . . . . . . . . . . 42610.5 Contingency tables . . . . . . . . . . . . . . . . . . . . . . . . . . . . 43110.6 Summary . . . . . . . . . . . . . . . . . . . . . . . . . . . . . . . . . 435
11 Statistics 44011.1 Revision . . . . . . . . . . . . . . . . . . . . . . . . . . . . . . . . . . 44011.2 Histograms . . . . . . . . . . . . . . . . . . . . . . . . . . . . . . . . 44411.3 Ogives . . . . . . . . . . . . . . . . . . . . . . . . . . . . . . . . . . . 45111.4 Variance and standard deviation . . . . . . . . . . . . . . . . . . . . . 45511.5 Symmetric and skewed data . . . . . . . . . . . . . . . . . . . . . . . 46111.6 Identification of outliers . . . . . . . . . . . . . . . . . . . . . . . . . . 46411.7 Summary . . . . . . . . . . . . . . . . . . . . . . . . . . . . . . . . . 467
12 Linear programming 47212.1 Introduction . . . . . . . . . . . . . . . . . . . . . . . . . . . . . . . . 472
Solutions to exercises 483
2 Contents

CHAPTER 1
Exponents and surds
1.1 Revision 4
1.2 Rational exponents and surds 8
1.3 Solving surd equations 19
1.4 Applications of exponentials 23
1.5 Summary 25

1 Exponents and surds
1.1 Revision EMBF2
The number system EMBF3
The diagram below shows the structure of the number system:
Real R
Irrational Q′
Rational Q
Integer Z
Natural N
Whole N0
Non-real R′
See video: 2222 at www.everythingmaths.co.za
We use the following definitions:
• N: natural numbers are {1; 2; 3; . . .}
• N0: whole numbers are {0; 1; 2; 3; . . .}
• Z: integers are {. . . ; −3; −2; −1; 0; 1; 2; 3; . . .}
• Q: rational numbers are numbers which can be written as ab where a and b are
integers and b 6= 0, or as a terminating or recurring decimal number.
Examples: −72 ; −2,25; 0;
√9; 0,8; 23
1
• Q′: irrational numbers are numbers that cannot be written as a fraction with thenumerator and denominator as integers. Irrational numbers also include decimalnumbers that neither terminate nor recur.
Examples:√
3; 5√
2; π; 1+√5
2 ; 1,27548 . . .
• R: real numbers include all rational and irrational numbers.
• R′: non-real numbers or imaginary numbers are numbers that are not real.
Examples:√−25; 4
√−1; −
√− 1
16
See video: 2223 at www.everythingmaths.co.za
4 1.1. Revision

Exercise 1 – 1: The number system
Use the list of words below to describe each of the following numbers (in some casesmultiple words will be applicable):
• Natural (N)
• Whole (N0)
• Integer (Z)
• Rational (Q)
• Irrational (Q′)
• Real (R)
• Non-real (R′)
1.√
7
2. 0,01
3. 1625
4.√
614
5. 0
6. 2π
7. −5,38
8. 1−√2
2
9. −√−3
10. (π)2
11. − 911
12. 3√−8
13. 227
14. 2,45897 . . .
15. 0,65
16. 5√−32
Think you got it? Get this answer and more practice on our Intelligent Practice Service
1. 2224 2. 2225 3. 2226 4. 2227 5. 2228 6. 22297. 222B 8. 222C 9. 222D 10. 222F 11. 222G 12. 222H
13. 222J 14. 222K 15. 222M 16. 222N
www.everythingmaths.co.za m.everythingmaths.co.za
Laws of exponents EMBF4
We use exponential notation to show that a number or variable is multiplied by itselfa certain number of times. The exponent, also called the index or power, indicates thenumber of times the multiplication is repeated.
base an exponent/index
an = a× a× a× . . .× a (n times) (a ∈ R, n ∈ N)
See video: 222P at www.everythingmaths.co.za
5Chapter 1. Exponents and surds
Examples:
1. 2× 2× 2× 2 = 24
2. 0,71× 0,71× 0,71 = (0,71)3
3. (501)2 = 501× 501
4. k6 = k × k × k × k × k × k
For x2, we say x is squared and for y3, we say that y is cubed. In the last example wehave k6; we say that k is raised to the sixth power.
We also have the following definitions for exponents. It is important to remember thatwe always write the final answer with a positive exponent.
• a0 = 1 (a 6= 0 because 00 is undefined)
• a−n = 1an (a 6= 0 because 1
0 is undefined)
Examples:
1. 5−2 =1
52=
1
25
2. (−36)0x = (1)x = x
3.7p−1
q3t−2=
7t2
pq3
We use the following laws for working with exponents:
• am × an = am+n
• am
an = am−n
• (ab)n = anbn
•(ab
)n= an
bn
• (am)n = amn
where a > 0, b > 0 and m,n ∈ Z.
Worked example 1: Laws of exponents
QUESTION
Simplify the following:
1. 5(m2t)p × 2(m3p)t
2.8k3x2
(xk)2
6 1.1. Revision
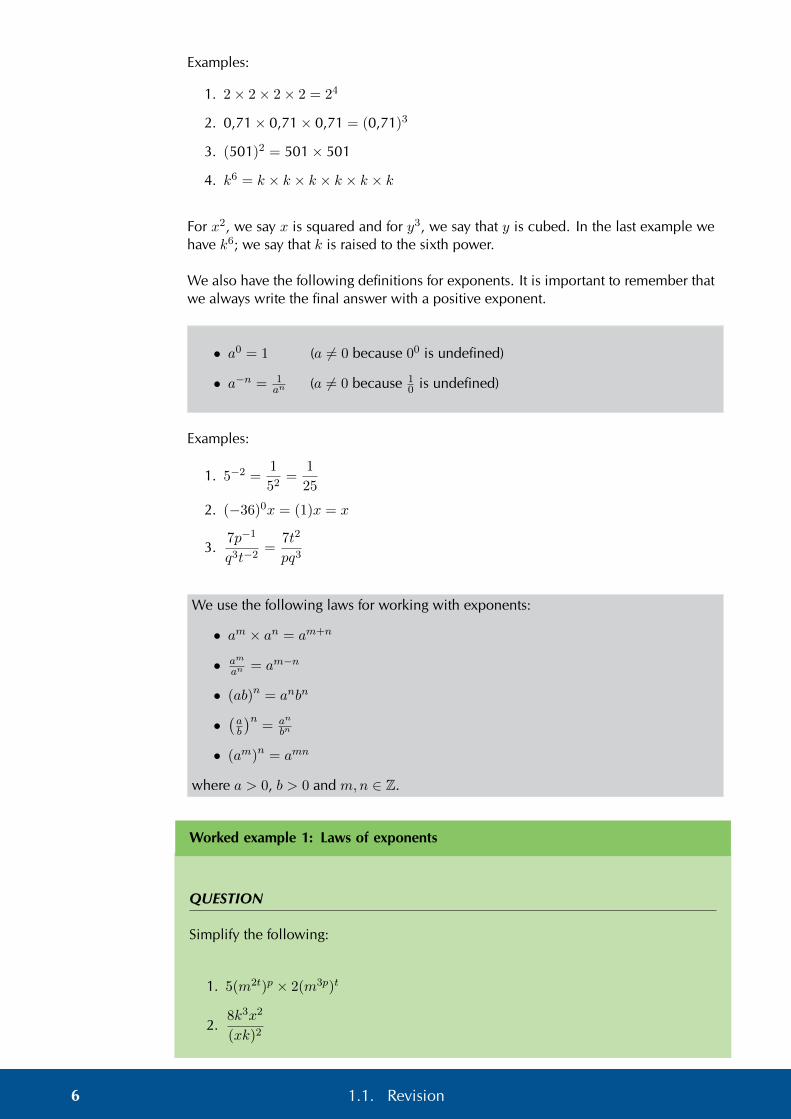
3.22 × 3× 74
(7× 2)4
4. 3(3b)a
SOLUTION
1. 5(m2t)p × 2(m3p)t = 10m2pt+3pt = 10m5pt
2.8k3x2
(xk)2=
8k3x2
x2k2= 8k(3−2)x(2−2) = 8k1x0 = 8k
3.22 × 3× 74
(7× 2)4=
22 × 3× 74
74 × 24= 2(2−4) × 3× 7(4−4) = 2−2 × 3 = 3
4
4. 3(3b)a = 3× 3ab = 3ab+1
Worked example 2: Laws of exponents
QUESTION
Simplify:3m − 3m+1
4× 3m − 3m
SOLUTION
Step 1: Simplify to a form that can be factorised
3m − 3m+1
4× 3m − 3m=
3m − (3m × 3)
4× 3m − 3m
Step 2: Take out a common factor
=3m(1− 3)
3m(4− 1)
Step 3: Cancel the common factor and simplify
=1− 3
4− 1
= −2
3
7Chapter 1. Exponents and surds
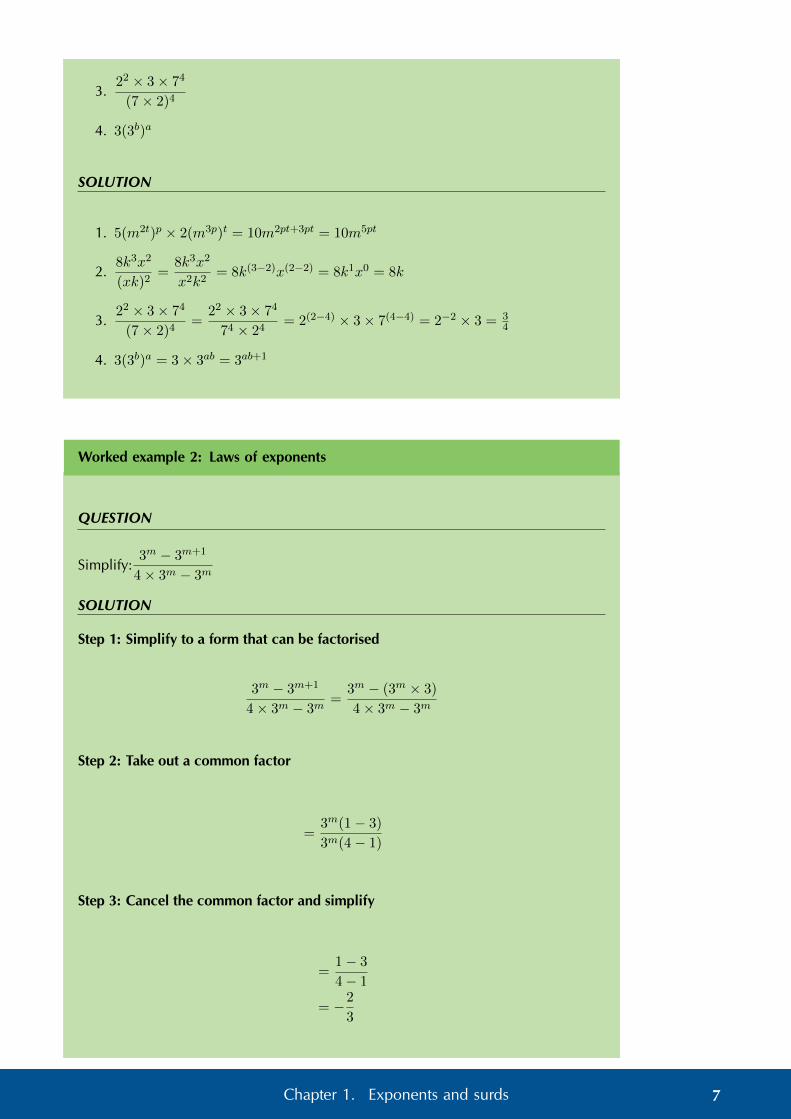
Exercise 1 – 2: Laws of exponents
Simplify the following:
1. 4× 42a × 42 × 4a
2.32
2−3
3. (3p5)2
4.k2k3x−4
kx
5. (5z−1)2 + 5z
6. (14)0
7. (x2)5
8.(ab
)−29. (m+ n)−1
10. 2(pt)s
11.1(
1a
)−112. k0
k−1
13.−2
−2−a
14.−h
(−h)−3
15.(a2b3
c3d
)2
16. 107(70)× 10−6(−6)0 − 6
17. m3n2 ÷ nm2 × mn2
18. (2−2 − 5−1)−2
19. (y2)−3 ÷(x2
y3
)−120.
2c−5
2c−8
21.29a × 46a × 22
85a
22.20t5p10
10t4p9
23.(
9q−2s
q−3sy−4a−1
)2
Think you got it? Get this answer and more practice on our Intelligent Practice Service
1. 222R 2. 222S 3. 222T 4. 222V 5. 222W 6. 222X7. 222Y 8. 222Z 9. 2232 10. 2233 11. 2234 12. 2235
13. 2236 14. 2237 15. 2238 16. 2239 17. 223B 18. 223C19. 223D 20. 223F 21. 223G 22. 223H 23. 223J
www.everythingmaths.co.za m.everythingmaths.co.za
See video: 222Q at www.everythingmaths.co.za
1.2 Rational exponents and surds EMBF5
The laws of exponents can also be extended to include the rational numbers. A rationalnumber is any number that can be written as a fraction with an integer in the numeratorand in the denominator. We also have the following definitions for working withrational exponents.
8 1.2. Rational exponents and surds

• If rn = a, then r = n√a (n ≥ 2)
• a1n = n
√a
• a−1n = (a−1)
1n = n
√1a
• amn = (am)
1n = n
√am
where a > 0, r > 0 and m,n ∈ Z, n 6= 0.
For√
25 = 5, we say that 5 is the square root of 25 and for 3√
8 = 2, we say that 2 isthe cube root of 8. For 5
√32 = 2, we say that 2 is the fifth root of 32.
When dealing with exponents, a root refers to a number that is repeatedly multipliedby itself a certain number of times to get another number. A radical refers to a numberwritten as shown below.
radical signn√a
degree
radicand
radical}
See video: 223K at www.everythingmaths.co.za
The radical symbol and degree show which root is being determined. The radicand isthe number under the radical symbol.
• If n is an even natural number, then the radicand must be positive, otherwise theroots are not real. For example, 4
√16 = 2 since 2× 2× 2× 2 = 16, but the roots
of 4√−16 are not real since (−2)× (−2)× (−2)× (−2) 6= −16.
• If n is an odd natural number, then the radicand can be positive or negative. Forexample, 3
√27 = 3 since 3× 3× 3 = 27 and we can also determine 3
√−27 = −3
since (−3)× (−3)× (−3) = −27.
It is also possible for there to be more than one nth root of a number. For example,(−2)2 = 4 and 22 = 4, so both −2 and 2 are square roots of 4.
A surd is a radical which results in an irrational number. Irrational numbers are num-bers that cannot be written as a fraction with the numerator and the denominator asintegers. For example,
√12, 3√
100, 5√
25 are surds.
Worked example 3: Rational exponents
QUESTION
Write each of the following as a radical and simplify where possible:
1. 1812
2. (−125)−13
9Chapter 1. Exponents and surds
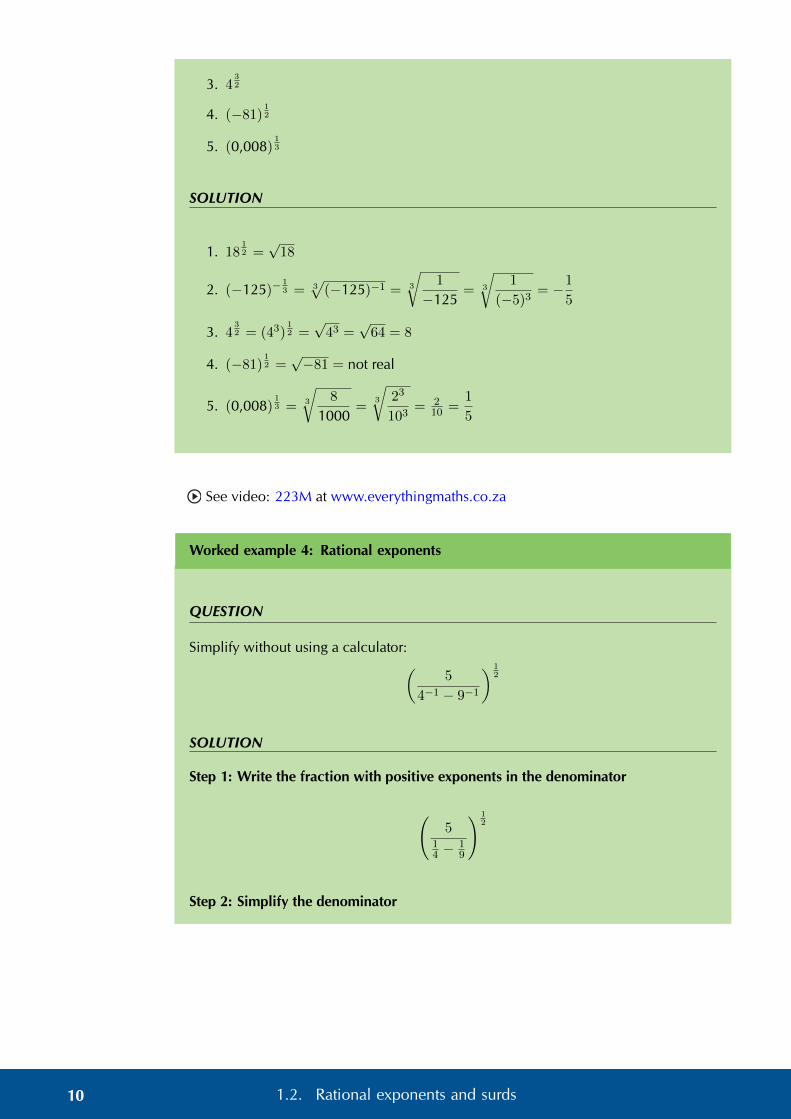
3. 432
4. (−81)12
5. (0,008)13
SOLUTION
1. 1812 =√
18
2. (−125)−13 = 3
√(−125)−1 = 3
√1
−125= 3
√1
(−5)3= −1
5
3. 432 = (43)
12 =√
43 =√
64 = 8
4. (−81)12 =√−81 = not real
5. (0,008)13 = 3
√8
1000=
3
√23
103= 2
10 =1
5
See video: 223M at www.everythingmaths.co.za
Worked example 4: Rational exponents
QUESTION
Simplify without using a calculator:(5
4−1 − 9−1
) 12
SOLUTION
Step 1: Write the fraction with positive exponents in the denominator
(5
14 −
19
) 12
Step 2: Simplify the denominator
10 1.2. Rational exponents and surds

=
(5
9−436
) 12
=
(5536
) 12
=
(5÷ 5
36
) 12
=
(5× 36
5
) 12
= (36)12
Step 3: Take the square root
=√
36
= 6
Exercise 1 – 3: Rational exponents and surds
1. Simplify the following and write answers with positive exponents:
a)√
49
b)√
36−1
c) 3√
6−2
d) 3
√−64
27
e) 4√
(16x4)3
2. Simplify:
a) s12 ÷ s
13
b)(64m6
) 23
c)12m
79
8m−119
d) (5x)0 + 5x0 − (0,25)−0,5 + 823
3. Use the laws to re-write the following expression as a power of x:
x
√x
√x√x√x
Think you got it? Get this answer and more practice on our Intelligent Practice Service
1a. 223P 1b. 223Q 1c. 223R 1d. 223S 1e. 223T 2a. 223V2b. 223W 2c. 223X 2d. 223Y 3. 223Z
www.everythingmaths.co.za m.everythingmaths.co.za
11Chapter 1. Exponents and surds

Simplification of surds EMBF6
We have seen in previous examples and exercises that rational exponents are closelyrelated to surds. It is often useful to write a surd in exponential notation as it allows usto use the exponential laws.
The additional laws listed below make simplifying surds easier:
• n√a n√b = n√ab
• n
√a
b=
n√a
n√b
• m√
n√a = mn
√a
• n√am = a
mn
• ( n√a)m
= amn
See video: 223N at www.everythingmaths.co.za
Worked example 5: Simplifying surds
QUESTION
Show that:
1. n√a× n√b = n√ab
2. n
√a
b=
n√a
n√b
SOLUTION
1.
n√a× n√b = a
1n × b
1n
= (ab)1n
=n√ab
2.
n
√a
b=(ab
) 1n
=a
1n
b1n
=n√a
n√b
12 1.2. Rational exponents and surds

Examples:
1.√
2×√
32 =√
2× 32 =√
64 = 8
2.3√
243√
3= 3
√24
3= 3√
8 = 2
3.√√
81 = 4√
81 =4√
34 = 3
Like and unlike surds EMBF7
Two surds m√a and n
√b are like surds if m = n, otherwise they are called unlike surds.
For example,√
13 and −
√61 are like surds because m = n = 2. Examples of unlike
surds are 3√
5 and 5√
7y3 since m 6= n.
Simplest surd form EMBF8
We can sometimes simplify surds by writing the radicand as a product of factors thatcan be further simplified using n
√ab = n
√a× n√b.
See video: 2242 at www.everythingmaths.co.za
Worked example 6: Simplest surd form
QUESTION
Write the following in simplest surd form:√
50
SOLUTION
Step 1: Write the radicand as a product of prime factors
√50 =
√5× 5× 2
=√
52 × 2
Step 2: Simplify using n√ab = n
√a× n√b
=√
52 ×√
2
= 5×√
2
= 5√
2
13Chapter 1. Exponents and surds

Sometimes a surd cannot be simplified. For example,√
6, 3√
30 and 4√
42 are already intheir simplest form.
Worked example 7: Simplest surd form
QUESTION
Write the following in simplest surd form: 3√
54
SOLUTION
Step 1: Write the radicand as a product of prime factors
3√
54 = 3√
3× 3× 3× 2
=3√
33 × 2
Step 2: Simplify using n√ab = n
√a× n√b
=3√
33 × 3√
2
= 3× 3√
2
= 33√
2
Worked example 8: Simplest surd form
QUESTION
Simplify:√
147 +√
108
SOLUTION
Step 1: Write the radicands as a product of prime factors
√147 +
√108 =
√49× 3 +
√36× 3
=√
72 × 3 +√
62 × 3
Step 2: Simplify using n√ab = n
√a× n√b
14 1.2. Rational exponents and surds

=(√
72 ×√
3)
+(√
62 ×√
3)
=(
7×√
3)
+(
6×√
3)
= 7√
3 + 6√
3
Step 3: Simplify and write the final answer
13√
3
Worked example 9: Simplest surd form
QUESTION
Simplify:(√
20−√
5)2
SOLUTION
Step 1: Factorise the radicands were possible
(√20−
√5)2
=(√
4× 5−√
5)2
Step 2: Simplify using n√ab = n
√a× n√b
=(√
4×√
5−√
5)2
=(
2×√
5−√
5)2
=(
2√
5−√
5)2
Step 3: Simplify and write the final answer
=(√
5)2
= 5
15Chapter 1. Exponents and surds
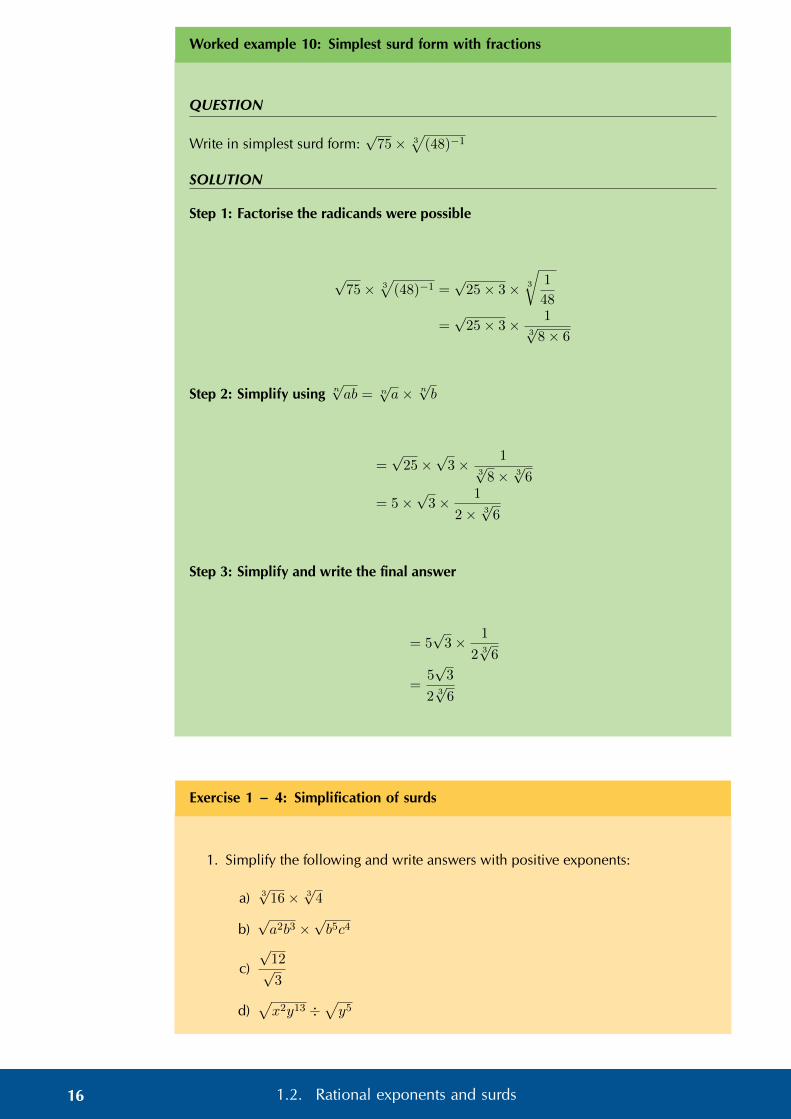
Worked example 10: Simplest surd form with fractions
QUESTION
Write in simplest surd form:√
75× 3√
(48)−1
SOLUTION
Step 1: Factorise the radicands were possible
√75× 3
√(48)−1 =
√25× 3× 3
√1
48
=√
25× 3× 13√
8× 6
Step 2: Simplify using n√ab = n
√a× n√b
=√
25×√
3× 13√
8× 3√
6
= 5×√
3× 1
2× 3√
6
Step 3: Simplify and write the final answer
= 5√
3× 1
2 3√
6
=5√
3
2 3√
6
Exercise 1 – 4: Simplification of surds
1. Simplify the following and write answers with positive exponents:
a) 3√
16× 3√
4
b)√a2b3 ×
√b5c4
c)
√12√3
d)√x2y13 ÷
√y5
16 1.2. Rational exponents and surds

2. Simplify the following:
a)(
1
a− 1
b
)−1b)
b− aa
12 − b
12
Think you got it? Get this answer and more practice on our Intelligent Practice Service
1a. 2243 1b. 2244 1c. 2245 1d. 2246 2a. 2247 2b. 2248
www.everythingmaths.co.za m.everythingmaths.co.za
Rationalising denominators EMBF9
It is often easier to work with fractions that have rational denominators instead of surddenominators. By rationalising the denominator, we convert a fraction with a surd inthe denominator to a fraction that has a rational denominator.
Worked example 11: Rationalising the denominator
QUESTION
Rationalise the denominator:5x− 16√
x
SOLUTION
Step 1: Multiply the fraction by√x√x
Notice that√x√x
= 1, so the value of the fraction has not been changed.
5x− 16√x×√x√x
=
√x(5x− 16)√x×√x
Step 2: Simplify the denominator
=
√x(5x− 16)
(√x)
2
=
√x(5x− 16)
x
The term in the denominator has changed from a surd to a rational number. Expressingthe surd in the numerator is the preferred way of writing expressions.
17Chapter 1. Exponents and surds

Worked example 12: Rationalising the denominator
QUESTION
Write the following with a rational denominator:y − 25√y + 5
SOLUTION
Step 1: Multiply the fraction by√y−5√y−5
To eliminate the surd from the denominator, we must multiply the fraction by an ex-pression that will result in a difference of two squares in the denominator.
y − 25√y + 5
×√y − 5√y − 5
Step 2: Simplify the denominator
=(y − 25)(
√y − 5)
(√y + 5)(
√y − 5)
=(y − 25)(
√y − 5)
(√y)2 − 25
=(y − 25)(
√y − 5)
y − 25
=√y − 5
See video: 2249 at www.everythingmaths.co.za
Exercise 1 – 5: Rationalising the denominator
Rationalise the denominator in each of the following:
1.10√
5
2.3√6
3.2√3÷√
2
3
4.3√
5− 1
5.x√y
6.
√3 +√
7√2
7.3√p− 4√p
8.t− 4√t+ 2
9. (1 +√m)−1
10. a(√
a÷√b)−1
18 1.2. Rational exponents and surds

Think you got it? Get this answer and more practice on our Intelligent Practice Service
1. 224B 2. 224C 3. 224D 4. 224F 5. 224G 6. 224H7. 224J 8. 224K 9. 224M 10. 224N
www.everythingmaths.co.za m.everythingmaths.co.za
1.3 Solving surd equations EMBFB
We also need to be able to solve equations that involve surds.
See video: 224P at www.everythingmaths.co.za
Worked example 13: Surd equations
QUESTION
Solve for x: 53√x4 = 405
SOLUTION
Step 1: Write in exponential notation
5(x4) 1
3 = 405
5x43 = 405
Step 2: Divide both sides of the equation by 5 and simplify
5x43
5=
4055
x43 = 81
x43 = 34
Step 3: Simplify the exponents
(x
43
) 34
=(34) 3
4
x = 33
x = 27
19Chapter 1. Exponents and surds

Step 4: Check the solution by substituting the answer back into the original equation
LHS = 53√x4
= 5(27)43
= 5(33)43
= 5(34)
= 405
= RHS
Worked example 14: Surd equations
QUESTION
Solve for z: z − 4√z + 3 = 0
SOLUTION
Step 1: Factorise
z − 4√z + 3 = 0
z − 4z12 + 3 = 0
(z12 − 3)(z
12 − 1) = 0
Step 2: Solve for both factors
The zero law states: if a× b = 0, then a = 0 or b = 0.
∴ (z12 − 3) = 0 or (z
12 − 1) = 0
Therefore
z12 − 3 = 0
z12 = 3(
z12
)2= 32
z = 9
20 1.3. Solving surd equations
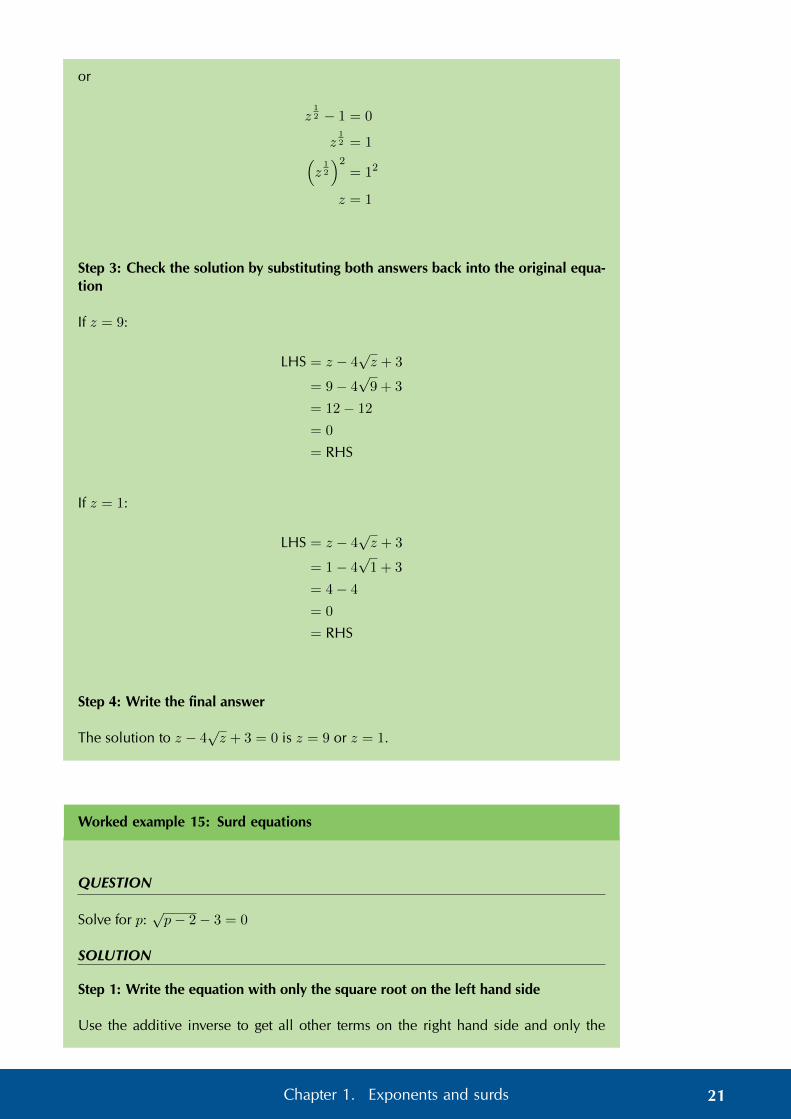
or
z12 − 1 = 0
z12 = 1(
z12
)2= 12
z = 1
Step 3: Check the solution by substituting both answers back into the original equa-tion
If z = 9:
LHS = z − 4√z + 3
= 9− 4√
9 + 3
= 12− 12
= 0
= RHS
If z = 1:
LHS = z − 4√z + 3
= 1− 4√
1 + 3
= 4− 4
= 0
= RHS
Step 4: Write the final answer
The solution to z − 4√z + 3 = 0 is z = 9 or z = 1.
Worked example 15: Surd equations
QUESTION
Solve for p:√p− 2− 3 = 0
SOLUTION
Step 1: Write the equation with only the square root on the left hand side
Use the additive inverse to get all other terms on the right hand side and only the
21Chapter 1. Exponents and surds

square root on the left hand side. √p− 2 = 3
Step 2: Square both sides of the equation(√p− 2
)2= 32
p− 2 = 9
p = 11
Step 3: Check the solution by substituting the answer back into the original equationIf p = 11:
LHS =√p− 2− 3
=√
11− 2− 3
=√
9− 3
= 3− 3
= 0
= RHS
Step 4: Write the final answer
The solution to√p− 2− 3 = 0 is p = 11.
Exercise 1 – 6: Solving surd equations
Solve for the unknown variable (remember to check that the solution is valid):
1. 2x+1 − 32 = 0
2. 125 (3p) = 27 (5p)
3. 2y12 − 3y
14 + 1 = 0
4. t− 1 =√
7− t
5. 2z − 7√z + 3 = 0
6. x13 (x
13 + 1) = 6
7. 24n − 14√
16= 0
8.√
31− 10d = 4− d
9. y − 10√y + 9 = 0
10. f = 2 +√
19− 2f
Think you got it? Get this answer and more practice on our Intelligent Practice Service
1. 224Q 2. 224R 3. 224S 4. 224T 5. 224V 6. 224W7. 224X 8. 224Y 9. 224Z 10. 2252
www.everythingmaths.co.za m.everythingmaths.co.za
22 1.3. Solving surd equations

1.4 Applications of exponentials EMBFC
There are many real world applications that require exponents. For example, expo-nentials are used to determine population growth and they are also used in finance tocalculate different types of interest.
Worked example 16: Applications of exponentials
QUESTION
A type of bacteria has a very high exponential growth rate at 80% every hour. If thereare 10 bacteria, determine how many there will be in five hours, in one day and inone week?
SOLUTION
Step 1: Exponential formula
final population = initial population× (1 + growth percentage)time period in hours
Therefore, in this case:final population = 10 (1,8)n
where n = number of hours.
Step 2: In 5 hours
final population = 10 (1,8)5 ≈ 189
Step 3: In 1 day = 24 hours
final population = 10 (1,8)24 ≈ 13 382 588
Step 4: In 1 week = 168 hours
final population = 10 (1,8)168 ≈ 7,687× 1043
Note this answer is given in scientific notation as it is a very big number.
23Chapter 1. Exponents and surds

Worked example 17: Applications of exponentials
QUESTION
A species of extremely rare deep water fish has a very long lifespan and rarely hasoffspring. If there are a total of 821 of this type of fish and their growth rate is 2% eachmonth, how many will there be in half of a year? What will the population be in tenyears and in one hundred years?
SOLUTION
Step 1: Exponential formula
final population = initial population× (1 + growth percentage)time period in months
Therefore, in this case:final population = 821(1,02)n
where n = number of months.
Step 2: In half a year = 6 months
final population = 821(1,02)6 ≈ 925
Step 3: In 10 years = 120 months
final population = 821(1,02)120 ≈ 8838
Step 4: In 100 years = 1200 months
final population = 821(1,02)1200 ≈ 1,716× 1013
Note this answer is also given in scientific notation as it is a very big number.
Exercise 1 – 7: Applications of exponentials
1. Nqobani invests R 5530 into an account which pays out a lump sum at the endof 6 years. If he gets R 9622,20 at the end of the period, what compound interestrate did the bank offer him? Give answer correct to one decimal place.
2. The current population of Johannesburg is 3 885 840 and the average rate ofpopulation growth in South Africa is 0,7% p.a. What can city planners expectthe population of Johannesburg to be in 13 years time?
3. Abiona places 3 books in a stack on her desk. The next day she counts thebooks in the stack and then adds the same number of books to the top of thestack. After how many days will she have a stack of 192 books?
24 1.4. Applications of exponentials
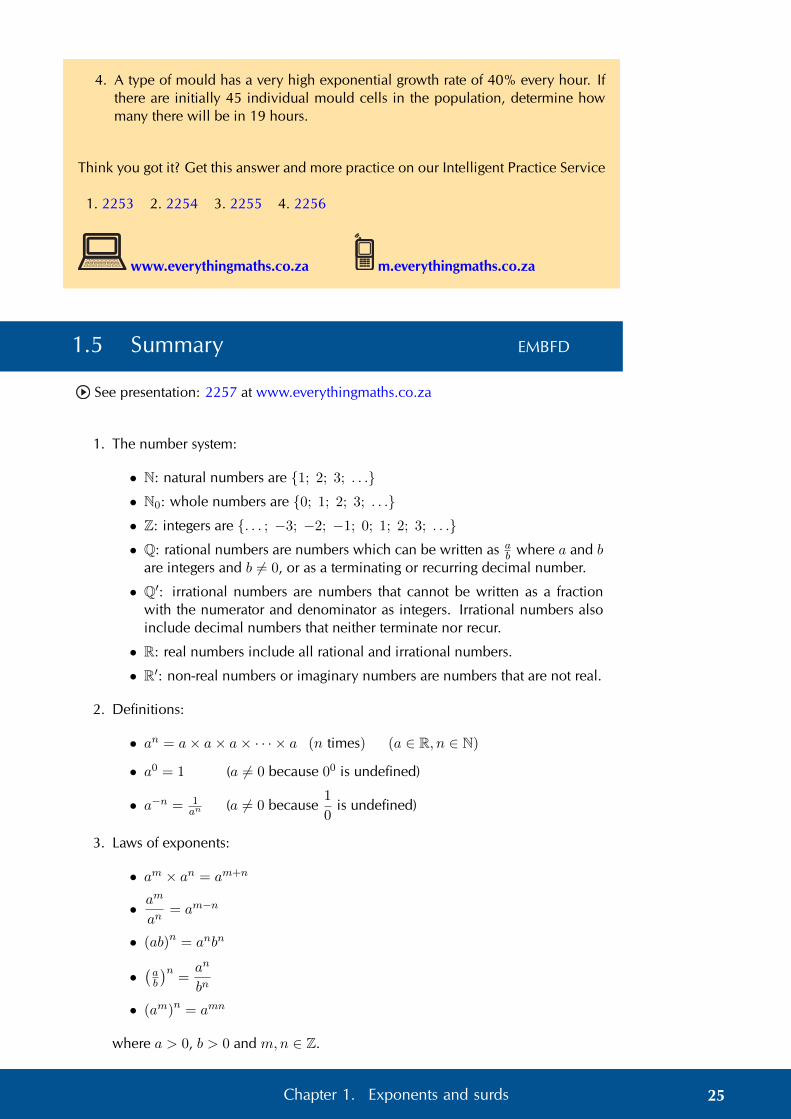
4. A type of mould has a very high exponential growth rate of 40% every hour. Ifthere are initially 45 individual mould cells in the population, determine howmany there will be in 19 hours.
Think you got it? Get this answer and more practice on our Intelligent Practice Service
1. 2253 2. 2254 3. 2255 4. 2256
www.everythingmaths.co.za m.everythingmaths.co.za
1.5 Summary EMBFD
See presentation: 2257 at www.everythingmaths.co.za
1. The number system:
• N: natural numbers are {1; 2; 3; . . .}• N0: whole numbers are {0; 1; 2; 3; . . .}• Z: integers are {. . . ; −3; −2; −1; 0; 1; 2; 3; . . .}• Q: rational numbers are numbers which can be written as a
b where a and bare integers and b 6= 0, or as a terminating or recurring decimal number.
• Q′: irrational numbers are numbers that cannot be written as a fractionwith the numerator and denominator as integers. Irrational numbers alsoinclude decimal numbers that neither terminate nor recur.
• R: real numbers include all rational and irrational numbers.
• R′: non-real numbers or imaginary numbers are numbers that are not real.
2. Definitions:
• an = a× a× a× · · · × a (n times) (a ∈ R, n ∈ N)
• a0 = 1 (a 6= 0 because 00 is undefined)
• a−n = 1an (a 6= 0 because
1
0is undefined)
3. Laws of exponents:
• am × an = am+n
• am
an= am−n
• (ab)n = anbn
•(ab
)n=an
bn
• (am)n = amn
where a > 0, b > 0 and m,n ∈ Z.
25Chapter 1. Exponents and surds

4. Rational exponents and surds:
• If rn = a, then r = n√a (n ≥ 2)
• a1n = n
√a
• a−1n = (a−1)
1n = n
√1
a
• amn = (am)
1n = n
√am
where a > 0, r > 0 and m,n ∈ Z, n 6= 0.
5. Simplification of surds:
• n√a n√b = n√ab
• n
√a
b=
n√a
n√b
• m√
n√a = mn
√a
Exercise 1 – 8: End of chapter exercises
1. Simplify as far as possible:
a) 8−23
b)√
16 + 8−23
2. Simplify:
a)(x3) 4
3
b)(s2) 1
2
c)(m5) 5
3
d)(−m2
) 43
e) −(m2) 4
3
f)(
3y43
)43. Simplify the following:
a)3a−2b15c−5
(a−4b3c)−52
b)(9a6b4
) 12
c)(a
32 b
34
)16d) x3
√x
e) 3√x4b5
4. Re-write the following expression as a power of x:
x
√x
√x√x√x
x2
5. Expand:(√x−√
2) (√
x+√
2)
6. Rationalise the denominator:10
√x− 1
x
26 1.5. Summary

7. Write as a single term with a rational denominator:3
2√x
+√x
8. Write in simplest surd form:
a)√
72
b)√
45 +√
80
c)
√48√12
d)
√18÷
√72√
8
e)4(√
8÷√
2)
f)16(√
20÷√
12)
9. Expand and simplify:
a)(2 +√
2)2
b)(2 +√
2) (
1 +√
8)
c)(1 +√
3) (
1 +√
8 +√
3)
10. Simplify, without use of a calculator:
a)√
5(√
45 + 2√
80)
b)
√98−
√8√
50
11. Simplify:√
98x6 +√
128x6
12. Rationalise the denominator:
a)
√5 + 2√
5
b)y − 4√y − 2
c)2x− 20√x−√
10
13. Evaluate without using a calculator:
(2−√
7
2
) 12
×
(2 +
√7
2
) 12
14. Prove (without the use of a calculator):√8
3+ 5
√5
3−√
1
6=
10√
15 + 3√
6
6
15. Simplify completely by showing all your steps (do not use a calculator):
3−12
[√
12 + 3
√(3√
3)]
16. Fill in the blank surd-form number on the right hand side of the equal sign whichwill make the following a true statement: −3
√6×−2
√24 = −
√18× ...
27Chapter 1. Exponents and surds

17. Solve for the unknown variable:
a) 3x−1 − 27 = 0
b) 8x − 13√8
= 0
c) 27(4x) = (64)3x
d)√
2x− 5 = 2− x
e) 2x23 + 3x
13 − 2 = 0
18. a) Show that
√3x+1 − 3x
3x−1+ 3 is equal to 3
b) Hence solve
√3x+1 − 3x
3x−1+ 3 =
(1
3
)x−2
Think you got it? Get this answer and more practice on our Intelligent Practice Service
1a. 2258 1b. 2259 2a. 225B 2b. 225C 2c. 225D 2d. 225F2e. 225G 2f. 225H 3a. 225J 3b. 225K 3c. 225M 3d. 225N3e. 225P 4. 225Q 5. 225R 6. 225S 7. 225T 8a. 225V8b. 225W 8c. 225X 8d. 225Y 8e. 225Z 8f. 2262 9a. 22639b. 2264 9c. 2265 10a. 2266 10b. 2267 11. 2268 12a. 2269
12b. 226B 12c. 226C 13. 226D 14. 226F 15. 226G 16. 226H17a. 226J 17b. 226K 17c. 226M 17d. 226N 17e. 226P 18. 226Q
www.everythingmaths.co.za m.everythingmaths.co.za
28 1.5. Summary
CHAPTER 2
Equations and inequalities
2.1 Revision 30
2.2 Completing the square 38
2.3 Quadratic formula 44
2.4 Substitution 48
2.5 Finding the equation 50
2.6 Nature of roots 52
2.7 Quadratic inequalities 60
2.8 Simultaneous equations 67
2.9 Word problems 74
2.10 Summary 80

2 Equations and inequalities
2.1 Revision EMBFF
Solving quadratic equations using factorisation EMBFG
Terminology:Expression An expression is a term or group of terms consist-
ing of numbers, variables and the basic operators(+,−,×,÷, xn).
Equation A mathematical statement that asserts that two ex-pressions are equal.
Inequality An inequality states the relation between two ex-pressions (>,<,≥,≤).
Solution A value or set of values that satisfy the original prob-lem statement.
Root A root of an equation is the value of x such thatf(x) = 0.
A quadratic equation is an equation of the second degree; the exponent of one variableis 2.
The following are examples of quadratic equations:
2x2 − 5x = 12
a(a− 3)− 10 = 0
3b
b+ 2+ 1 =
4
b+ 1
A quadratic equation has at most two solutions, also referred to as roots. There aresome situations, however, in which a quadratic equation has either one solution or nosolutions.
30 2.1. Revision

x
yy = x2 − 4
0−2 2
−4
x
y
y = x2
0x
y
y = x2 + x+ 1
0
y = (x− 2)(x+ 2)
= x2 − 4Graph of a quadratic
equation with two roots:x = −2 and x = 2.
y = x2
Graph of a quadraticequation with one root:
x = 0.
y = x2 + x+ 1Graph of a quadraticequation with no real
roots.
One method for solving quadratic equations is factorisation. The standard form of aquadratic equation is ax2 + bx + c = 0 and it is the starting point for solving anyequation by factorisation.
It is very important to note that one side of the equation must be equal to zero.
Investigation: Zero product law
Solve the following equations:
1. 6× 0 = ?
2. −25× 0 = ?
3. 0× 0,69 = ?
4. 7× ? = 0
Now solve for the variable in each of the following:
1. 6×m = 0
2. 32× x× 2 = 0
3. 11(z − 3) = 0
4. (k + 3)(k − 4) = 0
To obtain the two roots we use the fact that if a× b = 0, then a = 0 and/or b = 0. Thisis called the zero product law.
31Chapter 2. Equations and inequalities

Method for solving quadratic equations EMBFH
1. Rewrite the equation in the standard form ax2 + bx+ c = 0.
2. Divide the entire equation by any common factor of the coefficients to obtain asimpler equation of the form ax2+bx+c = 0, where a, b and c have no commonfactors.
3. Factorise ax2 + bx+ c = 0 to be of the form (rx+ s) (ux+ v) = 0.
4. The two solutions are
(rx+ s) = 0 (ux+ v) = 0
So x = −sr
So x = −vu
5. Always check the solution by substituting the answer back into the original equa-tion.
See video: 226R at www.everythingmaths.co.za
Worked example 1: Solving quadratic equations using factorisation
QUESTION
Solve for x: x (x− 3) = 10
SOLUTION
Step 1: Rewrite the equation in the form ax2 + bx+ c = 0
Expand the brackets and subtract 10 from both sides of the equation x2− 3x− 10 = 0
Step 2: Factorise
(x+ 2) (x− 5) = 0
Step 3: Solve for both factors
x+ 2 = 0
x = −2
or
x− 5 = 0
x = 5
32 2.1. Revision

The graph shows the roots of the equation x = −2 or x = 5. This graph does notform part of the answer as the question did not ask for a sketch. It is shown here forillustration purposes only.
2
4
−2
−4
−6
−8
−10
−12
2 4 6−2−4
x
f(x)
y = x2 − 3x− 10
0
Step 4: Check the solution by substituting both answers back into the original equa-tion
Step 5: Write the final answer
Therefore x = −2 or x = 5.
Worked example 2: Solving quadratic equations using factorisation
QUESTION
Solve the equation: 2x2 − 5x− 12 = 0
SOLUTION
Step 1: There are no common factors
Step 2: The quadratic equation is already in the standard form ax2 + bx+ c = 0
Step 3: Factorise
We must determine the combination of factors of 2 and 12 that will give a middle termcoefficient of 5.
We find that 2× 1 and 3× 4 give a middle term coefficient of 5 so we can factorise theequation as
(2x+ 3)(x− 4) = 0
Step 4: Solve for both roots
33Chapter 2. Equations and inequalities

We have
2x+ 3 = 0
x = −3
2
or
x− 4 = 0
x = 4
Step 5: Check the solution by substituting both answers back into the original equa-tion
Step 6: Write the final answer
Therefore, x = −32 or x = 4.
Worked example 3: Solving quadratic equations using factorisation
QUESTION
Solve for y: y2 − 7 = 0
SOLUTION
Step 1: Factorise as a difference of two squares
We know that
(√7)2
= 7
We can write the equation asy2 − (
√7)2 = 0
Step 2: Factorise
(y −√
7)(y +√
7) = 0
Therefore y =√
7 or y = −√
7
34 2.1. Revision

Even though the question did not ask for a sketch, it is often very useful to draw thegraph. We can let f(y) = y2 − 7 and draw a rough sketch of the graph to see wherethe two roots of the equation lie.
1
2
−1
−2
−3
−4
−5
−6
−7
1 2 3−1−2−3
y
f(y)
f(y) = y2 − 7
0
Step 3: Check the solution by substituting both answers back into the original equa-tion
Step 4: Write the final answer
Therefore y = ±√
7.
Worked example 4: Solving quadratic equations using factorisation
QUESTION
Solve for b:3b
b+ 2+ 1 =
4
b+ 1
SOLUTION
Step 1: Determine the restrictions
The restrictions are the values for b that would result in the denominator being equalto 0, which would make the fraction undefined. Therefore b 6= − 2 and b 6= − 1.
Step 2: Determine the lowest common denominator
The lowest common denominator is (b+ 2) (b+ 1).
Step 3: Multiply each term in the equation by the lowest common denominator andsimplify
35Chapter 2. Equations and inequalities

3b(b+ 2)(b+ 1)
b+ 2+ (b+ 2)(b+ 1) =
4(b+ 2)(b+ 1)
b+ 1
3b(b+ 1) + (b+ 2)(b+ 1) = 4(b+ 2)
3b2 + 3b+ b2 + 3b+ 2 = 4b+ 8
4b2 + 2b− 6 = 0
2b2 + b− 3 = 0
Step 4: Factorise and solve the equation
(2b+ 3)(b− 1) = 0
2b+ 3 = 0 or b− 1 = 0
b = −3
2or b = 1
Step 5: Check the solution by substituting both answers back into the original equa-tion
Step 6: Write the final answer
Therefore b = −112 or b = 1.
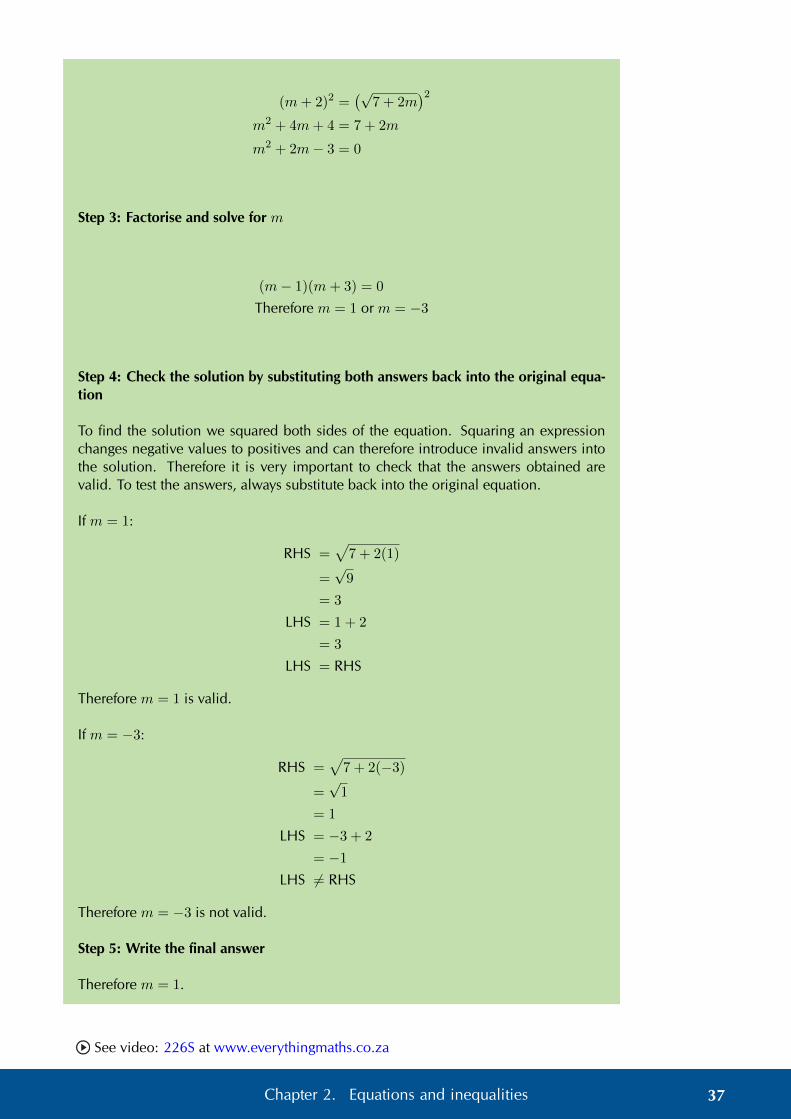
Worked example 5: Squaring both sides of the equation
QUESTION
Solve for m: m+ 2 =√
7 + 2m
SOLUTION
Step 1: Square both sides of the equation
Before we square both sides of the equation, we must make sure that the radical is theonly term on one side of the equation and all other terms are on the other, otherwisesquaring both sides will make the equation more complicated to solve.
(m+ 2)2 =(√
7 + 2m)2
Step 2: Expand the brackets and simplify
36 2.1. Revision
(m+ 2)2 =(√
7 + 2m)2
m2 + 4m+ 4 = 7 + 2m
m2 + 2m− 3 = 0
Step 3: Factorise and solve for m
(m− 1)(m+ 3) = 0
Therefore m = 1 or m = −3
Step 4: Check the solution by substituting both answers back into the original equa-tion
To find the solution we squared both sides of the equation. Squaring an expressionchanges negative values to positives and can therefore introduce invalid answers intothe solution. Therefore it is very important to check that the answers obtained arevalid. To test the answers, always substitute back into the original equation.
If m = 1:
RHS =√
7 + 2(1)
=√
9
= 3
LHS = 1 + 2
= 3
LHS = RHS
Therefore m = 1 is valid.
If m = −3:
RHS =√
7 + 2(−3)
=√
1
= 1
LHS = −3 + 2
= −1
LHS 6= RHS
Therefore m = −3 is not valid.
Step 5: Write the final answer
Therefore m = 1.
See video: 226S at www.everythingmaths.co.za
37Chapter 2. Equations and inequalities

Exercise 2 – 1: Solution by factorisation
Solve the following quadratic equations by factorisation. Answers may be left in surdform, where applicable.
1. 7t2 + 14t = 0
2. 12y2 + 24y + 12 = 0
3. 16s2 = 400
4. y2 − 5y + 6 = 0
5. y2 + 5y − 36 = 0
6. 4 + p =√p+ 6
7. −y2 − 11y − 24 = 0
8. 13y − 42 = y2
9. (x− 1)(x+ 10) = −24
10. y2 − 5ky + 4k2 = 0
11. 2y2 − 61 = 101
12. 2y2 − 10 = 0
13. −8 + h2 = 28
14. y2 − 4 = 10
15.√
5− 2p− 4 = 12p
16. y2 + 28 = 100
17. f (2f + 1) = 15
18. 2x =√
21x− 5
19.5y
y − 2+
3
y+ 2 =
−6
y2 − 2y
20.x+ 9
x2 − 9+
1
x+ 3=
2
x− 3
21.y − 2
y + 1=
2y + 1
y − 7
22. 1 +t− 2
t− 1=
5
t2 − 4t+ 3+
10
3− t
23.4
m+ 3+
4
4−m2=
5m− 5
m2 +m− 6
24. 5√
5t+ 1− 4 = 5t+ 1
Think you got it? Get this answer and more practice on our Intelligent Practice Service
1. 226T 2. 226V 3. 226W 4. 226X 5. 226Y 6. 226Z7. 2272 8. 2273 9. 2274 10. 2275 11. 2276 12. 2277
13. 2278 14. 2279 15. 227B 16. 227C 17. 227D 18. 227F19. 227G 20. 227H 21. 227J 22. 227K 23. 227M 24. 227N
www.everythingmaths.co.za m.everythingmaths.co.za
2.2 Completing the square EMBFJ
Investigation: Completing the square
Can you solve each equation using two different methods?
1. x2 − 4 = 0
2. x2 − 8 = 0
3. x2 − 4x+ 4 = 0
38 2.2. Completing the square

4. x2 − 4x− 4 = 0
Factorising the last equation is quite difficult. Use the previous examples as a hint andtry to create a difference of two squares.
See video: 227P at www.everythingmaths.co.za
We have seen that expressions of the form x2− b2 are known as differences of squaresand can be factorised as (x − b)(x + b). This simple factorisation leads to anothertechnique for solving quadratic equations known as completing the square.
Consider the equation x2 − 2x − 1 = 0. We cannot easily factorise this expression.When we expand the perfect square (x − 1)2 and examine the terms we see that(x− 1)2 = x2 − 2x+ 1.
We compare the two equations and notice that only the constant terms are different.We can create a perfect square by adding and subtracting the same amount to theoriginal equation.
x2 − 2x− 1 = 0
(x2 − 2x+ 1)− 1− 1 = 0
(x2 − 2x+ 1)− 2 = 0
(x− 1)2 − 2 = 0
Method 1: Take square roots on both sides of the equation to solve for x.
(x− 1)2 − 2 = 0
(x− 1)2 = 2√(x− 1)2 = ±
√2
x− 1 = ±√
2
x = 1±√
2
Therefore x = 1 +√
2 or x = 1−√
2
Very important: Always remember to include both a positive and a negative answerwhen taking the square root, since 22 = 4 and (−2)2 = 4.
Method 2: Factorise the expression as a difference of two squares using 2 =(√
2)2
.
We can write
(x− 1)2 − 2 = 0
(x− 1)2 −(√
2)2
= 0((x− 1) +
√2)(
(x− 1)−√
2)
= 0
39Chapter 2. Equations and inequalities

The solution is then
(x− 1) +√
2 = 0
x = 1−√
2
or
(x− 1)−√
2 = 0
x = 1 +√
2
Method for solving quadratic equations by completing the square
1. Write the equation in the standard form ax2 + bx+ c = 0.
2. Make the coefficient of the x2 term equal to 1 by dividing the entire equation bya.
3. Take half the coefficient of the x term and square it; then add and subtract itfrom the equation so that the equation remains mathematically correct. In theexample above, we added 1 to complete the square and then subtracted 1 sothat the equation remained true.
4. Write the left hand side as a difference of two squares.
5. Factorise the equation in terms of a difference of squares and solve for x.
See video: 227Q at www.everythingmaths.co.za
Worked example 6: Solving quadratic equations by completing the square
QUESTION
Solve by completing the square: x2 − 10x− 11 = 0
SOLUTION
Step 1: The equation is already in the form ax2 + bx+ c = 0
Step 2: Make sure the coefficient of the x2 term is equal to 1
x2 − 10x− 11 = 0
Step 3: Take half the coefficient of the x term and square it; then add and subtract itfrom the equation
The coefficient of the x term is −10. Half of the coefficient of the x term is −5 andthe square of it is 25. Therefore x2 − 10x+ 25− 25− 11 = 0.
Step 4: Write the trinomial as a perfect square
40 2.2. Completing the square

(x2 − 10x+ 25)− 25− 11 = 0
(x− 5)2 − 36 = 0
Step 5: Method 1: Take square roots on both sides of the equation
(x− 5)2 − 36 = 0
(x− 5)2 = 36
x− 5 = ±√
36
Important: When taking a square root always remember that there is a positive andnegative answer, since (6)2 = 36 and (−6)2 = 36.
x− 5 = ±6
Step 6: Solve for x
x = −1 or x = 11
Step 7: Method 2: Factorise equation as a difference of two squares
(x− 5)2 − (6)2 = 0
[(x− 5) + 6] [(x− 5)− 6] = 0
Step 8: Simplify and solve for x
(x+ 1)(x− 11) = 0
∴ x = −1 or x = 11
Step 9: Write the final answer
x = −1 or x = 11
Notice that both methods produce the same answer. These roots are rational because36 is a perfect square.
41Chapter 2. Equations and inequalities

Worked example 7: Solving quadratic equations by completing the square
QUESTION
Solve by completing the square: 2x2 − 6x− 10 = 0
SOLUTION
Step 1: The equation is already in standard form ax2 + bx+ c = 0
Step 2: Make sure that the coefficient of the x2 term is equal to 1
The coefficient of the x2 term is 2. Therefore divide the entire equation by 2:
x2 − 3x− 5 = 0
Step 3: Take half the coefficient of the x term, square it; then add and subtract itfrom the equation
The coefficient of the x term is −3, so then(−3
2
)2
=9
4:
(x2 − 3x+
9
4
)− 9
4− 5 = 0
Step 4: Write the trinomial as a perfect square
(x− 3
2
)2
− 9
4− 20
4= 0
(x− 3
2
)2
− 29
4= 0
Step 5: Method 1: Take square roots on both sides of the equation
(x− 3
2
)2
− 29
4= 0
(x− 3
2
)2
=29
4
x− 3
2= ±
√29
4
Remember: When taking a square root there is a positive and a negative answer.
Step 6: Solve for x
42 2.2. Completing the square

x− 3
2= ±
√29
4
x =3
2±√
29
2
=3±√
29
2
Step 7: Method 2: Factorise equation as a difference of two squares
(x− 3
2
)2
− 29
4= 0
(x− 3
2
)2
−
(√29
4
)2
= 0
(x− 3
2−√
29
4
)(x− 3
2+
√29
4
)= 0
Step 8: Solve for x
(x− 3
2−√
29
2
)(x− 3
2+
√29
2
)= 0
Therefore x =3
2+
√29
2or x =
3
2−√
29
2
Notice that these roots are irrational since 29 is not a perfect square.
See video: 227R at www.everythingmaths.co.za
Exercise 2 – 2: Solution by completing the square
1. Solve the following equations by completing the square:
a) x2 + 10x− 2 = 0
b) x2 + 4x+ 3 = 0
c) p2 − 5 = −8p
d) 2(6x+ x2) = −4
e) x2 + 5x+ 9 = 0
f) t2 + 30 = 2(10− 8t)
g) 3x2 + 6x− 2 = 0
h) z2 + 8z − 6 = 0
i) 2z2 = 11z
j) 5 + 4z − z2 = 0
43Chapter 2. Equations and inequalities

2. Solve for k in terms of a: k2 + 6k + a = 0
3. Solve for y in terms of p, q and r: py2 + qy + r = 0
Think you got it? Get this answer and more practice on our Intelligent Practice Service
1a. 227S 1b. 227T 1c. 227V 1d. 227W 1e. 227X 1f. 227Y1g. 227Z 1h. 2282 1i. 2283 1j. 2284 2. 2285 3. 2286
www.everythingmaths.co.za m.everythingmaths.co.za
2.3 Quadratic formula EMBFK
It is not always possible to solve a quadratic equation by factorisation and it can take along time to complete the square. The method of completing the square provides a wayto derive a formula that can be used to solve any quadratic equation. The quadraticformula provides an easy and fast way to solve quadratic equations.
Consider the standard form of the quadratic equation ax2 + bx + c = 0. Divide bothsides by a (a 6= 0) to get
x2 +bx
a+c
a= 0
Now using the method of completing the square, we must halve the coefficient of x
and square it. We then add and subtract(b
2a
)2
so that the equation remains true.
x2 +bx
a+
b2
4a2− b2
4a2+c
a= 0
(x2 +
bx
a+
b2
4a2
)− b2
4a2+c
a= 0
(x+
b
2a
)2
− b2 − 4ac
4a2= 0
We add the constant to both sides and take the square root of both sides of the equa-tion, being careful to include a positive and negative answer.
44 2.3. Quadratic formula
(x+
b
2a
)2
=b2 − 4ac
4a2√(x+
b
2a
)2
= ±√b2 − 4ac
4a2
x+b
2a= ±√b2 − 4ac
2a
x = − b
2a±√b2 − 4ac
2a
x =−b±
√b2 − 4ac
2a
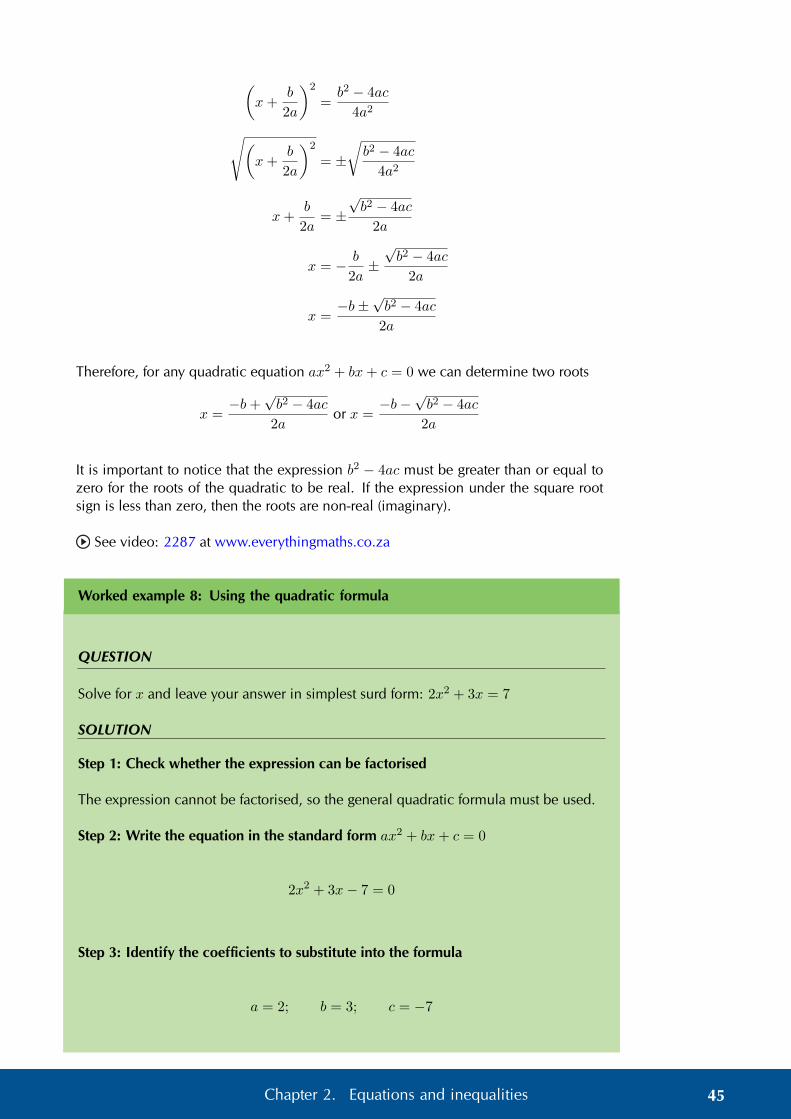
Therefore, for any quadratic equation ax2 + bx+ c = 0 we can determine two roots
x =−b+
√b2 − 4ac
2aor x =
−b−√b2 − 4ac
2a
It is important to notice that the expression b2 − 4ac must be greater than or equal tozero for the roots of the quadratic to be real. If the expression under the square rootsign is less than zero, then the roots are non-real (imaginary).
See video: 2287 at www.everythingmaths.co.za
Worked example 8: Using the quadratic formula
QUESTION
Solve for x and leave your answer in simplest surd form: 2x2 + 3x = 7
SOLUTION
Step 1: Check whether the expression can be factorised
The expression cannot be factorised, so the general quadratic formula must be used.
Step 2: Write the equation in the standard form ax2 + bx+ c = 0
2x2 + 3x− 7 = 0
Step 3: Identify the coefficients to substitute into the formula
a = 2; b = 3; c = −7
45Chapter 2. Equations and inequalities
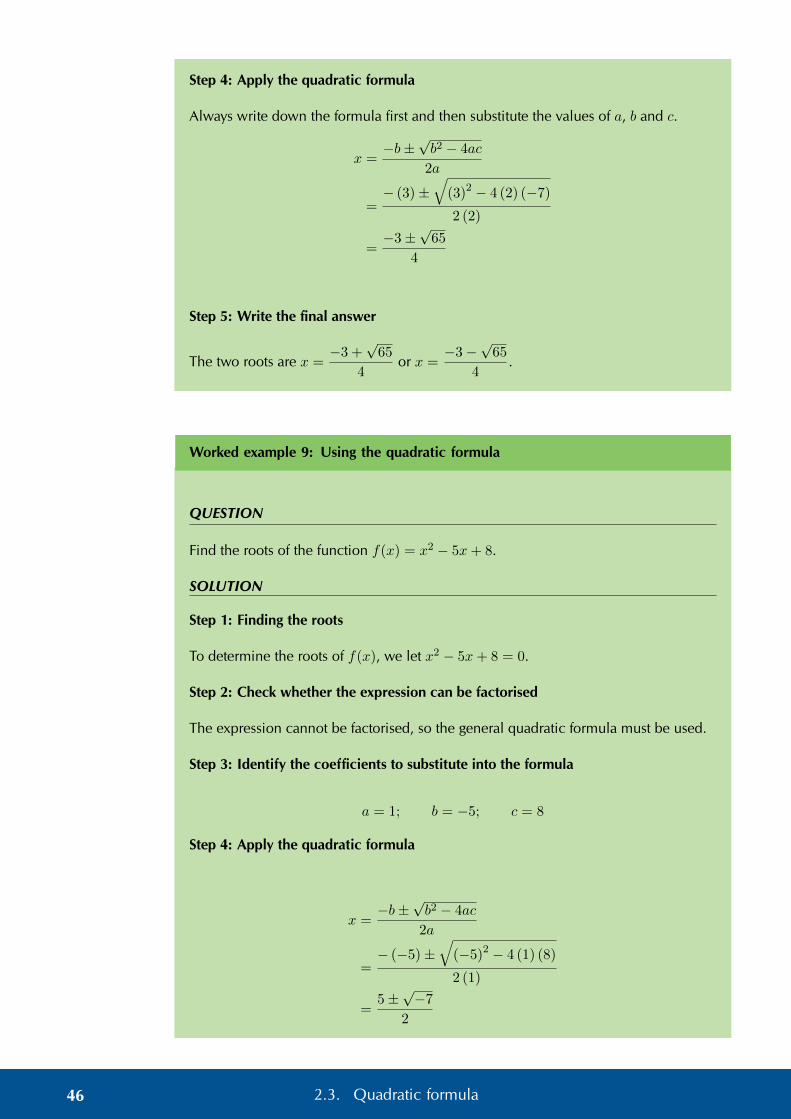
Step 4: Apply the quadratic formula
Always write down the formula first and then substitute the values of a, b and c.
x =−b±
√b2 − 4ac
2a
=− (3)±
√(3)2 − 4 (2) (−7)
2 (2)
=−3±
√65
4
Step 5: Write the final answer
The two roots are x =−3 +
√65
4or x =
−3−√
65
4.
Worked example 9: Using the quadratic formula
QUESTION
Find the roots of the function f(x) = x2 − 5x+ 8.
SOLUTION
Step 1: Finding the roots
To determine the roots of f(x), we let x2 − 5x+ 8 = 0.
Step 2: Check whether the expression can be factorised
The expression cannot be factorised, so the general quadratic formula must be used.
Step 3: Identify the coefficients to substitute into the formula
a = 1; b = −5; c = 8
Step 4: Apply the quadratic formula
x =−b±
√b2 − 4ac
2a
=− (−5)±
√(−5)2 − 4 (1) (8)
2 (1)
=5±√−7
2
46 2.3. Quadratic formula

Step 5: Write the final answer
There are no real roots for f(x) = x2 − 5x + 8 since the expression under the squareroot is negative (
√−7 is not a real number). This means that the graph of the quadratic
function has no x-intercepts; the entire graph lies above the x-axis.
2
4
6
8
10
2 4 6−2−4
x
f(x)
f(x) = x2 − 5x+ 8
0
See video: 2288 at www.everythingmaths.co.za
Exercise 2 – 3: Solution by the quadratic formula
Solve the following using the quadratic formula.
1. 3t2 + t− 4 = 0
2. x2 − 5x− 3 = 0
3. 2t2 + 6t+ 5 = 0
4. 2p(2p+ 1) = 2
5. −3t2 + 5t− 8 = 0
6. 5t2 + 3t− 3 = 0
7. t2 − 4t+ 2 = 0
8. 9(k2 − 1) = 7k
9. 3f − 2 = −2f2
10. t2 + t+ 1 = 0
Think you got it? Get this answer and more practice on our Intelligent Practice Service
1. 2289 2. 228B 3. 228C 4. 228D 5. 228F 6. 228G7. 228H 8. 228J 9. 228K 10. 228M
www.everythingmaths.co.za m.everythingmaths.co.za
47Chapter 2. Equations and inequalities

2.4 Substitution EMBFM
It is often useful to make a substitution for a repeated expression in a quadratic equa-tion. This makes the equation simpler and much easier to solve.
Worked example 10: Solving by substitution
QUESTION
Solve for x: x2 − 2x− 3
x2 − 2x= 2
SOLUTION
Step 1: Determine the restrictions for x
The restrictions are the values for x that would result in the denominator being equalto 0, which would make the fraction undefined. Therefore x 6= 0 and x 6= 2.
Step 2: Substitute a single variable for the repeated expression
We notice that x2 − 2x is a repeated expression and we therefore let k = x2 − 2x sothat the equation becomes
k − 3
k= 2
Step 3: Determine the restrictions for k
The restrictions are the values for k that would result in the denominator being equalto 0, which would make the fraction undefined. Therefore k 6= 0.
Step 4: Solve for k
k − 3
k= 2
k2 − 3 = 2k
k2 − 2k − 3 = 0
(k + 1)(k − 3) = 0
Therefore k = −1 or k = 3
We check these two roots against the restrictions for k and confirm that both are valid.
Step 5: Use values obtained for k to solve for the original variable x
48 2.4. Substitution

For k = −1
x2 − 2x = −1
x2 − 2x+ 1 = 0
(x− 1)(x− 1) = 0
Therefore x = 1
For k = 3
x2 − 2x = 3
x2 − 2x− 3 = 0
(x+ 1)(x− 3) = 0
Therefore x = −1 or x = 3
We check these roots against the restrictions for x and confirm that all three values arevalid.
Step 6: Write the final answer
The roots of the equation are x = −1, x = 1 and x = 3.
Exercise 2 – 4:
Solve the following quadratic equations by substitution:
1. −24 = 10(x2 + 5x) + (x2 + 5x)2
2. (x2 − 2x)2 − 8 = 7(x2 − 2x)
3. x2 + 3x− 56
x(x+ 3)= 26
4. x2 − 18 + x+72
x2 + x= 0
5. x2 − 4x+ 10− 7(4x− x2) = −2
6.9
x2 + 2x− 12= x2 + 2x− 12
Think you got it? Get this answer and more practice on our Intelligent Practice Service
1. 228N 2. 228P 3. 228Q 4. 228R 5. 228S 6. 228T
www.everythingmaths.co.za m.everythingmaths.co.za
49Chapter 2. Equations and inequalities

2.5 Finding the equation EMBFN
We have seen that the roots are the solutions obtained from solving a quadratic equa-tion. Given the roots, we are also able to work backwards to determine the originalquadratic equation.
Worked example 11: Finding an equation when the roots are given
QUESTION
Find an equation with roots 13 and −5.
SOLUTION
Step 1: Assign a variable and write roots as two equations
x = 13 or x = −5
Use additive inverses to get zero on the right-hand sides
x− 13 = 0 or x+ 5 = 0
Step 2: Write down as the product of two factors
(x− 13)(x+ 5) = 0
Notice that the signs in the brackets are opposite of the given roots.
Step 3: Expand the brackets
x2 − 8x− 65 = 0
Note that if each term in the equation is multiplied by a constant then there could beother possible equations which would have the same roots. For example,
Multiply by 2:2x2 − 16x− 130 = 0
Multiply by −3:−3x2 + 24x+ 195 = 0
50 2.5. Finding the equation

Worked example 12: Finding an equation when the roots are fractions
QUESTION
Find an equation with roots −32 and 4.
SOLUTION
Step 1: Assign a variable and write roots as two equations
x = 4 or x = −3
2
Use additive inverses to get zero on the right-hand sides.
x− 4 = 0 or x+3
2= 0
Multiply the second equation through by 2 to remove the fraction.
x− 4 = 0 or 2x+ 3 = 0
Step 2: Write down as the product of two factors
(2x+ 3)(x− 4) = 0
Step 3: Expand the brackets
The quadratic equation is 2x2 − 5x− 12 = 0.
Exercise 2 – 5: Finding the equation
1. Determine a quadratic equation for a graph that has roots 3 and −2.
2. Find a quadratic equation for a graph that has x-intercepts of (−4; 0) and (4; 0).
3. Determine a quadratic equation of the form ax2 + bx + c = 0, where a, b and care integers, that has roots −1
2 and 3.
4. Determine the value of k and the other root of the quadratic equation kx2−7x+4 = 0 given that one of the roots is x = 1.
5. One root of the equation 2x2 − 3x = p is 212 . Find p and the other root.
Think you got it? Get this answer and more practice on our Intelligent Practice Service
1. 228V 2. 228W 3. 228X 4. 228Y 5. 228Z
www.everythingmaths.co.za m.everythingmaths.co.za
51Chapter 2. Equations and inequalities

Exercise 2 – 6: Mixed exercises
Solve the following quadratic equations by either factorisation, using the quadraticformula or completing the square:
• Always try to factorise first, then use the formula if the trinomial cannot be fac-torised.
• In a test or examination, only use the method of completing the square whenspecifically asked.
• Answers can be left in surd or decimal form.
1. 24y2 + 61y − 8 = 0
2. 8x2 + 16x = 42
3. 9t2 = 24t− 12
4. −5y2 + 0y + 5 = 0
5. 3m2 + 12 = 15m
6. 49y2 + 0y − 25 = 0
7. 72 = 66w − 12w2
8. −40y2 + 58y − 12 = 0
9. 37n+ 72− 24n2 = 0
10. 6y2 + 7y − 24 = 0
11. 3 = x(2x− 5)
12. −18y2 − 55y − 25 = 0
13. −25y2 + 25y − 4 = 0
14. 8(1− 4g2) + 24g = 0
15. 9y2 − 13y − 10 = 0
16. (7p− 3)(5p+ 1) = 0
17. −81y2 − 99y − 18 = 0
18. 14y2 − 81y + 81 = 0
Think you got it? Get this answer and more practice on our Intelligent Practice Service
1. 2292 2. 2293 3. 2294 4. 2295 5. 2296 6. 22977. 2298 8. 2299 9. 229B 10. 229C 11. 229D 12. 229F
13. 229G 14. 229H 15. 229J 16. 229K 17. 229M 18. 229N
www.everythingmaths.co.za m.everythingmaths.co.za
2.6 Nature of roots EMBFP
Investigation:
1. Use the quadratic formula to determine the roots of the quadratic equations givenbelow and take special note of:
• the expression under the square root sign and
• the type of number for the final answer (rational/irrational/real/imaginary)
a) x2 − 6x+ 9 = 0
52 2.6. Nature of roots

b) x2 − 4x+ 3 = 0
c) x2 − 4x− 3 = 0
d) x2 − 4x+ 7 = 0
2. Choose the appropriate words from the table to describe the roots obtained forthe equations above.
rational unequal realimaginary not perfect square equal
perfect square irrational undefined
3. The expression under the square root, b2 − 4ac, is called the discriminant. Canyou make a conjecture about the relationship between the discriminant and theroots of quadratic equations?
The discriminant EMBFQ
The discriminant is defined as ∆ = b2 − 4ac
This is the expression under the square root in the quadratic formula. The discriminantdetermines the nature of the roots of a quadratic equation. The word ‘nature’ refers tothe types of numbers the roots can be — namely real, rational, irrational or imaginary.∆ is the Greek symbol for the letter D.
For a quadratic function f (x) = ax2 + bx+ c, the solutions to the equation f (x) = 0
are given by the formula x =−b±
√b2 − 4ac
2a=−b±
√∆
2a
• If ∆ < 0, then roots are imaginary (non-real) and beyond the scope of this book.
• If ∆ ≥ 0, the expression under the square root is non-negative and thereforeroots are real. For real roots, we have the following further possibilities.
• If ∆ = 0, the roots are equal and we can say that there is only one root.
• If ∆ > 0, the roots are unequal and there are two further possibilities.
• ∆ is the square of a rational number: the roots are rational.
• ∆ is not the square of a rational number: the roots are irrational and can beexpressed in decimal or surd form.
53Chapter 2. Equations and inequalities

∆
∆ < 0: imaginary/non-real roots ∆ ≥ 0: real roots
∆ = 0equal roots
∆ > 0unequal roots
∆ a squared ratio-
nal: rational roots
∆ not a squared
rational: irrational
roots
Nature of roots Discriminant a > 0 a < 0
Roots are non-real ∆ < 0
Roots are real andequal
∆ = 0
Roots are real andunequal:
• rationalroots
• irrationalroots
∆ > 0
• ∆ =squaredrational
• ∆ = notsquared ra-tional
See video: 229P at www.everythingmaths.co.za
Worked example 13: Nature of roots
QUESTION
Show that the roots of x2 − 2x− 7 = 0 are irrational.
SOLUTION
Step 1: Interpret the question
For roots to be real and irrational, we need to calculate ∆ and show that it is greaterthan zero and not a perfect square.
Step 2: Check that the equation is in standard form ax2 + bx+ c = 0
54 2.6. Nature of roots

x2 − 2x− 7 = 0
Step 3: Identify the coefficients to substitute into the formula for the discriminant
a = 1; b = −2; c = −7
Step 4: Write down the formula and substitute values
∆ = b2 − 4ac
= (−2)2 − 4(1)(−7)
= 4 + 28
= 32
We know that 32 > 0 and is not a perfect square.
The graph below shows the roots of the equation x2− 2x− 7 = 0. Note that the graphdoes not form part of the answer and is included for illustration purposes only.
2
4
6
8
−2
−4
−6
−8
2 4 6−2−4
x
f(x)
x2 − 2x− 7 = 0
0
Step 5: Write the final answer
We have calculated that ∆ > 0 and is not a perfect square, therefore we can concludethat the roots are real, unequal and irrational.
55Chapter 2. Equations and inequalities

Worked example 14: Nature of roots
QUESTION
For which value(s) of k will the roots of 6x2 + 6 = 4kx be real and equal?
SOLUTION
Step 1: Interpret the question
For roots to be real and equal, we need to solve for the value(s) of k such that ∆ = 0.
Step 2: Check that the equation is in standard form ax2 + bx+ c = 0
6x2 − 4kx+ 6 = 0
Step 3: Identify the coefficients to substitute into the formula for the discriminant
a = 6; b = −4k; c = 6
Step 4: Write down the formula and substitute values
∆ = b2 − 4ac
= (−4k)2 − 4(6)(6)
= 16k2 − 144
For roots to be real and equal, ∆ = 0.
∆ = 0
16k2 − 144 = 0
16(k2 − 9) = 0
(k − 3)(k + 3) = 0
Therefore k = 3 or k = −3.
Step 5: Check both answers by substituting back into the original equation
56 2.6. Nature of roots

For k = 3:
6x2 − 4(3)x+ 6 = 0
6x2 − 12x+ 6 = 0
x2 − 2x+ 1 = 0
(x− 1)(x− 1) = 0
(x− 1)2 = 0
Therefore x = 1
We see that for k = 3 the quadratic equation has real, equal roots x = 1.
For k = −3:
6x2 − 4(−3)x+ 6 = 0
6x2 + 12x+ 6 = 0
x2 + 2x+ 1 = 0
(x+ 1)(x+ 1) = 0
(x+ 1)2 = 0
Therefore x = −1
We see that for k = −3 the quadratic equation has real, equal roots x = −1.
Step 6: Write the final answer
For the roots of the quadratic equation to be real and equal, k = 3 or k = −3.
Worked example 15: Nature of roots
QUESTION
Show that the roots of (x+ h)(x+ k) = 4d2 are real for all real values of h, k and d.
SOLUTION
Step 1: Interpret the question
For roots to be real, we need to calculate ∆ and show that ∆ ≥ 0 for all real values ofh, k and d.
Step 2: Check that the equation is in standard form ax2 + bx+ c = 0
Expand the brackets and gather like terms
57Chapter 2. Equations and inequalities

(x+ h)(x+ k) = 4d2
x2 + hx+ kx+ hk − 4d2 = 0
x2 + (h+ k)x+ (hk − 4d2) = 0
Step 3: Identify the coefficients to substitute into the formula for the discriminant
a = 1; b = h+ k; c = hk − 4d2
Step 4: Write down the formula and substitute values
∆ = b2 − 4ac
= (h+ k)2 − 4(1)(hk − 4d2)
= h2 + 2hk + k2 − 4hk + 16d2
= h2 − 2hk + k2 + 16d2
= (h− k)2 + (4d)2
For roots to be real, ∆ ≥ 0.
We know that (4d)2 ≥ 0
and (h− k)2 ≥ 0
so then (h− k)2 + (4d)2 ≥ 0
therefore ∆ ≥ 0
Step 5: Write the final answer
We have shown that ∆ ≥ 0, therefore the roots are real for all real values of h, k andd.
Exercise 2 – 7: From past papers
1. Determine the nature of the roots for each of the following equations:
a) x2 + 3x = −2
b) x2 + 9 = 6x
c) 6y2 − 6y − 1 = 0
d) 4t2 − 19t− 5 = 0
e) z2 = 3
f) 0 = p2 + 5p+ 8
g) x2 = 36
h) 4m+m2 = 1
i) 11− 3x+ x2 = 0
j) y2 +1
4= y
2. Given: x2 + bx− 2 + k(x2 + 3x+ 2
)= 0, (k 6= −1)
a) Show that the discriminant is given by: ∆ = k2 + 6bk + b2 + 8
58 2.6. Nature of roots

b) If b = 0, discuss the nature of the roots of the equation.
c) If b = 2, find the value(s) of k for which the roots are equal.
[IEB, Nov. 2001, HG]
3. Show that k2x2 + 2 = kx− x2 has non-real roots for all real values for k.
[IEB, Nov. 2002, HG]
4. The equation x2 + 12x = 3kx2 + 2 has real roots.
a) Find the greatest value of value k such that k ∈ Z.
b) Find one rational value of k for which the above equation has rational roots.
[IEB, Nov. 2003, HG]
5. Consider the equation:
k =x2 − 4
2x− 5
where x 6= 52 .
a) Find a value of k for which the roots are equal.
b) Find an integer k for which the roots of the equation will be rational andunequal.
[IEB, Nov. 2004, HG]
6. a) Prove that the roots of the equation x2− (a+ b)x+ ab− p2 = 0 are real forall real values of a, b and p.
b) When will the roots of the equation be equal?
[IEB, Nov. 2005, HG]
7. If b and c can take on only the values 1, 2 or 3, determine all pairs (b; c) suchthat x2 + bx+ c = 0 has real roots.
[IEB, Nov. 2005, HG]
Think you got it? Get this answer and more practice on our Intelligent Practice Service
1a. 229Q 1b. 229R 1c. 229S 1d. 229T 1e. 229V 1f. 229W1g. 229X 1h. 229Y 1i. 229Z 1j. 22B2 2. 22B3 3. 22B44. 22B5 5. 22B6 6. 22B7 7. 22B8
www.everythingmaths.co.za m.everythingmaths.co.za
59Chapter 2. Equations and inequalities

2.7 Quadratic inequalities EMBFR
Quadratic inequalities can be of the following forms:
ax2 + bx+ c > 0
ax2 + bx+ c ≥ 0
ax2 + bx+ c < 0
ax2 + bx+ c ≤ 0
To solve a quadratic inequality we must determine which part of the graph of aquadratic function lies above or below the x-axis. An inequality can therefore besolved graphically using a graph or algebraically using a table of signs to determinewhere the function is positive and negative.
Worked example 16: Solving quadratic inequalities
QUESTION
Solve for x: x2 − 5x+ 6 ≥ 0
SOLUTION
Step 1: Factorise the quadratic
(x− 3)(x− 2) ≥ 0
Step 2: Determine the critical values of x
From the factorised quadratic we see that the values for which the inequality is equalto zero are x = 3 and x = 2. These are called the critical values of the inequality andthey are used to complete a table of signs.
Step 3: Complete a table of signs
We must determine where each factor of the inequality is positive and negative on thenumber line:
• to the left (in the negative direction) of the critical value
• equal to the critical value
• to the right (in the positive direction) of the critical value
In the final row of the table we determine where the inequality is positive and negativeby finding the product of the factors and their respective signs.
60 2.7. Quadratic inequalities

Critical values x = 2 x = 3
x− 3 − − − 0 +
x− 2 − 0 + + +
f(x) = (x− 3)(x− 2) + 0 − 0 +
From the table we see that f(x) is greater than or equal to zero for x ≤ 2 or x ≥ 3.
Step 4: A rough sketch of the graph
The graph below does not form part of the answer and is included for illustration pur-poses only. A graph of the quadratic helps us determine the answer to the inequality.We can find the answer graphically by seeing where the graph lies above or below thex-axis.
• From the standard form, x2 − 5x+ 6, a > 0 and therefore the graph is a “smile”and has a minimum turning point.
• From the factorised form, (x− 3)(x− 2), we know the x-intercepts are (2; 0) and(3; 0).
1
2
3
4
5
1 2 3 4 5
x
y
y = x2 − 5x+ 6
The graph is above or on the x-axis for x ≤ 2 or x ≥ 3.
Step 5: Write the final answer and represent on a number line
x2 − 5x+ 6 ≥ 0 for x ≤ 2 or x ≥ 3
1 2 3 4
b b
61Chapter 2. Equations and inequalities

Worked example 17: Solving quadratic inequalities
QUESTION
Solve for x: 4x2 − 4x+ 1 ≤ 0
SOLUTION
Step 1: Factorise the quadratic
(2x− 1)(2x− 1) ≤ 0
(2x− 1)2 ≤ 0
Step 2: Determine the critical values of x
From the factorised quadratic we see that the value for which the inequality is equal tozero is x = 1
2 . We know that a2 > 0 for any real number a, a 6= 0, so then (2x − 1)2
will never be negative.
Step 3: A rough sketch of the graph
The graph below does not form part of the answer and is included for illustrationpurposes only.
• From the standard form, 4x2− 4x+ 1, a > 0 and therefore the graph is a “smile”and has a minimum turning point.
• From the factorised form, (2x−1)(2x−1), we know there is only one x-interceptat(12 ; 0).
1
2
3
4
1 2
x
y
y = 4x2 − 4x+ 1
0
Notice that no part of the graph lies below the x-axis.
Step 4: Write the final answer and represent on a number line
4x2 − 4x+ 1 ≤ 0 for x =1
2
−2 −1 0 1 2
b
62 2.7. Quadratic inequalities
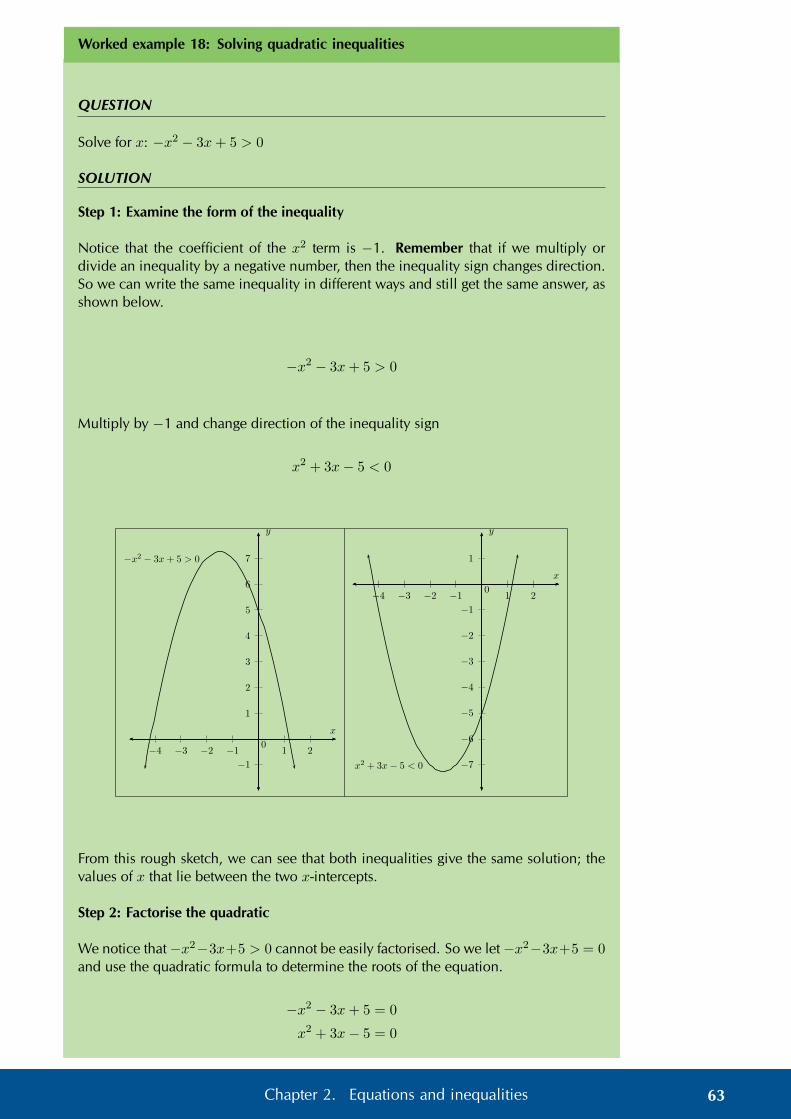
Worked example 18: Solving quadratic inequalities
QUESTION
Solve for x: −x2 − 3x+ 5 > 0
SOLUTION
Step 1: Examine the form of the inequality
Notice that the coefficient of the x2 term is −1. Remember that if we multiply ordivide an inequality by a negative number, then the inequality sign changes direction.So we can write the same inequality in different ways and still get the same answer, asshown below.
−x2 − 3x+ 5 > 0
Multiply by −1 and change direction of the inequality sign
x2 + 3x− 5 < 0
1
2
3
4
5
6
7
−1
1 2−1−2−3−4
x
y
−x2 − 3x+ 5 > 0
0
1
−1
−2
−3
−4
−5
−6
−7
1 2−1−2−3−4
x
y
x2 + 3x− 5 < 0
0
From this rough sketch, we can see that both inequalities give the same solution; thevalues of x that lie between the two x-intercepts.
Step 2: Factorise the quadratic
We notice that−x2−3x+5 > 0 cannot be easily factorised. So we let−x2−3x+5 = 0and use the quadratic formula to determine the roots of the equation.
−x2 − 3x+ 5 = 0
x2 + 3x− 5 = 0
63Chapter 2. Equations and inequalities
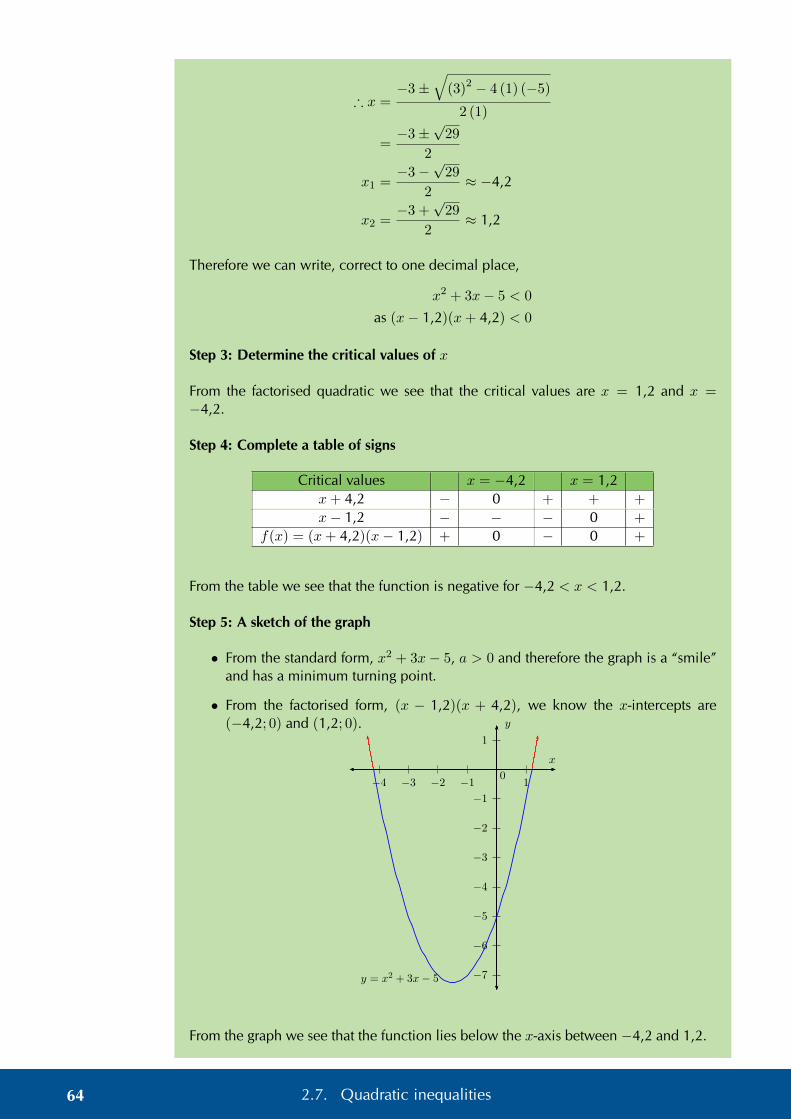
∴ x =−3±
√(3)2 − 4 (1) (−5)
2 (1)
=−3±
√29
2
x1 =−3−
√29
2≈ −4,2
x2 =−3 +
√29
2≈ 1,2
Therefore we can write, correct to one decimal place,
x2 + 3x− 5 < 0
as (x− 1,2)(x+ 4,2) < 0
Step 3: Determine the critical values of x
From the factorised quadratic we see that the critical values are x = 1,2 and x =−4,2.
Step 4: Complete a table of signs
Critical values x = −4,2 x = 1,2x+ 4,2 − 0 + + +
x− 1,2 − − − 0 +
f(x) = (x+ 4,2)(x− 1,2) + 0 − 0 +
From the table we see that the function is negative for −4,2 < x < 1,2.
Step 5: A sketch of the graph
• From the standard form, x2 + 3x− 5, a > 0 and therefore the graph is a “smile”and has a minimum turning point.
• From the factorised form, (x − 1,2)(x + 4,2), we know the x-intercepts are(−4,2; 0) and (1,2; 0).
1
−1
−2
−3
−4
−5
−6
−7
1−1−2−3−4
x
y
y = x2 + 3x− 5
0
From the graph we see that the function lies below the x-axis between −4,2 and 1,2.
64 2.7. Quadratic inequalities

Step 6: Write the final answer and represent on a number line
x2 + 3x− 5 < 0 for − 4,2 < x < 1,2
−5 −4 −3 −2 −1 0 1 2
−4,2 1,2
Important: When working with an inequality in which the variable is in the denomi-nator, a different approach is needed. Always remember to check for restrictions.
Worked example 19: Solving quadratic inequalities with fractions
QUESTION
Solve for x:
1.2
x+ 3=
1
x− 3, x 6= ±3
2.2
x+ 3≤ 1
x− 3, x 6= ±3
SOLUTION
Step 1: Solving the equation
To solve this equation we multiply both sides of the equation by (x + 3)(x − 3) andsimplfy:
2
x+ 3× (x+ 3)(x− 3) =
1
x− 3× (x+ 3)(x− 3)
2(x− 3) = x+ 3
2x− 6 = x+ 3
x = 9
Step 2: Solving the inequality
It is very important to recognise that we cannot use the same method as above to solvethe inequality. If we multiply or divide an inequality by a negative number, then theinequality sign changes direction. We must rather simplify the inequality to have alowest common denominator and use a table of signs to determine the values thatsatisfy the inequality.
65Chapter 2. Equations and inequalities

Step 3: Subtract1
x− 3from both sides of the inequality
2
x+ 3− 1
x− 3≤ 0
Step 4: Determine the lowest common denominator and simplify the fraction
2(x− 3)− (x+ 3)
(x+ 3)(x− 3)≤ 0
x− 9
(x+ 3)(x− 3)≤ 0
Keep the denominator because it affects the final answer.
Step 5: Determine the critical values of x
From the factorised inequality we see that the critical values are x = −3, x = 3 andx = 9.
Step 6: Complete a table of signs
Critical values x = −3 x = 3 x = 9
x+ 3 − undef + + + + +
x− 3 − − − undef + + +
x− 9 − − − − − 0 +
f(x) =x− 9
(x+ 3)(x− 3)− undef + undef − 0 +
From the table we see that the function is less than or equal to zero for x < −3 or3 < x ≤ 9. We do not include x = −3 or x = 3 in the solution because of therestrictions on the denominator.
Step 7: Write the final answer and represent on a number line
x < −3 or 3 < x ≤ 9
−3 −2 −1 0 1 2 3 4 5 6 7 8 9
b
66 2.7. Quadratic inequalities
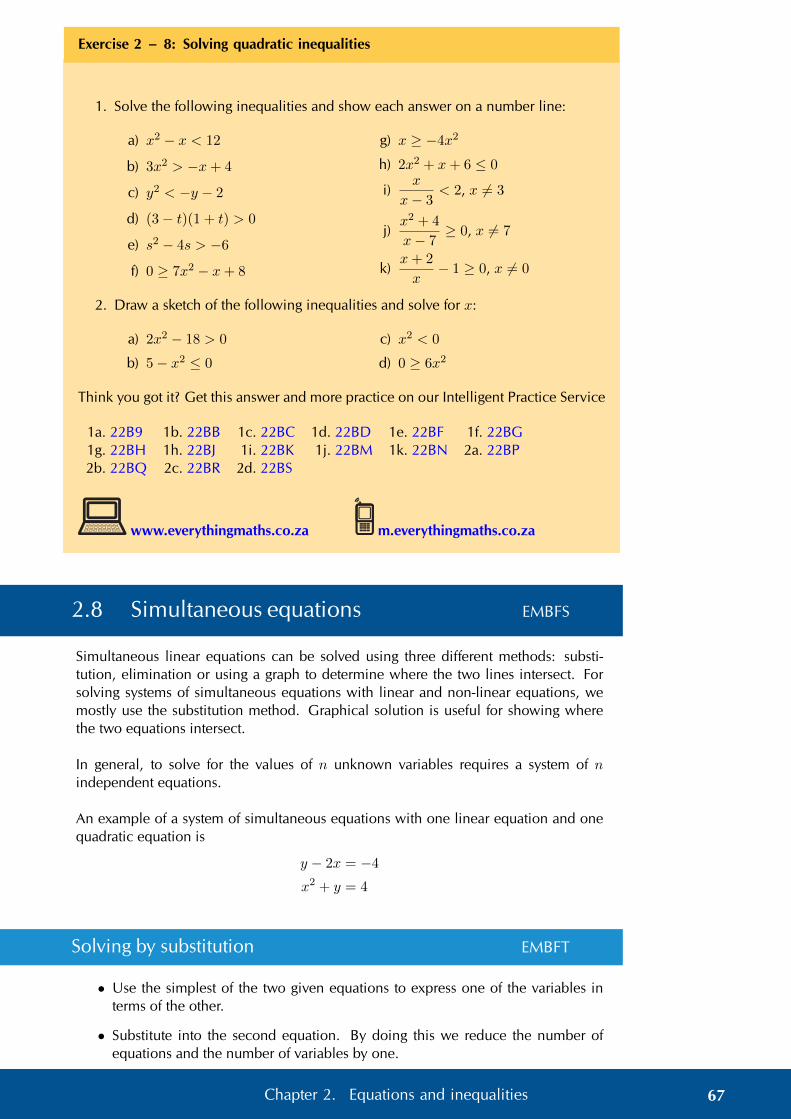
Exercise 2 – 8: Solving quadratic inequalities
1. Solve the following inequalities and show each answer on a number line:
a) x2 − x < 12
b) 3x2 > −x+ 4
c) y2 < −y − 2
d) (3− t)(1 + t) > 0
e) s2 − 4s > −6
f) 0 ≥ 7x2 − x+ 8
g) x ≥ −4x2
h) 2x2 + x+ 6 ≤ 0
i)x
x− 3< 2, x 6= 3
j)x2 + 4
x− 7≥ 0, x 6= 7
k)x+ 2
x− 1 ≥ 0, x 6= 0
2. Draw a sketch of the following inequalities and solve for x:
a) 2x2 − 18 > 0
b) 5− x2 ≤ 0
c) x2 < 0
d) 0 ≥ 6x2
Think you got it? Get this answer and more practice on our Intelligent Practice Service
1a. 22B9 1b. 22BB 1c. 22BC 1d. 22BD 1e. 22BF 1f. 22BG1g. 22BH 1h. 22BJ 1i. 22BK 1j. 22BM 1k. 22BN 2a. 22BP2b. 22BQ 2c. 22BR 2d. 22BS
www.everythingmaths.co.za m.everythingmaths.co.za
2.8 Simultaneous equations EMBFS
Simultaneous linear equations can be solved using three different methods: substi-tution, elimination or using a graph to determine where the two lines intersect. Forsolving systems of simultaneous equations with linear and non-linear equations, wemostly use the substitution method. Graphical solution is useful for showing wherethe two equations intersect.
In general, to solve for the values of n unknown variables requires a system of nindependent equations.
An example of a system of simultaneous equations with one linear equation and onequadratic equation is
y − 2x = −4
x2 + y = 4
Solving by substitution EMBFT
• Use the simplest of the two given equations to express one of the variables interms of the other.
• Substitute into the second equation. By doing this we reduce the number ofequations and the number of variables by one.
67Chapter 2. Equations and inequalities

• We now have one equation with one unknown variable which can be solved.
• Use the solution to substitute back into the first equation to find the value of theother unknown variable.
Worked example 20: Simultaneous equations
QUESTION
Solve for x and y:y − 2x = −4 . . . (1)x2 + y = 4 . . . (2)
SOLUTION
Step 1: Make y the subject of the first equation
y = 2x− 4
Step 2: Substitute into the second equation and simplify
x2 + (2x− 4) = 4
x2 + 2x− 8 = 0
Step 3: Factorise the equation
(x+ 4) (x− 2) = 0
∴ x = −4 or x = 2
Step 4: Substitute the values of x back into the first equation to determine the corre-sponding y-values
If x = −4:
y = 2(−4)− 4
= −12
If x = 2:
y = 2(2)− 4
= 0
Step 5: Check that the two points satisfy both original equations
68 2.8. Simultaneous equations
Step 6: Write the final answer
The solution is x = −4 and y = −12 or x = 2 and y = 0. These are the coordinatepairs for the points of intersection as shown below.
2
4
6
−2
−4
−6
−8
−10
−12
−14
2 4 6−2−4−6
y=
2x− 4
y=
4−x2
(−4;−12)
x
y
b
b
Solving by elimination EMBFV
• Make one of the variables the subject of both equations.
• Equate the two equations; by doing this we reduce the number of equations andthe number of variables by one.
• We now have one equation with one unknown variable which can be solved.
• Use the solution to substitute back into either original equation, to find the cor-responding value of the other unknown variable.
Worked example 21: Simultaneous equations
QUESTION
Solve for x and y:y = x2 − 6x . . . (1)
y + 12x− 3 = 0 . . . (2)
SOLUTION
Step 1: Make y the subject of the second equation
y +1
2x− 3 = 0
y = −1
2x+ 3
69Chapter 2. Equations and inequalities

Step 2: Equate the two equations and solve for x
x2 − 6x = −1
2x+ 3
x2 − 6x+1
2x− 3 = 0
2x2 − 12x+ x− 6 = 0
2x2 − 11x− 6 = 0
(2x+ 1)(x− 6) = 0
Therefore x = −1
2or x = 6
Step 3: Substitute the values for x back into the second equation to calculate thecorresponding y-values
If x = −1
2:
y = −1
2
(−1
2
)+ 3
∴ y = 31
4
This gives the point(−1
2; 3
1
4
).
If x = 6: y = −1
2(6) + 3
= −3 + 3
∴ y = 0
This gives the point (6; 0).
Step 4: Check that the two points satisfy both original equations
Step 5: Write the final answer
The solution is x = −1
2and y = 3
1
4or x = 6 and y = 0. These are the coordinate
pairs for the points of intersection as shown below.
2
4
−2
−4
−6
−8
1 2 3 4 5 6 7−1
x
y
y = x2 − 6x
y = 12x+ 3
(
−12 ; 3
14
)
70 2.8. Simultaneous equations
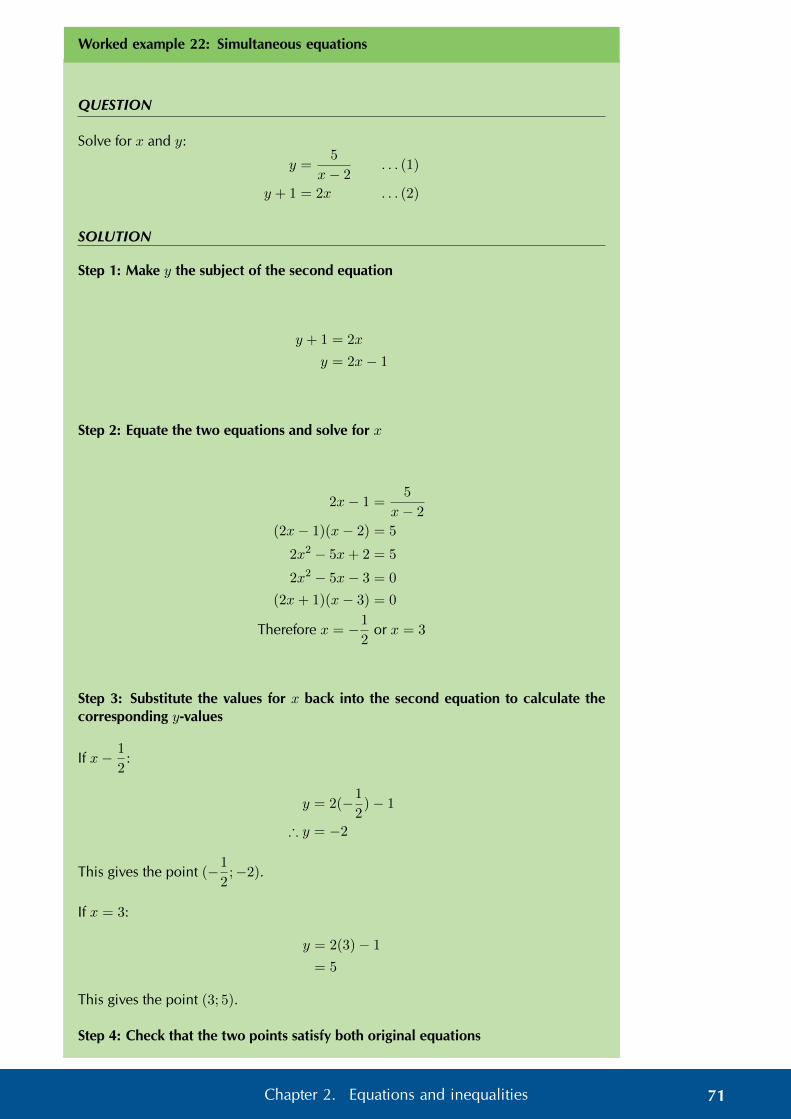
Worked example 22: Simultaneous equations
QUESTION
Solve for x and y:
y =5
x− 2. . . (1)
y + 1 = 2x . . . (2)
SOLUTION
Step 1: Make y the subject of the second equation
y + 1 = 2x
y = 2x− 1
Step 2: Equate the two equations and solve for x
2x− 1 =5
x− 2
(2x− 1)(x− 2) = 5
2x2 − 5x+ 2 = 5
2x2 − 5x− 3 = 0
(2x+ 1)(x− 3) = 0
Therefore x = −1
2or x = 3
Step 3: Substitute the values for x back into the second equation to calculate thecorresponding y-values
If x− 1
2:
y = 2(−1
2)− 1
∴ y = −2
This gives the point (−1
2;−2).
If x = 3:
y = 2(3)− 1
= 5
This gives the point (3; 5).
Step 4: Check that the two points satisfy both original equations
71Chapter 2. Equations and inequalities

Step 5: Write the final answer
The solution is x = −1
2and y = −2 or x = 3 and y = 5. These are the coordinate
pairs for the points of intersection as shown below.
2
4
−2
−4
1 2 3 4 5−1−2
x
y y = 2x− 1
y = 5x−2
Solving graphically EMBFW
• Make y the subject of each equation.
• Draw the graph of each equation on the same system of axes.
• The final solutions to the system of equations are the coordinates of the pointswhere the two graphs intersect.
Worked example 23: Simultaneous equations
QUESTION
Solve graphically for x and y:
y + x2 = 1 . . . (1)
y − x+ 5 = 0 . . . (2)
SOLUTION
Step 1: Make y the subject of both equations
For the first equation we have
y + x2 = 1
y = −x2 + 1
and for the second equation
72 2.8. Simultaneous equations

y − x+ 5 = 0
y = x− 5
Step 2: Draw the straight line graph and parabola on the same system of axes
2
−2
−4
−6
−8
−10
2 4−2−4
x
y
y = −x2 + 1
y = x− 5
0
b
b
Step 3: Determine where the two graphs intersect
From the diagram we see that the graphs intersect at (−3;−8) and (2;−3).
Step 4: Check that the two points satisfy both original equations
Step 5: Write the final answer
The solutions to the system of simultaneous equations are (−3;−8) and (2;−3).
Exercise 2 – 9: Solving simultaneous equations
1. Solve the following systems of equations algebraically. Leave your answer insurd form, where appropriate.
a) y + x = 5
y − x2 + 3x− 5 = 0
b) y = 6− 5x+ x2
y − x+ 1 = 0
c) y =2x+ 2
4y − 2x2 + 3x+ 5 = 0
d) a− 2b− 3 = 0; a− 3b2 + 4 = 0
e) x2 − y + 2 = 3x
4x = 8 + y
f) 2y + x2 + 25 = 7x
3x = 6y + 96
73Chapter 2. Equations and inequalities

2. Solve the following systems of equations graphically. Check your solutions byalso solving algebraically.
a) x2 − 1− y = 0
y + x− 5 = 0
b) x+ y − 10 = 0
x2 − 2− y = 0
c) xy = 12
7 = x+ y
d) 6− 4x− y = 0
12− 2x2 − y = 0
Think you got it? Get this answer and more practice on our Intelligent Practice Service
1a. 22BT 1b. 22BV 1c. 22BW 1d. 22BX 1e. 22BY 1f. 22BZ2a. 22C2 2b. 22C3 2c. 22C4 2d. 22C5
www.everythingmaths.co.za m.everythingmaths.co.za
2.9 Word problems EMBFX
Solving word problems requires using mathematical language to describe real-life con-texts. Problem-solving strategies are often used in the natural sciences and engineeringdisciplines (such as physics, biology, and electrical engineering) but also in the socialsciences (such as economics, sociology and political science). To solve word problemswe need to write a set of equations that describes the problem mathematically.
Examples of real-world problem solving applications are:
• modelling population growth;
• modelling effects of air pollution;
• modelling effects of global warming;
• computer games;
• in the sciences, to understand how the natural world works;
• simulators that are used to train people in certain jobs, such as pilots, doctorsand soldiers;
• in medicine, to track the progress of a disease.
See video: 22C6 at www.everythingmaths.co.za
74 2.9. Word problems

Problem solving strategy EMBFY
1. Read the problem carefully.
2. What is the question and what do we need to solve for?
3. Assign variables to the unknown quantities, for example, x and y.
4. Translate the words into algebraic expressions by rewriting the given informationin terms of the variables.
5. Set up a system of equations.
6. Solve for the variables using substitution.
7. Check the solution.
8. Write the final answer.
Investigation: Simple word problems
Write an equation that describes the following real-world situations mathematically:
1. Mohato and Lindiwe both have colds. Mohato sneezes twice for each sneeze ofLindiwe’s. If Lindiwe sneezes x times, write an equation describing how manytimes they both sneezed.
2. The difference of two numbers is 10 and the sum of their squares is 50. Find thetwo numbers.
3. Liboko builds a rectangular storeroom. If the diagonal of the room is√
1312 mand the perimeter is 80 m, determine the dimensions of the room.
4. It rains half as much in July as it does in December. If it rains y mm in July, writean expression relating the rainfall in July and December.
5. Zane can paint a room in 4 hours. Tlali can paint a room in 2 hours. How longwill it take both of them to paint a room together?
6. 25 years ago, Arthur was 5 years more than a third of Bongani’s age. Today,Bongani is 26 years less than twice Arthur’s age. How old is Bongani?
7. The product of two integers is 95. Find the integers if their total is 24.
75Chapter 2. Equations and inequalities
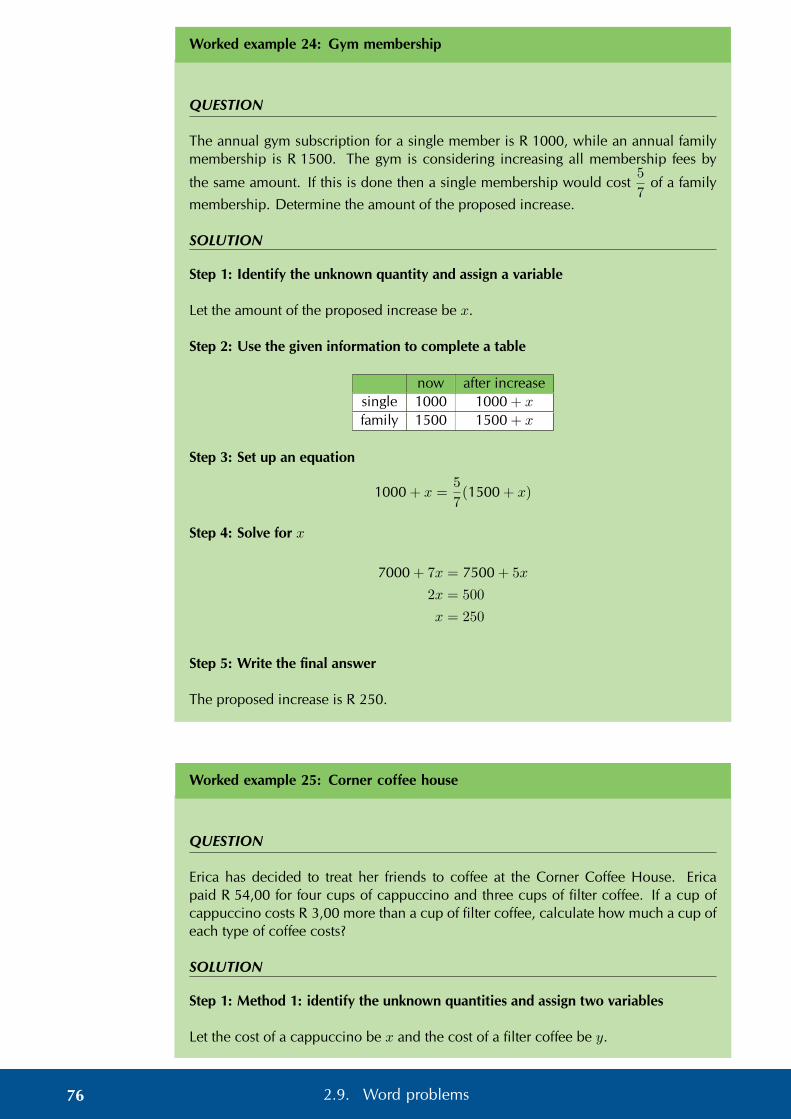
Worked example 24: Gym membership
QUESTION
The annual gym subscription for a single member is R 1000, while an annual familymembership is R 1500. The gym is considering increasing all membership fees by
the same amount. If this is done then a single membership would cost5
7of a family
membership. Determine the amount of the proposed increase.
SOLUTION
Step 1: Identify the unknown quantity and assign a variable
Let the amount of the proposed increase be x.
Step 2: Use the given information to complete a table
now after increasesingle 1000 1000 + x
family 1500 1500 + x
Step 3: Set up an equation
1000 + x =5
7(1500 + x)
Step 4: Solve for x
7000 + 7x = 7500 + 5x
2x = 500
x = 250
Step 5: Write the final answer
The proposed increase is R 250.
Worked example 25: Corner coffee house
QUESTION
Erica has decided to treat her friends to coffee at the Corner Coffee House. Ericapaid R 54,00 for four cups of cappuccino and three cups of filter coffee. If a cup ofcappuccino costs R 3,00 more than a cup of filter coffee, calculate how much a cup ofeach type of coffee costs?
SOLUTION
Step 1: Method 1: identify the unknown quantities and assign two variables
Let the cost of a cappuccino be x and the cost of a filter coffee be y.
76 2.9. Word problems

Step 2: Use the given information to set up a system of equations
4x+ 3y = 54 . . . (1)
x = y + 3 . . . (2)
Step 3: Solve the equations by substituting the second equation into the first equation
4(y + 3) + 3y = 54
4y + 12 + 3y = 54
7y = 42
y = 6
If y = 6, then using the second equation we have
x = y + 3
= 6 + 3
= 9
Step 4: Check that the solution satisfies both original equations
Step 5: Write the final answer
A cup of cappuccino costs R 9 and a cup of filter coffee costs R 6.
Step 6: Method 2: identify the unknown quantities and assign one variable
Let the cost of a cappuccino be x and the cost of a filter coffee be x− 3.
Step 7: Use the given information to set up an equation
4x+ 3(x− 3) = 54
Step 8: Solve for x
4x+ 3(x− 3) = 54
4x+ 3x− 9 = 54
7x = 63
x = 9
Step 9: Write the final answer
A cup of cappuccino costs R 9 and a cup of filter coffee costs R 6.
77Chapter 2. Equations and inequalities

Worked example 26: Taps filling a container
QUESTION
Two taps, one more powerful than the other, are used to fill a container. Workingon its own, the less powerful tap takes 2 hours longer than the other tap to fill thecontainer. If both taps are opened, it takes 1 hour, 52 minutes and 30 seconds to fillthe container. Determine how long it takes the less powerful tap to fill the containeron its own.
SOLUTION
Step 1: Identify the unknown quantities and assign variables
Let the time taken for the less powerful tap to fill the container be x and let the timetaken for the more powerful tap be x− 2.
Step 2: Convert all units of time to be the same
First we must convert 1 hour, 52 minutes and 30 seconds to hours:
1 +52
60+
30
(60)2= 1,875 hours
Step 3: Use the given information to set up a system of equations
Write an equation describing the two taps working together to fill the container:
1
x+
1
x− 2=
1
1,875
Step 4: Multiply the equation through by the lowest common denominator and sim-plify
1,875(x− 2) + 1,875x = x(x− 2)
1,875x− 3,75 + 1,875x = x2 − 2x
0 = x2 − 5,75x+ 3,75
Multiply the equation through by 4 to make it easier to factorise (or use the quadraticformula)
0 = 4x2 − 23x+ 15
0 = (4x− 3)(x− 5)
Therefore x = 34 or x = 5.
We have calculated that the less powerful tap takes 34 hours or 5 hours to fill the
container, but we know that when both taps are opened it takes 1,875 hours. We can
therefore discard the first solution x =3
4hours.
78 2.9. Word problems

So the less powerful tap fills the container in 5 hours and the more powerful tap takes3 hours.
Step 5: Check that the solution satisfies the original equation
Step 6: Write the final answer
The less powerful tap fills the container in 5 hours and the more powerful tap takes 3hours.
Exercise 2 – 10:
1. Mr. Tsilatsila builds a fence around his rectangular vegetable garden of 8 m2.If the length is twice the breadth, determine the dimensions of Mr. Tsilatsila’svegetable garden.
2. Kevin has played a few games of ten-pin bowling. In the third game, Kevinscored 80 more than in the second game. In the first game Kevin scored 110 lessthan the third game. His total score for the first two games was 208. If he wantsan average score of 146, what must he score on the fourth game?
3. When an object is dropped or thrown downward, the distance, d, that it falls intime, t, is described by the following equation:
s = 5t2 + v0t
In this equation, v0 is the initial velocity, in m·s−1. Distance is measured inmeters and time is measured in seconds. Use the equation to find how long ittakes a tennis ball to reach the ground if it is thrown downward from a hot-airballoon that is 500 m high. The tennis ball is thrown at an initial velocity of5 m·s−1.
4. The table below lists the times that Sheila takes to walk the given distances.
time (minutes) 5 10 15 20 25 30distance (km) 1 2 3 4 5 6
Plot the points.
Find the equation that describes the relationship between time and distance.Then use the equation to answer the following questions:
a) How long will it take Sheila to walk 21 km?
b) How far will Sheila walk in 7 minutes?
If Sheila were to walk half as fast as she is currently walking, what would thegraph of her distances and times look like?
5. The power P (in watts) supplied to a circuit by a 12 volt battery is given by theformula P = 12I − 0,5I2 where I is the current in amperes.
a) Since both power and current must be greater than 0, find the limits of thecurrent that can be drawn by the circuit.
79Chapter 2. Equations and inequalities

b) Draw a graph of P = 12I − 0,5I2 and use your answer to the first questionto define the extent of the graph.
c) What is the maximum current that can be drawn?
d) From your graph, read off how much power is supplied to the circuit whenthe current is 10 A. Use the equation to confirm your answer.
e) At what value of current will the power supplied be a maximum?
6. A wooden block is made as shown in the diagram. The ends are right-angledtriangles having sides 3x, 4x and 5x. The length of the block is y. The totalsurface area of the block is 3600 cm2.
y
3x 4x
5x
Show that
y = 300−x2x
Think you got it? Get this answer and more practice on our Intelligent Practice Service
1. 22C7 2. 22C8 3. 22C9 4. 22CB 5. 22CC 6. 22CD
www.everythingmaths.co.za m.everythingmaths.co.za
2.10 Summary EMBFZ
See presentation: 22CF at www.everythingmaths.co.za
• Zero product law: if a× b = 0, then a = 0 and/or b = 0.
• Quadratic formula: x =−b±
√b2 − 4ac
2a
• Discriminant: ∆ = b2 − 4ac
80 2.10. Summary

Nature of roots DiscriminantRoots are non-real ∆ < 0
Roots are real and equal ∆ = 0
Roots are real and unequal:
– Rational roots
– Irrational roots
∆ > 0
– ∆ = squared rational number
– ∆ = not squared rational num-ber
Exercise 2 – 11: End of chapter exercises
1. Solve: x2 − x− 1 = 0. Give your answer correct to two decimal places.
2. Solve: 16 (x+ 1) = x2 (x+ 1)
3. Solve: y2 + 3 +12
y2 + 3= 7
4. Solve for x: 2x4 − 5x2 − 12 = 0
5. Solve for x:
a) x (x− 9) + 14 = 0
b) x2 − x = 3 (correct to one decimal place)
c) x+ 2 = 6x (correct to two decimal places)
d)1
x+ 1+
2x
x− 1= 1
6. Solve for x in terms of p by completing the square: x2 − px− 4 = 0
7. The equation ax2 + bx + c = 0 has roots x =2
3and x = −4. Find one set of
possible values for a, b and c.
8. The two roots of the equation 4x2 + px− 9 = 0 differ by 5. Calculate the valueof p.
9. An equation of the form x2 + bx+ c = 0 is written on the board. Saskia and Svencopy it down incorrectly. Saskia has a mistake in the constant term and obtainsthe solutions −4 and 2. Sven has a mistake in the coefficient of x and obtainsthe solutions 1 and −15. Determine the correct equation that was on the board.
10. For which values of b will the expressionb2 − 5b+ 6
b+ 2be:
a) undefined?
b) equal to zero?
11. Given(x2 − 6)(2x+ 1)
x+ 2= 0 solve for x if:
a) x is a real number.
b) x is a rational number.
c) x is an irrational number.
d) x is an integer.
81Chapter 2. Equations and inequalities

12. Given(x− 6)
12
x2 + 3, for which value(s) of x will the expression be:
a) equal to zero?
b) defined?
13. Solve for a if
√8− 2a
a− 3≥ 0.
14. Abdoul stumbled across the following formula to solve the quadratic equationax2 + bx+ c = 0 in a foreign textbook.
x =2c
−b±√b2 − 4ac
a) Use this formula to solve the equation: 2x2 + x− 3 = 0.
b) Solve the equation again, using factorisation, to see if the formula works forthis equation.
c) Trying to derive this formula to prove that it always works, Abdoul got stuckalong the way. His attempt is shown below:
ax2 + bx+ c = 0
a+b
x+
c
x2= 0 Divided by x2 where x 6= 0
c
x2+b
x+ a = 0 Rearranged
1
x2+
b
cx+a
c= 0 Divided by c where c 6= 0
1
x2+
b
cx= −a
cSubtracted a
c from both sides
∴1
x2+
b
cx+ . . . Got stuck
Complete his derivation.
15. Solve for x:
a)4
x− 3≤ 1
b)4
(x− 3)2< 1
c)2x− 2
x− 3> 3
d)−3
(x− 3) (x+ 1)< 0
e) (2x− 3)2 < 4
f) 2x ≤ 15− xx
g)x2 + 3
3x− 2≤ 0
h) x− 2 ≥ 3
x
i)x2 + 3x− 4
5 + x4≤ 0
j)x− 2
3− x≥ 1
82 2.10. Summary
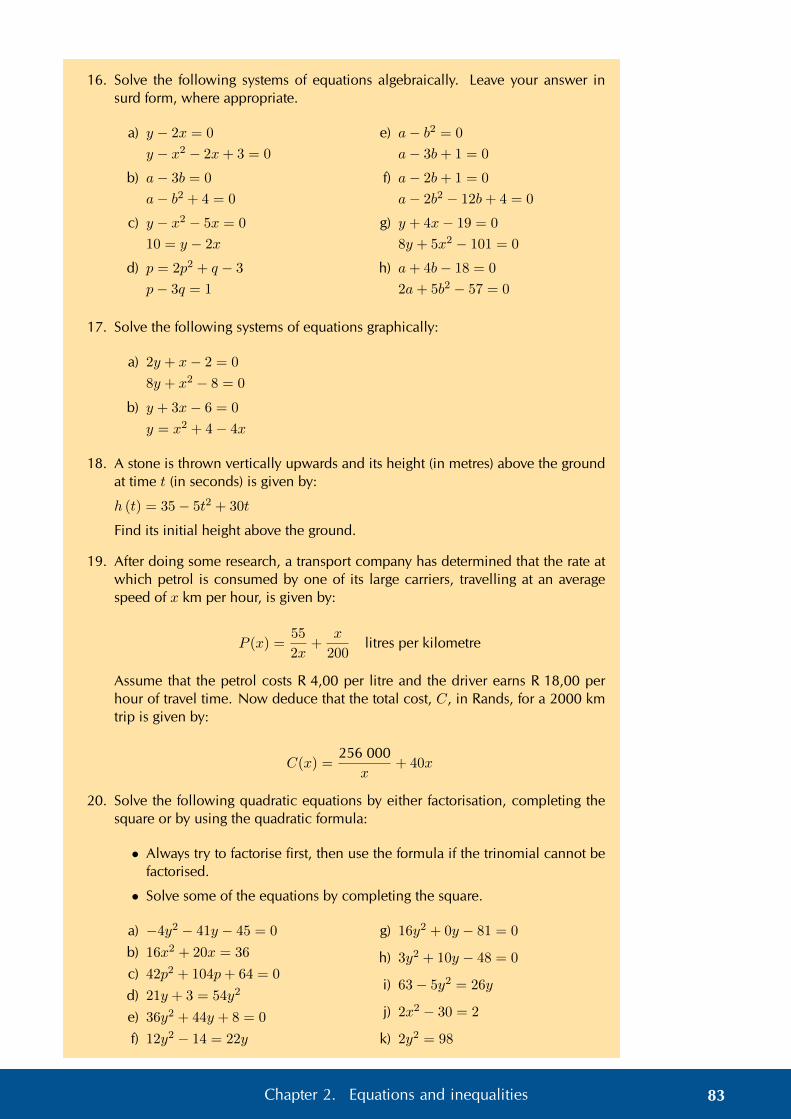
16. Solve the following systems of equations algebraically. Leave your answer insurd form, where appropriate.
a) y − 2x = 0
y − x2 − 2x+ 3 = 0
b) a− 3b = 0
a− b2 + 4 = 0
c) y − x2 − 5x = 0
10 = y − 2x
d) p = 2p2 + q − 3
p− 3q = 1
e) a− b2 = 0
a− 3b+ 1 = 0
f) a− 2b+ 1 = 0
a− 2b2 − 12b+ 4 = 0
g) y + 4x− 19 = 0
8y + 5x2 − 101 = 0
h) a+ 4b− 18 = 0
2a+ 5b2 − 57 = 0
17. Solve the following systems of equations graphically:
a) 2y + x− 2 = 0
8y + x2 − 8 = 0
b) y + 3x− 6 = 0
y = x2 + 4− 4x
18. A stone is thrown vertically upwards and its height (in metres) above the groundat time t (in seconds) is given by:
h (t) = 35− 5t2 + 30t
Find its initial height above the ground.
19. After doing some research, a transport company has determined that the rate atwhich petrol is consumed by one of its large carriers, travelling at an averagespeed of x km per hour, is given by:
P (x) =55
2x+
x
200litres per kilometre
Assume that the petrol costs R 4,00 per litre and the driver earns R 18,00 perhour of travel time. Now deduce that the total cost, C, in Rands, for a 2000 kmtrip is given by:
C(x) =256 000
x+ 40x
20. Solve the following quadratic equations by either factorisation, completing thesquare or by using the quadratic formula:
• Always try to factorise first, then use the formula if the trinomial cannot befactorised.
• Solve some of the equations by completing the square.
a) −4y2 − 41y − 45 = 0
b) 16x2 + 20x = 36
c) 42p2 + 104p+ 64 = 0
d) 21y + 3 = 54y2
e) 36y2 + 44y + 8 = 0
f) 12y2 − 14 = 22y
g) 16y2 + 0y − 81 = 0
h) 3y2 + 10y − 48 = 0
i) 63− 5y2 = 26y
j) 2x2 − 30 = 2
k) 2y2 = 98
83Chapter 2. Equations and inequalities
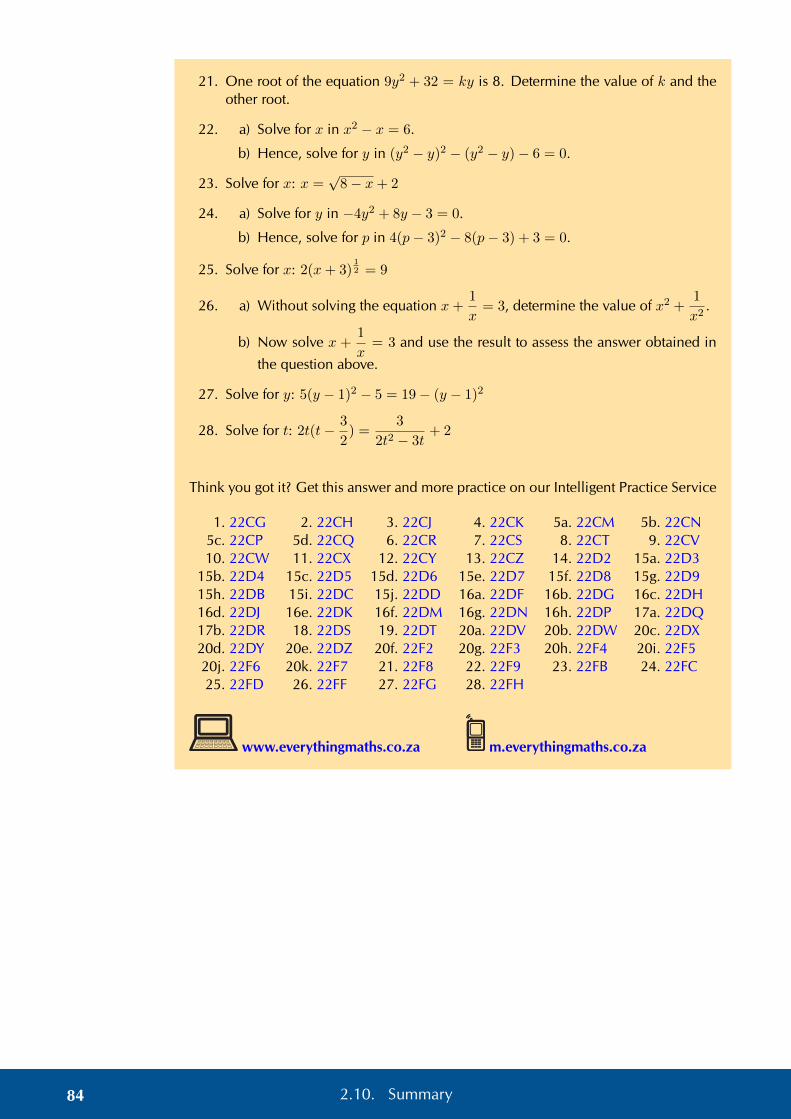
21. One root of the equation 9y2 + 32 = ky is 8. Determine the value of k and theother root.
22. a) Solve for x in x2 − x = 6.
b) Hence, solve for y in (y2 − y)2 − (y2 − y)− 6 = 0.
23. Solve for x: x =√
8− x+ 2
24. a) Solve for y in −4y2 + 8y − 3 = 0.
b) Hence, solve for p in 4(p− 3)2 − 8(p− 3) + 3 = 0.
25. Solve for x: 2(x+ 3)12 = 9
26. a) Without solving the equation x+1
x= 3, determine the value of x2 +
1
x2.
b) Now solve x +1
x= 3 and use the result to assess the answer obtained in
the question above.
27. Solve for y: 5(y − 1)2 − 5 = 19− (y − 1)2
28. Solve for t: 2t(t− 3
2) =
3
2t2 − 3t+ 2
Think you got it? Get this answer and more practice on our Intelligent Practice Service
1. 22CG 2. 22CH 3. 22CJ 4. 22CK 5a. 22CM 5b. 22CN5c. 22CP 5d. 22CQ 6. 22CR 7. 22CS 8. 22CT 9. 22CV10. 22CW 11. 22CX 12. 22CY 13. 22CZ 14. 22D2 15a. 22D3
15b. 22D4 15c. 22D5 15d. 22D6 15e. 22D7 15f. 22D8 15g. 22D915h. 22DB 15i. 22DC 15j. 22DD 16a. 22DF 16b. 22DG 16c. 22DH16d. 22DJ 16e. 22DK 16f. 22DM 16g. 22DN 16h. 22DP 17a. 22DQ17b. 22DR 18. 22DS 19. 22DT 20a. 22DV 20b. 22DW 20c. 22DX20d. 22DY 20e. 22DZ 20f. 22F2 20g. 22F3 20h. 22F4 20i. 22F520j. 22F6 20k. 22F7 21. 22F8 22. 22F9 23. 22FB 24. 22FC25. 22FD 26. 22FF 27. 22FG 28. 22FH
www.everythingmaths.co.za m.everythingmaths.co.za
84 2.10. Summary

CHAPTER 3
Number patterns
3.1 Revision 86
3.2 Quadratic sequences 90
3.3 Summary 99

3 Number patterns
In earlier grades we learned about linear sequences, where the difference betweenconsecutive terms is constant. In this chapter, we will learn about quadratic sequences,where the difference between consecutive terms is not constant, but follows its ownpattern.
3.1 Revision EMBG2
Terminology:Sequence/pattern A sequence or pattern is an ordered set of numbers
or variables.Successive/consecutive Successive or consecutive terms are terms that di-
rectly follow one after another in a sequence.Common difference The common or constant difference (d) is the differ-
ence between any two consecutive terms in a linearsequence.
General term A mathematical expression that describes the se-quence and that generates any term in the patternby substituting different values for n.
Conjecture A statement, consistent with known data, that hasnot been proved true nor shown to be false.
Important: a series is not the same as a sequence or pattern. Different types of seriesare studied in Grade 12. In Grade 11 we study sequences only.
See video: 22FJ at www.everythingmaths.co.za
Describing patterns EMBG3
To describe terms in a pattern we use the following notation:
• T1 is the first term of a sequence.
• T4 is the fourth term of a sequence.
• Tn is the general term and is often expressed as the nth term of a sequence.
A sequence does not have to follow a pattern but when it does, we can write anequation for the general term. The general term can be used to calculate any term inthe sequence. For example, consider the following linear sequence: 1; 4; 7; 10; 13; . . .The nth term is given by the equation Tn = 3n− 2.
You can check this by substituting values for n:
T1 = 3(1)− 2 = 1
T2 = 3(2)− 2 = 4
T3 = 3(3)− 2 = 7
T4 = 3(4)− 2 = 10
T5 = 3(5)− 2 = 13
86 3.1. Revision

If we find the relationship between the position of a term and its value, we can describethe pattern and find any term in the sequence.
See video: 22FK at www.everythingmaths.co.za
Linear sequences EMBG4
DEFINITION: Linear sequence
A sequence of numbers in which there is a common difference (d) between any termand the term before it is called a linear sequence.
Important: d = T2 − T1, not T1 − T2.
Worked example 1: Linear sequence
QUESTION
Determine the common difference (d) and the general term for the following sequence:
10; 7; 4; 1; . . .
SOLUTION
Step 1: Determine the common difference
To calculate the common difference, we find the difference between any term and theprevious term:
d = Tn − Tn−1
Therefore d = T2 − T1= 7− 10
= −3
or d = T3 − T2= 4− 7
= −3
or d = T4 − T3= 1− 4
= −3
10 7 4 1
−3 −3 −3
Step 2: Determine the general term
To find the general term Tn, we must identify the relationship between:
87Chapter 3. Number patterns

• the value of a number in the pattern and
• the position of a number in the pattern
position 1 2 3 4value 10 7 4 1
We start with the value of the first term in the sequence. We need to write an expres-sion that includes the value of the common difference (d = −3) and the position ofthe term (n = 1).
T1 = 10
= 10 + (0)(−3)
= 10 + (1− 1)(−3)
Now we write a similar expression for the second term.
T2 = 7
= 10 + (1)(−3)
= 10 + (2− 1)(−3)
We notice a pattern forming that links the position of a number in the sequence to itsvalue.
Tn = 10 + (n− 1)(−3)
= 10− 3n+ 3
= −3n+ 13
Step 3: Drawing a graph of the pattern
We can also represent this pattern graphically, as shown below.
0
1
2
3
4
5
6
7
8
9
10
11
12
13
14
0 1 2 3 4 5 6
b
b
b
b
Pattern number (n)
Term value Tn
Notice that the position numbers (n) can be positive integers only.
This pattern can also be expressed in words: “each term in the sequence can be cal-culated by multiplying negative three and the position number, and then adding thir-teen.”
88 3.1. Revision

See video: 22FM at www.everythingmaths.co.za
Exercise 3 – 1: Linear sequences
1. Write down the next three terms in each of the following sequences:45; 29; 13;−3; . . .
2. The general term is given for each sequence below. Calculate the missing terms.
a) −4;−9;−14; . . . ;−24
Tn = 1− 5n
b) 6; . . . ; 24; . . . ; 42
Tn = 9n− 3
3. Find the general formula for the following sequences and then find T10, T15 andT30:
a) 13; 16; 19; 22; . . .
b) 18; 24; 30; 36; . . .
c) −10;−15;−20;−25; . . .
4. The seating in a classroom is arranged so that the first row has 20 desks, thesecond row has 22 desks, the third row has 24 desks and so on. Calculate howmany desks are in the ninth row.
5. a) Complete the following:
13 + 31 = . . .
24 + 42 = . . .
38 + 83 = . . .
b) Look at the numbers on the left-hand side, what do you notice about theunit digit and the tens-digit?
c) Investigate the pattern by trying other examples of 2-digit numbers.
d) Make a conjecture about the pattern that you notice.
e) Prove this conjecture.
Think you got it? Get this answer and more practice on our Intelligent Practice Service
1. 22FN 2a. 22FP 2b. 22FQ 3a. 22FR 3b. 22FS 3c. 22FT4. 22FV 5. 22FW
www.everythingmaths.co.za m.everythingmaths.co.za
89Chapter 3. Number patterns

3.2 Quadratic sequences EMBG5
Investigation: Quadratic sequences
b b bb
bbb b b
1. Study the dotted-tile pattern shown and answer the following questions.
a) Complete the fourth pattern in the diagram.
b) Complete the table below:
pattern number 1 2 3 4 5 20 n
dotted tiles 1 3 5difference (d) − 2
c) What do you notice about the change in number of dotted tiles?
d) Describe the pattern in words: “The number of dotted tiles...”.
e) Write the general term: Tn = . . .
f) Give the mathematical name for this kind of pattern.
g) A pattern has 819 dotted tiles. Determine the value of n.
2. Now study the number of blank tiles (tiles without dots) and answer the followingquestions:
a) Complete the table below:
pattern number 1 2 3 4 5 10blank tiles 3 6 11
first difference − 3second difference − −
b) What do you notice about the change in the number of blank tiles?
c) Describe the pattern in words: “The number of blank tiles...”.
d) Write the general term: Tn = . . .
e) Give the mathematical name for this kind of pattern.
f) A pattern has 227 blank tiles. Determine the value of n.
g) A pattern has 79 dotted tiles. Determine the number of blank tiles.
90 3.2. Quadratic sequences

DEFINITION: Quadratic sequence
A quadratic sequence is a sequence of numbers in which the second difference be-tween any two consecutive terms is constant.
Consider the following example: 1; 2; 4; 7; 11; . . .
The first difference is calculated by finding the difference between consecutive terms:
1 2 4 7 11
+1 +2 +3 +4
The second difference is obtained by taking the difference between consecutive firstdifferences:
1 2 3 4
+1 +1 +1
We notice that the second differences are all equal to 1. Any sequence that has acommon second difference is a quadratic sequence.
It is important to note that the first differences of a quadratic sequence form a sequence.This sequence has a constant difference between consecutive terms. In other words, alinear sequence results from taking the first differences of a quadratic sequence.
General case
If the sequence is quadratic, the nth term is of the form Tn = an2 + bn+ c.
n = 1 n = 2 n = 3 n = 4
Tn a+ b+ c 4a+ 2b+ c 9a+ 3b+ c 16a+ 4b+ c
1st difference 3a+ b 5a+ b 7a+ b
2nd difference 2a 2a
In each case, the common second difference is a 2a.
Exercise 3 – 2: Quadratic sequences
1. Determine the second difference between the terms for the following se-quences:
a) 5; 20; 45; 80; . . .
b) 6; 11; 18; 27; . . .
c) 1; 4; 9; 16; . . .
d) 3; 0;−5;−12; . . .
e) 1; 3; 7; 13; . . .
f) 0;−6;−16;−30; . . .
g) −1; 2; 9; 20; . . .
h) 1;−3;−9;−17; . . .
i) 3a+1; 12a+1; 27a+1; 48a+1 . . .
j) 2; 10; 24; 44; . . .
k) t− 2; 4t− 1; 9t; 16t+ 1; . . .
91Chapter 3. Number patterns
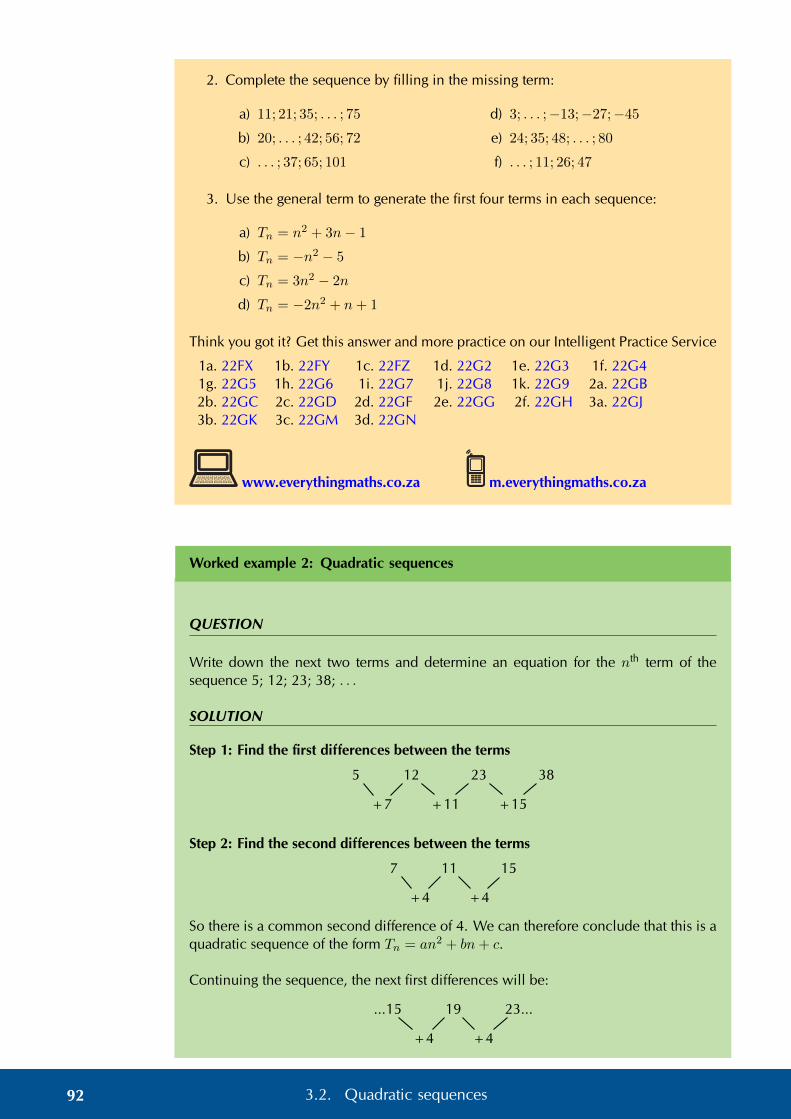
2. Complete the sequence by filling in the missing term:
a) 11; 21; 35; . . . ; 75
b) 20; . . . ; 42; 56; 72
c) . . . ; 37; 65; 101
d) 3; . . . ;−13;−27;−45
e) 24; 35; 48; . . . ; 80
f) . . . ; 11; 26; 47
3. Use the general term to generate the first four terms in each sequence:
a) Tn = n2 + 3n− 1
b) Tn = −n2 − 5
c) Tn = 3n2 − 2n
d) Tn = −2n2 + n+ 1
Think you got it? Get this answer and more practice on our Intelligent Practice Service
1a. 22FX 1b. 22FY 1c. 22FZ 1d. 22G2 1e. 22G3 1f. 22G41g. 22G5 1h. 22G6 1i. 22G7 1j. 22G8 1k. 22G9 2a. 22GB2b. 22GC 2c. 22GD 2d. 22GF 2e. 22GG 2f. 22GH 3a. 22GJ3b. 22GK 3c. 22GM 3d. 22GN
www.everythingmaths.co.za m.everythingmaths.co.za
Worked example 2: Quadratic sequences
QUESTION
Write down the next two terms and determine an equation for the nth term of thesequence 5; 12; 23; 38; . . .
SOLUTION
Step 1: Find the first differences between the terms
5 12 23 38
+7 +11 +15
Step 2: Find the second differences between the terms
7 11 15
+4 +4
So there is a common second difference of 4. We can therefore conclude that this is aquadratic sequence of the form Tn = an2 + bn+ c.
Continuing the sequence, the next first differences will be:
...15 19 23...
+4 +4
92 3.2. Quadratic sequences
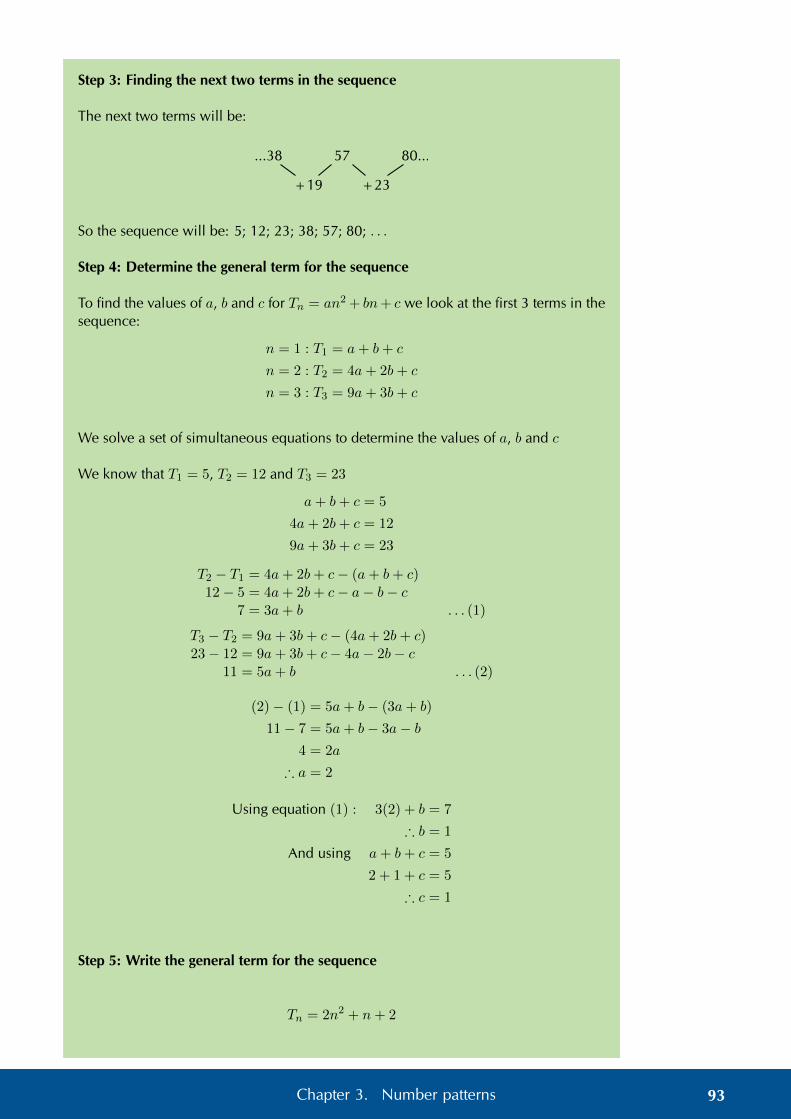
Step 3: Finding the next two terms in the sequence
The next two terms will be:
...38 57 80...
+19 +23
So the sequence will be: 5; 12; 23; 38; 57; 80; . . .
Step 4: Determine the general term for the sequence
To find the values of a, b and c for Tn = an2 + bn+ c we look at the first 3 terms in thesequence:
n = 1 : T1 = a+ b+ c
n = 2 : T2 = 4a+ 2b+ c
n = 3 : T3 = 9a+ 3b+ c
We solve a set of simultaneous equations to determine the values of a, b and c
We know that T1 = 5, T2 = 12 and T3 = 23
a+ b+ c = 5
4a+ 2b+ c = 12
9a+ 3b+ c = 23
T2 − T1 = 4a+ 2b+ c− (a+ b+ c)12− 5 = 4a+ 2b+ c− a− b− c
7 = 3a+ b . . . (1)
T3 − T2 = 9a+ 3b+ c− (4a+ 2b+ c)23− 12 = 9a+ 3b+ c− 4a− 2b− c
11 = 5a+ b . . . (2)
(2)− (1) = 5a+ b− (3a+ b)
11− 7 = 5a+ b− 3a− b4 = 2a
∴ a = 2
Using equation (1) : 3(2) + b = 7
∴ b = 1
And using a+ b+ c = 5
2 + 1 + c = 5
∴ c = 1
Step 5: Write the general term for the sequence
Tn = 2n2 + n+ 2
93Chapter 3. Number patterns

Worked example 3: Plotting a graph of terms in a sequence
QUESTION
Consider the following sequence:
3; 6; 10; 15; 21; . . .
1. Determine the general term (Tn) for the sequence.
2. Is this a linear or a quadratic sequence?
3. Plot a graph of Tn vs n.
SOLUTION
Step 1: Determine the first and second differences
n = 1 n = 2 n = 3 n = 4
Tn 3 6 10 15
1st difference 3 4 5
2nd difference 1 1
We see that the first differences are not constant and form the sequence 3; 4; 5; . . . andthat there is a common second difference of 1. Therefore the sequence is quadraticand has a general term of the form Tn = an2 + bn+ c.
Step 2: Determine the general term Tn
To find the values of a, b and c for Tn = an2 + bn+ c we look at the first 3 terms in thesequence:
n = 1 : T1 = a+ b+ c
n = 2 : T2 = 4a+ 2b+ c
n = 3 : T3 = 9a+ 3b+ c
We solve this set of simultaneous equations to determine the values of a, b and c. Weknow that T1 = 3, T2 = 6 and T3 = 10.
a+ b+ c = 3
4a+ 2b+ c = 6
9a+ 3b+ c = 10
T2 − T1 = 4a+ 2b+ c− (a+ b+ c)6− 3 = 4a+ 2b+ c− a− b− c
3 = 3a+ b . . . (1)
T3 − T2 = 9a+ 3b+ c− (4a+ 2b+ c)10− 6 = 9a+ 3b+ c− 4a− 2b− c
4 = 5a+ b . . . (2)
94 3.2. Quadratic sequences

(2)− (1) = 5a+ b− (3a+ b)
4− 3 = 5a+ b− 3a− b1 = 2a
∴ a =1
2
Using equation (1) : 3
(1
2
)+ b = 3
∴ b =3
2And using a+ b+ c = 3
1
2+
3
2+ c = 3
∴ c = 1
Therefore the general term for the sequence is Tn = 12n
2 + 32n+ 1.
Step 3: Plot a graph of Tn vs n
Use the general term for the sequence, Tn = 12n
2 + 32n+ 1, to complete the table.
n 1 2 3 4 5 6 7 8 9 10Tn 3 6 10 15 21 28 36 45 55 66
Use the table to plot the graph:
b
b
b
b
b
b
b
b
b
b
Term
valu
e(T
n)
1 2 3 4 5 6 7 8 9 10
Position number (n)
T1
T2
T3
T4
T5
T6
T7
T8
T9
T10
In this case it would not be accurate to join these points, since n indicates the positionof a term in a sequence and can therefore only be a positive integer. We can, however,see that the plot of the points lies in the shape of a parabola.
95Chapter 3. Number patterns

Worked example 4: Olympic Games soccer event
QUESTION
In the first stage of the soccer event at the Olympic Games, there are teams fromfour different countries in each group. Each country in a group must play every othercountry in the group once.
1. How many matches will be played in each group in the first stage of the event?
2. How many matches would be played if there are 5 teams in each group?
3. How many matches would be played if there are 6 teams in each group?
4. Determine the general formula of the sequence.
SOLUTION
Step 1: Determine the number of matches played if there are 4 teams in a group
Let the teams from four different countries be A, B, C and D.
teams in a group matches playedA AB,AC,AD
B BC,BD
C CD
D
4 3 + 2 + 1 = 6
AB means that team A plays team B and BA would be the same match as AB. So ifthere are four different teams in a group, each group plays 6 matches.
Step 2: Determine the number of matches played if there are 5 teams in a group
Let the teams from five different countries be A,B,C,D and E.
teams in a group matches playedA AB,AC,AD,AE
B BC,BD,BE
C CD,CE
D DE
E
5 4 + 3 + 2 + 1 = 10
So if there are five different teams in a group, each group plays 10 matches.
Step 3: Determine the number of matches played if there are 6 teams in a group
Let the teams from six different countries be A,B,C,D,E and F .
96 3.2. Quadratic sequences

teams in a group matches to be playedA AB,AC,AD,AE,AF
B BC,BD,BE,BF
C CD,CE,CF
D DE,DF
E EF
F
5 5 + 4 + 3 + 2 + 1 = 15
So if there are six different teams in a group, each group plays 15 matches.
We continue to increase the number of teams in a group and find that a group of 7teams plays 21 matches and a group of 8 teams plays 28 matches.
Step 4: Consider the sequence
We examine the sequence to determine if it is linear or quadratic:
n = 1 n = 2 n = 3 n = 4 n = 5
Tn 6 10 15 21 28 . . .
first difference 4 5 6 7
second difference 1 1 1
We see that the first differences are not constant and that there is a common seconddifference of 1. Therefore the sequence is quadratic and has a general term of the formTn = an2 + bn+ c.
Step 5: Determine the general term Tn
To find the values of a, b and c for Tn = an2 + bn+ c we look at the first 3 terms in thesequence:
n = 1 : T1 = a+ b+ c
n = 2 : T2 = 4a+ 2b+ c
n = 3 : T3 = 9a+ 3b+ c
We solve a set of simultaneous equations to determine the values of a, b and c. Weknow that T1 = 6, T2 = 10 and T3 = 15
a+ b+ c = 6
4a+ 2b+ c = 10
9a+ 3b+ c = 15
T2 − T1 = 4a+ 2b+ c− (a+ b+ c)10− 6 = 4a+ 2b+ c− a− b− c
4 = 3a+ b . . . (1)
T3 − T2 = 9a+ 3b+ c− (4a+ 2b+ c)15− 10 = 9a+ 3b+ c− 4a− 2b− c
5 = 5a+ b . . . (2)
97Chapter 3. Number patterns
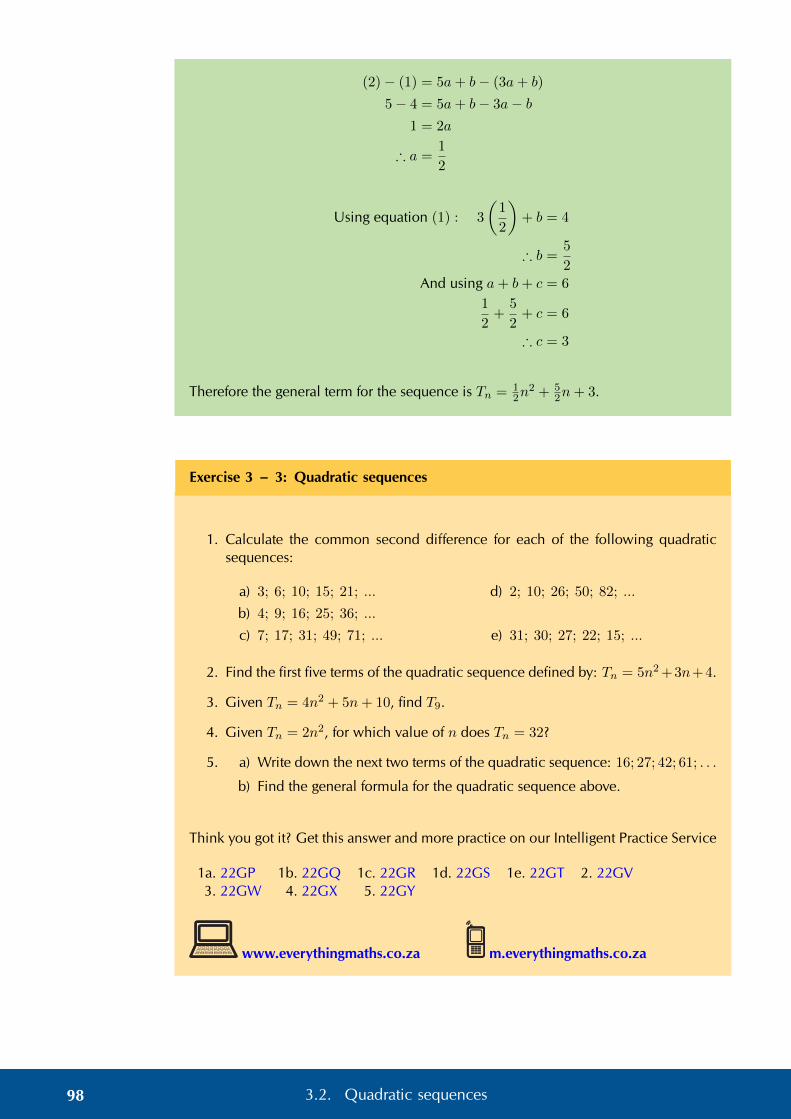
(2)− (1) = 5a+ b− (3a+ b)
5− 4 = 5a+ b− 3a− b1 = 2a
∴ a =1
2
Using equation (1) : 3
(1
2
)+ b = 4
∴ b =5
2And using a+ b+ c = 6
1
2+
5
2+ c = 6
∴ c = 3
Therefore the general term for the sequence is Tn = 12n
2 + 52n+ 3.
Exercise 3 – 3: Quadratic sequences
1. Calculate the common second difference for each of the following quadraticsequences:
a) 3; 6; 10; 15; 21; ...
b) 4; 9; 16; 25; 36; ...
c) 7; 17; 31; 49; 71; ...
d) 2; 10; 26; 50; 82; ...
e) 31; 30; 27; 22; 15; ...
2. Find the first five terms of the quadratic sequence defined by: Tn = 5n2 +3n+4.
3. Given Tn = 4n2 + 5n+ 10, find T9.
4. Given Tn = 2n2, for which value of n does Tn = 32?
5. a) Write down the next two terms of the quadratic sequence: 16; 27; 42; 61; . . .
b) Find the general formula for the quadratic sequence above.
Think you got it? Get this answer and more practice on our Intelligent Practice Service
1a. 22GP 1b. 22GQ 1c. 22GR 1d. 22GS 1e. 22GT 2. 22GV3. 22GW 4. 22GX 5. 22GY
www.everythingmaths.co.za m.everythingmaths.co.za
98 3.2. Quadratic sequences
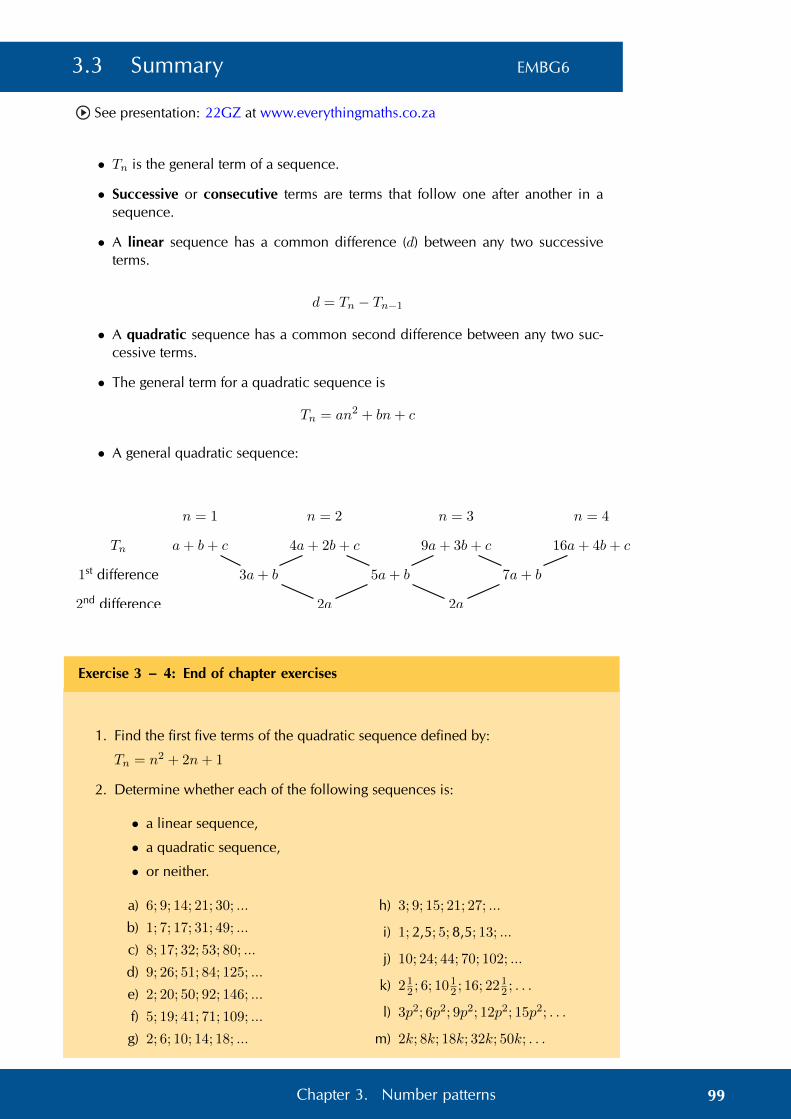
3.3 Summary EMBG6
See presentation: 22GZ at www.everythingmaths.co.za
• Tn is the general term of a sequence.
• Successive or consecutive terms are terms that follow one after another in asequence.
• A linear sequence has a common difference (d) between any two successiveterms.
d = Tn − Tn−1
• A quadratic sequence has a common second difference between any two suc-cessive terms.
• The general term for a quadratic sequence is
Tn = an2 + bn+ c
• A general quadratic sequence:
n = 1 n = 2 n = 3 n = 4
Tn a+ b+ c 4a+ 2b+ c 9a+ 3b+ c 16a+ 4b+ c
1st difference 3a+ b 5a+ b 7a+ b
2nd difference 2a 2a
Exercise 3 – 4: End of chapter exercises
1. Find the first five terms of the quadratic sequence defined by:
Tn = n2 + 2n+ 1
2. Determine whether each of the following sequences is:
• a linear sequence,
• a quadratic sequence,
• or neither.
a) 6; 9; 14; 21; 30; ...
b) 1; 7; 17; 31; 49; ...
c) 8; 17; 32; 53; 80; ...
d) 9; 26; 51; 84; 125; ...
e) 2; 20; 50; 92; 146; ...
f) 5; 19; 41; 71; 109; ...
g) 2; 6; 10; 14; 18; ...
h) 3; 9; 15; 21; 27; ...
i) 1; 2,5; 5; 8,5; 13; ...
j) 10; 24; 44; 70; 102; ...
k) 212 ; 6; 101
2 ; 16; 2212 ; . . .
l) 3p2; 6p2; 9p2; 12p2; 15p2; . . .
m) 2k; 8k; 18k; 32k; 50k; . . .
99Chapter 3. Number patterns

3. Given the pattern: 16;x; 46; . . ., determine the value of x if the pattern is linear.
4. Given Tn = 2n2, for which value of n does Tn = 242?
5. Given Tn = 3n2, find T11.
6. Given Tn = n2 + 4, for which value of n does Tn = 85?
7. Given Tn = 4n2 + 3n− 1, find T5.
8. Given Tn =3
2n2, for which value of n does Tn = 96?
9. For each of the following patterns, determine:
• the next term in the pattern,
• and the general term,
• the tenth term in the pattern.
a) 3; 7; 11; 15; . . .
b) 17; 12; 7; 2; . . .
c) 12 ; 1; 11
2 ; 2; . . .
d) a; a+ b; a+ 2b; a+ 3b; . . .
e) 1;−1;−3;−5; . . .
10. For each of the following sequences, find the equation for the general term andthen use the equation to find T100.
a) 4; 7; 12; 19; 28; ...
b) 2; 8; 14; 20; 26; ...
c) 7; 13; 23; 37; 55; ...
d) 5; 14; 29; 50; 77; ...
Given: Tn = 3n− 1
11. a) Write down the first five terms of the sequence.
b) What do you notice about the difference between any two consecutiveterms?
c) Will this always be the case for a linear sequence?
Given the following sequence: −15;−11;−7; . . . ; 173
12. a) Determine the equation for the general term.
b) Calculate how many terms there are in the sequence.
13. Given 3; 7; 13; 21; 31; . . .
a) Thabang determines that the general term is Tn = 4n − 1. Is he correct?Explain.
b) Cristina determines that the general term is Tn = n2 +n+ 1. Is she correct?Explain.
100 3.3. Summary

14. Given the following pattern of blocks:
2 3 4
a) Draw pattern 5.
b) Complete the table below:
pattern number (n) 2 3 4 5 10 250 n
number of white blocks (w) 4 8
c) Is this a linear or a quadratic sequence?
15. Cubes of volume 1 cm3 are stacked on top of each other to form a tower:
1 2 3
a) Complete the table for the height of the tower:
tower number (n) 1 2 3 4 10 n
height of tower (h) 2
b) What type of sequence is this?
c) Now consider the number of cubes in each tower and complete the tablebelow:
tower number (n) 1 2 3 4number of cubes (c) 3
d) What type of sequence is this?
e) Determine the general term for this sequence.
f) How many cubes are needed for tower number 21?
g) How high will a tower of 496 cubes be?
16. A quadratic sequence has a second term equal to 1, a third term equal to −6 anda fourth term equal to −14.
a) Determine the second difference for this sequence.
b) Hence, or otherwise, calculate the first term of the pattern.
101Chapter 3. Number patterns
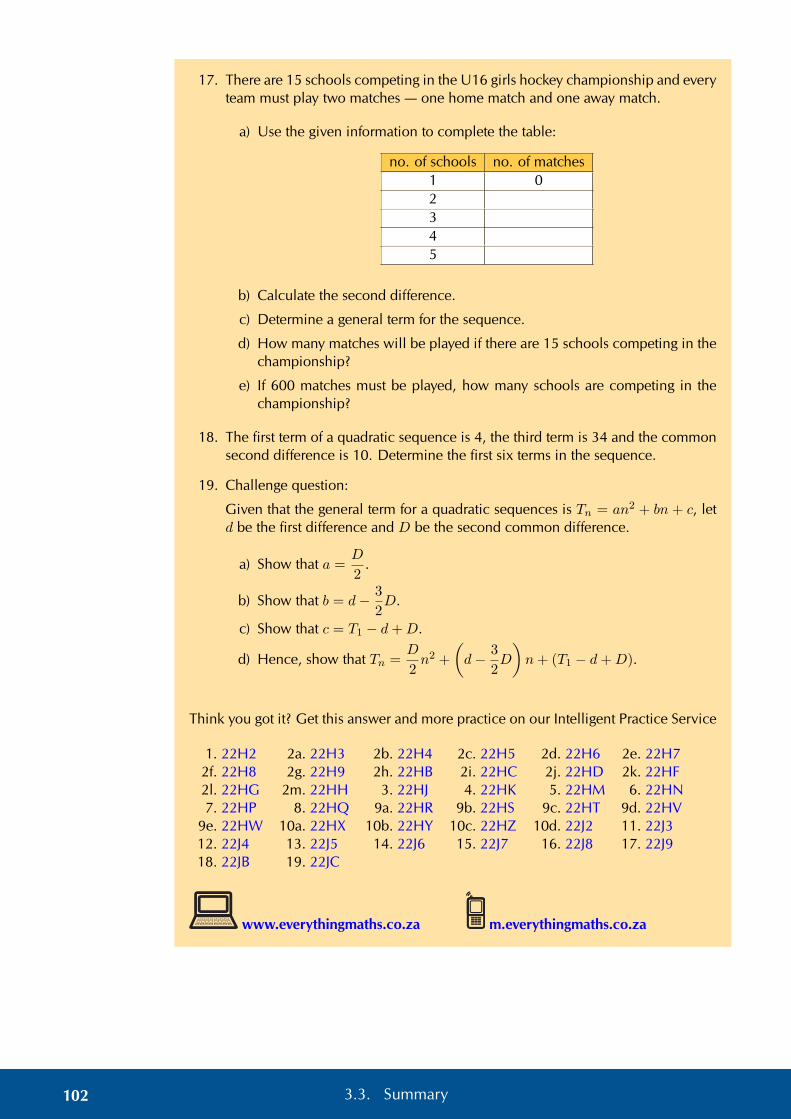
17. There are 15 schools competing in the U16 girls hockey championship and everyteam must play two matches — one home match and one away match.
a) Use the given information to complete the table:
no. of schools no. of matches1 02345
b) Calculate the second difference.
c) Determine a general term for the sequence.
d) How many matches will be played if there are 15 schools competing in thechampionship?
e) If 600 matches must be played, how many schools are competing in thechampionship?
18. The first term of a quadratic sequence is 4, the third term is 34 and the commonsecond difference is 10. Determine the first six terms in the sequence.
19. Challenge question:
Given that the general term for a quadratic sequences is Tn = an2 + bn + c, letd be the first difference and D be the second common difference.
a) Show that a =D
2.
b) Show that b = d− 3
2D.
c) Show that c = T1 − d+D.
d) Hence, show that Tn =D
2n2 +
(d− 3
2D
)n+ (T1 − d+D).
Think you got it? Get this answer and more practice on our Intelligent Practice Service
1. 22H2 2a. 22H3 2b. 22H4 2c. 22H5 2d. 22H6 2e. 22H72f. 22H8 2g. 22H9 2h. 22HB 2i. 22HC 2j. 22HD 2k. 22HF2l. 22HG 2m. 22HH 3. 22HJ 4. 22HK 5. 22HM 6. 22HN7. 22HP 8. 22HQ 9a. 22HR 9b. 22HS 9c. 22HT 9d. 22HV
9e. 22HW 10a. 22HX 10b. 22HY 10c. 22HZ 10d. 22J2 11. 22J312. 22J4 13. 22J5 14. 22J6 15. 22J7 16. 22J8 17. 22J918. 22JB 19. 22JC
www.everythingmaths.co.za m.everythingmaths.co.za
102 3.3. Summary
CHAPTER 4
Analytical geometry
4.1 Revision 104
4.2 Equation of a line 113
4.3 Inclination of a line 124
4.4 Parallel lines 132
4.5 Perpendicular lines 136
4.6 Summary 142

4 Analytical geometry
Analytical geometry, also referred to as coordinate or Cartesian geometry, is the studyof geometric properties and relationships between points, lines and angles in the Carte-sian plane. Geometrical shapes are defined using a coordinate system and algebraicprinciples. In this chapter we deal with the equation of a straight line, parallel andperpendicular lines and inclination of a line.
4.1 Revision EMBG7
Points A(x1; y1), B(x2; y2) and C(x2; y1) are shown in the diagram below:
b
b
A(x1; y1) C(x2; y1)
B(x2; y2)
x
y
0
Theorem of Pythagoras
AB2 = AC2 +BC2
Distance formula
Distance between two points:
AB =√
(x2 − x1)2 + (y2 − y1)2
Notice that (x1 − x2)2 = (x2 − x1)2.
See video: 22JD at www.everythingmaths.co.za
Gradient
Gradient (m) describes the slope or steepness of the line joining two points. Thegradient of a line is determined by the ratio of vertical change to horizontal change.
mAB =y2 − y1x2 − x1
or mAB =y1 − y2x1 − x2
Remember to be consistent: m 6= y1 − y2x2 − x1
.
104 4.1. Revision

Horizontal lines
x
y
0
m = 0
Vertical lines
x
y
0
m is undefined
Parallel lines
θθ x
y
0
m1 = m2
Perpendicular lines
θ2θ1 x
y
0
m1 ×m2 = −1
Mid-point of a line segment
A(x1; y1)
M(x; y)
B(x2; y2)
x
y
0
The coordinates of the mid-point M(x; y) of a line between any two points A(x1; y1)and B(x2; y2):
M(x; y) =
(x1 + x2
2;y1 + y2
2
)
See video: 22JF at www.everythingmaths.co.za
105Chapter 4. Analytical geometry

Points on a straight line
The diagram shows points P (x1; y1), Q(x2; y2) and R(x; y) on a straight line.
b
b
x
y
R(x; y)
0b
Q(x2; y2)
P (x1; y1)
We know that mPR = mQR = mPQ.
Using mPR = mPQ, we obtain the following for any point (x; y) on a straight line
y − y1x− x1
=y2 − y1x2 − x1
Worked example 1: Revision
QUESTION
Given the points P (−5;−4) and Q(0; 6):
1. Determine the length of the line segment PQ.
2. Determine the mid-point T (x; y) of the line segment PQ.
3. Show that the line passing through R(1;−34) and T (x; y) is perpendicular to the
line PQ.
SOLUTION
Step 1: Draw a sketch
2
4
6
−2
−4
−6
2−2−4−6
b
b
b
P (−5;−4)
T (x; y)
Q(0; 6)
x
y
0
106 4.1. Revision

Step 2: Assign variables to the coordinates of the given points
Let the coordinates of P be (x1; y1) and Q (x2; y2)
x1 = −5; y1 = −4; x2 = 0; y2 = 6
Write down the distance formula
PQ =√
(x2 − x1)2 + (y2 − y1)2
=√
(0− (−5))2 + (6− (−4))2
=√
25 + 100
=√
125
= 5√
5
The length of the line segment PQ is 5√
5 units.
Step 3: Write down the mid-point formula and substitute the values
T (x; y) =
(x1 + x2
2;y1 + y2
2
)x =
x1 + x22
=−5 + 0
2
= −5
2
y =y1 + y2
2
=−4 + 6
2
=2
2
= 1
The mid-point of PQ is T (−52 ; 1).
Step 4: Determine the gradients of PQ and RT
m =y2 − y1x2 − x1
mPQ =6− (−4)
0− (−5)
=10
5
= 2
107Chapter 4. Analytical geometry

mRT =−3
4 − 1
1− (−52)
=−7
472
= −7
4× 2
7
= −1
2
Calculate the product of the two gradients:
mRT ×mPQ = −1
2× 2
= −1
Therefore PQ is perpendicular to RT .
Quadrilaterals
• A quadrilateral is a closed shape consisting of four straight line segments.
• A parallelogram is a quadrilateral with both pairs of opposite sides parallel.
bA b B
b CbD
b
///
////
/
– Both pairs of opposite sides are equal in length.
– Both pairs of opposite angles are equal.
– The diagonals bisect each other.
• A rectangle is a parallelogram that has all four angles equal to 90◦.
bA b B
b CbD
b
/
//
/
– Both pairs of opposite sides are equal and parallel.
– The diagonals bisect each other.
– The diagonals are equal in length.
108 4.1. Revision

• A rhombus is a parallelogram that has all four sides equal in length.
bA b B
b CbD
b
///
////
/
××
×ו•
••
– Both pairs of opposite sides are equal and parallel.
– The diagonals bisect each other at 90◦.
– The diagonals of a rhombus bisect both pairs of opposite angles.
• A square is a rhombus that has all four interior angles equal to 90◦.
bA b B
b CbD
b
/
//
/
••
•• ••
••
– Both pairs of opposite sides are equal and parallel.
– The diagonals bisect each other at 90◦.
– The diagonals are equal in length.
– The diagonals bisect both pairs of interior opposite angles (that is, all anglesare 45◦).
• A trapezium is a quadrilateral with one pair of opposite sides parallel.
• A kite is a quadrilateral with two pairs of adjacent sides equal.
A
B
C
D
bb
××
– One pair of opposite angles are equal (the angles are between unequalsides).
– The diagonal between equal sides bisects the other diagonal.
– The diagonal between equal sides bisects the interior angles.
– The diagonals intersect at 90◦.
109Chapter 4. Analytical geometry

Worked example 2: Quadrilaterals
QUESTION
Points A (−1; 0), B (0; 3), C (8; 11) and D (x; y) are points on the Cartesian plane.Determine D (x; y) if ABCD is a parallelogram.
SOLUTION
Step 1: Draw a sketch
1
2
3
4
5
6
7
8
9
10
11
−1 1 2 3 4 5 6 7 8 9−1
b
b
x
y
C(8; 11)
0
D(x; y)
A(−1; 0)b
B(0; 3)
M
The mid-point of AC will be the same as the mid-point of BD. We first find themid-point of AC and then use it to determine the coordinates of point D.
Step 2: Assign values to (x1; y1) and (x2; y2)
Let the mid-point of AC be M(x; y)
x1 = −1; y1 = 0; x2 = 8; y2 = 11
Step 3: Write down the mid-point formula
M(x; y) =
(x1 + x2
2;y1 + y2
2
)
Step 4: Substitute the values and calculate the coordinates of M
M(x; y) =
(−1 + 8
2;0 + 11
2
)
=
(7
2;11
2
)
110 4.1. Revision

Step 5: Use the coordinates of M to determine D
M is also the mid-point of BD so we use M(72 ; 11
2
)and B (0; 3) to find D (x; y)
Step 6: Substitute values and determine x and y
M =
(x1 + x2
2;y1 + y2
2
)
∴
(7
2;11
2
)=
(0 + x
2;3 + y
2
)
7
2=
0 + x
27 = 0 + x
∴ x = 7
11
2=
3 + y
211 = 3 + y
∴ y = 8
Step 7: Alternative method: inspection
Since we are given that ABCD is a parallelogram, we can use the properties of aparallelogram and the given points to determine the coordinates of D.
From the sketch we expect that point D will lie below C.
Consider the given points A,B and C:
• Opposite sides of a parallelogram are parallel, therefore BC must be parallel toAD and their gradients must be equal.
• The vertical change from B to C is 8 units up.
• Therefore the vertical change from A to D is also 8 units up (y = 0 + 8 = 8).
• The horizontal change from B to C is 8 units to the right.
• Therefore the horizontal change from A to D is also 8 units to the right (x =−1 + 8 = 7).
or
• Opposite sides of a parallelogram are parallel, therefore AB must be parallel toDC and their gradients must be equal.
• The vertical change from A to B is 3 units up.
111Chapter 4. Analytical geometry

• Therefore the vertical change from C to D is 3 units down (y = 11− 3 = 8).
• The horizontal change from A to B is 1 unit to the right.
• Therefore the horizontal change from C to D is 1 unit to the left (x = 8− 1 = 7).
Step 8: Write the final answer
The coordinates of D are (7; 8).
Exercise 4 – 1: Revision
1. Determine the length of the line segment between the following points:
a) P (−3; 5) and Q(−1;−5)
b) R(0,75; 3) and S(0,75;−4)
c) T (2x; y − 2) and U(3x+ 1; y − 2)
2. Given Q(4; 1), T (p; 3) and length QT =√
8 units, determine the value of p.
3. Determine the gradient of the line AB if:
a) A(−5; 3) and B(−7; 4)
b) A(3;−2) and B(1;−8)
4. Prove that the line PQ, with P (0; 3) and Q(5; 5), is parallel to the line 5y + 5 =2x.
5. Given the points A(−1;−1), B(2; 5), C(−1;−52) and D(x;−4) and AB ⊥ CD,
determine the value of x.
6. Calculate the coordinates of the mid-point P (x; y) of the line segment betweenthe points:
a) M(3; 5) and N(−1;−1)
b) A(−3;−4) and B(2; 3)
7. The line joining A(−2; 4) and B(x; y) has the mid-point C(1; 3). Determine thevalues of x and y.
8. Given quadrilateral ABCD with vertices A(0; 3), B(4; 3), C(5;−1) andD(1;−1).
a) Determine the equation of the line AD and the line BC.
b) Show that AD ‖ BC.
c) Calculate the lengths of AD and BC.
d) Determine the equation of the diagonal BD.
e) What type of quadrilateral is ABCD?
112 4.1. Revision

9. MPQN is a parallelogram with points M(−5; 3), P (−1; 5) and Q(4; 5). Draw asketch and determine the coordinates of N(x; y).
10. PQRS is a quadrilateral with points P (−3; 1), Q(1; 3), R(6; 1) and S(2;−1) inthe Cartesian plane.
a) Determine the lengths of PQ and SR.
b) Determine the mid-point of PR.
c) Show that PQ ‖ SR.
d) Determine the equations of the line PS and the line SR.
e) Is PS ⊥ SR? Explain your answer.
f) What type of quadrilateral is PQRS?
Think you got it? Get this answer and more practice on our Intelligent Practice Service
1a. 22JG 1b. 22JH 1c. 22JJ 2. 22JK 3a. 22JM 3b. 22JN4. 22JP 5. 22JQ 6a. 22JR 6b. 22JS 7. 22JT 8. 22JV9. 22JW 10. 22JX
www.everythingmaths.co.za m.everythingmaths.co.za
4.2 Equation of a line EMBG8
We can derive different forms of the straight line equation. The different forms areused depending on the information provided in the problem:
• The two-point form of the straight line equation:y − y1x− x1
=y2 − y1x2 − x1
• The gradient–point form of the straight line equation: y − y1 = m(x− x1)
• The gradient–intercept form of the straight line equation: y = mx+ c
The two-point form of the straight line equation EMBG9
b
b
(x1; y1)
(x2; y2)
x
y
0
113Chapter 4. Analytical geometry

Given any two points (x1; y1) and (x2; y2), we can determine the equation of the linepassing through the two points using the equation:
y − y1x− x1
=y2 − y1x2 − x1
Worked example 3: The two-point form of the straight line equation
QUESTION
Find the equation of the straight line passing through P (−1;−5) and Q (5; 4).
SOLUTION
Step 1: Draw a sketch
1
2
3
4
5
−1
−2
−3
−4
−5
−6
1 2 3 4 5 6−1−2
b
b
P (−1;−5)
Q(5; 4)
x
y
0
Step 2: Assign variables to the coordinates of the given points
Let the coordinates of P be (x1; y1) and Q(x2; y2)
x1 = −1; y1 = −5; x2 = 5; y2 = 4
Step 3: Write down the two-point form of the straight line equation
y − y1x− x1
=y2 − y1x2 − x1
114 4.2. Equation of a line

Step 4: Substitute the values and make y the subject of the equation
y − (−5)
x− (−1)=
4− (−5)
5− (−1)
y + 5
x+ 1=
9
6
y + 5 =3
2(x+ 1)
y + 5 =3
2x+
3
2
y =3
2x− 7
2
Step 5: Write the final answer
y =3
2x− 3
1
2
Exercise 4 – 2: The two-point form of the straight line equation
Determine the equation of the straight line passing through the points:
1. (3; 7) and (−6; 1)
2. (1;−114 ) and (23 ;−7
4)
3. (−2; 1) and (3; 6)
4. (2; 3) and (3; 5)
5. (1;−5) and (−7;−5)
6. (−4; 0) and (1; 154 )
7. (s; t) and (t; s)
8. (−2;−8) and (1; 7)
9. (2p; q) and (0;−q)
Think you got it? Get this answer and more practice on our Intelligent Practice Service
1. 22JY 2. 22JZ 3. 22K2 4. 22K3 5. 22K4 6. 22K57. 22K6 8. 22K7 9. 22K8
www.everythingmaths.co.za m.everythingmaths.co.za
115Chapter 4. Analytical geometry

The gradient–point form of the straight line equation EMBGB
We derive the gradient–point form of the straight line equation using the definition ofgradient and the two-point form of a straight line equation
y − y1x− x1
=y2 − y1x2 − x1
Substitute m =y2 − y1x2 − x1
on the right-hand side of the equation
y − y1x− x1
= m
Multiply both sides of the equation by (x− x1)
y − y1 = m(x− x1)
To use this equation, we need to know the gradient of the line and the coordinates ofone point on the line.
See video: 22K9 at www.everythingmaths.co.za
Worked example 4: The gradient–point form of the straight line equation
QUESTION
Determine the equation of the straight line with gradient m = −13 and passing through
the point (−1; 1).
SOLUTION
Step 1: Draw a sketch
We notice that m < 0, therefore the graph decreases as x increases.
1
2
3
−1
1 2 3 4−1−2−3−4
b(−1; 1)
x
y
0
Step 2: Write down the gradient–point form of the straight line equation
y − y1 = m(x− x1)
116 4.2. Equation of a line

Substitute the value of the gradient
y − y1 = −1
3(x− x1)
Substitute the coordinates of the given point
y − 1 = −1
3(x− (−1))
y − 1 = −1
3(x+ 1)
y = −1
3x− 1
3+ 1
= −1
3x+
2
3
Step 3: Write the final answer
The equation of the straight line is y = −13x+ 2
3 .
If we are given two points on a straight line, we can also use the gradient–point formto determine the equation of a straight line. We first calculate the gradient using thetwo given points and then substitute either of the two points into the gradient–pointform of the equation.
Worked example 5: The gradient–point form of the straight line equation
QUESTION
Determine the equation of the straight line passing through (−3; 2) and (5; 8).
SOLUTION
Step 1: Draw a sketch
2
4
6
8
2 4 6−2−4
b
b
(−3; 2)
(5; 8)
x
y
0
117Chapter 4. Analytical geometry

Step 2: Assign variables to the coordinates of the given points
x1 = −3; y1 = 2; x2 = 5; y2 = 8
Step 3: Calculate the gradient using the two given points
m =y2 − y1x2 − x1
=8− 2
5− (−3)
=6
8
=3
4
Step 4: Write down the gradient–point form of the straight line equation
y − y1 = m(x− x1)
Substitute the value of the gradient
y − y1 =3
4(x− x1)
Substitute the coordinates of a given point
y − y1 =3
4(x− x1)
y − 2 =3
4(x− (−3))
y − 2 =3
4(x+ 3)
y =3
4x+
9
4+ 2
=3
4x+
17
4
Step 5: Write the final answer
The equation of the straight line is y = 34x+ 41
4 .
See video: 22KB at www.everythingmaths.co.za
118 4.2. Equation of a line
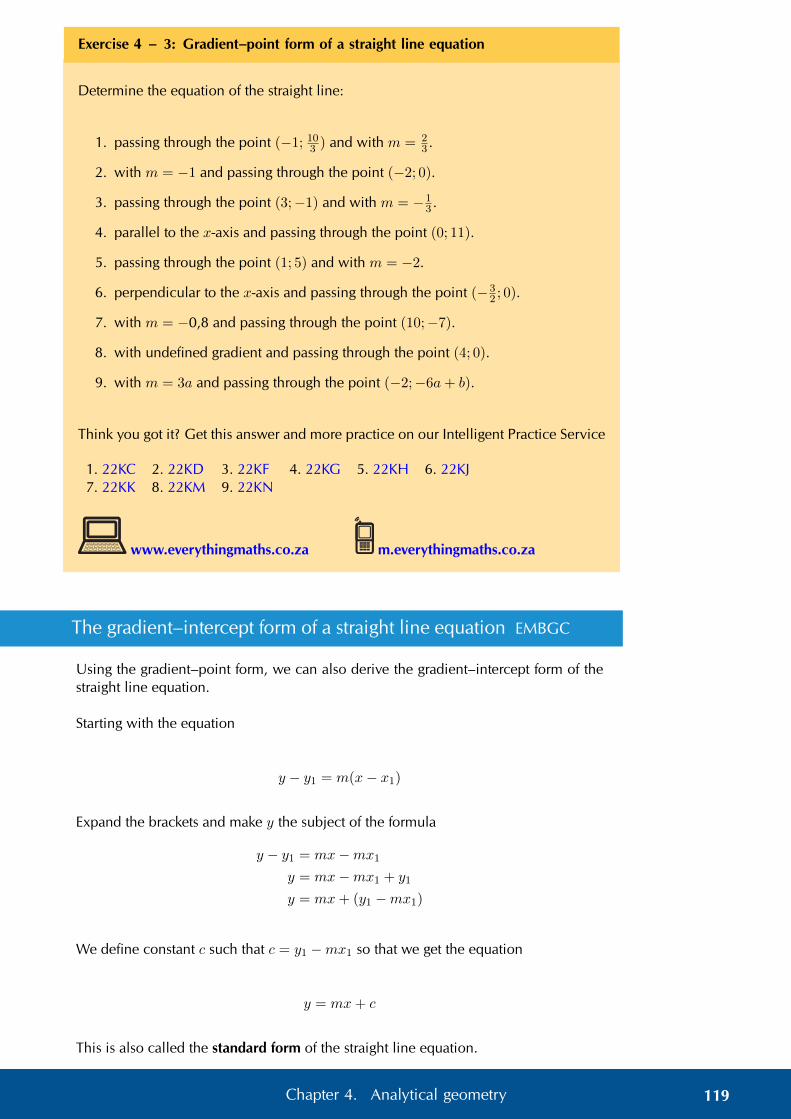
Exercise 4 – 3: Gradient–point form of a straight line equation
Determine the equation of the straight line:
1. passing through the point (−1; 103 ) and with m = 2
3 .
2. with m = −1 and passing through the point (−2; 0).
3. passing through the point (3;−1) and with m = −13 .
4. parallel to the x-axis and passing through the point (0; 11).
5. passing through the point (1; 5) and with m = −2.
6. perpendicular to the x-axis and passing through the point (−32 ; 0).
7. with m = −0,8 and passing through the point (10;−7).
8. with undefined gradient and passing through the point (4; 0).
9. with m = 3a and passing through the point (−2;−6a+ b).
Think you got it? Get this answer and more practice on our Intelligent Practice Service
1. 22KC 2. 22KD 3. 22KF 4. 22KG 5. 22KH 6. 22KJ7. 22KK 8. 22KM 9. 22KN
www.everythingmaths.co.za m.everythingmaths.co.za
The gradient–intercept form of a straight line equation EMBGC
Using the gradient–point form, we can also derive the gradient–intercept form of thestraight line equation.
Starting with the equation
y − y1 = m(x− x1)
Expand the brackets and make y the subject of the formula
y − y1 = mx−mx1y = mx−mx1 + y1
y = mx+ (y1 −mx1)
We define constant c such that c = y1 −mx1 so that we get the equation
y = mx+ c
This is also called the standard form of the straight line equation.
119Chapter 4. Analytical geometry

Notice that when x = 0, we have
y = m(0) + c
= c
Therefore c is the y-intercept of the straight line.
Worked example 6: The gradient–intercept form of straight line equation
QUESTION
Determine the equation of the straight line with gradient m = −2 and passing throughthe point (−1; 7).
SOLUTION
Step 1: Slope of the line
We notice that m < 0, therefore the graph decreases as x increases.
2
4
6
8
−2
2 4−2−4
b(−1; 7)
x
y
0
Step 2: Write down the gradient–intercept form of straight line equation
y = mx+ c
Substitute the value of the gradient
y = −2x+ c
120 4.2. Equation of a line

Substitute the coordinates of the given point and find c
y = −2x+ c
7 = −2(−1) + c
7− 2 = c
∴ c = 5
This gives the y-intercept (0; 5).
Step 3: Write the final answer
The equation of the straight line is y = −2x+ 5.
If we are given two points on a straight line, we can also use the gradient–interceptform to determine the equation of a straight line. We solve for the two unknowns mand c using simultaneous equations — using the methods of substitution or elimina-tion.
Worked example 7: The gradient–intercept form of straight line equation
QUESTION
Determine the equation of the straight line passing through the points (−2;−7) and(3; 8).
SOLUTION
Step 1: Draw a sketch
4
8
−4
−8
2 4−2−4
b
b
(−2;−7)
(3; 8)
x
y
0
Step 2: Write down the gradient–intercept form of straight line equation
y = mx+ c
121Chapter 4. Analytical geometry

Step 3: Substitute the coordinates of the given points
−7 = m(−2) + c
−7 = −2m+ c . . . (1)
8 = m(3) + c
8 = 3m+ c . . . (2)
We have two equations with two unknowns; we can therefore solve using simultane-ous equations.
Step 4: Make the coefficient of one of the variables the same in both equations
We notice that the coefficient of c in both equations is 1, therefore we can subtractone equation from the other to eliminate c:
−7 = −2m+ c
−(8 = 3m+ c)
−15 = −5m
∴ 3 = m
Substitute m = 3 into either of the two equations and determine c:
−7 = −2m+ c
−7 = −2(3) + c
∴ c = −1
or
8 = 3m+ c
8 = 3(3) + c
∴ c = −1
Step 5: Write the final answer
The equation of the straight line is y = 3x− 1.
122 4.2. Equation of a line

Exercise 4 – 4: The gradient–intercept form of a straight line equation
Determine the equation of the straight line:
1. passing through the point (12 ; 4) andwith m = 2.
2. passing through the points (12 ;−2)and (2; 4).
3. passing through the points (2;−3)and (−1; 0).
4. passing through the point (2;−67)
and with m = −37 .
5. which cuts the y-axis at y = −15 and
with m = 12 .
6.
b
b(−1;−4)
(2; 2)
x
y
0
7.
b−3
2
x
y
0
8.
b(−2;−2)
4
x
y
0
9.
b (−2; 10)
x
y
0
Think you got it? Get this answer and more practice on our Intelligent Practice Service
1. 22KP 2. 22KQ 3. 22KR 4. 22KS 5. 22KT 6. 22KV7. 22KW 8. 22KX 9. 22KY
www.everythingmaths.co.za m.everythingmaths.co.za
123Chapter 4. Analytical geometry

4.3 Inclination of a line EMBGD
1
2
3
1 2 3
θ
∆y
∆x
x
y
The diagram shows that a straight line makes an angle θ with the positive x-axis. Thisis called the angle of inclination of a straight line.
We notice that if the gradient changes, then the value of θ also changes, therefore theangle of inclination of a line is related to its gradient. We know that gradient is theratio of a change in the y-direction to a change in the x-direction:
m =∆y
∆x
From trigonometry we know that the tangent function is defined as the ratio:
tan θ =opposite sideadjacent side
And from the diagram we see that
tan θ =∆y
∆x∴ m = tan θ for 0◦ ≤ θ < 180◦
Therefore the gradient of a straight line is equal to the tangent of the angle formedbetween the line and the positive direction of the x-axis.
Vertical lines
• θ = 90◦
• Gradient is undefined since there is no change in the x-values (∆x = 0).
• Therefore tan θ is also undefined (the graph of tan θ has an asymptote at θ =90◦).
124 4.3. Inclination of a line

Horizontal lines
• θ = 0◦
• Gradient is equal to 0 since there is no change in the y-values (∆y = 0).
• Therefore tan θ is also equal to 0 (the graph of tan θ passes through the origin(0◦; 0).
Lines with negative gradients
If a straight line has a negative gradient (m < 0, tan θ < 0), then the angle formedbetween the line and the positive direction of the x-axis is obtuse.
θ x
y
0
From the CAST diagram in trigonometry, we know that the tangent function is negativein the second and fourth quadrant. If we are calculating the angle of inclination for aline with a negative gradient, we must add 180◦ to change the negative angle in thefourth quadrant to an obtuse angle in the second quadrant:
If we are given a straight line with gradient m = −0,7, then we can determine theangle of inclination using a calculator:
tan θ = m
= −0,7
∴ θ = tan−1(−0,7)
= −35,0◦
This negative angle lies in the fourth quadrant. We must add 180◦ to get an obtuseangle in the second quadrant:
θ = −35,0◦ + 180◦
= 145◦
125Chapter 4. Analytical geometry
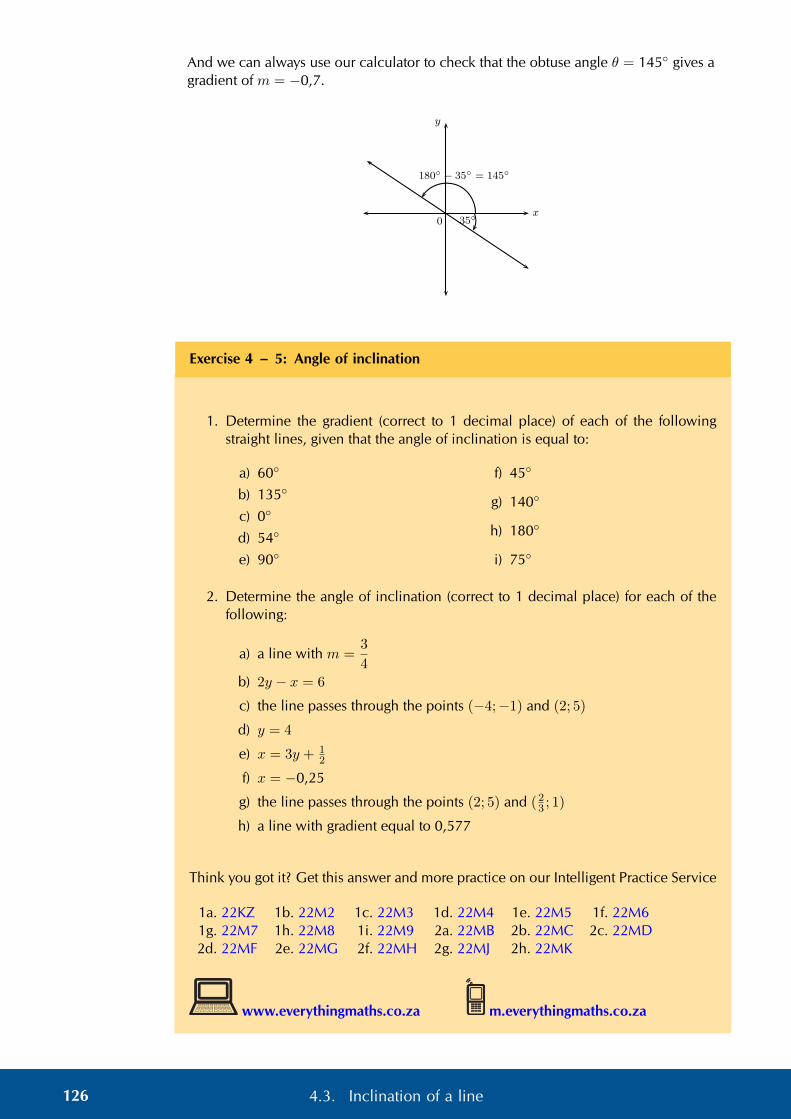
And we can always use our calculator to check that the obtuse angle θ = 145◦ gives agradient of m = −0,7.
35◦
180◦ − 35◦ = 145◦
x
y
0
Exercise 4 – 5: Angle of inclination
1. Determine the gradient (correct to 1 decimal place) of each of the followingstraight lines, given that the angle of inclination is equal to:
a) 60◦
b) 135◦
c) 0◦
d) 54◦
e) 90◦
f) 45◦
g) 140◦
h) 180◦
i) 75◦
2. Determine the angle of inclination (correct to 1 decimal place) for each of thefollowing:
a) a line with m =3
4
b) 2y − x = 6
c) the line passes through the points (−4;−1) and (2; 5)
d) y = 4
e) x = 3y + 12
f) x = −0,25
g) the line passes through the points (2; 5) and (23 ; 1)
h) a line with gradient equal to 0,577
Think you got it? Get this answer and more practice on our Intelligent Practice Service
1a. 22KZ 1b. 22M2 1c. 22M3 1d. 22M4 1e. 22M5 1f. 22M61g. 22M7 1h. 22M8 1i. 22M9 2a. 22MB 2b. 22MC 2c. 22MD2d. 22MF 2e. 22MG 2f. 22MH 2g. 22MJ 2h. 22MK
www.everythingmaths.co.za m.everythingmaths.co.za
126 4.3. Inclination of a line

Worked example 8: Inclination of a straight line
QUESTION
Determine the angle of inclination (correct to 1 decimal place) of the straight linepassing through the points (2; 1) and (−3;−9).
SOLUTION
Step 1: Draw a sketch
2
−2
−4
−6
−8
1 2−1−2−3
b
b
(2; 1)
(−3;−9)
x
y
0
Step 2: Assign variables to the coordinates of the given points
x1 = 2; y1 = 1; x2 = −3; y2 = −9
Step 3: Determine the gradient of the line
m =y2 − y1x2 − x1
=−9− 1
−3− 2
=−10
−5
∴ m = 2
Step 4: Use the gradient to determine the angle of inclination of the line
tan θ = m
= 2
∴ θ = tan−1 2
= 63,4◦
Important: make sure your calculator is in DEG (degrees) mode.
Step 5: Write the final answer
The angle of inclination of the straight line is 63,4◦.
127Chapter 4. Analytical geometry
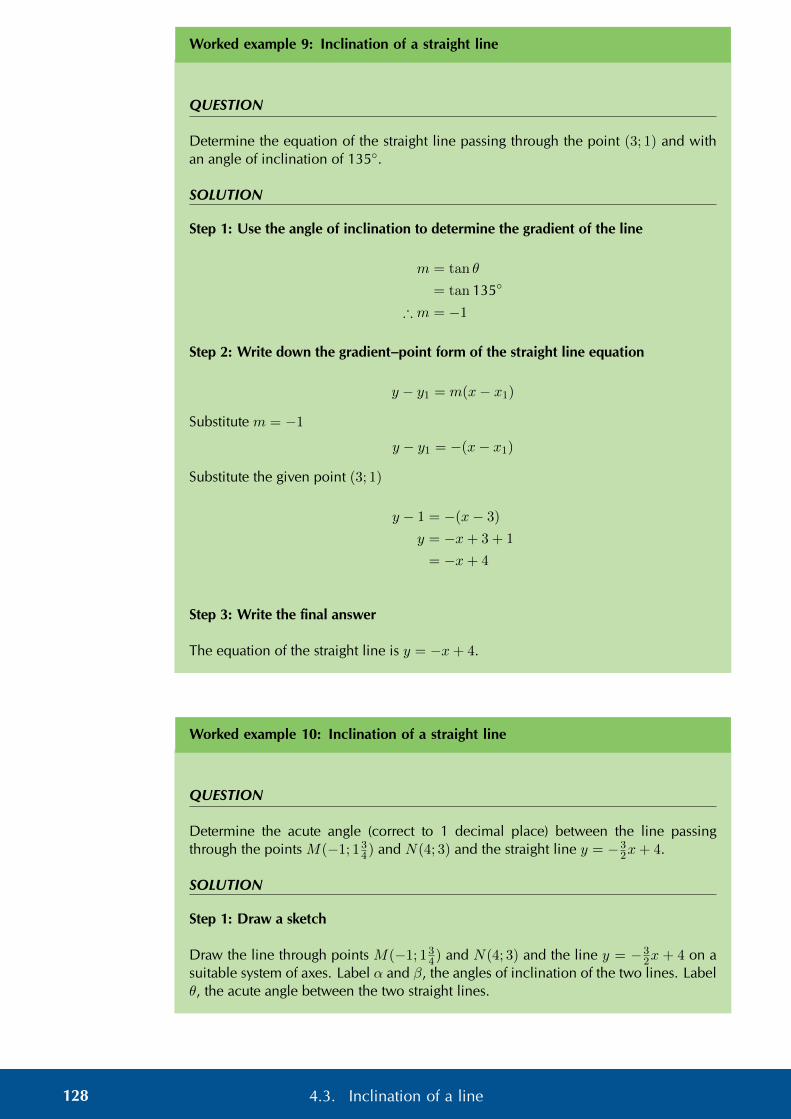
Worked example 9: Inclination of a straight line
QUESTION
Determine the equation of the straight line passing through the point (3; 1) and withan angle of inclination of 135◦.
SOLUTION
Step 1: Use the angle of inclination to determine the gradient of the line
m = tan θ
= tan 135◦
∴ m = −1
Step 2: Write down the gradient–point form of the straight line equation
y − y1 = m(x− x1)
Substitute m = −1
y − y1 = −(x− x1)
Substitute the given point (3; 1)
y − 1 = −(x− 3)
y = −x+ 3 + 1
= −x+ 4
Step 3: Write the final answer
The equation of the straight line is y = −x+ 4.
Worked example 10: Inclination of a straight line
QUESTION
Determine the acute angle (correct to 1 decimal place) between the line passingthrough the points M(−1; 13
4) and N(4; 3) and the straight line y = −32x+ 4.
SOLUTION
Step 1: Draw a sketch
Draw the line through points M(−1; 134) and N(4; 3) and the line y = −3
2x + 4 on asuitable system of axes. Label α and β, the angles of inclination of the two lines. Labelθ, the acute angle between the two straight lines.
128 4.3. Inclination of a line

2
4
6
−2
2 4−2−4−6−8
b
b
βB1α
θ
x
y
0
M(−1; 74)N(4; 3)
Notice that α and θ are acute angles and β is an obtuse angle.
B1 = 180◦ − β (∠ on str. line)
and θ = α+ B1 (ext. ∠ of 4 = sum int. opp)
∴ θ = α+ (180◦ − β)
= 180◦ + α− β
Step 2: Use the gradient to determine the angle of inclination β
From the equation y = −32x + 4 we see that m < 0, therefore β is an obtuse angle
such that 90◦ < β < 180◦.
tanβ = m
= −3
2
tan−1(−3
2
)= −56,3◦
This negative angle lies in the fourth quadrant. We know that the angle of inclinationβ is an obtuse angle that lies in the second quadrant, therefore
β = −56,3◦ + 180◦
= 123,7◦
Step 3: Determine the gradient and angle of inclination of the line through M andN
129Chapter 4. Analytical geometry

Determine the gradient
m =y2 − y1x2 − x1
=3− 7
4
4− (−1)
=54
5
=1
4
Determine the angle of inclination
tanα = m
=1
4
∴ α = tan−1(
1
4
)= 14,0◦
Step 4: Write the final answer
θ = 180◦ + α− β= 180◦ + 14,0◦ − 123,7◦
= 70,3◦
The acute angle between the two straight lines is 70,3◦.
Exercise 4 – 6: Inclination of a straight line
1. Determine the angle of inclination for each of the following:
a) a line with m =4
5b) x+ y + 1 = 0
c) a line with m = 5,69
d) the line that passes through (1; 1) and (−2; 7)
e) 3− 2y = 9x
f) the line that passes through (−1;−6) and (−12 ;−11
2 )
g) 5 = 10y − 15x
130 4.3. Inclination of a line

h)
b
x
y
(2; 3)
−1
0
i)
b x
y
(6; 0)
2
0
j)
b
x
y
(−3; 3)
−3 0
2. Determine the acute angle between the line passing through the points A(−2; 15)
and B(0; 1) and the line passing through the points C(1; 0) and D(−2; 6).
3. Determine the angle between the line y + x = 3 and the line x = y + 12 .
4. Find the angle between the line y = 2x and the line passing through the points(−1; 7
3) and (0; 2).
Think you got it? Get this answer and more practice on our Intelligent Practice Service
1a. 22MM 1b. 22MN 1c. 22MP 1d. 22MQ 1e. 22MR 1f. 22MS1g. 22MT 1h. 22MV 1i. 22MW 1j. 22MX 2. 22MY 3. 22MZ4. 22N2
www.everythingmaths.co.za m.everythingmaths.co.za
131Chapter 4. Analytical geometry

4.4 Parallel lines EMBGF
Investigation: Parallel lines
1. Draw a sketch of the line passing through the points P (−1; 0) and Q(1; 4) andthe line passing through the points R(1; 2) and S(2; 4).
2. Label and measure α and β, the angles of inclination of straight lines PQ andRS respectively.
3. Describe the relationship between α and β.
4. “α and β are alternate angles, therefore PQ ‖ RS.” Is this a true statement? Ifnot, provide a correct statement.
5. Use your calculator to determine tanα and tanβ.
6. Complete the sentence: . . . . . . lines have . . . . . . angles of inclination.
7. Determine the equations of the straight lines PQ and RS.
8. What do you notice about mPQ and mRS?
9. Complete the sentence: . . . . . . lines have . . . . . . gradients.
Another method of determining the equation of a straight line is to be given a point onthe unknown line, (x1; y1), and the equation of a line which is parallel to the unknownline.
Let the equation of the unknown line be y = m1x + c1 and the equation of the givenline be y = m2x+ c2.
θθ x
y
0
y = m1x+ c1
y = m2x+ c2
θθ x
y
0
y = m1x+ c1
y = m2x+ c2
If the two lines are parallel then
m1 = m2
132 4.4. Parallel lines
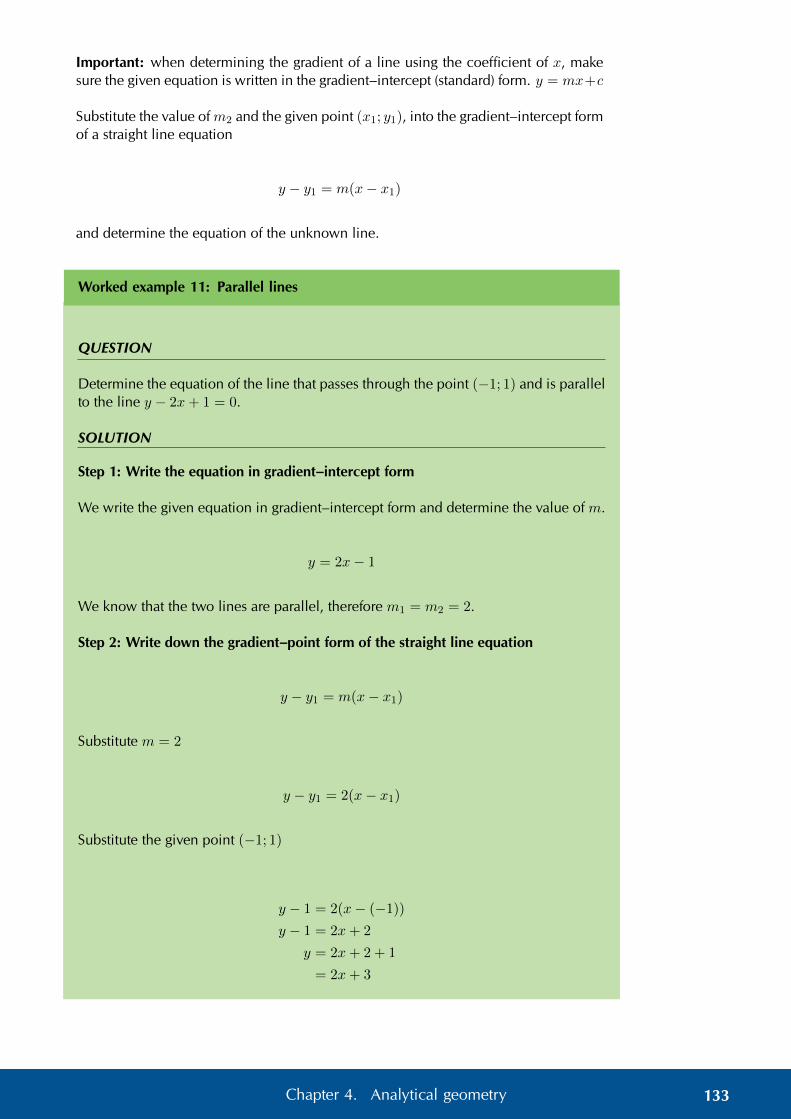
Important: when determining the gradient of a line using the coefficient of x, makesure the given equation is written in the gradient–intercept (standard) form. y = mx+c
Substitute the value ofm2 and the given point (x1; y1), into the gradient–intercept formof a straight line equation
y − y1 = m(x− x1)
and determine the equation of the unknown line.
Worked example 11: Parallel lines
QUESTION
Determine the equation of the line that passes through the point (−1; 1) and is parallelto the line y − 2x+ 1 = 0.
SOLUTION
Step 1: Write the equation in gradient–intercept form
We write the given equation in gradient–intercept form and determine the value of m.
y = 2x− 1
We know that the two lines are parallel, therefore m1 = m2 = 2.
Step 2: Write down the gradient–point form of the straight line equation
y − y1 = m(x− x1)
Substitute m = 2
y − y1 = 2(x− x1)
Substitute the given point (−1; 1)
y − 1 = 2(x− (−1))
y − 1 = 2x+ 2
y = 2x+ 2 + 1
= 2x+ 3
133Chapter 4. Analytical geometry

1
2
3
−1
−2
1 2 3−1−2−3
b(−1; 1)
y = 2x− 1
y = 2x+ 3
x
y
0
A sketch was not required, but it is always helpful and can be used to check answers.
Step 3: Write the final answer
The equation of the straight line is y = 2x+ 3.
Worked example 12: Parallel lines
QUESTION
Line AB passes through the point A(0; 3) and has an angle of inclination of 153,4◦.Determine the equation of the line CD which passes through the point C(2;−3) andis parallel to AB.
SOLUTION
Step 1: Use the given angle of inclination to determine the gradient
mAB = tan θ
= tan 153,4◦
= −0,5
Step 2: Parallel lines have equal gradients
Since we are given AB ‖ CD,
mCD = mAB = −0,5
134 4.4. Parallel lines

Step 3: Write down the gradient–point form of a straight line equation
y − y1 = m(x− x1)
Substitute the gradient mCD = −0,5.
y − y1 = −1
2(x− x1)
Substitute the given point (2;−3).
y − (−3) = −1
2(x− 2)
y + 3 = −1
2x+ 1
y = −1
2x− 2
1
2
3
4
−1
−2
−3
−4
1 2 3 4−1−2−3
b C(2;−3)
y = −12x− 2
y = −12x+ 3
x
y
0
A sketch was not required, but it is always useful.
Step 4: Write the final answer
The equation of the straight line is y = −12x− 2.
See video: 22N3 at www.everythingmaths.co.za
135Chapter 4. Analytical geometry

Exercise 4 – 7: Parallel lines
1. Determine whether or not the following two lines are parallel:
a) y + 2x = 1 and −2x+ 3 = y
b) y3 + x+ 5 = 0 and 2y + 6x = 1
c) y = 2x− 7 and the line passing through (1;−2) and (12 ;−1)
d) y + 1 = x and x+ y = 3
e) The line passing through points (−2;−1) and (−4;−3) and the line −y +x− 4 = 0
f) y − 1 = 13x and the line passing through points (−2; 4) and (1; 5)
2. Determine the equation of the straight line that passes through the point (1;−5)and is parallel to the line y + 2x− 1 = 0.
3. Determine the equation of the straight line that passes through the point (−2;−6)and is parallel to the line 2y + 1 = 6x.
4. Determine the equation of the straight line that passes through the point (−2;−2)and is parallel to the line with angle of inclination θ = 56,31◦.
5. Determine the equation of the straight line that passes through the point (−2; 25)
and is parallel to the line with angle of inclination θ = 145◦.
Think you got it? Get this answer and more practice on our Intelligent Practice Service
1a. 22N4 1b. 22N5 1c. 22N6 1d. 22N7 1e. 22N8 1f. 22N92. 22NB 3. 22NC 4. 22ND 5. 22NF
www.everythingmaths.co.za m.everythingmaths.co.za
4.5 Perpendicular lines EMBGG
Investigation: Perpendicular lines
1. Draw a sketch of the line passing through the points A(−2;−3) and B(2; 5) andthe line passing through the points C(−1; 1
2) and D(4;−2).
2. Label and measure α and β, the angles of inclination of straight lines AB andCD respectively.
3. Label and measure θ, the angle between the lines AB and CD.
4. Describe the relationship between the lines AB and CD.
5. “θ is a reflex angle, therefore AB ⊥ CD.” Is this a true statement? If not, providea correct statement.
136 4.5. Perpendicular lines
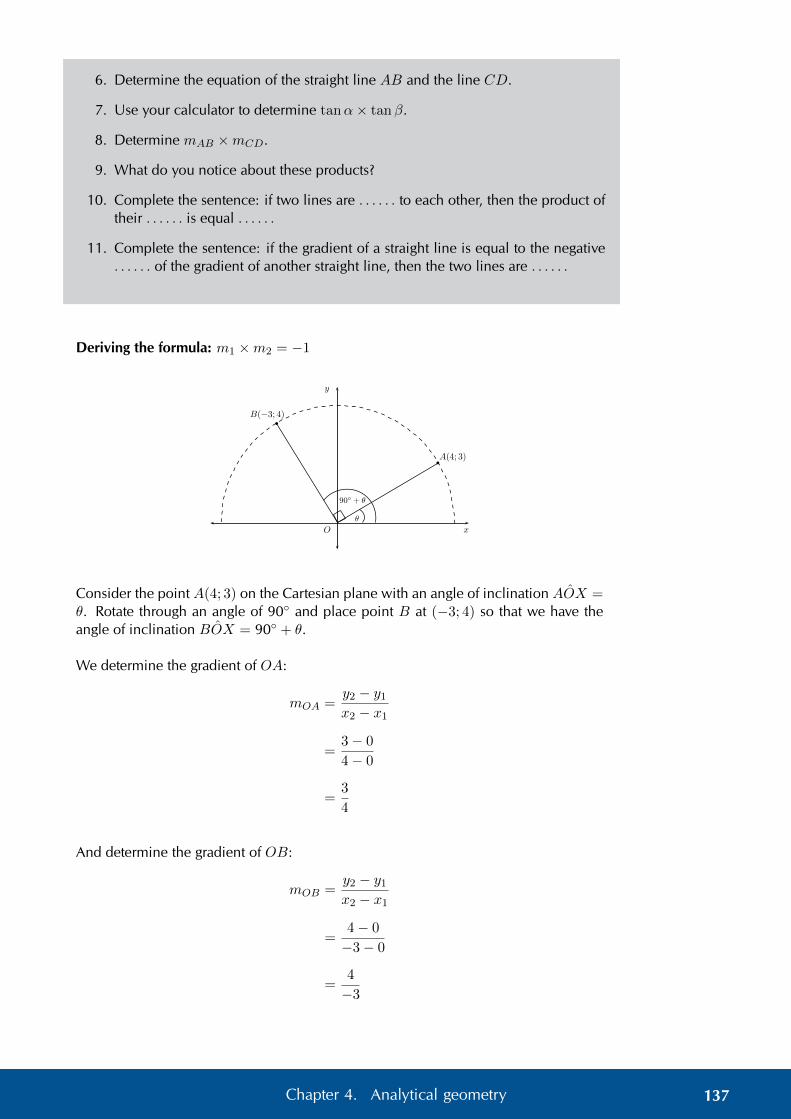
6. Determine the equation of the straight line AB and the line CD.
7. Use your calculator to determine tanα× tanβ.
8. Determine mAB ×mCD.
9. What do you notice about these products?
10. Complete the sentence: if two lines are . . . . . . to each other, then the product oftheir . . . . . . is equal . . . . . .
11. Complete the sentence: if the gradient of a straight line is equal to the negative. . . . . . of the gradient of another straight line, then the two lines are . . . . . .
Deriving the formula: m1 ×m2 = −1
b
b
A(4; 3)
B(−3; 4)
θ
90◦ + θ
O
y
x
Consider the point A(4; 3) on the Cartesian plane with an angle of inclination AOX =θ. Rotate through an angle of 90◦ and place point B at (−3; 4) so that we have theangle of inclination BOX = 90◦ + θ.
We determine the gradient of OA:
mOA =y2 − y1x2 − x1
=3− 0
4− 0
=3
4
And determine the gradient of OB:
mOB =y2 − y1x2 − x1
=4− 0
−3− 0
=4
−3
137Chapter 4. Analytical geometry

By rotating through an angle of 90◦ we know that OB ⊥ OA:
mOA ×mOB =3
4× 4
−3
= −1
We can also write thatmOA = − 1
mOB
b
b
A(x; y)
B(−y;x)
θ
90◦ + θ
O
y
x
If we have the general point A(x; y) with an angle of inclination AOX = θ and pointB(−y;x) such that BOX = 90◦ + θ, then we know that
mOA =y
x
mOB = −xy
∴ mOA ×mOB =y
x×−x
y
= −1
Another method of determining the equation of a straight line is to be given a point onthe line, (x1; y1), and the equation of a line which is perpendicular to the unknownline. Let the equation of the unknown line be y = m1x + c1 and the equation of thegiven line be y = m2x+ c2.
θ2θ1 x
y
0
y = m1x+ c1
y = m2x+ c2
If the two lines are perpendicular then
m1 ×m2 = −1
Note: this rule does not apply to vertical or horizontal lines.
138 4.5. Perpendicular lines

When determining the gradient of a line using the coefficient of x, make sure thegiven equation is written in the gradient–intercept (standard) form y = mx + c. Thenwe know that
m1 = − 1
m2
Substitute the value ofm1 and the given point (x1; y1), into the gradient–intercept formof the straight line equation y − y1 = m(x − x1) and determine the equation of theunknown line.
Worked example 13: Perpendicular lines
QUESTION
Determine the equation of the straight line passing through the point T (2; 2) and per-pendicular to the line 3y + 2x− 6 = 0.
SOLUTION
Step 1: Write the equation in standard form
Let the gradient of the unknown line be m1 and the given gradient be m2. We writethe given equation in gradient–intercept form and determine the value of m2.
3y + 2x− 6 = 0
3y = −2x+ 6
y = −2
3x+ 2
∴ m2 = −2
3
We know that the two lines are perpendicular, therefore m1 × m2 = −1. Thereforem1 = 3
2 .
Step 2: Write down the gradient–point form of the straight line equation
y − y1 = m(x− x1)
Substitute m1 = 32 .
y − y1 =3
2(x− x1)
Substitute the given point T (2; 2).
y − 2 =3
2(x− 2)
y − 2 =3
2x− 3
y =3
2x− 1
139Chapter 4. Analytical geometry

1
2
3
4
−1
−2
−3
−4
1 2 3 4−1−2
b T (2; 2)
y = −23x+ 2
y = 32x− 1
x
y
0
A sketch was not required, but it is useful for checking the answer.
Step 3: Write the final answer
The equation of the straight line is y = 32x− 1.
Worked example 14: Perpendicular lines
QUESTION
Determine the equation of the straight line passing through the point (2; 13) and per-
pendicular to the line with an angle of inclination of 71,57◦.
SOLUTION
Step 1: Use the given angle of inclination to determine gradient
Let the gradient of the unknown line be m1 and let the given gradient be m2.
m2 = tan θ
= tan 71,57◦
= 3,0
Step 2: Determine the unknown gradient
Since we are given that the two lines are perpendicular,
m1 ×m2 = −1
∴ m1 = −1
3
140 4.5. Perpendicular lines

Step 3: Write down the gradient–point form of the straight line equation
y − y1 = m(x− x1)
Substitute the gradient m1 = −13 .
y − y1 = −1
3(x− x1)
Substitute the given point (2; 13).
y −(
1
3
)= −1
3(x− 2)
y − 1
3= −1
3x+
2
3
y = −1
3x+ 1
Step 4: Write the final answer
The equation of the straight line is y = −13x+ 1.
See video: 22NG at www.everythingmaths.co.za
Exercise 4 – 8: Perpendicular lines
1. Calculate whether or not the following two lines are perpendicular:
a) y − 1 = 4x and 4y + x+ 2 = 0
b) 10x = 5y − 1 and 5y − x− 10 = 0
c) x = y − 5 and the line passing through (−1; 54) and (3;−11
4 )
d) y = 2 and x = 1
e) y3 = x and 3y + x = 9
f) 1− 2x = y and the line passing through (2;−1) and (−1; 5)
g) y = x+ 2 and 2y + 1 = 2x
2. Determine the equation of the straight line that passes through the point (−2;−4)and is perpendicular to the line y + 2x = 1.
3. Determine the equation of the straight line that passes through the point (2;−7)and is perpendicular to the line 5y − x = 0.
141Chapter 4. Analytical geometry
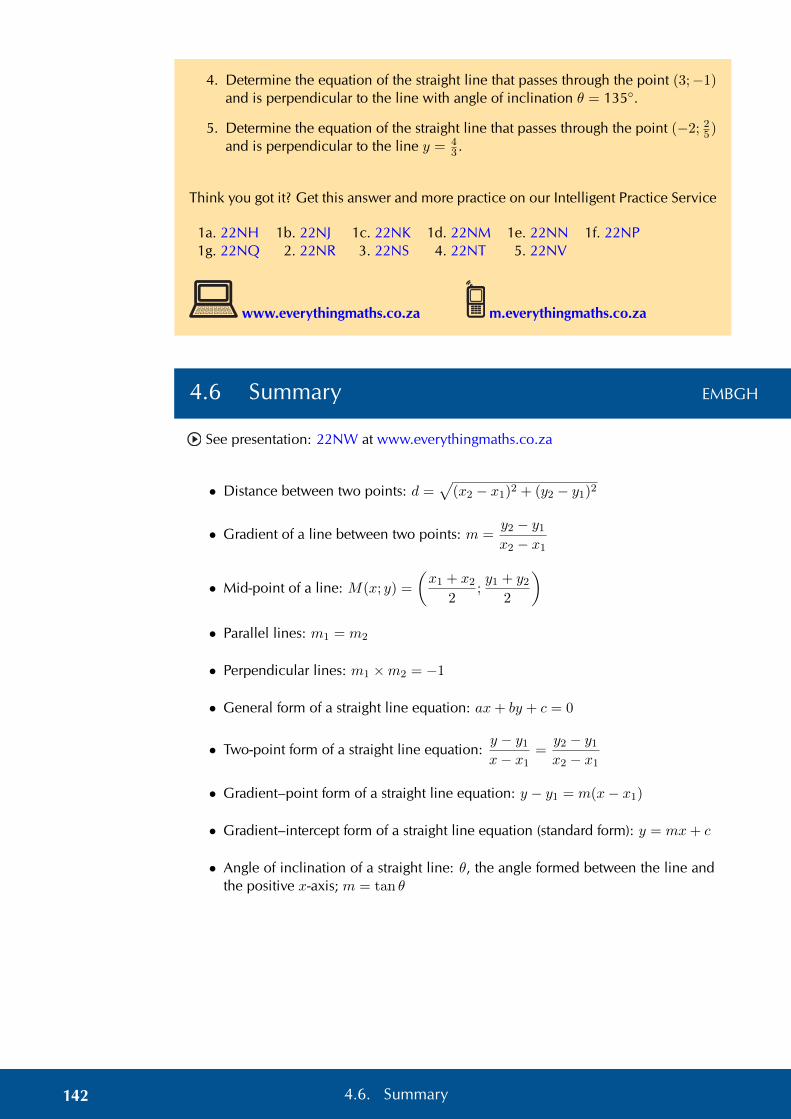
4. Determine the equation of the straight line that passes through the point (3;−1)and is perpendicular to the line with angle of inclination θ = 135◦.
5. Determine the equation of the straight line that passes through the point (−2; 25)
and is perpendicular to the line y = 43 .
Think you got it? Get this answer and more practice on our Intelligent Practice Service
1a. 22NH 1b. 22NJ 1c. 22NK 1d. 22NM 1e. 22NN 1f. 22NP1g. 22NQ 2. 22NR 3. 22NS 4. 22NT 5. 22NV
www.everythingmaths.co.za m.everythingmaths.co.za
4.6 Summary EMBGH
See presentation: 22NW at www.everythingmaths.co.za
• Distance between two points: d =√
(x2 − x1)2 + (y2 − y1)2
• Gradient of a line between two points: m =y2 − y1x2 − x1
• Mid-point of a line: M(x; y) =
(x1 + x2
2;y1 + y2
2
)• Parallel lines: m1 = m2
• Perpendicular lines: m1 ×m2 = −1
• General form of a straight line equation: ax+ by + c = 0
• Two-point form of a straight line equation:y − y1x− x1
=y2 − y1x2 − x1
• Gradient–point form of a straight line equation: y − y1 = m(x− x1)
• Gradient–intercept form of a straight line equation (standard form): y = mx+ c
• Angle of inclination of a straight line: θ, the angle formed between the line andthe positive x-axis; m = tan θ
142 4.6. Summary

Exercise 4 – 9: End of chapter exercises
1. Determine the equation of the line:
a) through points (−1; 3) and (1; 4)
b) through points (7;−3) and (0; 4)
c) parallel to y = 12x+ 3 and passing through (−2; 3)
d) perpendicular to y = −12x+ 3 and passing through (−1; 2)
e) perpendicular to 3y + x = 6 and passing through the origin
2. Determine the angle of inclination of the following lines:
a) y = 2x− 3
b) y = 13x− 7
c) 4y = 3x+ 8
d) y = −23x+ 3
e) 3y + x− 3 = 0
3. P (2; 3), Q(−4; 0) and R(5;−3) are the vertices of4PQR in the Cartesian plane.PR intersects the x-axis at S. Determine the following:
a) the equation of the line PR
b) the coordinates of point S
c) the angle of inclination of PR (correct to two decimal places)
d) the gradient of line PQ
e) QPR
f) the equation of the line perpendicular to PQ and passing through the origin
g) the mid-point M of QR
h) the equation of the line parallel to PR and passing through point M
4. Points A(−3; 5), B(−7;−4) and C(2; 0) are given.
a) Plot the points on the Cartesian plane.
b) Determine the coordinates of D if ABCD is a parallelogram.
c) Prove that ABCD is a rhombus.
5.
b
b
b
y = −x− 3
y = 3
y = 52x+ 1
2
x
y
0
M
N
P
143Chapter 4. Analytical geometry

Consider the sketch above, with the following lines shown:
y = −x− 3
y = 3
y = 52x+ 1
2
a) Determine the coordinates of the point N .
b) Determine the coordinates of the point P .
c) Determine the equation of the vertical line MN .
d) Determine the length of the vertical line MN .
e) Find MNP .
f) Determine the equation of the line parallel to NP and passing through thepoint M .
6. The following points are given: A(−2; 3), B(2; 4), C(3; 0).
a) Plot the points on the Cartesian plane.
b) Prove that 4ABC is a right-angled isosceles triangle.
c) Determine the equation of the line AB.
d) Determine the coordinates of D if ABCD is a square.
e) Determine the coordinates of E, the mid-point of BC.
7. Given points S(2; 5), T (−3;−4) and V (4;−2).
a) Determine the equation of the line ST .
b) Determine the size of T SV .
8. Consider triangle FGH with vertices F (−1; 3), G(2; 1) and H(4; 4).
a) Sketch 4FGH on the Cartesian plane.
b) Show that 4FGH is an isosceles triangle.
c) Determine the equation of the line PQ, perpendicular bisector of FH.
d) Does G lie on the line PQ?
e) Determine the equation of the line parallel to GH and passing throughpoint F .
9. Given the points A(−1; 5), B(5;−3) and C(0;−6). M is the mid-point of ABand N is the mid-point of AC.
a) Draw a sketch on the Cartesian plane.
b) Show that the coordinates ofM andN are (2; 1) and (−12 ;−1
2) respectively.
c) Use analytical geometry methods to prove the mid-point theorem. (Provethat NM ‖ CB and NM = 1
2CB.)
Think you got it? Get this answer and more practice on our Intelligent Practice Service
1a. 22NX 1b. 22NY 1c. 22NZ 1d. 22P2 1e. 22P3 2a. 22P42b. 22P5 2c. 22P6 2d. 22P7 2e. 22P8 3. 22P9 4. 22PB
5. 22PC 6. 22PD 7. 22PF 8. 22PG 9. 22PH
www.everythingmaths.co.za m.everythingmaths.co.za
144 4.6. Summary

CHAPTER 5
Functions
5.1 Quadratic functions 146
5.2 Average gradient 164
5.3 Hyperbolic functions 170
5.4 Exponential functions 184
5.5 The sine function 197
5.6 The cosine function 209
5.7 The tangent function 222
5.8 Summary 235

5 Functions
A function describes a specific relationship between two variables; where an indepen-dent (input) variable has exactly one dependent (output) variable. Every element in thedomain maps to only one element in the range. Functions can be one-to-one relationsor many-to-one relations. A many-to-one relation associates two or more values of theindependent variable with a single value of the dependent variable. Functions allowus to visualise relationships in the form of graphs, which are much easier to read andinterpret than lists of numbers.
5.1 Quadratic functions EMBGJ
Revision EMBGK
Functions of the form y = ax2 + q
Functions of the general form y = ax2 + q are called parabolic functions, where a andq are constants.
The effects of a and q on f(x) = ax2 + q:
• The effect of q on vertical shift
– For q > 0, f(x) is shifted verti-cally upwards by q units.The turning point of f(x) isabove the x-axis.
– For q < 0, f(x) is shifted verti-cally downwards by q units.The turning point of f(x) is be-low the x-axis.
– q is also the y-intercept of theparabola.
a < 0 a > 0
q > 0
q = 0
q < 0
• The effect of a on shape
– For a > 0; the graph of f(x) is a “smile” and has a minimum turning point(0; q). As the value of a becomes larger, the graph becomes narrower.As a gets closer to 0, f(x) becomes wider.
– For a < 0; the graph of f(x) is a “frown” and has a maximum turning point(0; q). As the value of a becomes smaller, the graph becomes narrower.As a gets closer to 0, f(x) becomes wider.
146 5.1. Quadratic functions

Exercise 5 – 1: Revision
1. On separate axes, accurately draw each of the following functions.
• Use tables of values if necessary.
• Use graph paper if available.
a) y1 = x2
b) y2 = 12x
2
c) y3 = −x2 − 1
d) y4 = −2x2 + 4
2. Use your sketches of the functions given above to complete the following table(the first column has been completed as an example):
y1 y2 y3 y4value of q q = 0
effect of q yint = 0
value of a a = 1
effect of a standardparabola
turning point (0; 0)
axis of symmetry x = 0(y-axis)
domain {x : x ∈ R}range {y : y ≥ 0}
Think you got it? Get this answer and more practice on our Intelligent Practice Service
1a. 22PJ 1b. 22PK 1c. 22PM 1d. 22PN 2. 22PP
www.everythingmaths.co.za m.everythingmaths.co.za
See video: 22PQ at www.everythingmaths.co.za
147Chapter 5. Functions

Functions of the form y = a(x+ p)2 + q EMBGM
We now consider parabolic functions of the form y = a(x+ p)2 + q and the effects ofparameter p.
Investigation: The effects of a, p and q on a parabolic graph
1. On the same system of axes, plot the following graphs:
a) y1 = x2
b) y2 = (x− 2)2
c) y3 = (x− 1)2
d) y4 = (x+ 1)2
e) y5 = (x+ 2)2
Use your sketches of the functions above to complete the following table:
y1 y2 y3 y4 y5x-intercept(s)y-interceptturning pointaxis of symmetrydomainrangeeffect of p
2. On the same system of axes, plot the following graphs:
a) y1 = x2 + 2
b) y2 = (x− 2)2 − 1
c) y3 = (x− 1)2 + 1
d) y4 = (x+ 1)2 + 1
e) y5 = (x+ 2)2 − 1
Use your sketches of the functions above to complete the following table:
y1 y2 y3 y4 y5x-intercept(s)y-interceptturning pointaxis of symmetrydomainrangeeffect of q
3. Consider the three functions given below and answer the questions that follow:
• y1 = (x− 2)2 + 1
• y2 = 2(x− 2)2 + 1
• y3 = −12(x− 2)2 + 1
a) What is the value of a for y2?
b) Does y1 have a minimum or maximum turning point?
148 5.1. Quadratic functions
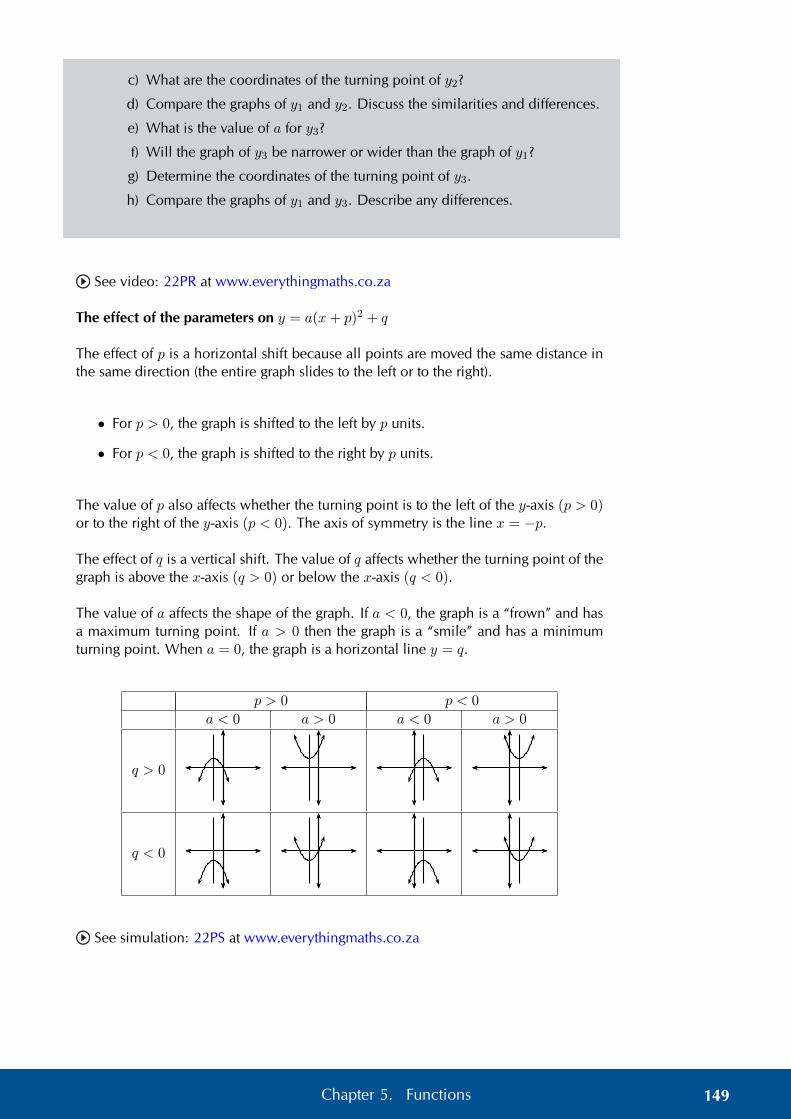
c) What are the coordinates of the turning point of y2?
d) Compare the graphs of y1 and y2. Discuss the similarities and differences.
e) What is the value of a for y3?
f) Will the graph of y3 be narrower or wider than the graph of y1?
g) Determine the coordinates of the turning point of y3.
h) Compare the graphs of y1 and y3. Describe any differences.
See video: 22PR at www.everythingmaths.co.za
The effect of the parameters on y = a(x+ p)2 + q
The effect of p is a horizontal shift because all points are moved the same distance inthe same direction (the entire graph slides to the left or to the right).
• For p > 0, the graph is shifted to the left by p units.
• For p < 0, the graph is shifted to the right by p units.
The value of p also affects whether the turning point is to the left of the y-axis (p > 0)or to the right of the y-axis (p < 0). The axis of symmetry is the line x = −p.
The effect of q is a vertical shift. The value of q affects whether the turning point of thegraph is above the x-axis (q > 0) or below the x-axis (q < 0).
The value of a affects the shape of the graph. If a < 0, the graph is a “frown” and hasa maximum turning point. If a > 0 then the graph is a “smile” and has a minimumturning point. When a = 0, the graph is a horizontal line y = q.
p > 0 p < 0
a < 0 a > 0 a < 0 a > 0
q > 0
q < 0
See simulation: 22PS at www.everythingmaths.co.za
149Chapter 5. Functions

Discovering the characteristics
For functions of the general form f(x) = y = a(x+ p)2 + q:
Domain and range
The domain is {x : x ∈ R} because there is no value of x for which f(x) is undefined.
The range of f(x) depends on whether the value for a is positive or negative. If a > 0we have:
(x+ p)2 ≥ 0 (perfect square is always positive)∴ a(x+ p)2 ≥ 0 (a is positive)
∴ a(x+ p)2 + q ≥ q∴ f(x) ≥ q
The range is therefore {y : y ≥ q, y ∈ R} if a > 0. Similarly, if a < 0, the range is{y : y ≤ q, y ∈ R}.
Worked example 1: Domain and range
QUESTION
State the domain and range for g(x) = −2(x− 1)2 + 3.
SOLUTION
Step 1: Determine the domain
The domain is {x : x ∈ R} because there is no value of x for which g(x) is undefined.
Step 2: Determine the range
The range of g(x) can be calculated from:
(x− 1)2 ≥ 0
−2(x− 1)2 ≤ 0
−2(x− 1)2 + 3 ≤ 3
g(x) ≤ 3
Therefore the range is {g(x) : g(x) ≤ 3} or in interval notation (−∞; 3].
Notice in the example above that it helps to have the function in the form y = a(x +p)2 + q.
We use the method of completing the square to write a quadratic function of thegeneral form y = ax2 + bx+ c in the form y = a(x+ p)2 + q (see Chapter 2).
150 5.1. Quadratic functions

Exercise 5 – 2: Domain and range
Give the domain and range for each of the following functions:
1. f(x) = (x− 4)2 − 1
2. g(x) = −(x− 5)2 + 4
3. h(x) = x2 − 6x+ 9
4. j(x) = −2(x+ 1)2
5. k(x) = −x2 + 2x− 3
Think you got it? Get this answer and more practice on our Intelligent Practice Service
1. 22PT 2. 22PV 3. 22PW 4. 22PX 5. 22PY
www.everythingmaths.co.za m.everythingmaths.co.za
Intercepts
The y-intercept:
Every point on the y-axis has an x-coordinate of 0, therefore to calculate the y-interceptwe let x = 0.
For example, the y-intercept of g(x) = (x− 1)2 + 5 is determined by setting x = 0:
g(x) = (x− 1)2 + 5
g(0) = (0− 1)2 + 5
= 6
This gives the point (0; 6).
The x-intercept:
Every point on the x-axis has a y-coordinate of 0, therefore to calculate the x-interceptwe let y = 0.
For example, the x-intercept of g(x) = (x− 1)2 + 5 is determined by setting y = 0:
g(x) = (x− 1)2 + 5
0 = (x− 1)2 + 5
−5 = (x− 1)2
which has no real solutions. Therefore, the graph of g(x) lies above the x-axis anddoes not have any x-intercepts.
151Chapter 5. Functions

Exercise 5 – 3: Intercepts
Determine the x- and y-intercepts for each of the following functions:
1. f(x) = (x+ 4)2 − 1
2. g(x) = 16− 8x+ x2
3. h(x) = −x2 + 4x− 3
4. j(x) = 4(x− 3)2 − 1
5. k(x) = 4(x− 3)2 + 1
6. l(x) = 2x2 − 3x− 4
Think you got it? Get this answer and more practice on our Intelligent Practice Service
1. 22PZ 2. 22Q2 3. 22Q3 4. 22Q4 5. 22Q5 6. 22Q6
www.everythingmaths.co.za m.everythingmaths.co.za
Turning point
The turning point of the function f(x) = a(x+p)2 + q is determined by examining therange of the function:
• If a > 0, f(x) has a minimum turning point and the range is [q;∞):
The minimum value of f(x) is q.
If f(x) = q, then a(x+ p)2 = 0, and therefore x = −p.This gives the turning point (−p; q).
• If a < 0, f(x) has a maximum turning point and the range is (−∞; q]:
The maximum value of f(x) is q.
If f(x) = q, then a(x+ p)2 = 0, and therefore x = −p.This gives the turning point (−p; q).
Therefore the turning point of the quadratic function f(x) = a(x+ p)2 + q is (−p; q).
Alternative form for quadratic equations:
We can also write the quadratic equation in the form
y = a(x− p)2 + q
The effect of p is still a horizontal shift, however notice that:
• For p > 0, the graph is shifted to the right by p units.
• For p < 0, the graph is shifted to the left by p units.
The turning point is (p; q) and the axis of symmetry is the line x = p.
152 5.1. Quadratic functions

Worked example 2: Turning point
QUESTION
Determine the turning point of g(x) = 3x2 − 6x− 1.
SOLUTION
Step 1: Write the equation in the form y = a(x+ p)2 + q
We use the method of completing the square:
g(x) = 3x2 − 6x− 1
= 3(x2 − 2x)− 1
= 3((x− 1)2 − 1
)− 1
= 3(x− 1)2 − 3− 1
= 3(x− 1)2 − 4
Step 2: Determine turning point (−p; q)
From the equation g(x) = 3(x − 1)2 − 4 we know that the turning point for g(x) is(1;−4).
Worked example 3: Turning point
QUESTION
1. Show that the x-value for the turning point of h(x) = ax2 + bx + c is given byx = − b
2a .
2. Hence, determine the turning point of k(x) = 2− 10x+ 5x2.
SOLUTION
Step 1: Write the equation in the form y = a(x+ p)2 + q and show that p = b2a
We use the method of completing the square:
h(x) = ax2 + bx+ c
= a
(x2 +
b
ax+
c
a
)
Take half the coefficient of the x term and square it; then add and subtract it from the
153Chapter 5. Functions

expression.
h(x) = a
(x2 +
b
ax+
(b
2a
)2
−(b
2a
)2
+c
a
)
= a
((x+
b
2a
)2
− b2
4a2+c
a
)
= a
((x+
b
2a
)2
− b2 − 4ac
4a2
)
= a
(x+
b
2a
)2
− b2 − 4ac
4a
From the above we have that the turning point is at x = −p = − b2a and y = q =
− b2−4ac4a .
Step 2: Determine the turning point of k(x)
Write the equation in the general form y = ax2 + bx+ c.
k(x) = 5x2 − 10x+ 2
Therefore a = 5; b = −10; c = 2.
Use the results obtained above to determine x = − b2a :
x = −(−10
2(5)
)= 1
Substitute x = 1 to obtain the corresponding y-value :
y = 5x2 − 10x+ 2
= 5(1)2 − 10(1) + 2
= 5− 10 + 2
= −3
The turning point of k(x) is (1;−3).
Exercise 5 – 4: Turning points
Determine the turning point of each of the following:
1. y = x2 − 6x+ 8
2. y = −x2 + 4x− 3
3. y = 12(x+ 2)2 − 1
4. y = 2x2 + 2x+ 1
154 5.1. Quadratic functions

5. y = 18 + 6x− 3x2
6. y = −2[(x+ 1)2 + 3]
Think you got it? Get this answer and more practice on our Intelligent Practice Service
1. 22Q7 2. 22Q8 3. 22Q9 4. 22QB 5. 22QC 6. 22QD
www.everythingmaths.co.za m.everythingmaths.co.za
Axis of symmetry
The axis of symmetry for f(x) = a(x+ p)2 + q is the vertical line x = −p. The axis ofsymmetry passes through the turning point (−p; q) and is parallel to the y-axis.
y
x0 b
x = −p
f(x) = a(x+ p)2 + q
Exercise 5 – 5: Axis of symmetry
1. Determine the axis of symmetry of each of the following:
a) y = 2x2 − 5x− 18
b) y = 3(x− 2)2 + 1
c) y = 4x− x2
2. Write down the equation of a parabola where the y-axis is the axis of symmetry.
Think you got it? Get this answer and more practice on our Intelligent Practice Service
1a. 22QF 1b. 22QG 1c. 22QH 2. 22QJ
www.everythingmaths.co.za m.everythingmaths.co.za
155Chapter 5. Functions

Sketching graphs of the form f(x) = a(x+ p)2 + q
In order to sketch graphs of the form f(x) = a(x+ p)2 + q, we need to determine fivecharacteristics:
• sign of a
• turning point
• y-intercept
• x-intercept(s) (if they exist)
• domain and range
See video: 22QK at www.everythingmaths.co.za
Worked example 4: Sketching a parabola
QUESTION
Sketch the graph of y = −12(x+ 1)2 − 3.
Mark the intercepts, turning point and the axis of symmetry. State the domain andrange of the function.
SOLUTION
Step 1: Examine the equation of the form y = a(x+ p)2 + q
We notice that a < 0, therefore the graph is a “frown” and has a maximum turningpoint.
Step 2: Determine the turning point (−p; q)
From the equation we know that the turning point is (−1;−3).
Step 3: Determine the axis of symmetry x = −p
From the equation we know that the axis of symmetry is x = −1.
Step 4: Determine the y-intercept
The y-intercept is obtained by letting x = 0:
y = −1
2((0) + 1)2 − 3
= −1
2− 3
= −31
2
This gives the point (0;−312).
156 5.1. Quadratic functions

Step 5: Determine the x-intercepts
The x-intercepts are obtained by letting y = 0:
0 = −1
2(x+ 1)2 − 3
3 = −1
2(x+ 1)2
−6 = (x+ 1)2
which has no real solutions. Therefore, there are no x-intercepts and the graph liesbelow the x-axis.
Step 6: Plot the points and sketch the graph
−1
−2
−3
−4
−5
−6
−7
1 2 3 4−1−2−3−4
b
b
y
x0
(0;−312 )
(−1;−3)
Step 7: State the domain and range
Domain: {x : x ∈ R}
Range: {y : y ≤ −3, y ∈ R}
See video: 22QM at www.everythingmaths.co.za
Worked example 5: Sketching a parabola
QUESTION
Sketch the graph of y = 12x
2 − 4x+ 72 .
Determine the intercepts, turning point and the axis of symmetry. Give the domainand range of the function.
SOLUTION
157Chapter 5. Functions
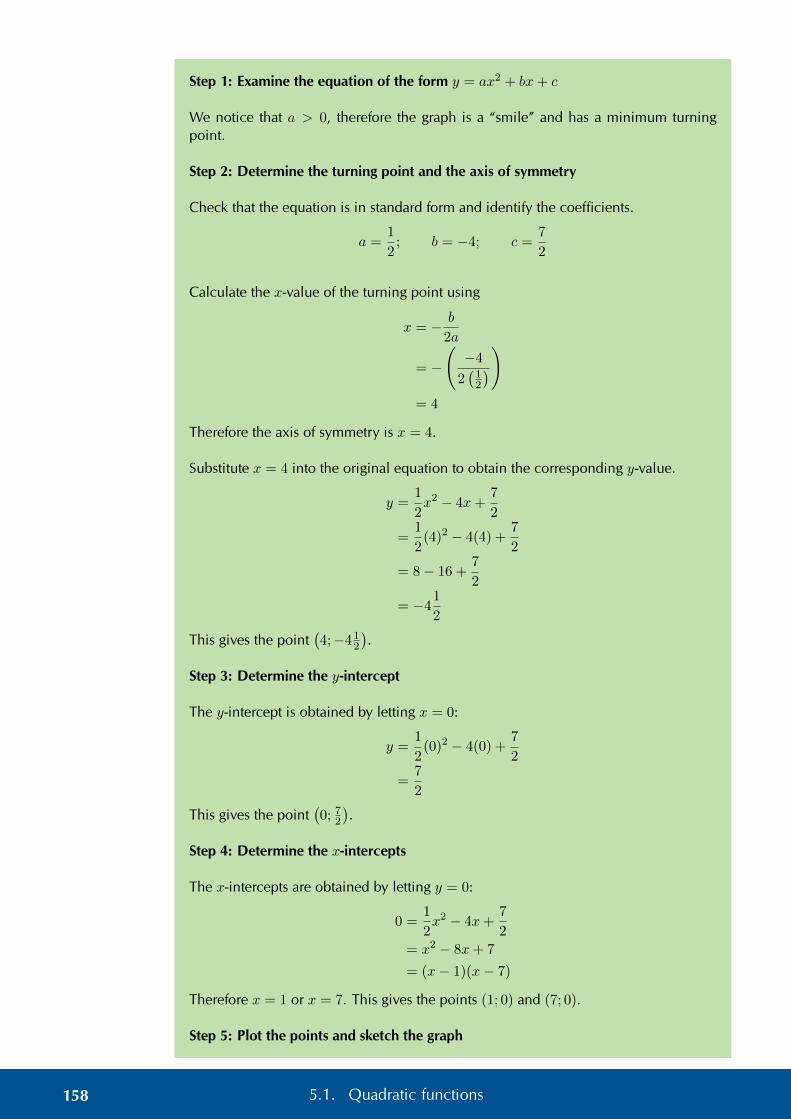
Step 1: Examine the equation of the form y = ax2 + bx+ c
We notice that a > 0, therefore the graph is a “smile” and has a minimum turningpoint.
Step 2: Determine the turning point and the axis of symmetry
Check that the equation is in standard form and identify the coefficients.
a =1
2; b = −4; c =
7
2
Calculate the x-value of the turning point using
x = − b
2a
= −
(−4
2(12
))= 4
Therefore the axis of symmetry is x = 4.
Substitute x = 4 into the original equation to obtain the corresponding y-value.
y =1
2x2 − 4x+
7
2
=1
2(4)2 − 4(4) +
7
2
= 8− 16 +7
2
= −41
2
This gives the point(4;−41
2
).
Step 3: Determine the y-intercept
The y-intercept is obtained by letting x = 0:
y =1
2(0)2 − 4(0) +
7
2
=7
2
This gives the point(0; 7
2
).
Step 4: Determine the x-intercepts
The x-intercepts are obtained by letting y = 0:
0 =1
2x2 − 4x+
7
2= x2 − 8x+ 7
= (x− 1)(x− 7)
Therefore x = 1 or x = 7. This gives the points (1; 0) and (7; 0).
Step 5: Plot the points and sketch the graph
158 5.1. Quadratic functions

1
2
3
4
5
−1
−2
−3
−4
−5
1 2 3 4 5 6 7 8 9−1−2
b
b
y
x0
(4;−412 )
(0; 312 )
Step 6: State the domain and range
Domain: {x : x ∈ R}
Range: {y : y ≥ −412 , y ∈ R}
See video: 22QN at www.everythingmaths.co.za
Investigation: Shifting the equation of a parabola
Carl and Eric are doing their Mathematics homework and decide to check each othersanswers.
Homework question:
If the parabola y = 3x2 + 1 is shifted 2 units to the right, determine the equation of thenew parabola.
• Carl’s answer:
A shift to the right means moving in the positive x direction, therefore x is re-placed with x+ 2 and the new equation is y = 3(x+ 2)2 + 1.
• Eric’s answer:
We replace x with x− 2, therefore the new equation is y = 3(x− 2)2 + 1.
Work together in pairs. Discuss the two different answers and decide which one iscorrect. Use calculations and sketches to help explain your reasoning.
159Chapter 5. Functions

Writing an equation of a shifted parabola
The parabola is shifted horizontally:
• If the parabola is shifted m units to the right, x is replaced by (x−m).
• If the parabola is shifted m units to the left, x is replaced by (x+m).
The parabola is shifted vertically:
• If the parabola is shifted n units down, y is replaced by (y + n).
• If the parabola is shifted n units up, y is replaced by (y − n).
Worked example 6: Shifting a parabola
QUESTION
Given y = x2 − 2x− 3.
1. If the parabola is shifted 1 unit to the right, determine the new equation of theparabola.
2. If the parabola is shifted 3 units down, determine the new equation of theparabola.
SOLUTION
Step 1: Determine the new equation of the shifted parabola
1. The parabola is shifted 1 unit to the right, so x must be replaced by (x− 1).
y = x2 − 2x− 3
= (x− 1)2 − 2(x− 1)− 3
= x2 − 2x+ 1− 2x+ 2− 3
= x2 − 4x
Be careful not to make a common error: replacing x with x+ 1 for a shift to theright.
2. The parabola is shifted 3 units down, so y must be replaced by (y + 3).
y + 3 = x2 − 2x− 3
y = x2 − 2x− 3− 3
= x2 − 2x− 6
160 5.1. Quadratic functions

Exercise 5 – 6: Sketching parabolas
1. Sketch graphs of the following functions and determine:
• intercepts
• turning point
• axes of symmetry
• domain and range
a) y = −x2 + 4x+ 5
b) y = 2(x+ 1)2
c) y = 3x2 − 2(x+ 2)
d) y = 3(x− 2)2 + 1
2. Draw the following graphs on the same system of axes:
f(x) = −x2 + 7
g(x) = −(x− 2)2 + 7
h(x) = (x− 2)2 − 7
3. Draw a sketch of each of the following graphs:
a) y = ax2 + bx+ c if a > 0, b > 0, c < 0.
b) y = ax2 + bx+ c if a < 0, b = 0, c > 0.
c) y = ax2 + bx+ c if a < 0, b < 0, b2 − 4ac < 0.
d) y = (x+ p)2 + q if p < 0, q < 0 and the x-intercepts have different signs.
e) y = a(x+ p)2 + q if a < 0, p < 0, q > 0 and one root is zero.
f) y = a(x+ p)2 + q if a > 0, p = 0, b2 − 4ac > 0.
4. Determine the new equation (in the form y = ax2 + bx+ c) if:
a) y = 2x2 + 4x+ 2 is shifted 3 units to the left.
b) y = −(x+ 1)2 is shifted 1 unit up.
c) y = 3(x− 1)2 + 2(x− 1
2
)is shifted 2 units to the right.
Think you got it? Get this answer and more practice on our Intelligent Practice Service
1a. 22QP 1b. 22QQ 1c. 22QR 1d. 22QS 2. 22QT 3a. 22QV3b. 22QW 3c. 22QX 3d. 22QY 3e. 22QZ 3f. 22R2 4a. 22R34b. 22R4 4c. 22R5
www.everythingmaths.co.za m.everythingmaths.co.za
161Chapter 5. Functions

Finding the equation of a parabola from the graph
If the intercepts are given, use y = a(x− x1)(x− x2).
Example:
y
x0
(0; 2)
(4; 0)(−1; 0)
x-intercepts: (−1; 0) and (4; 0)y = a(x− x1)(x− x2)
= a(x+ 1)(x− 4)
= ax2 − 3ax− 4ay-intercept: (0; 2)−4a = 2
a = −1
2Equation of the parabola:y = ax2 − 3ax− 4a
= −1
2x2 − 3
(−1
2
)x− 4
(−1
2
)= −1
2x2 +
3
2x+ 2
If the x-intercepts and another point are given, use y = a(x− x1)(x− x2).
Example:
b
y
x0
(−1; 12)
(1; 0) (5; 0)
x-intercepts: (1; 0) and (5; 0)y = a(x− x1)(x− x2)
= a(x− 1)(x− 5)
= ax2 − 6ax+ 5aSubstitute the point: (−1; 12)12 = a(−1)2 − 6a(−1) + 5a
12 = a+ 6a+ 5a
12 = 12a
1 = aEquation of the parabola:y = ax2 − 6ax+ 5a
= x2 − 6x+ 5
If the turning point and another point are given, use y = a(x+ p)2 + q.
Example:
b
b
y
x0
(1; 5)
(−3; 1)
Turning point: (−3; 1)y = a(x+ p)2 + q
= a(x+ 3)2 + 1
= ax2 + 6ax+ 9a+ 1Substitute the point: (1; 5)5 = a(1)2 + 6a(1) + 9a+ 1
4 = 16a
1
4= a
Equation of the parabola:y = 1
4(x+ 3)2 + 1
162 5.1. Quadratic functions
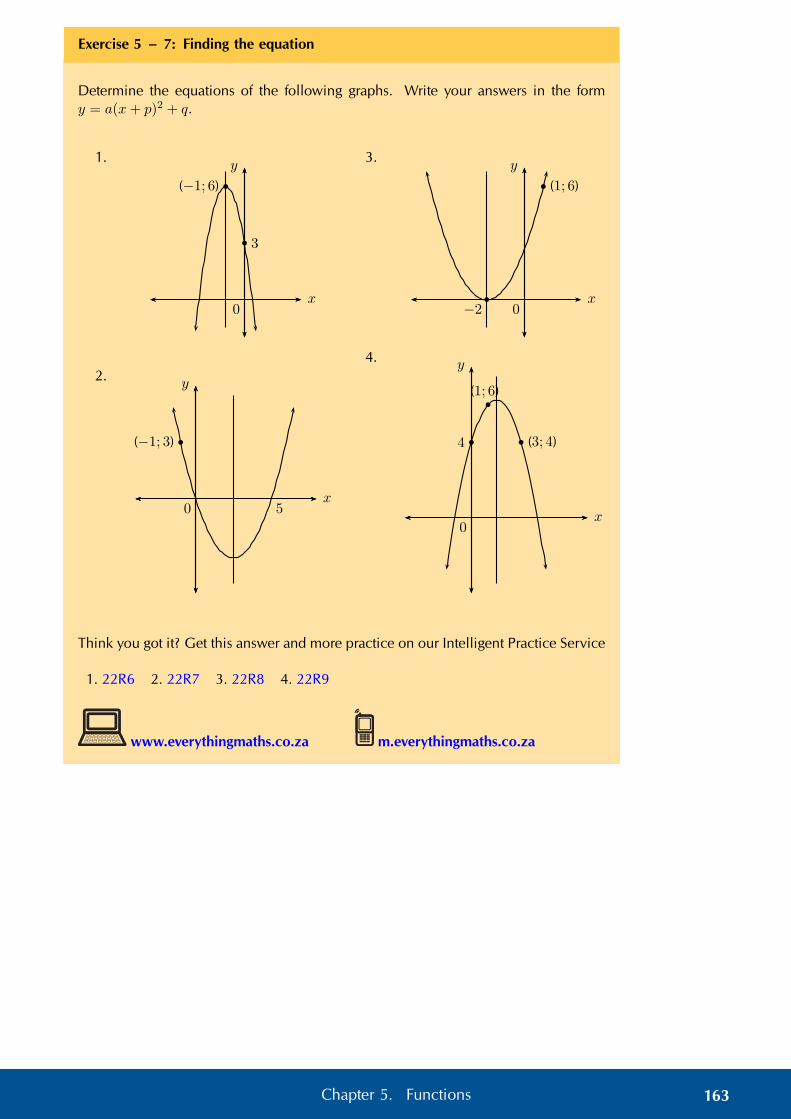
Exercise 5 – 7: Finding the equation
Determine the equations of the following graphs. Write your answers in the formy = a(x+ p)2 + q.
1.
b
b
y
x0
3
(−1; 6)
2.
b
y
x0
(−1; 3)
5
3.
b
b
y
x0
(1; 6)
−2
4.
b
bb
y
x0
(1; 6)
(3; 4)4
Think you got it? Get this answer and more practice on our Intelligent Practice Service
1. 22R6 2. 22R7 3. 22R8 4. 22R9
www.everythingmaths.co.za m.everythingmaths.co.za
163Chapter 5. Functions

5.2 Average gradient EMBGN
We notice that the gradient of a curve changes at every point on the curve, thereforewe need to work with the average gradient. The average gradient between any twopoints on a curve is the gradient of the straight line passing through the two points.
y
x0
b
b
A(−3; 7)
C(−1;−1)
For the diagram above, the gradient of the line AC is
Gradient =yA − yCxA − xC
=7− (−1)
−3− (−1)
=8
−2
= −4
This is the average gradient of the curve between the points A and C.
What happens to the gradient if we fix the position of one point and move the secondpoint closer to the fixed point?
See video: 22RB at www.everythingmaths.co.za
Investigation: Gradient at a single point on a curve
The curve shown here is defined by y = −2x2 − 5.Point B is fixed at (0;−5) and the position of pointA varies.
Complete the table below by calculating the y-coordinates of point A for the given x-coordinatesand then calculating the average gradient betweenpoints A and B.
y
x0
b
b
A
B(0;−5)
164 5.2. Average gradient

xA yA Average gradient−2
−1,5
−1
−0,5
0
0,5
1
1,5
2
1. What happens to the average gradient as A moves towards B?
2. What happens to the average gradient as A moves away from B?
3. What is the average gradient when A overlaps with B?
In the example above, the gradient of the straight line that passes through points A andC changes as A moves closer to C. At the point where A and C overlap, the straightline only passes through one point on the curve. This line is known as a tangent to thecurve.
y
x0
b
b
A
C
y
x0
b
b
A
C
y
x0bbAC
y
x0
bb
AC
We therefore introduce the idea of the gradient at a single point on a curve. Thegradient at a point on a curve is the gradient of the tangent to the curve at the givenpoint.
165Chapter 5. Functions

Worked example 7: Average gradient
QUESTION
y
x0
b
b
P (a; g(a))
Q(a+ h; g(a+ h))g(x) = x2
1. Find the average gradient between two points P (a; g(a)) andQ (a+ h; g(a+ h))on a curve g(x) = x2.
2. Determine the average gradient between P (2; g(2)) and Q (5; g(5)).
3. Explain what happens to the average gradient if Q moves closer to P .
SOLUTION
Step 1: Assign labels to the x-values for the given points
x1 = a
x2 = a+ h
Step 2: Determine the corresponding y-coordinates
Using the function g(x) = x2, we can determine:
y1 = g(a)
= a2
y2 = g(a+ h)
= (a+ h)2
= a2 + 2ah+ h2
166 5.2. Average gradient
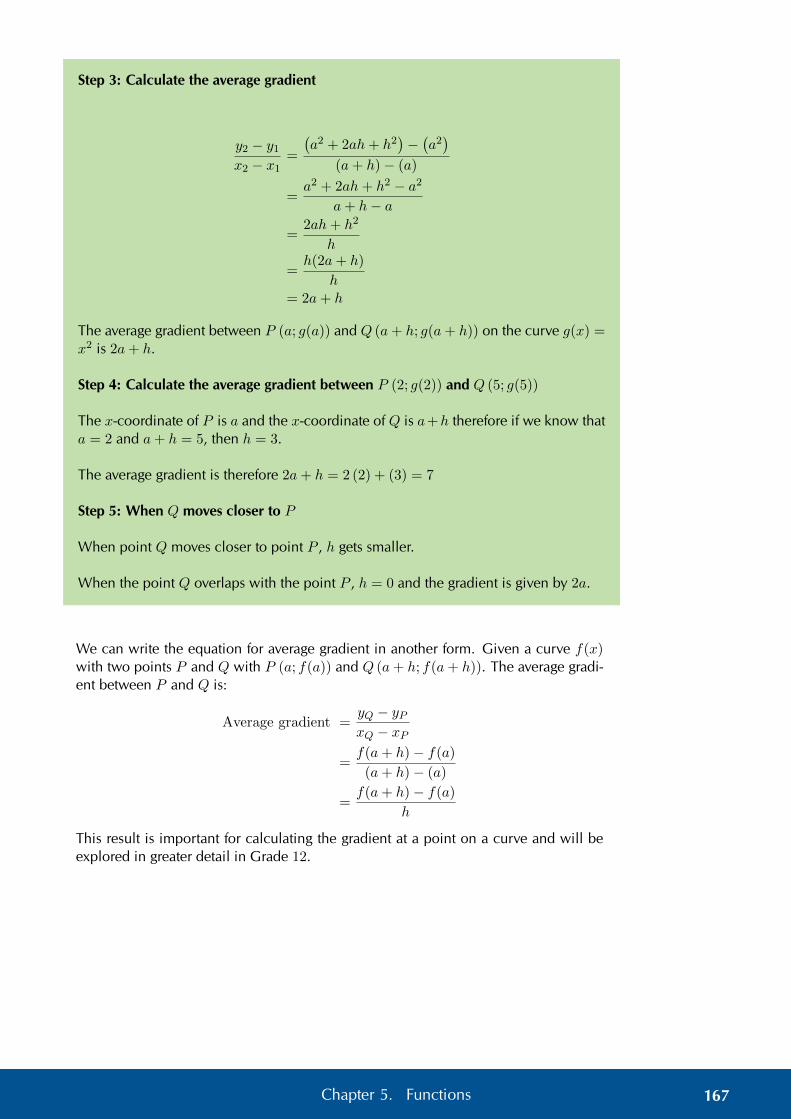
Step 3: Calculate the average gradient
y2 − y1x2 − x1
=
(a2 + 2ah+ h2
)−(a2)
(a+ h)− (a)
=a2 + 2ah+ h2 − a2
a+ h− a
=2ah+ h2
h
=h(2a+ h)
h= 2a+ h
The average gradient between P (a; g(a)) and Q (a+ h; g(a+ h)) on the curve g(x) =x2 is 2a+ h.
Step 4: Calculate the average gradient between P (2; g(2)) and Q (5; g(5))
The x-coordinate of P is a and the x-coordinate of Q is a+h therefore if we know thata = 2 and a+ h = 5, then h = 3.
The average gradient is therefore 2a+ h = 2 (2) + (3) = 7
Step 5: When Q moves closer to P
When point Q moves closer to point P , h gets smaller.
When the point Q overlaps with the point P , h = 0 and the gradient is given by 2a.
We can write the equation for average gradient in another form. Given a curve f(x)with two points P and Q with P (a; f(a)) and Q (a+ h; f(a+ h)). The average gradi-ent between P and Q is:
Average gradient =yQ − yPxQ − xP
=f(a+ h)− f(a)
(a+ h)− (a)
=f(a+ h)− f(a)
h
This result is important for calculating the gradient at a point on a curve and will beexplored in greater detail in Grade 12.
167Chapter 5. Functions
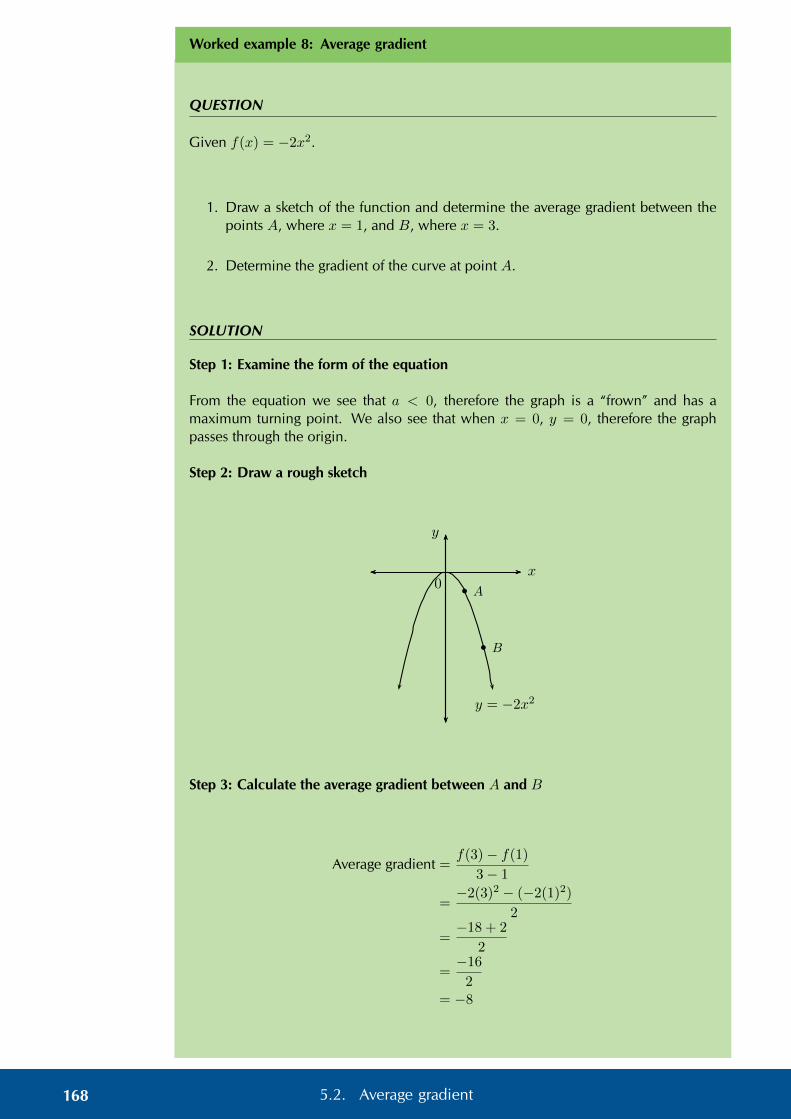
Worked example 8: Average gradient
QUESTION
Given f(x) = −2x2.
1. Draw a sketch of the function and determine the average gradient between thepoints A, where x = 1, and B, where x = 3.
2. Determine the gradient of the curve at point A.
SOLUTION
Step 1: Examine the form of the equation
From the equation we see that a < 0, therefore the graph is a “frown” and has amaximum turning point. We also see that when x = 0, y = 0, therefore the graphpasses through the origin.
Step 2: Draw a rough sketch
y = −2x2
x
y
0 b
b
A
B
Step 3: Calculate the average gradient between A and B
Average gradient =f(3)− f(1)
3− 1
=−2(3)2 − (−2(1)2)
2
=−18 + 2
2
=−16
2= −8
168 5.2. Average gradient
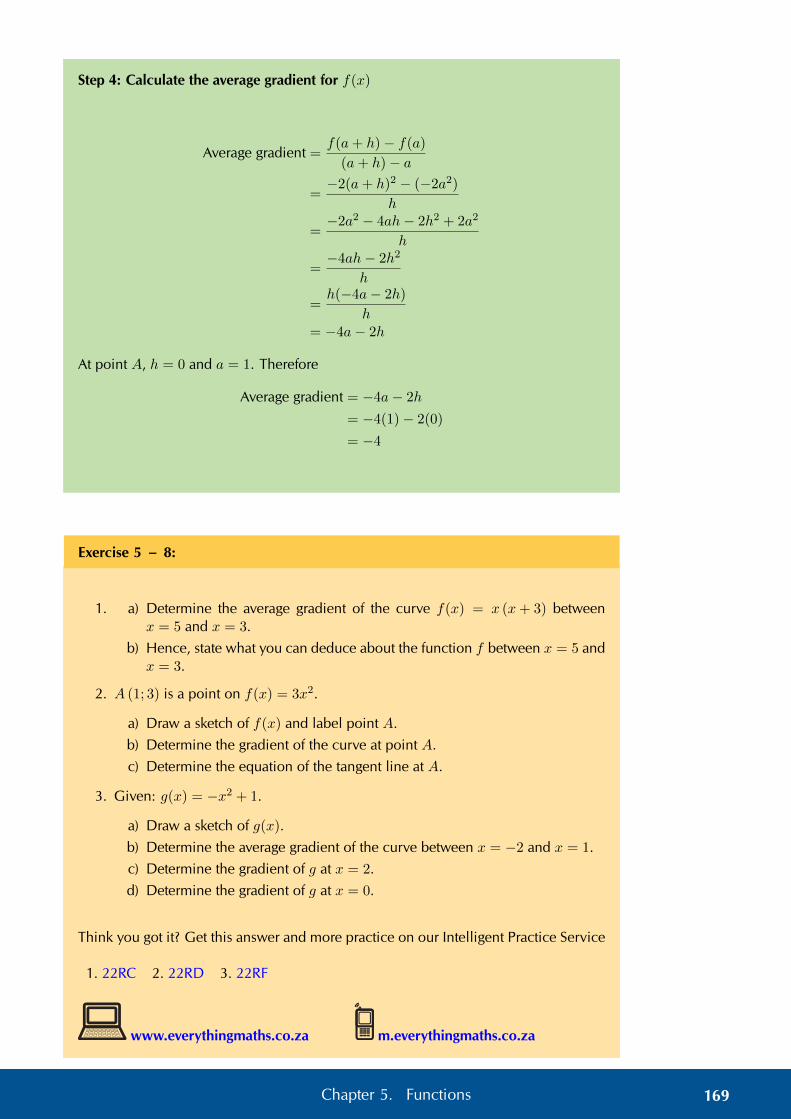
Step 4: Calculate the average gradient for f(x)
Average gradient =f(a+ h)− f(a)
(a+ h)− a
=−2(a+ h)2 − (−2a2)
h
=−2a2 − 4ah− 2h2 + 2a2
h
=−4ah− 2h2
h
=h(−4a− 2h)
h= −4a− 2h
At point A, h = 0 and a = 1. Therefore
Average gradient = −4a− 2h
= −4(1)− 2(0)
= −4
Exercise 5 – 8:
1. a) Determine the average gradient of the curve f(x) = x (x+ 3) betweenx = 5 and x = 3.
b) Hence, state what you can deduce about the function f between x = 5 andx = 3.
2. A (1; 3) is a point on f(x) = 3x2.
a) Draw a sketch of f(x) and label point A.
b) Determine the gradient of the curve at point A.
c) Determine the equation of the tangent line at A.
3. Given: g(x) = −x2 + 1.
a) Draw a sketch of g(x).
b) Determine the average gradient of the curve between x = −2 and x = 1.
c) Determine the gradient of g at x = 2.
d) Determine the gradient of g at x = 0.
Think you got it? Get this answer and more practice on our Intelligent Practice Service
1. 22RC 2. 22RD 3. 22RF
www.everythingmaths.co.za m.everythingmaths.co.za
169Chapter 5. Functions

5.3 Hyperbolic functions EMBGP
Revision EMBGQ
Functions of the form y = ax + q
Functions of the general form y = ax + q are called hyperbolic functions, where a and
q are constants.
The effects of a and q on f(x) = ax + q:
• The effect of q on vertical shift
– For q > 0, f(x) is shifted vertically upwards by q units.
– For q < 0, f(x) is shifted vertically downwards by q units.
– The horizontal asymptote is the line y = q.
– The vertical asymptote is the y-axis, the line x = 0.
• The effect of a on shape and quad-rants
– For a > 0, f(x) lies in the firstand third quadrants.
– For a > 1, f(x) will be furtheraway from both axes than y =1x .
– For 0 < a < 1, as a tends to0, f(x) moves closer to the axesthan y = 1
x .
– For a < 0, f(x) lies in the sec-ond and fourth quadrants.
– For a < −1, f(x) will be furtheraway from both axes than y =− 1x .
– For −1 < a < 0, as a tends to0, f(x) moves closer to the axesthan y = − 1
x .
a < 0 a > 0
q > 0
q = 0
q < 0
Exercise 5 – 9: Revision
1. Consider the following hyperbolic functions:
• y1 = 1x
• y2 = − 4x
• y3 = 4x − 2
• y4 = − 4x + 1
170 5.3. Hyperbolic functions

Complete the table to summarise the properties of the hyperbolic function:
y1 y2 y3 y4value of q q = 0
effect of q no vertical shiftvalue of a a = 1
effect of a lies in I and III quadasymptotes y-axis, x = 0
x-axis, y = 0
axes of symmetry y = xy = −x
domain {x : x ∈ R, x 6= 0}range {y : y ∈ R, y 6= 0}
Think you got it? Get this answer and more practice on our Intelligent Practice Service
1. 22RG
www.everythingmaths.co.za m.everythingmaths.co.za
See video: 22RH at www.everythingmaths.co.za
Functions of the form y = ax+p + q EMBGR
We now consider hyperbolic functions of the form y = ax+p + q and the effects of
parameter p.
Investigation: The effects of a, p and q on a hyperbolic graph
1. On the same system of axes, plot the following graphs:
a) y1 = 1x
b) y2 = 1x−2
c) y3 = 1x−1
d) y4 = 1x+1
Use your sketches of the functions above to complete the following table:
y1 y2 y3 y4intercept(s)asymptotesaxes of symmetrydomainrangeeffect of p
171Chapter 5. Functions

2. Complete the following sentences for functions of the form y = ax+p + q:
a) A change in p causes a . . . . . . shift.
b) If the value of p increases, the graph and the vertical asymptote . . . . . .
c) If the value of q changes, then the . . . . . . asymptote of the hyperbola willshift.
d) If the value of p decreases, the graph and the vertical asymptote . . . . . .
The effect of the parameters on y = ax+p + q
The effect of p is a horizontal shift because all points are moved the same distance inthe same direction (the entire graph slides to the left or to the right).
• For p > 0, the graph is shifted to the left by p units.
• For p < 0, the graph is shifted to the right by p units.
The value of p also affects the vertical asymptote, the line x = −p.
The effect of q is a vertical shift. The value of q also affects the horizontal asymptotes,the line y = q.
The value of a affects the shape of the graph and its position on the Cartesian plane.
p > 0 p < 0
a < 0 a > 0 a < 0 a > 0
q > 0
q < 0
172 5.3. Hyperbolic functions

Discovering the characteristics
For functions of the general form: f(x) = y = ax+p + q:
Domain and range
The domain is {x : x ∈ R, x 6= −p}. If x = −p, the dominator is equal to zero and thefunction is undefined.
We see thaty =
a
x+ p+ q
can be re-written as:y − q =
a
x+ p
If x 6= −p then:
(y − q) (x+ p) = a
x+ p =a
y − q
The range is therefore {y : y ∈ R, y 6= q}.
These restrictions on the domain and range determine the vertical asymptote x = −pand the horizontal asymptote y = q.
Worked example 9: Domain and range
QUESTION
Determine the domain and range for g(x) = 2x+1 + 2.
SOLUTION
Step 1: Determine the domain
The domain is {x : x ∈ R, x 6= −1} since g(x) is undefined for x = −1.
Step 2: Determine the range
Let g(x) = y:
y =2
x+ 1+ 2
y − 2 =2
x+ 1
(y − 2)(x+ 1) = 2
x+ 1 =2
y − 2
Therefore the range is {g(x) : g(x) ∈ R, g(x) 6= 2}.
173Chapter 5. Functions

Exercise 5 – 10: Domain and range
Determine the domain and range for each of the following functions:
1. y = 1x + 1
2. g(x) = 8x−8 + 4
3. y = − 4x+1 − 3
4. x = 23−y + 5
5. (y − 2)(x+ 2) = 3
Think you got it? Get this answer and more practice on our Intelligent Practice Service
1. 22RJ 2. 22RK 3. 22RM 4. 22RN 5. 22RP
www.everythingmaths.co.za m.everythingmaths.co.za
Intercepts
The y-intercept:
To calculate the y-intercept we let x = 0. For example, the y-intercept of g(x) = 2x+1+2
is determined by setting x = 0:
g(x) =2
x+ 1+ 2
g(0) =2
0 + 1+ 2
= 2 + 2
= 4
This gives the point (0; 4).
The x-intercept:
To calculate the x-intercept we let y = 0. For example, the x-intercept of g(x) = 2x+1+2
is determined by setting y = 0:
g(x) =2
x+ 1+ 2
0 =2
x+ 1+ 2
−2 =2
x+ 1
−2(x+ 1) = 2
−2x− 2 = 2
−2x = 4
x = −2
This gives the point (−2; 0).
174 5.3. Hyperbolic functions
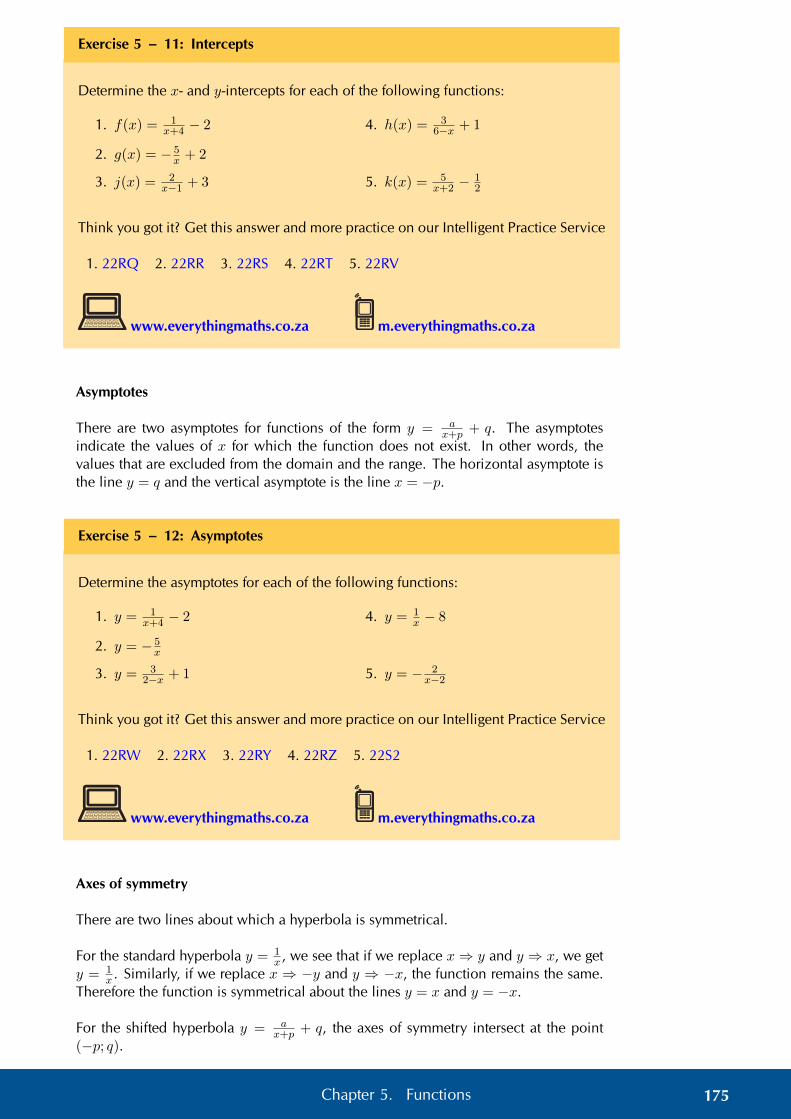
Exercise 5 – 11: Intercepts
Determine the x- and y-intercepts for each of the following functions:
1. f(x) = 1x+4 − 2
2. g(x) = − 5x + 2
3. j(x) = 2x−1 + 3
4. h(x) = 36−x + 1
5. k(x) = 5x+2 −
12
Think you got it? Get this answer and more practice on our Intelligent Practice Service
1. 22RQ 2. 22RR 3. 22RS 4. 22RT 5. 22RV
www.everythingmaths.co.za m.everythingmaths.co.za
Asymptotes
There are two asymptotes for functions of the form y = ax+p + q. The asymptotes
indicate the values of x for which the function does not exist. In other words, thevalues that are excluded from the domain and the range. The horizontal asymptote isthe line y = q and the vertical asymptote is the line x = −p.
Exercise 5 – 12: Asymptotes
Determine the asymptotes for each of the following functions:
1. y = 1x+4 − 2
2. y = − 5x
3. y = 32−x + 1
4. y = 1x − 8
5. y = − 2x−2
Think you got it? Get this answer and more practice on our Intelligent Practice Service
1. 22RW 2. 22RX 3. 22RY 4. 22RZ 5. 22S2
www.everythingmaths.co.za m.everythingmaths.co.za
Axes of symmetry
There are two lines about which a hyperbola is symmetrical.
For the standard hyperbola y = 1x , we see that if we replace x⇒ y and y ⇒ x, we get
y = 1x . Similarly, if we replace x ⇒ −y and y ⇒ −x, the function remains the same.
Therefore the function is symmetrical about the lines y = x and y = −x.
For the shifted hyperbola y = ax+p + q, the axes of symmetry intersect at the point
(−p; q).
175Chapter 5. Functions

To determine the axes of symmetry we define the two straight lines y1 = m1x+ c1 andy2 = m2x + c2. For the standard and shifted hyperbolic function, the gradient of oneof the lines of symmetry is 1 and the gradient of the other line of symmetry is −1. Theaxes of symmetry are perpendicular to each other and the product of their gradientsequals −1. Therefore we let y1 = x+ c1 and y2 = −x+ c2. We then substitute (−p; q),the point of intersection of the axes of symmetry, into both equations to determine thevalues of c1 and c2.
Worked example 10: Axes of symmetry
QUESTION
Determine the axes of symmetry for y = 2x+1 − 2.
SOLUTION
Step 1: Determine the point of intersection (−p; q)
From the equation we see that p = 1 and q = −2. So the axes of symmetry willintersect at (−1;−2).
Step 2: Define two straight line equations
y1 = x+ c1
y2 = −x+ c2
Step 3: Solve for c1 and c2
Use (−1;−2) to solve for c1:
y1 = x+ c1
−2 = −1 + c1
−1 = c1
Use (−1;−2) to solve for c2:
y2 = −x+ c2
−2 = −(−1) + c2
−3 = c2
Step 4: Write the final answer
The axes of symmetry for y = 2x+1 − 2 are the lines
y1 = x− 1
y2 = −x− 3
176 5.3. Hyperbolic functions
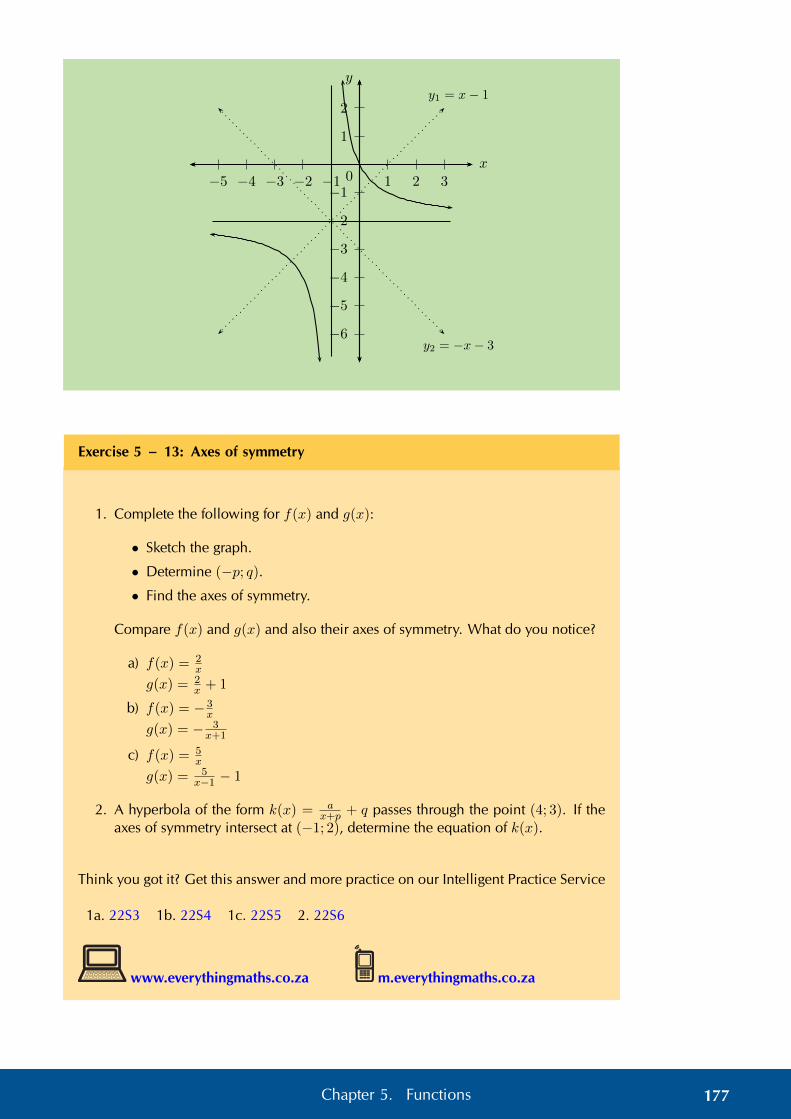
1
2
−1
−2
−3
−4
−5
−6
1 2 3−1−2−3−4−5
y
x0
y1 = x− 1
y2 = −x− 3
Exercise 5 – 13: Axes of symmetry
1. Complete the following for f(x) and g(x):
• Sketch the graph.
• Determine (−p; q).• Find the axes of symmetry.
Compare f(x) and g(x) and also their axes of symmetry. What do you notice?
a) f(x) = 2x
g(x) = 2x + 1
b) f(x) = − 3x
g(x) = − 3x+1
c) f(x) = 5x
g(x) = 5x−1 − 1
2. A hyperbola of the form k(x) = ax+p + q passes through the point (4; 3). If the
axes of symmetry intersect at (−1; 2), determine the equation of k(x).
Think you got it? Get this answer and more practice on our Intelligent Practice Service
1a. 22S3 1b. 22S4 1c. 22S5 2. 22S6
www.everythingmaths.co.za m.everythingmaths.co.za
177Chapter 5. Functions
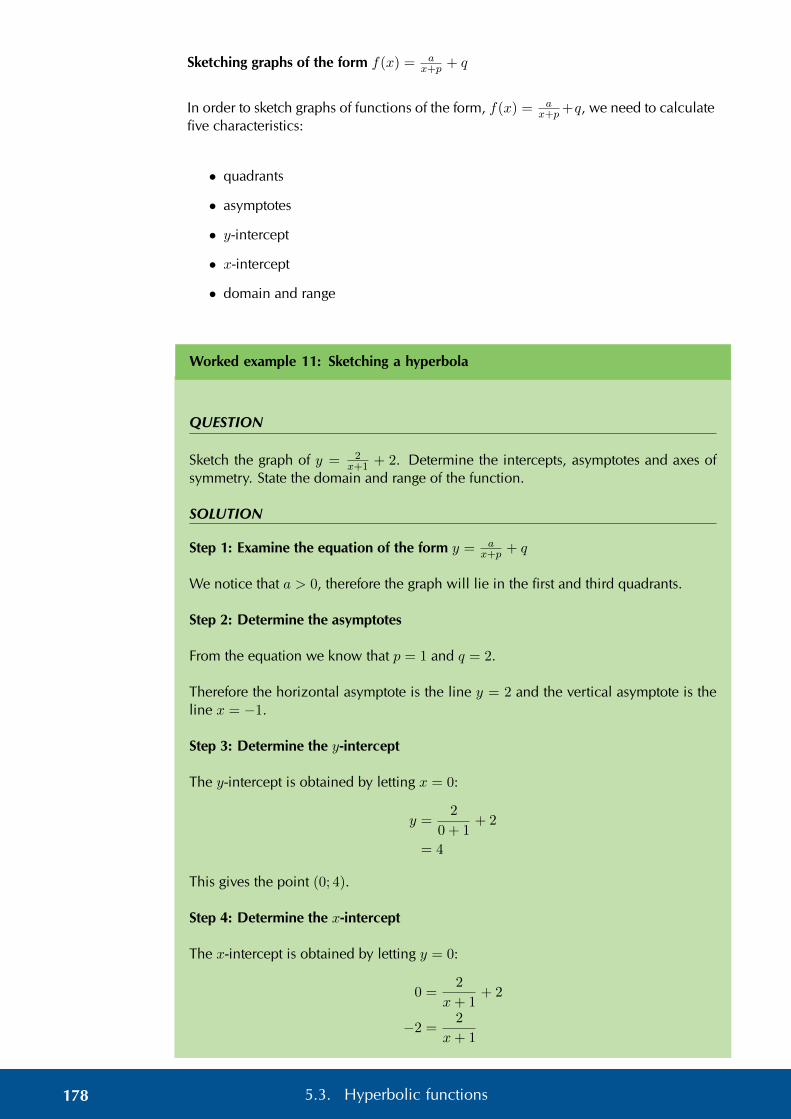
Sketching graphs of the form f(x) = ax+p + q
In order to sketch graphs of functions of the form, f(x) = ax+p+q, we need to calculate
five characteristics:
• quadrants
• asymptotes
• y-intercept
• x-intercept
• domain and range
Worked example 11: Sketching a hyperbola
QUESTION
Sketch the graph of y = 2x+1 + 2. Determine the intercepts, asymptotes and axes of
symmetry. State the domain and range of the function.
SOLUTION
Step 1: Examine the equation of the form y = ax+p + q
We notice that a > 0, therefore the graph will lie in the first and third quadrants.
Step 2: Determine the asymptotes
From the equation we know that p = 1 and q = 2.
Therefore the horizontal asymptote is the line y = 2 and the vertical asymptote is theline x = −1.
Step 3: Determine the y-intercept
The y-intercept is obtained by letting x = 0:
y =2
0 + 1+ 2
= 4
This gives the point (0; 4).
Step 4: Determine the x-intercept
The x-intercept is obtained by letting y = 0:
0 =2
x+ 1+ 2
−2 =2
x+ 1
178 5.3. Hyperbolic functions

−2(x+ 1) = 2
−2x− 2 = 2
−2x = 4
x = −2
This gives the point (−2; 0).
Step 5: Determine the axes of symmetry
Using (−1; 2) to solve for c1:
y1 = x+ c1
2 = −1 + c1
3 = c1
y2 = −x+ c2
2 = −(−1) + c2
1 = c2
Therefore the axes of symmetry are y = x+ 3 and y = −x+ 1.
Step 6: Plot the points and sketch the graph
1
2
3
4
5
6
−1
−2
−3
1 2 3−1−2−3−4−5
y
x0
y = x+ 3
y = −x+ 1
Step 7: State the domain and range
Domain: {x : x ∈ R, x 6= −1}
Range: {y : y ∈ R, y 6= 2}
179Chapter 5. Functions

Worked example 12: Sketching a hyperbola
QUESTION
Use horizontal and vertical shifts to sketch the graph of f(x) = 1x−2 + 3.
SOLUTION
Step 1: Examine the equation of the form y = ax+p + q
We notice that a > 0, therefore the graph will lie in the first and third quadrants.
Step 2: Sketch the standard hyperbola y = 1x
Start with a sketch of the standard hyperbola g(x) = 1x . The vertical asymptote is x = 0
and the horizontal asymptote is y = 0.
1
2
3
4
−1
−2
−3
−4
1 2 3 4−1−2−3−4
y
x0
Step 3: Determine the vertical shift
From the equation we see that q = 3, which means g(x) must shifted 3 units up. Thehorizontal asymptote is also shifted 3 units up to y = 3 .
1
2
3
4
5
6
7
−11 2 3 4−1−2−3−4
y
x0
Step 4: Determine the horizontal shift
From the equation we see that p = −2, which means g(x) must shifted 2 units to theright. The vertical asymptote is also shifted 2 units to the right.
180 5.3. Hyperbolic functions

1
2
3
4
5
6
7
−11 2 3 4 5 6−1−2
y
x0
Step 5: Determine the y-intercept
The y-intercept is obtained by letting x = 0:
y =1
0− 2+ 3
= 21
2
This gives the point (0; 212).
Step 6: Determine the x-intercept
The x-intercept is obtained by letting y = 0:
0 =1
x− 2+ 3
−3 =1
x− 2
−3(x− 2) = 1
−3x+ 6 = 1
−3x = −5
x =5
3
This gives the point (53 ; 0).
Step 7: Determine the domain and range
Domain: {x : x ∈ R, x 6= 2}
Range: {y : y ∈ R, y 6= 3}
181Chapter 5. Functions

Worked example 13: Finding the equation of a hyperbola from the graph
QUESTION
Use the graph below to determine the values of a, p and q for y = ax+p + q.
1
2
3
4
5
6
7
−11 2 3−1−2−3−4−5
y
x0
SOLUTION
Step 1: Examine the graph and deduce the sign of a
We notice that the graph lies in the second and fourth quadrants, therefore a < 0.
Step 2: Determine the asymptotes
From the graph we see that the vertical asymptote is x = −1, therefore p = 1. Thehorizontal asymptote is y = 3, and therefore q = 3.
y =a
x+ 1+ 3
Step 3: Determine the value of a
To determine the value of a we substitute a point on the graph, namely (0; 0):
y =a
x+ 1+ 3
0 =a
0 + 1+ 3
∴ −3 = a
Step 4: Write the final answer
y = − 3
x+ 1+ 3
182 5.3. Hyperbolic functions
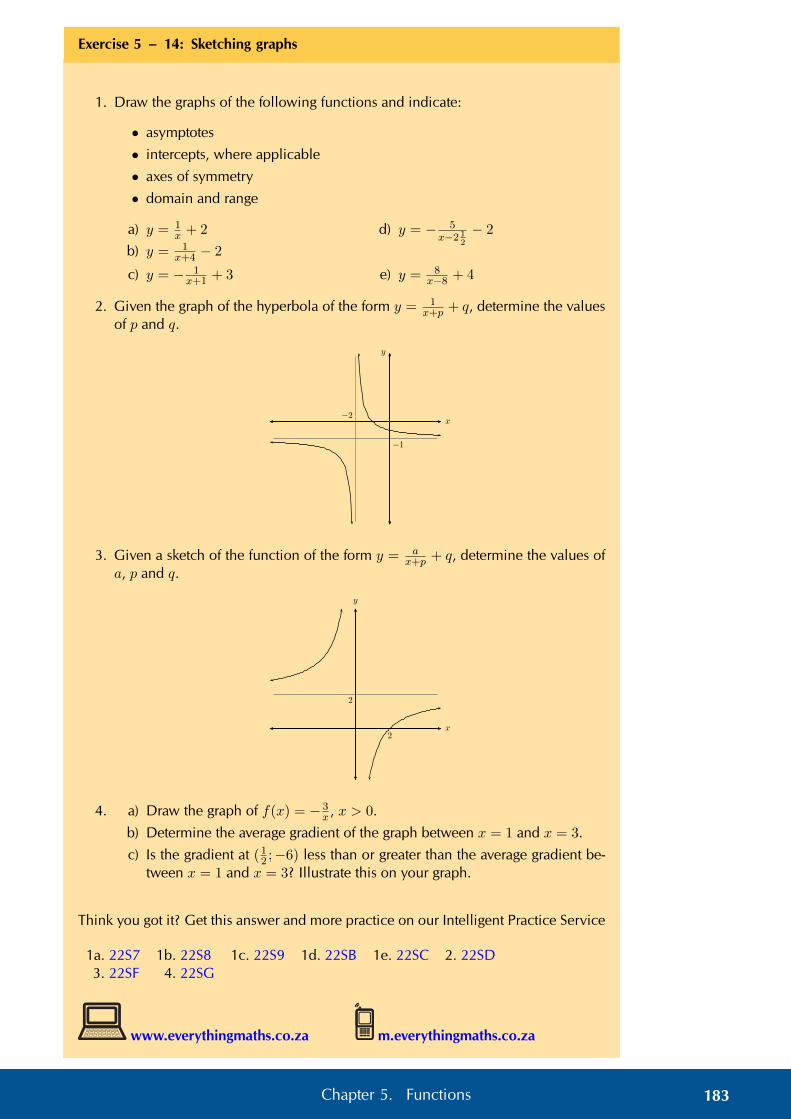
Exercise 5 – 14: Sketching graphs
1. Draw the graphs of the following functions and indicate:
• asymptotes
• intercepts, where applicable
• axes of symmetry
• domain and range
a) y = 1x + 2
b) y = 1x+4 − 2
c) y = − 1x+1 + 3
d) y = − 5x−2 1
2
− 2
e) y = 8x−8 + 4
2. Given the graph of the hyperbola of the form y = 1x+p + q, determine the values
of p and q.
y
x−2
−1
3. Given a sketch of the function of the form y = ax+p + q, determine the values of
a, p and q.
y
x
2
2
4. a) Draw the graph of f(x) = − 3x , x > 0.
b) Determine the average gradient of the graph between x = 1 and x = 3.
c) Is the gradient at (12 ;−6) less than or greater than the average gradient be-tween x = 1 and x = 3? Illustrate this on your graph.
Think you got it? Get this answer and more practice on our Intelligent Practice Service
1a. 22S7 1b. 22S8 1c. 22S9 1d. 22SB 1e. 22SC 2. 22SD3. 22SF 4. 22SG
www.everythingmaths.co.za m.everythingmaths.co.za
183Chapter 5. Functions

5.4 Exponential functions EMBGS
Revision EMBGT
Functions of the form y = abx + q
Functions of the general form y = abx + q, for b > 0, are called exponential functions,where a, b and q are constants.
The effects of a, b and q on f(x) = abx + q:
• The effect of q on vertical shift
– For q > 0, f(x) is shifted verti-cally upwards by q units.
– For q < 0, f(x) is shifted verti-cally downwards by q units.
– The horizontal asymptote is theline y = q.
• The effect of a on shape
– For a > 0, f(x) is increasing.
– For a < 0, f(x) is decreasing.The graph is reflected about thehorizontal asymptote.
• The effect of b on direction
Assuming a > 0:
– If b > 1, f(x) is an increasingfunction.
– If 0 < b < 1, f(x) is a decreas-ing function.
– If b ≤ 0, f(x) is not defined.
b > 1 a < 0 a > 0
q > 0
q < 0
0 < b < 1 a < 0 a > 0
q > 0
q < 0
Exercise 5 – 15: Revision
1. On separate axes, accurately draw each of the following functions:
• Use tables of values if necessary.
• Use graph paper if available.
a) y1 = 3x
b) y2 = −2× 3x
c) y3 = 2× 3x + 1
d) y4 = 3x − 2
2. Use your sketches of the functions given above to complete the following table(the first column has been completed as an example):
184 5.4. Exponential functions

y1 y2 y3 y4value of q q = 0
effect of q no vertical shiftvalue of a a = 1
effect of a increasingasymptote x-axis, y = 0
domain {x : x ∈ R}range {y : y ∈ R, y > 0}
Think you got it? Get this answer and more practice on our Intelligent Practice Service
1a. 22SH 1b. 22SJ 1c. 22SK 1d. 22SM 2. 22SN
www.everythingmaths.co.za m.everythingmaths.co.za
Functions of the form y = ab(x+p) + q EMBGV
We now consider exponential functions of the form y = ab(x+p) + q and the effects ofparameter p.
See video: 22SP at www.everythingmaths.co.za
Investigation: The effects of a, p and q on an exponential graph
1. On the same system of axes, plot the following graphs:
a) y1 = 2x
b) y2 = 2(x−2)
c) y3 = 2(x−1)
d) y4 = 2(x+1)
e) y5 = 2(x+2)
Use your sketches of the functions above to complete the following table:
y1 y2 y3 y4 y5intercept(s)asymptotedomainrangeeffect of p
2. On the same system of axes, plot the following graphs:
a) y1 = 2(x−1) + 2
185Chapter 5. Functions

b) y2 = 3× 2(x−1) + 2
c) y3 = 12 × 2(x−1) + 2
d) y4 = 0× 2(x−1) + 2
e) y5 = −3× 2(x−1) + 2
Use your sketches of the functions above to complete the following table:
y1 y2 y3 y4 y5intercept(s)asymptotesdomainrangeeffect of a
The effect of the parameters on y = abx+p + q
The effect of p is a horizontal shift because all points are moved the same distance inthe same direction (the entire graph slides to the left or to the right).
• For p > 0, the graph is shifted to the left by p units.
• For p < 0, the graph is shifted to the right by p units.
The effect of q is a vertical shift. The value of q also affects the horizontal asymptotes,the line y = q.
The value of a affects the shape of the graph and its position relative to the horizontalasymptote.
• For a > 0, the graph lies above the horizontal asymptote, y = q.
• For a < 0, the graph lies below the horizontal asymptote, y = q.
p > 0 p < 0
a < 0 a > 0 a < 0 a > 0
q > 0
q < 0
186 5.4. Exponential functions

Discovering the characteristics
For functions of the general form: f(x) = y = ab(x+p) + q:
Domain and range
The domain is {x : x ∈ R} because there is no value of x for which f(x) is undefined.
The range of f(x) depends on whether the value for a is positive or negative.
If a > 0 we have:
b(x+p) > 0
ab(x+p) > 0
ab(x+p) + q > q
f(x) > q
The range is therefore {y : y > q, y ∈ R}.
Similarly, if a < 0, the range is {y : y < q, y ∈ R}.
Worked example 14: Domain and range
QUESTION
State the domain and range for g(x) = 5× 3(x+1) − 1.
SOLUTION
Step 1: Determine the domain
The domain is {x : x ∈ R} because there is no value of x for which g(x) is undefined.
Step 2: Determine the range
The range of g(x) can be calculated from:
3(x+1) > 0
5× 3(x+1) > 0
5× 3(x+1) − 1 > −1
∴ g(x) > −1
Therefore the range is {g(x) : g(x) > −1} or in interval notation (−1;∞).
187Chapter 5. Functions

Exercise 5 – 16: Domain and range
Give the domain and range for each of the following functions:
1. y =(32
)(x+3)
2. f(x) = −5(x−2) + 1
3. y + 3 = 2(x+1)
4. y = n+ 3(x−m)
5. y2 = 3(x−1) − 1
Think you got it? Get this answer and more practice on our Intelligent Practice Service
1. 22SQ 2. 22SR 3. 22SS 4. 22ST 5. 22SV
www.everythingmaths.co.za m.everythingmaths.co.za
Intercepts
The y-intercept:
To calculate the y-intercept we let x = 0. For example, the y-intercept of g(x) =3× 2(x+1) + 2 is determined by setting x = 0:
g(0) = 3× 2(0+1) + 2
= 3× 2 + 2
= 8
This gives the point (0; 8).
The x-intercept:
To calculate the x-intercept we let y = 0. For example, the x-intercept of g(x) =3× 2(x+1) + 2 is determined by setting y = 0:
0 = 3× 2(x+1) + 2
−2 = 3× 2(x+1)
−2
3= 2(x+1)
which has no real solutions. Therefore, the graph of g(x) lies above the x-axis anddoes not have any x-intercepts.
188 5.4. Exponential functions

Exercise 5 – 17: Intercepts
Determine the x- and y-intercepts for each of the following functions:
1. f(x) = 2(x+1) − 8
2. y = 2× 3(x−1) − 18
3. y + 5(x+2) = 5
4. y = 12
(32
)(x+3) − 0,75
Think you got it? Get this answer and more practice on our Intelligent Practice Service
1. 22SW 2. 22SX 3. 22SY 4. 22SZ
www.everythingmaths.co.za m.everythingmaths.co.za
Asymptote
Exponential functions of the form y = ab(x+p) + q have a horizontal asymptote, theline y = q.
Worked example 15: Asymptote
QUESTION
Determine the asymptote for y = 5× 3(x+1) − 1.
SOLUTION
Step 1: Determine the asymptote
The asymptote of g(x) can be calculated as:
3(x+1) 6= 0
5× 3(x+1) 6= 0
5× 3(x+1) − 1 6= −1
∴ y 6= −1
Therefore the asymptote is the line y = −1.
189Chapter 5. Functions

Exercise 5 – 18: Asymptote
Give the asymptote for each of the following functions:
1. y = −5(x+1)
2. y = 3(x−2) + 1
3.(3y2
)= 5(x+3) − 1
4. y = 7(x+1) − 2
5. y2 + 1 = 3(x+2)
Think you got it? Get this answer and more practice on our Intelligent Practice Service
1. 22T2 2. 22T3 3. 22T4 4. 22T5 5. 22T6
www.everythingmaths.co.za m.everythingmaths.co.za
Sketching graphs of the form f(x) = ab(x+p) + q
In order to sketch graphs of functions of the form, f(x) = ab(x+p) + q, we need todetermine five characteristics:
• shape
• y-intercept
• x-intercept
• asymptote
• domain and range
Worked example 16: Sketching an exponential graph
QUESTION
Sketch the graph of 2y = 10× 2(x+1) − 5.
Mark the intercept(s) and asymptote. State the domain and range of the function.
SOLUTION
Step 1: Examine the equation of the form y = ab(x+p) + q
We notice that a > 0 and b > 1, therefore the function is increasing.
190 5.4. Exponential functions

Step 2: Determine the y-intercept
The y-intercept is obtained by letting x = 0:
2y = 10× 2(0+1) − 5
= 10× 2− 5
= 15
∴ y = 71
2
This gives the point (0; 712).
Step 3: Determine the x-intercept
The x-intercept is obtained by letting y = 0:
0 = 10× 2(x+1) − 5
5 = 10× 2(x+1)
1
2= 2(x+1)
2−1 = 2(x+1)
∴ −1 = x+ 1 (same base)
−2 = x
This gives the point (−2; 0).
Step 4: Determine the asymptote
The horizontal asymptote is the line y = −52 .
Step 5: Plot the points and sketch the graph
1
2
3
4
5
6
7
8
9
−1
−2
−3
1 2−1−2−3−4
y
x0
Step 6: State the domain and range
Domain: {x : x ∈ R}
Range: {y : y > −52 , y ∈ R}
191Chapter 5. Functions

Worked example 17: Finding the equation of an exponential function from agraph
QUESTION
Use the given graph of y = −2× 3(x+p) + q to determine the values of p and q.
1
2
3
4
5
6
7
−1
−2
1 2 3−1−2−3
y
x0
SOLUTION
Step 1: Examine the equation of the form y = ab(x+p) + q
From the graph we see that the function is decreasing. We also note that a = −2 andb = 3. We need to solve for p and q.
Step 2: Use the asymptote to determine q
The horizontal asymptote y = 6 is given, therefore we know that q = 6.
y = −2× 3(x+p) + 6
Step 3: Use the x-intercept to determine p
Substitute (2; 0) into the equation and solve for p:
y = −2× 3(x+p) + 6
0 = −2× 3(2+p) + 6
−6 = −2× 3(2+p)
3 = 3(2+p)
∴ 1 = 2 + p (same base)
∴ p = −1
Step 4: Write the final answer
y = −2× 3(x−1) + 6
192 5.4. Exponential functions

Exercise 5 – 19: Mixed exercises
1. Given the graph of the hyperbola of the form h(x) = kx , x < 0, which passes
though the point A(−12 ;−6).
b
y
x0
A(−12 ;−6)
a) Show that k = 3.
b) Write down the equation for the new function formed if h(x):
i. is shifted 3 units vertically upwardsii. is shifted to the right by 3 units
iii. is reflected about the y-axisiv. is shifted so that the asymptotes are x = 0 and y = −1
4
v. is shifted upwards to pass through the point (−1; 1)
vi. is shifted to the left by 2 units and 1 unit vertically downwards (forx < 0)
2. Given the graphs of f(x) = a(x+ p)2 and g(x) = ax .
The axis of symmetry for f(x) is x = −1 and f(x) and g(x) intersect at point M .The line y = 2 also passes through M .
b
y
x0
M
−1
2
f
g
193Chapter 5. Functions

Determine:
a) the coordinates of M
b) the equation of g(x)
c) the equation of f(x)
d) the values for which f(x) < g(x)
e) the range of f(x)
3. On the same system of axes, sketch:
a) the graphs of k(x) = 2(x + 12)2 − 41
2 and h(x) = 2(x+12). Determine all
intercepts, turning point(s) and asymptotes.
b) the reflection of h(x) about the x-axis. Label this function as j(x).
4. Sketch the graphs of y = ax2 + bx+ c for:
a) a < 0, b > 0, b2 < 4ac
b) a > 0, b > 0, one root = 0
5. On separate systems of axes, sketch the graphs:
y = 2x−2
y = 2x − 2
y = −2(x−2)
6. For the diagrams shown below, determine:
• the equations of the functions; f(x) = a(x + p)2 + q, g(x) = ax2 + q,h(x) = a
x , x < 0 and k(x) = bx + q
• the axes of symmetry of each function
• the domain and range of each function
a)
b
y
x0
(2; 3)
f
194 5.4. Exponential functions

b)
b
y
x0
(−2;−1)
g
h
−2
c)
y
x0
ky = 2x + 12
7. Given the graph of the function Q(x) = ax.
b
b
b
y
x0
Q = ax
(−2; p)
1 (1; 13)
a) Show that a = 13 .
b) Find the value of p if the point (−2; p) is on Q.
c) Calculate the average gradient of the curve between x = −2 and x = 1.
d) Determine the equation of the new function formed if Q is shifted 2 unitsvertically downwards and 2 units to the left.
8. Find the equation for each of the functions shown below:
a) f(x) = 2x + q
g(x) = mx+ c
195Chapter 5. Functions
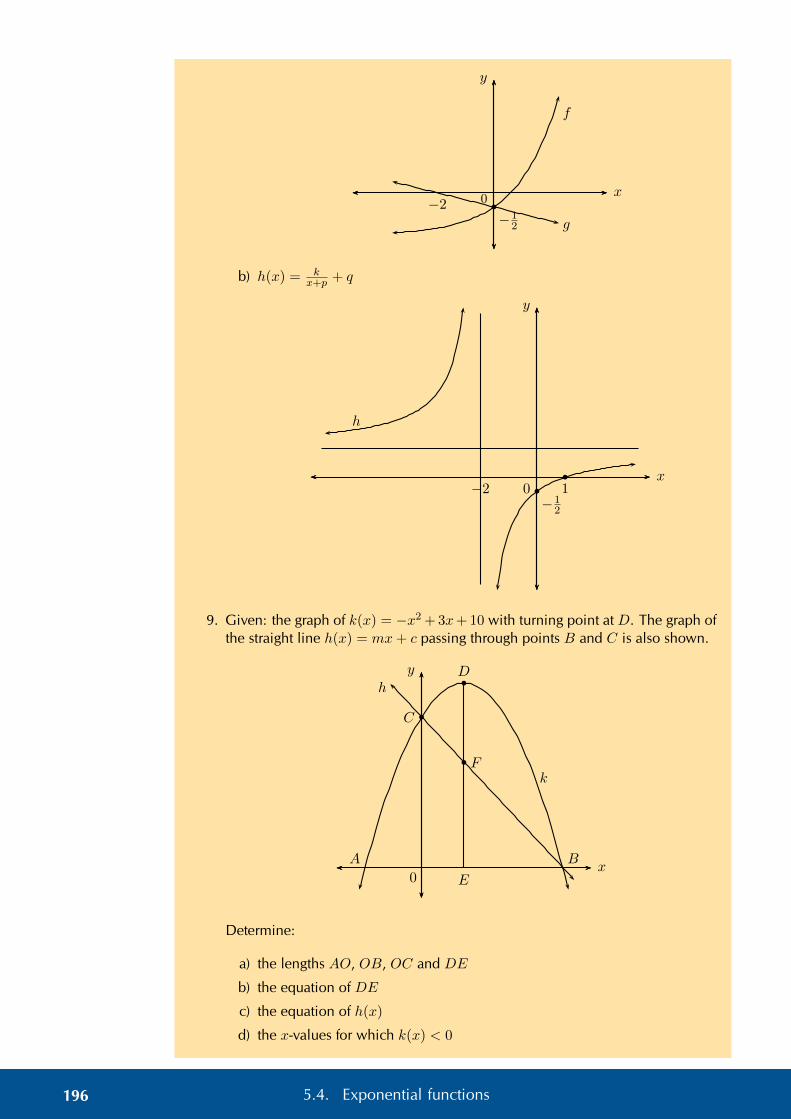
b
y
x0
f
g−12
−2
b) h(x) = kx+p + q
b
b
y
x0 1−2
−12
h
9. Given: the graph of k(x) = −x2 + 3x+ 10 with turning point at D. The graph ofthe straight line h(x) = mx+ c passing through points B and C is also shown.
b
b
b
y
x0
BA
E
F
D
C
k
h
Determine:
a) the lengths AO, OB, OC and DE
b) the equation of DE
c) the equation of h(x)
d) the x-values for which k(x) < 0
196 5.4. Exponential functions

e) the x-values for which k(x) ≥ h(x)
f) the length of DF
Think you got it? Get this answer and more practice on our Intelligent Practice Service
1. 22T7 2. 22T8 3. 22T9 4. 22TB 5. 22TC 6a. 22TD6b. 22TF 6c. 22TG 7. 22TH 8a. 22TJ 8b. 22TK 9. 22TM
www.everythingmaths.co.za m.everythingmaths.co.za
IMPORTANT: Trigonometric functions are examined in PAPER 2.
5.5 The sine function EMBGW
Revision EMBGX
Functions of the form y = sin θ for 0◦ ≤ θ ≤ 360◦
0
1
−1
30◦ 60◦ 90◦ 120◦ 150◦ 180◦ 210◦ 240◦ 270◦ 300◦ 330◦ 360◦
θ
y
• Period of one complete wave is 360◦.
• Amplitude is the maximum height of the wave above and below the x-axis andis always positive. Amplitude = 1.
• Domain: [0◦; 360◦]
For y = sin θ, the domain is {θ : θ ∈ R}, however in this case, the domain hasbeen restricted to the interval 0◦ ≤ θ ≤ 360◦.
• Range: [−1; 1]
• x-intercepts: (0◦; 0), (180◦; 0), (360◦; 0)
• y-intercept: (0◦; 0)
• Maximum turning point: (90◦; 1)
• Minimum turning point: (270◦;−1)
197Chapter 5. Functions

Functions of the form y = a sin θ + q
The effects of a and q on f(θ) = a sin θ + q:
• The effect of q on vertical shift
– For q > 0, f(θ) is shiftedvertically upwards by qunits.
– For q < 0, f(θ) is shiftedvertically downwards by qunits.
• The effect of a on shape
– For a > 1, the amplitude off(θ) increases.
– For 0 < a < 1, the ampli-tude of f(θ) decreases.
– For a < 0, there is a reflec-tion about the x-axis.
– For −1 < a < 0, thereis a reflection about the x-axis and the amplitude de-creases.
– For a < −1, there isa reflection about the x-axis and the amplitude in-creases.
q = 0
q > 0
q < 0
θ
y
a > 1
a = 1
0 < a < 1
−1 < a < 0
a < −1
θ
y
Exercise 5 – 20: Revision
On separate axes, accurately draw each of the following functions for 0◦ ≤ θ ≤ 360◦.
• Use tables of values if necessary.
• Use graph paper if available.
For each function also determine the following:
• Period
• Amplitude
• Domain and range
• x- and y-intercepts
• Maximum and minimum turning points
198 5.5. The sine function
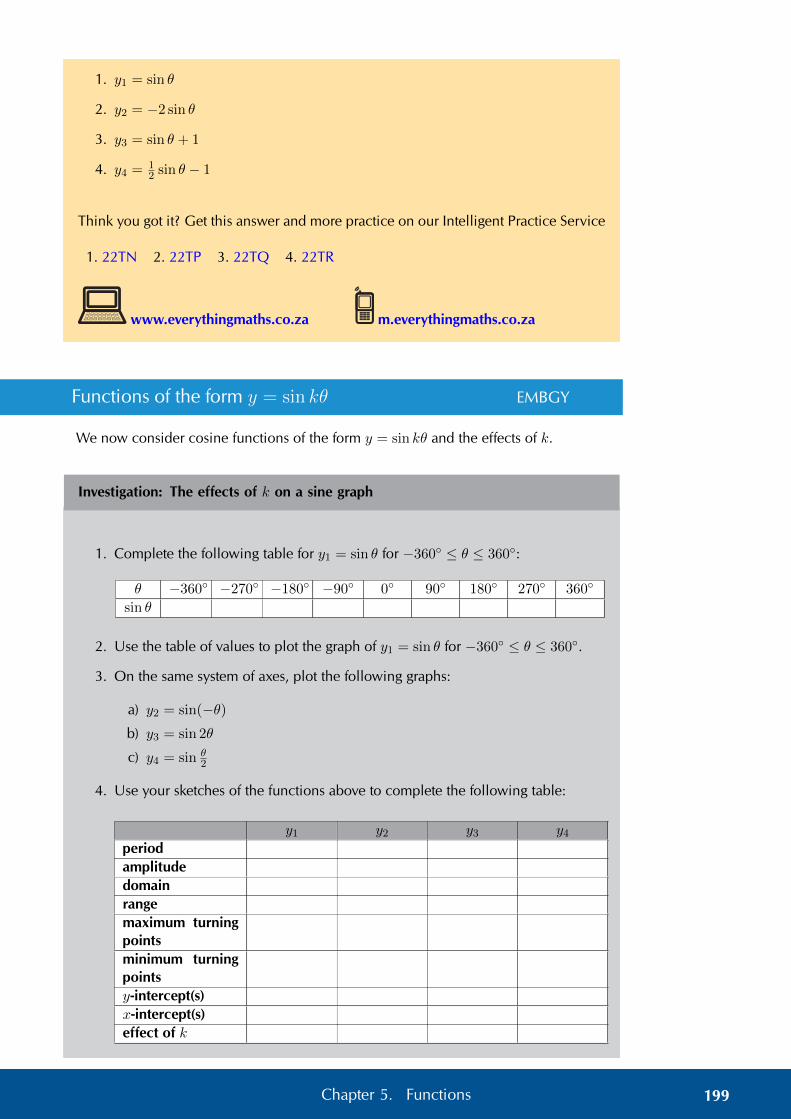
1. y1 = sin θ
2. y2 = −2 sin θ
3. y3 = sin θ + 1
4. y4 = 12 sin θ − 1
Think you got it? Get this answer and more practice on our Intelligent Practice Service
1. 22TN 2. 22TP 3. 22TQ 4. 22TR
www.everythingmaths.co.za m.everythingmaths.co.za
Functions of the form y = sin kθ EMBGY
We now consider cosine functions of the form y = sin kθ and the effects of k.
Investigation: The effects of k on a sine graph
1. Complete the following table for y1 = sin θ for −360◦ ≤ θ ≤ 360◦:
θ −360◦ −270◦ −180◦ −90◦ 0◦ 90◦ 180◦ 270◦ 360◦
sin θ
2. Use the table of values to plot the graph of y1 = sin θ for −360◦ ≤ θ ≤ 360◦.
3. On the same system of axes, plot the following graphs:
a) y2 = sin(−θ)b) y3 = sin 2θ
c) y4 = sin θ2
4. Use your sketches of the functions above to complete the following table:
y1 y2 y3 y4periodamplitudedomainrangemaximum turningpointsminimum turningpointsy-intercept(s)x-intercept(s)effect of k
199Chapter 5. Functions

5. What do you notice about y1 = sin θ and y2 = sin(−θ)?
6. Is sin(−θ) = − sin θ a true statement? Explain your answer.
7. Can you deduce a formula for determining the period of y = sin kθ?
The effect of the parameter on y = sin kθ
The value of k affects the period of the sine function. If k is negative, then the graph isreflected about the y-axis.
• For k > 0:
For k > 1, the period of the sine function decreases.
For 0 < k < 1, the period of the sine function increases.
• For k < 0:
For −1 < k < 0, the graph is reflected about the y-axis and the period increases.
For k < −1, the graph is reflected about the y-axis and the period decreases.
Negative angles:sin(−θ) = − sin θ
Calculating the period:
To determine the period of y = sin kθ we use,
Period =360◦
|k|
where |k| is the absolute value of k (this means that k is always considered to bepositive).
0 < k < 1 −1 < k < 0
k > 1 k < −1
200 5.5. The sine function

Worked example 18: Sine function
QUESTION
1. Sketch the following functions on the same set of axes for −180◦ ≤ θ ≤ 180◦.
a) y1 = sin θ
b) y2 = sin 3θ2
2. For each function determine the following:
a) Period
b) Amplitude
c) Domain and range
d) x- and y-intercepts
e) Maximum and minimum turning points
SOLUTION
Step 1: Examine the equations of the form y = sin kθ
Notice that k > 1 for y2 = sin 3θ2 , therefore the period of the graph decreases.
Step 2: Complete a table of values
θ −180◦ −135◦ −90◦ −45◦ 0◦ 45◦ 90◦ 135◦ 180◦
sin θ 0 −0,71 −1 −0,71 0 0,71 1 0,71 0
sin 3θ2 1 0,38 −0,71 −0,92 0 0,92 0,71 −0,38 −1
Step 3: Sketch the sine graphs
1
−1
30◦ 60◦ 90◦ 120◦ 150◦ 180◦−30◦−60◦−90◦−120◦−150◦−180◦b
b
b
b
b b
b
b
b
b
b
bb
b b
b
bb
θ0◦
y
y1 = sin θ
y2 = sin 32θ
Step 4: Complete the table
y1 = sin θ y2 = sin 3θ2
period 360◦ 240◦
amplitude 1 1
domain [−180◦; 180◦] [−180◦; 180◦]
range [−1; 1] [−1; 1]
maximum turning points (90◦; 1) (−180◦; 1) and (60◦; 1)
minimum turning points (−90◦;−1) (−60◦;−1) and (180◦; 1)
y-intercept(s) (0◦; 0) (0◦; 0)
x-intercept(s) (−180◦; 0), (0◦; 0) and(180◦; 0)
(−120◦; 0), (0◦; 0) and(120◦; 0)
201Chapter 5. Functions

Discovering the characteristics
For functions of the general form: f(θ) = y = sin kθ:
Domain and range
The domain is {θ : θ ∈ R} because there is no value for θ for which f(θ) is undefined.
The range is {f(θ) : −1 ≤ f(θ) ≤ 1, f(θ) ∈ R} or [−1; 1].
Intercepts
The x-intercepts are determined by letting f(θ) = 0 and solving for θ.
The y-intercept is calculated by letting θ = 0◦ and solving for f(θ).
y = sin kθ
= sin 0◦
= 0
This gives the point (0◦; 0).
Exercise 5 – 21: Sine functions of the form y = sin kθ
1. Sketch the following functions for −180◦ ≤ θ ≤ 180◦ and for each graph deter-mine:
• Period
• Amplitude
• Domain and range
• x- and y-intercepts
• Maximum and minimum turning points
a) f(θ) = sin 3θ
b) g(θ) = sin θ3
c) h(θ) = sin(−2θ)
d) k(θ) = sin 3θ4
2. For each graph of the form f(θ) = sin kθ, determine the value of k:
a)
1
−1
90◦ 180◦ 270◦ 360◦−90◦−180◦−270◦−360◦θ
y
0◦
202 5.5. The sine function

b)
1
−1
90◦ 180◦ 270◦ 360◦−90◦−180◦−270◦−360◦θ
y
0◦
Think you got it? Get this answer and more practice on our Intelligent Practice Service
1a. 22TS 1b. 22TT 1c. 22TV 1d. 22TW 2a. 22TX 2b. 22TY
www.everythingmaths.co.za m.everythingmaths.co.za
Functions of the form y = sin(θ + p) EMBGZ
Investigation: The effects of p on a sine graph
1. On the same system of axes, plot the following graphs for −360◦ ≤ θ ≤ 360◦:
a) y1 = sin θ
b) y2 = sin(θ − 90◦)
c) y3 = sin(θ − 60◦)
d) y4 = sin(θ + 90◦)
e) y5 = sin(θ + 180◦)
2. Use your sketches of the functions above to complete the following table:
y1 y2 y3 y4 y5periodamplitudedomainrangemaximum turningpointsminimum turningpointsy-intercept(s)x-intercept(s)effect of p
203Chapter 5. Functions

The effect of the parameter on y = sin(θ + p)
The effect of p on the sine function is a horizontal shift, also called a phase shift; theentire graph slides to the left or to the right.
• For p > 0, the graph of the sine function shifts to the left by p.
• For p < 0, the graph of the sine function shifts to the right by p.
p > 0 p < 0
Worked example 19: Sine function
QUESTION
1. Sketch the following functions on the same set of axes for −360◦ ≤ θ ≤ 360◦.
a) y1 = sin θ
b) y2 = sin(θ − 30◦)
2. For each function determine the following:
a) Period
b) Amplitude
c) Domain and range
d) x- and y-intercepts
e) Maximum and minimum turning points
SOLUTION
Step 1: Examine the equations of the form y = sin(θ + p)
Notice that for y1 = sin θ we have p = 0 (no phase shift) and for y2 = sin(θ − 30◦),p < 0 therefore the graph shifts to the right by 30◦.
Step 2: Complete a table of values
θ −360◦ −270◦ −180◦ −90◦ 0◦ 90◦ 180◦ 270◦ 360◦
sin θ 0 1 0 −1 0 1 0 −1 0
sin(θ− 30◦) −0,5 0,87 0,5 −0,87 −0,5 0,87 0,5 −0,87 −0,5
204 5.5. The sine function

Step 3: Sketch the sine graphs
1
−1
90◦ 180◦ 270◦ 360◦−90◦−180◦−270◦−360◦b
b
b
b
b b
b
b
b
b
b
b
b
b b
b
b
b
θ
y
y1 = sin θ
y2 = sin(θ − 30◦)
Step 4: Complete the table
y1 = sin θ y2 = sin(θ − 30◦)
period 360◦ 360◦
amplitude 1 1
domain [−360◦; 360◦] [−360◦; 360◦]
range [−1; 1] [−1; 1]
maximum turning points (−270◦; 1) and (90◦; 1) (−240◦; 1) and(120◦; 1)
minimum turning points (−90◦;−1) and(270◦;−1)
(−60◦;−1) and(300◦;−1)
y-intercept(s) (0◦; 0) (0◦;−12)
x-intercept(s) (−360◦; 0), (−180◦; 0),(0◦; 0), (180◦; 0) and
(360◦; 0)
(−330◦; 0), (−150◦; 0),(30◦; 0) and (210◦; 0)
Discovering the characteristics
For functions of the general form: f(θ) = y = sin(θ + p):
Domain and range
The domain is {θ : θ ∈ R} because there is no value for θ for which f(θ) is undefined.
The range is {f(θ) : −1 ≤ f(θ) ≤ 1, f(θ) ∈ R}.
Intercepts
The x-intercepts are determined by letting f(θ) = 0 and solving for θ.
The y-intercept is calculated by letting θ = 0◦ and solving for f(θ).
205Chapter 5. Functions

Exercise 5 – 22: Sine functions of the form y = sin(θ + p)
Sketch the following functions for −360◦ ≤ θ ≤ 360◦.
For each function, determine the following:
• Period
• Amplitude
• Domain and range
• x- and y-intercepts
• Maximum and minimum turning points
1. f(θ) = sin(θ + 30◦)
2. g(θ) = sin(θ − 45◦)
3. h(θ) = sin(θ + 60◦)
Think you got it? Get this answer and more practice on our Intelligent Practice Service
1. 22TZ 2. 22V2 3. 22V3
www.everythingmaths.co.za m.everythingmaths.co.za
Sketching sine graphs EMBH2
Worked example 20: Sketching a sine graph
QUESTION
Sketch the graph of f(θ) = sin(45◦ − θ) for 0◦ ≤ θ ≤ 360◦.
SOLUTION
Step 1: Examine the form of the equation
Write the equation in the form y = sin(θ + p).
f(θ) = sin(45◦ − θ)= sin(−θ + 45◦)
= sin (−(θ − 45◦))
= − sin(θ − 45◦)
To draw a graph of the above function, we know that the standard sine graph, y = sin θ,
206 5.5. The sine function
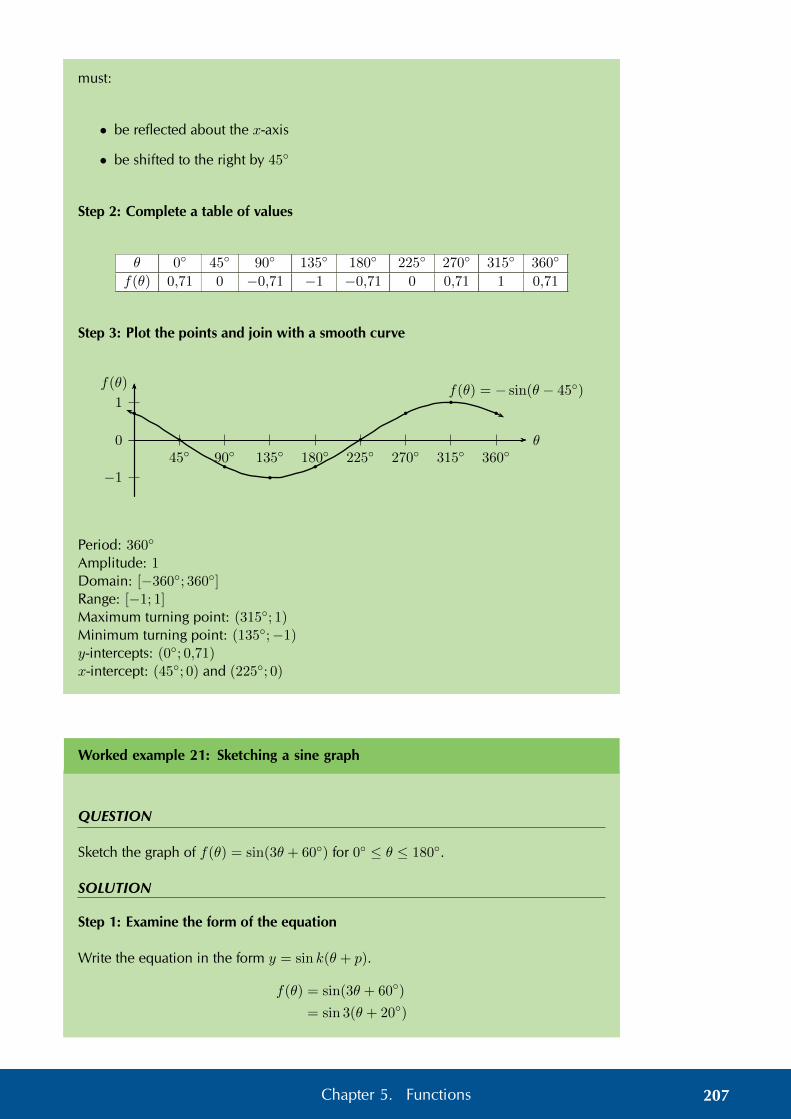
must:
• be reflected about the x-axis
• be shifted to the right by 45◦
Step 2: Complete a table of values
θ 0◦ 45◦ 90◦ 135◦ 180◦ 225◦ 270◦ 315◦ 360◦
f(θ) 0,71 0 −0,71 −1 −0,71 0 0,71 1 0,71
Step 3: Plot the points and join with a smooth curve
0
1
−1
45◦ 90◦ 135◦ 180◦ 225◦ 270◦ 315◦ 360◦θ
f(θ)f(θ) = − sin(θ − 45◦)
b
b
b
b
b
b
b
b
b
Period: 360◦
Amplitude: 1Domain: [−360◦; 360◦]Range: [−1; 1]Maximum turning point: (315◦; 1)Minimum turning point: (135◦;−1)y-intercepts: (0◦; 0,71)x-intercept: (45◦; 0) and (225◦; 0)
Worked example 21: Sketching a sine graph
QUESTION
Sketch the graph of f(θ) = sin(3θ + 60◦) for 0◦ ≤ θ ≤ 180◦.
SOLUTION
Step 1: Examine the form of the equation
Write the equation in the form y = sin k(θ + p).
f(θ) = sin(3θ + 60◦)
= sin 3(θ + 20◦)
207Chapter 5. Functions

To draw a graph of the above equation, the standard sine graph, y = sin θ, must bechanged in the following ways:
• decrease the period by a factor of 3;
• shift to the left by 20◦.
Step 2: Complete a table of values
θ 0◦ 30◦ 60◦ 90◦ 120◦ 150◦ 180◦
f(θ) 0,87 0,5 −0,87 −0,5 0,87 0,5 −0,87
Step 3: Plot the points and join with a smooth curve
0
1
−1
30◦ 60◦ 90◦ 120◦ 150◦ 180◦θ
f(θ)f(θ) = sin 3(θ + 20◦)
b
b
b
b
b
b
b
Period: 120◦
Amplitude: 1Domain: [0◦; 180◦]Range: [−1; 1]Maximum turning point: (10◦; 1) and (130◦; 1)Minimum turning point: (70◦;−1)y-intercept: (0◦; 0,87)x-intercepts: (40◦; 0), (100◦; 0) and (160◦; 0)
Exercise 5 – 23: The sine function
1. Sketch the following graphs on separate axes:
a) y = 2 sin θ2 for −360◦ ≤ θ ≤ 360◦
b) f(θ) = 12 sin(θ − 45◦) for −90◦ ≤ θ ≤ 90◦
c) y = sin(θ + 90◦) + 1 for 0◦ ≤ θ ≤ 360◦
d) y = sin(−3θ2 ) for −180◦ ≤ θ ≤ 180◦
e) y = sin(30◦ − θ) for −360◦ ≤ θ ≤ 360◦
2. Given the graph of the function y = a sin(θ + p), determine the values of a andp.
208 5.5. The sine function

0
1
2
−1
−2
90◦ 180◦ 270◦ 360◦θ
f(θ)
Can you describe this graph in terms of cos θ?
Think you got it? Get this answer and more practice on our Intelligent Practice Service
1a. 22V4 1b. 22V5 1c. 22V6 1d. 22V7 1e. 22V8 2. 22V9
www.everythingmaths.co.za m.everythingmaths.co.za
5.6 The cosine function EMBH3
Revision EMBH4
Functions of the form y = cos θ for 0◦ ≤ θ ≤ 360◦
0
1
−1
30◦ 60◦ 90◦ 120◦ 150◦ 180◦ 210◦ 240◦ 270◦ 300◦ 330◦ 360◦
θ
y
• The period is 360◦ and the amplitude is 1.
• Domain: [0◦; 360◦]
For y = cos θ, the domain is {θ : θ ∈ R}, however in this case, the domain hasbeen restricted to the interval 0◦ ≤ θ ≤ 360◦.
• Range: [−1; 1]
• x-intercepts: (90◦; 0), (270◦; 0)
• y-intercept: (0◦; 1)
• Maximum turning points: (0◦; 1), (360◦; 1)
• Minimum turning point: (180◦;−1)
209Chapter 5. Functions

Functions of the form y = a cos θ + q
Cosine functions of the general form y = a cos θ + q, where a and q are constants.
The effects of a and q on f(θ) = a cos θ + q:
• The effect of q on vertical shift
– For q > 0, f(θ) is shiftedvertically upwards by qunits.
– For q < 0, f(θ) is shiftedvertically downwards by qunits.
• The effect of a on shape
– For a > 1, the amplitude off(θ) increases.
– For 0 < a < 1, the ampli-tude of f(θ) decreases.
– For a < 0, there is a reflec-tion about the x-axis.
– For −1 < a < 0, thereis a reflection about the x-axis and the amplitude de-creases.
– For a < −1, there isa reflection about the x-axis and the amplitude in-creases.
q = 0
q > 0
q < 0
θ
y
a > 1
a = 1
0 < a < 1
−1 < a < 0
a < −1
θ
y
Exercise 5 – 24: Revision
On separate axes, accurately draw each of the following functions for 0◦ ≤ θ ≤ 360◦:
• Use tables of values if necessary.
• Use graph paper if available.
For each function in the previous problem determine the following:
• Period
• Amplitude
• Domain and range
• x- and y-intercepts
• Maximum and minimum turning points
210 5.6. The cosine function

1. y1 = cos θ
2. y2 = −3 cos θ
3. y3 = cos θ + 2
4. y4 = 12 cos θ − 1
Think you got it? Get this answer and more practice on our Intelligent Practice Service
1. 22VB 2. 22VC 3. 22VD 4. 22VF
www.everythingmaths.co.za m.everythingmaths.co.za
Functions of the form y = cos(kθ) EMBH5
We now consider cosine functions of the form y = cos kθ and the effects of k.
Investigation: The effects of k on a cosine graph
1. Complete the following table for y1 = cos θ for −360◦ ≤ θ ≤ 360◦:
θ −360◦ −300◦ −240◦ −180◦ −120◦ −60◦ 0◦
cos θ
θ 60◦ 120◦ 180◦ 240◦ 300◦ 360◦
cos θ
2. Use the table of values to plot the graph of y1 = cos θ for −360◦ ≤ θ ≤ 360◦.
3. On the same system of axes, plot the following graphs:
a) y2 = cos(−θ)b) y3 = cos 3θ
c) y4 = cos 3θ4
4. Use your sketches of the functions above to complete the following table:
y1 y2 y3 y4periodamplitudedomainrangemaximum turningpointsminimum turningpointsy-intercept(s)x-intercept(s)effect of k
211Chapter 5. Functions
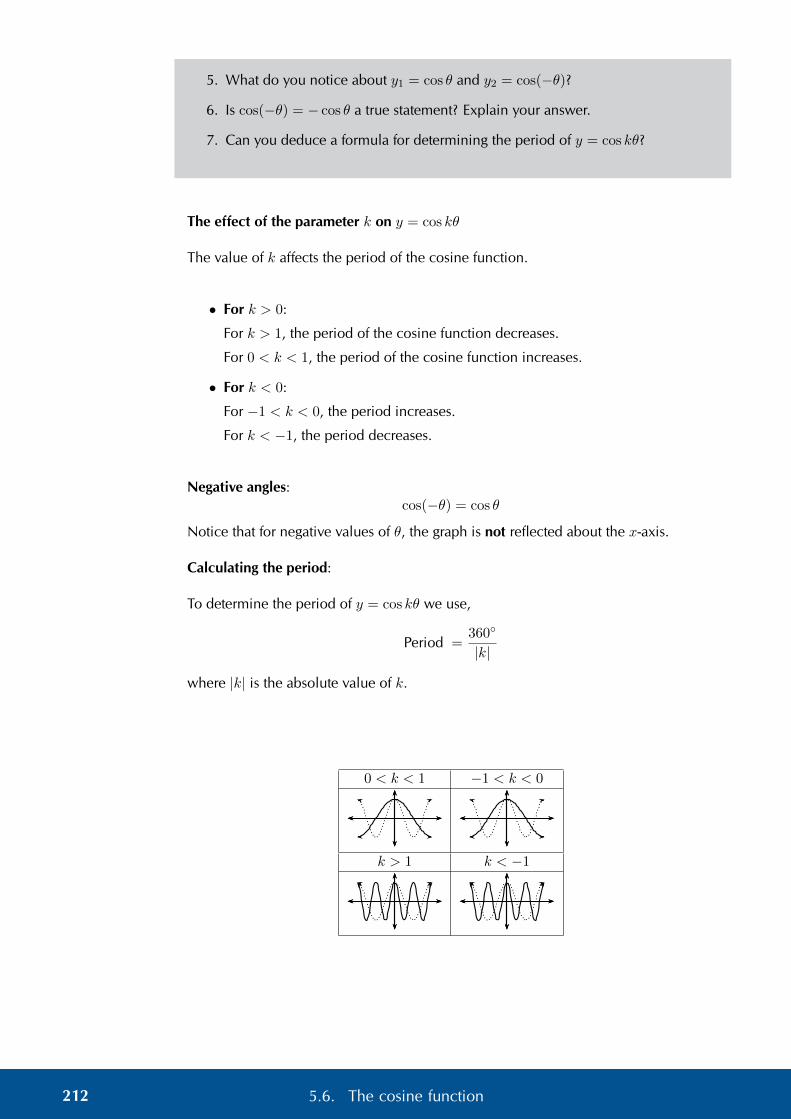
5. What do you notice about y1 = cos θ and y2 = cos(−θ)?
6. Is cos(−θ) = − cos θ a true statement? Explain your answer.
7. Can you deduce a formula for determining the period of y = cos kθ?
The effect of the parameter k on y = cos kθ
The value of k affects the period of the cosine function.
• For k > 0:
For k > 1, the period of the cosine function decreases.
For 0 < k < 1, the period of the cosine function increases.
• For k < 0:
For −1 < k < 0, the period increases.
For k < −1, the period decreases.
Negative angles:cos(−θ) = cos θ
Notice that for negative values of θ, the graph is not reflected about the x-axis.
Calculating the period:
To determine the period of y = cos kθ we use,
Period =360◦
|k|
where |k| is the absolute value of k.
0 < k < 1 −1 < k < 0
k > 1 k < −1
212 5.6. The cosine function
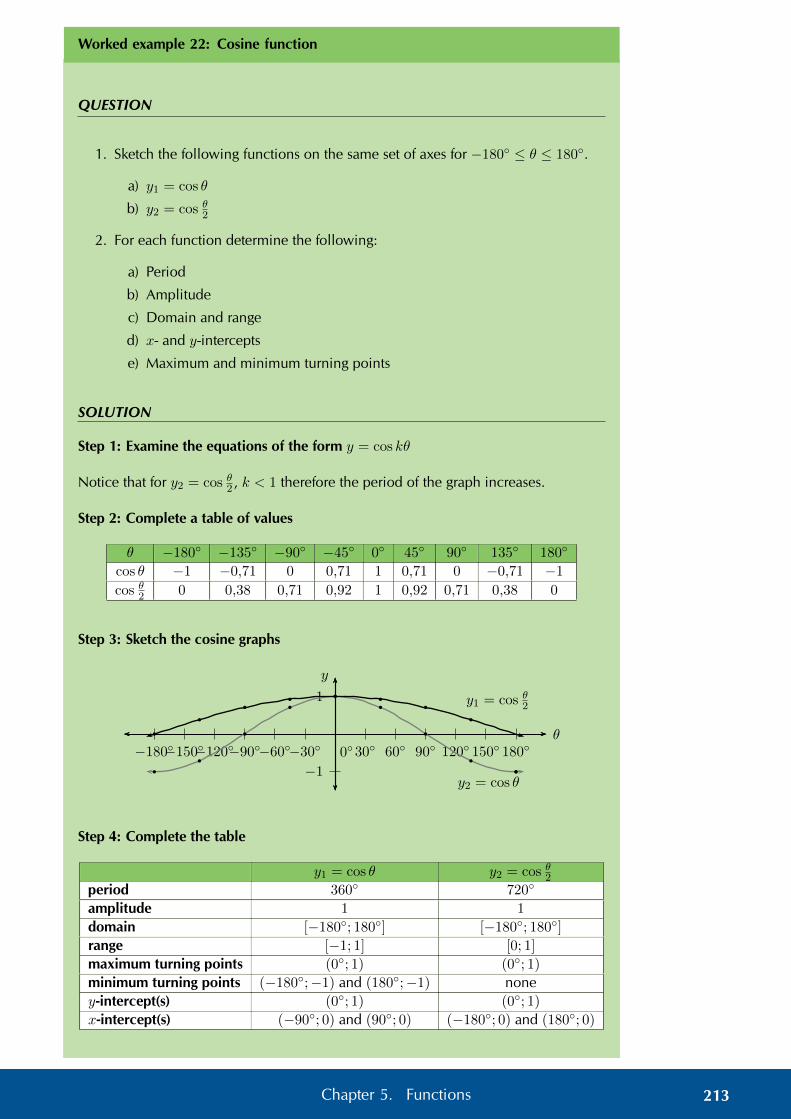
Worked example 22: Cosine function
QUESTION
1. Sketch the following functions on the same set of axes for −180◦ ≤ θ ≤ 180◦.
a) y1 = cos θ
b) y2 = cos θ2
2. For each function determine the following:
a) Period
b) Amplitude
c) Domain and range
d) x- and y-intercepts
e) Maximum and minimum turning points
SOLUTION
Step 1: Examine the equations of the form y = cos kθ
Notice that for y2 = cos θ2 , k < 1 therefore the period of the graph increases.
Step 2: Complete a table of values
θ −180◦ −135◦ −90◦ −45◦ 0◦ 45◦ 90◦ 135◦ 180◦
cos θ −1 −0,71 0 0,71 1 0,71 0 −0,71 −1
cos θ2 0 0,38 0,71 0,92 1 0,92 0,71 0,38 0
Step 3: Sketch the cosine graphs
1
−1
30◦ 60◦ 90◦ 120◦ 150◦ 180◦−30◦−60◦−90◦−120◦−150◦−180◦
b
b
b
b
b
b
b
b
b
b
b
bb b
b
b
bb
θ0◦
y
y1 = cos θ2
y2 = cos θ
Step 4: Complete the table
y1 = cos θ y2 = cos θ2period 360◦ 720◦
amplitude 1 1
domain [−180◦; 180◦] [−180◦; 180◦]
range [−1; 1] [0; 1]
maximum turning points (0◦; 1) (0◦; 1)
minimum turning points (−180◦;−1) and (180◦;−1) noney-intercept(s) (0◦; 1) (0◦; 1)
x-intercept(s) (−90◦; 0) and (90◦; 0) (−180◦; 0) and (180◦; 0)
213Chapter 5. Functions

Discovering the characteristics
For functions of the general form: f(θ) = y = cos kθ:
Domain and range
The domain is {θ : θ ∈ R} because there is no value for θ for which f(θ) is undefined.
The range is {f(θ) : −1 ≤ f(θ) ≤ 1, f(θ) ∈ R} or [−1; 1].
Intercepts
The x-intercepts are determined by letting f(θ) = 0 and solving for θ.
The y-intercept is calculated by letting θ = 0◦ and solving for f(θ).
y = cos kθ
= cos 0◦
= 1
This gives the point (0◦; 1).
Exercise 5 – 25: Cosine functions of the form y = cos kθ
1. Sketch the following functions for −180◦ ≤ θ ≤ 180◦. For each graph determine:
• Period
• Amplitude
• Domain and range
• x- and y-intercepts
• Maximum and minimum turning points
a) f(θ) = cos 2θ
b) g(θ) = cos θ3
c) h(θ) = cos(−2θ)
d) k(θ) = cos 3θ4
2. For each graph of the form f(θ) = cos kθ, determine the value of k:
a)
1
−1
90◦ 180◦ 270◦ 360◦−90◦−180◦−270◦−360◦θ
y
0◦
214 5.6. The cosine function

b)
1
−1
90◦ 180◦ 270◦ 360◦−90◦−180◦−270◦−360◦bA(135◦; 0)
θ
y
0◦
Think you got it? Get this answer and more practice on our Intelligent Practice Service
1a. 22VG 1b. 22VH 1c. 22VJ 1d. 22VK 2a. 22VM 2b. 22VN
www.everythingmaths.co.za m.everythingmaths.co.za
Functions of the form y = cos (θ + p) EMBH6
We now consider cosine functions of the form y = cos(θ + p) and the effects ofparameter p.
Investigation: The effects of p on a cosine graph
1. On the same system of axes, plot the following graphs for −360◦ ≤ θ ≤ 360◦:
a) y1 = cos θ
b) y2 = cos(θ − 90◦)
c) y3 = cos(θ − 60◦)
d) y4 = cos(θ + 90◦)
e) y5 = cos(θ + 180◦)
2. Use your sketches of the functions above to complete the following table:
y1 y2 y3 y4 y5periodamplitudedomainrangemaximum turning pointsminimum turning pointsy-intercept(s)x-intercept(s)effect of p
215Chapter 5. Functions

The effect of the parameter on y = cos(θ + p)
The effect of p on the cosine function is a horizontal shift (or phase shift); the entiregraph slides to the left or to the right.
• For p > 0, the graph of the cosine function shifts to the left by p degrees.
• For p < 0, the graph of the cosine function shifts to the right by p degrees.
p > 0 p < 0
Worked example 23: Cosine function
QUESTION
1. Sketch the following functions on the same set of axes for −360◦ ≤ θ ≤ 360◦.
a) y1 = cos θ
b) y2 = cos(θ + 30◦)
2. For each function determine the following:
a) Period
b) Amplitude
c) Domain and range
d) x- and y-intercepts
e) Maximum and minimum turning points
SOLUTION
Step 1: Examine the equations of the form y = cos(θ + p)
Notice that for y1 = cos θ we have p = 0 (no phase shift) and for y2 = cos(θ + 30◦),p < 0 therefore the graph shifts to the left by 30◦.
Step 2: Complete a table of values
θ −360◦ −270◦ −180◦ −90◦ 0◦ 90◦ 180◦ 270◦ 360◦
cos θ 1 0 −1 0 1 0 −1 0 1
cos(θ+30◦) 0,87 −0,5 −0,87 0,5 0,87 −0,5 −0,87 0,5 0,87
216 5.6. The cosine function

Step 3: Sketch the cosine graphs
1
−1
90◦ 180◦ 270◦ 360◦−90◦−180◦−270◦−360◦
b
b
b
b
b
b
b
b
bb
b
b
b
b
b
b
b
b
θ
y
y1 = cos θ
y2 = cos(θ + 30◦)
Step 4: Complete the table
y1 y2period 360◦ 360◦
amplitude 1 1
domain [−360◦; 360◦] [−360◦; 360◦]
range [−1; 1] [−1; 1]
maximum turning points (−360◦; 1), (0◦; 1) and(360◦; 1)
(−30◦; 1) and (330◦; 1)
minimum turning points (−180◦;−1) and(180◦;−1)
(−210◦;−1) and(150◦;−1)
y-intercept(s) (0◦; 0) (0◦; 0,87)
x-intercept(s) (−270◦; 0), (−90◦; 0),(90◦; 0) and (270◦; 0)
(−300◦; 0), (−120◦; 0),(60◦; 0) and (240◦; 0)
Discovering the characteristics
For functions of the general form: f(θ) = y = cos(θ + p):
Domain and range
The domain is {θ : θ ∈ R} because there is no value for θ for which f(θ) is undefined.
The range is {f(θ) : −1 ≤ f(θ) ≤ 1, f(θ) ∈ R}.
Intercepts
The x-intercepts are determined by letting f(θ) = 0 and solving for θ.
The y-intercept is calculated by letting θ = 0◦ and solving for f(θ).
y = cos(θ + p)
= cos(0◦ + p)
= cos p
This gives the point (0◦; cos p).
217Chapter 5. Functions

Exercise 5 – 26: Cosine functions of the form y = cos(θ + p)
Sketch the following functions for −360◦ ≤ θ ≤ 360◦.
For each function, determine the following:
• Period
• Amplitude
• Domain and range
• x- and y-intercepts
• Maximum and minimum turning points
1. f(θ) = cos(θ + 45◦)
2. g(θ) = cos(θ − 30◦)
3. h(θ) = cos(θ + 60◦)
Think you got it? Get this answer and more practice on our Intelligent Practice Service
1. 22VP 2. 22VQ 3. 22VR
www.everythingmaths.co.za m.everythingmaths.co.za
Sketching cosine graphs EMBH7
Worked example 24: Sketching a cosine graph
QUESTION
Sketch the graph of f(θ) = cos(180◦ − 3θ) for 0◦ ≤ θ ≤ 360◦.
SOLUTION
Step 1: Examine the form of the equation
Write the equation in the form y = cos k(θ + p).
f(θ) = cos(180◦ − 3θ)
= cos(−3θ + 180◦)
= cos (−3(θ − 60◦))
= cos 3(θ − 60◦)
To draw a graph of the above function, the standard cosine graph, y = cos θ, must bechanged in the following ways:
218 5.6. The cosine function

• decrease the period by a factor of 3
• shift to the right by 60◦.
Step 2: Complete a table of values
θ 0◦ 45◦ 90◦ 135◦ 180◦ 225◦ 270◦ 315◦ 360◦
f(θ) −1 0,71 0 −0,71 1 −0,71 0 0,71 −1
Step 3: Plot the points and join with a smooth curve
0
1
−1
45◦ 90◦ 135◦ 180◦ 225◦ 270◦ 315◦ 360◦θ
f(θ)f(θ) = cos 3(θ − 60◦)
b
b
b
b
b
b
b
b
b
Period: 120◦
Amplitude: 1Domain: [0◦; 360◦]Range: [−1; 1]Maximum turning point: (60◦; 1), (180◦; 1) and (300◦; 1)Minimum turning point: (0◦;−1), (120◦;−1), (240◦;−1) and (360◦;−1)y-intercepts: (0◦;−1)x-intercept: (30◦; 0), (90◦; 0), (150◦; 0), (210◦; 0), (270◦; 0) and (330◦; 0)
Worked example 25: Finding the equation of a cosine graph
QUESTION
Given the graph of y = a cos(kθ+p), determine the values of a, k, p and the minimumturning point.
θ
y
y = a cos(θ + p)b
(45◦; 2)
−45◦ 315◦
219Chapter 5. Functions
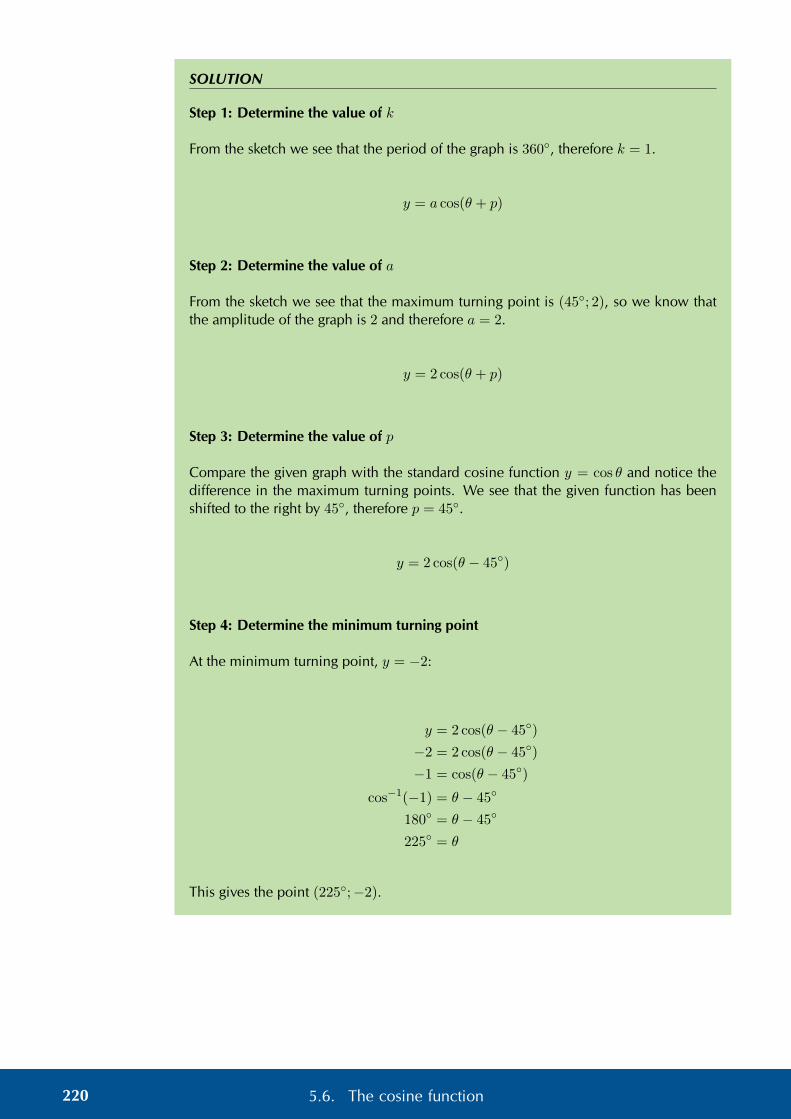
SOLUTION
Step 1: Determine the value of k
From the sketch we see that the period of the graph is 360◦, therefore k = 1.
y = a cos(θ + p)
Step 2: Determine the value of a
From the sketch we see that the maximum turning point is (45◦; 2), so we know thatthe amplitude of the graph is 2 and therefore a = 2.
y = 2 cos(θ + p)
Step 3: Determine the value of p
Compare the given graph with the standard cosine function y = cos θ and notice thedifference in the maximum turning points. We see that the given function has beenshifted to the right by 45◦, therefore p = 45◦.
y = 2 cos(θ − 45◦)
Step 4: Determine the minimum turning point
At the minimum turning point, y = −2:
y = 2 cos(θ − 45◦)
−2 = 2 cos(θ − 45◦)
−1 = cos(θ − 45◦)
cos−1(−1) = θ − 45◦
180◦ = θ − 45◦
225◦ = θ
This gives the point (225◦;−2).
220 5.6. The cosine function

Exercise 5 – 27: The cosine function
1. Sketch the following graphs on separate axes:
a) y = cos(θ + 15◦) for −180◦ ≤ θ ≤ 180◦
b) f(θ) = 13 cos(θ − 60◦) for −90◦ ≤ θ ≤ 90◦
c) y = −2 cos θ for 0◦ ≤ θ ≤ 360◦
d) y = cos(30◦ − θ) for −360◦ ≤ θ ≤ 360◦
e) g(θ) = 1 + cos(θ − 90◦) for 0◦ ≤ θ ≤ 360◦
f) y = cos(2θ + 60◦) for −360◦ ≤ θ ≤ 360◦
2. Two girls are given the following graph:
0
1
−1
45◦ 90◦ 135◦ 180◦ 225◦ 270◦ 315◦ 360◦θ
yb
a) Audrey decides that the equation for the graph is a cosine function of theform y = a cos θ. Determine the value of a.
b) Megan thinks that the equation for the graph is a cosine function of theform y = cos(θ + p). Determine the value of p.
c) What can they conclude?
Think you got it? Get this answer and more practice on our Intelligent Practice Service
1a. 22VS 1b. 22VT 1c. 22VV 1d. 22VW 1e. 22VX 1f. 22VY2. 22VZ
www.everythingmaths.co.za m.everythingmaths.co.za
221Chapter 5. Functions

5.7 The tangent function EMBH8
Revision EMBH9
Functions of the form y = tan θ for 0◦ ≤ θ ≤ 360◦
0
1
2
−1
−2
90◦ 180◦ 270◦ 360◦b
b
b
b
b
b
b
b
b
b
b
f(θ)
θ
The dashed vertical lines are called the asymptotes. The asymptotes are at the valuesof θ where tan θ is not defined.
• Period: 180◦
• Domain: {θ : 0◦ ≤ θ ≤ 360◦, θ 6= 90◦; 270◦}
• Range: {f(θ) : f(θ) ∈ R}
• x-intercepts: (0◦; 0), (180◦; 0), (360◦; 0)
• y-intercept: (0◦; 0)
• Asymptotes: the lines θ = 90◦ and θ = 270◦
Functions of the form y = a tan θ + q
Tangent functions of the general form y = a tan θ + q, where a and q are constants.
The effects of a and q on f(θ) = a tan θ + q:
• The effect of q on vertical shift
– For q > 0, f(θ) is shifted vertically upwards by q units.
– For q < 0, f(θ) is shifted vertically downwards by q units.
• The effect of a on shape
– For a > 1, branches of f(θ) are steeper.
– For 0 < a < 1, branches of f(θ) are less steep and curve more.
222 5.7. The tangent function

– For a < 0, there is a reflection about the x-axis.
– For −1 < a < 0, there is a reflection about the x-axis and the branches ofthe graph are less steep.
– For a < −1, there is a reflection about the x-axis and the branches of thegraph are steeper.
a < 0 a > 0
q > 0 b
0
b
0
q = 0 b0
b0
q < 0 b0
b0
Exercise 5 – 28: Revision
On separate axes, accurately draw each of the following functions for 0◦ ≤ θ ≤ 360◦:
• Use tables of values if necessary.
• Use graph paper if available.
For each function determine the following:
• Period
• Domain and range
223Chapter 5. Functions

• x- and y-intercepts
• Asymptotes
1. y1 = tan θ − 12
2. y2 = −3 tan θ
3. y3 = tan θ + 2
4. y4 = 2 tan θ − 1
Think you got it? Get this answer and more practice on our Intelligent Practice Service
1. 22W2 2. 22W3 3. 22W4 4. 22W5
www.everythingmaths.co.za m.everythingmaths.co.za
Functions of the form y = tan(kθ) EMBHB
Investigation: The effects of k on a tangent graph
1. Complete the following table for y1 = tan θ for −360◦ ≤ θ ≤ 360◦:
θ −360◦ −300◦ −240◦ −180◦ −120◦ −60◦ 0◦
tan θ
θ 60◦ 120◦ 180◦ 240◦ 300◦ 360◦
tan θ
2. Use the table of values to plot the graph of y1 = tan θ for −360◦ ≤ θ ≤ 360◦.
3. On the same system of axes, plot the following graphs:
a) y2 = tan(−θ)b) y3 = tan 3θ
c) y4 = tan θ2
4. Use your sketches of the functions above to complete the following table:
y1 y2 y3 y4perioddomainrangey-intercept(s)x-intercept(s)asymptoteseffect of k
224 5.7. The tangent function

5. What do you notice about y1 = tan θ and y2 = tan(−θ)?
6. Is tan(−θ) = − tan θ a true statement? Explain your answer.
7. Can you deduce a formula for determining the period of y = tan kθ?
The effect of the parameter on y = tan kθ
The value of k affects the period of the tangent function. If k is negative, then thegraph is reflected about the y-axis.
• For k > 0:
For k > 1, the period of the tangent function decreases.
For 0 < k < 1, the period of the tangent function increases.
• For k < 0:
For −1 < k < 0, the graph is reflected about the y-axis and the period increases.
For k < −1, the graph is reflected about the y-axis and the period decreases.
Negative angles:tan(−θ) = − tan θ
Calculating the period:
To determine the period of y = tan kθ we use,
Period =180◦
|k|
where |k| is the absolute value of k.
k > 0 k < 0
225Chapter 5. Functions

Worked example 26: Tangent function
QUESTION
1. Sketch the following functions on the same set of axes for −180◦ ≤ θ ≤ 180◦.
a) y1 = tan θ
b) y2 = tan 3θ2
2. For each function determine the following:
• Period
• Domain and range
• x- and y-intercepts
• Asymptotes
SOLUTION
Step 1: Examine the equations of the form y = tan kθ
Notice that k > 1 for y2 = tan 3θ2 , therefore the period of the graph decreases.
Step 2: Complete a table of values
θ −180◦ −135◦ −90◦ −45◦ 0◦ 45◦ 90◦ 135◦ 180◦
tan θ 0 1 UNDEF −1 0 1 UNDEF −1 0
tan 3θ2 UNDEF −0,41 1 −2,41 0 2,41 −1 0,41 UNDEF
Step 3: Sketch the tangent graphs
1
2
3
4
5
6
−1
−2
−3
−4
−5
−6
45◦ 90◦ 135◦ 180◦−45◦−90◦−135◦−180◦θ
f(θ)
b
b
b
b
b
b
bb
b
b
b
b
b
b
Step 4: Complete the table
y1 = tan θ y2 = tan 3θ2
period 180◦ 120◦
domain {θ : −180◦ ≤ θ ≤ 180◦, θ 6=−90◦; 90◦}
{θ : −180◦ < θ < 180◦, θ 6=−60◦; 60◦}
range {f(θ) : f(θ) ∈ R} {f(θ) : f(θ) ∈ R}y-intercept(s) (0◦; 0) (0◦; 0)
x-intercept(s) (−180◦; 0), (0◦; 0) and(180◦; 0)
(−120◦; 0), (0◦; 0) and(120◦; 0)
asymptotes θ = −90◦ and θ = 90◦ θ = −180◦; −60◦ and 180◦
226 5.7. The tangent function

Discovering the characteristics
For functions of the general form: f(θ) = y = tan kθ:
Domain and range
The domain of one branch is {θ : −90◦
k < θ < 90◦
k , θ ∈ R} because f(θ) is undefinedfor θ = −90◦
k and θ = 90◦
k .
The range is {f(θ) : f(θ) ∈ R} or (−∞;∞).
Intercepts
The x-intercepts are determined by letting f(θ) = 0 and solving for θ.
The y-intercept is calculated by letting θ = 0 and solving for f(θ).
y = tan kθ
= tan 0◦
= 0
This gives the point (0◦; 0).
Asymptotes
These are the values of kθ for which tan kθ is undefined.
Exercise 5 – 29: Tangent functions of the form y = tan kθ
Sketch the following functions for −180◦ ≤ θ ≤ 180◦. For each graph determine:
• Period
• Domain and range
• x- and y-intercepts
• Asymptotes
1. f(θ) = tan 2θ
2. g(θ) = tan 3θ4
3. h(θ) = tan(−2θ)
4. k(θ) = tan 2θ3
Think you got it? Get this answer and more practice on our Intelligent Practice Service
1. 22W6 2. 22W7 3. 22W8 4. 22W9
www.everythingmaths.co.za m.everythingmaths.co.za
227Chapter 5. Functions

Functions of the form y = tan (θ + p) EMBHC
We now consider tangent functions of the form y = tan(θ + p) and the effects ofparameter p.
Investigation: The effects of p on a tangent graph
1. On the same system of axes, plot the following graphs for −360◦ ≤ θ ≤ 360◦:
a) y1 = tan θ
b) y2 = tan(θ − 60◦)
c) y3 = tan(θ − 90◦)
d) y4 = tan(θ + 60◦)
e) y5 = tan(θ + 180◦)
2. Use your sketches of the functions above to complete the following table:
y1 y2 y3 y4 y5perioddomainrangey-intercept(s)x-intercept(s)asymptoteseffect of p
The effect of the parameter on y = tan(θ + p)
The effect of p on the tangent function is a horizontal shift (or phase shift); the entiregraph slides to the left or to the right.
• For p > 0, the graph of the tangent function shifts to the left by p.
• For p < 0, the graph of the tangent function shifts to the right by p.
p > 0 p < 0
228 5.7. The tangent function

Worked example 27: Tangent function
QUESTION
1. Sketch the following functions on the same set of axes for −180◦ ≤ θ ≤ 180◦.
a) y1 = tan θ
b) y2 = tan(θ + 30◦)
For each function determine the following:
2. • Period
• Domain and range
• x- and y-intercepts
• Asymptotes
SOLUTION
Step 1: Examine the equations of the form y = tan(θ + p)
Notice that for y1 = tan θ we have p = 0◦ (no phase shift) and for y2 = tan(θ + 30◦),p > 0 therefore the graph shifts to the left by 30◦.
Step 2: Complete a table of values
θ −180◦ −135◦ −90◦ −45◦ 0◦ 45◦ 90◦ 135◦ 180◦
tan θ 0 1 UNDEF −1 0 1 UNDEF −1 0
tan(θ+30◦) 0,58 3,73 −1,73 −0,27 0,58 3,73 −1,73 −0,27 0,58
Step 3: Sketch the tangent graphs
1
2
3
4
5
6
−1
−2
−3
−4
−5
−6
45◦ 90◦ 135◦ 180◦−45◦−90◦−135◦−180◦θ
f(θ)
b
b
b
b
b
b
b
b
b
b
b
b
b
b
b b
Step 4: Complete the table
y1 = tan θ y2 = tan(θ + 30◦)
period 180◦ 180◦
domain {θ : −180◦ ≤ θ ≤ 180◦, θ 6=−90◦; 90◦}
{θ : −180◦ ≤ θ ≤180◦, θ 6= −120◦; 60◦}
range (−∞;∞) (−∞;∞)
y-intercept(s) (0◦; 0) (0◦; 0,58)
x-intercept(s) (−180◦; 0), (0◦; 0) and (180◦; 0) (−30◦; 0) and (150◦; 0)
asymptotes θ = −90◦ and θ = 90◦ θ = −120◦ and θ = 60◦
229Chapter 5. Functions

Discovering the characteristics
For functions of the general form: f(θ) = y = tan(θ + p):
Domain and range
The domain of one branch is {θ : θ ∈ (−90◦ − p; 90◦ − p)} because the function isundefined for θ = −90◦ − p and θ = 90◦ − p.
The range is {f(θ) : f(θ) ∈ R}.
Intercepts
The x-intercepts are determined by letting f(θ) = 0 and solving for θ.
The y-intercept is calculated by letting θ = 0◦ and solving for f(θ).
y = tan(θ + p)
= tan(0◦ + p)
= tan p
This gives the point (0◦; tan p).
Exercise 5 – 30: Tangent functions of the form y = tan(θ + p)
Sketch the following functions for −360◦ ≤ θ ≤ 360◦.
For each function, determine the following:
• Period
• Domain and range
• x- and y-intercepts
• Asymptotes
1. f(θ) = tan(θ + 45◦)
2. g(θ) = tan(θ − 30◦)
3. h(θ) = tan(θ + 60◦)
Think you got it? Get this answer and more practice on our Intelligent Practice Service
1. 22WB 2. 22WC 3. 22WD
www.everythingmaths.co.za m.everythingmaths.co.za
230 5.7. The tangent function

Sketching tangent graphs EMBHD
Worked example 28: Sketching a tangent graph
QUESTION
Sketch the graph of f(θ) = tan 12(θ − 30◦) for −180◦ ≤ θ ≤ 180◦.
SOLUTION
Step 1: Examine the form of the equation
From the equation we see that 0 < k < 1, therefore the branches of the graph will beless steep than the standard tangent graph y = tan θ. We also notice that p < 0 so thegraph will be shifted to the right on the x-axis.
Step 2: Determine the period
The period for f(θ) = tan 12(θ − 30◦) is:
Period =180◦
|k|
=180◦
12
= 360◦
Step 3: Determine the asymptotes
The standard tangent graph, y = tan θ, for −180◦ ≤ θ ≤ 180◦ is undefined at θ = −90◦
and θ = 90◦. Therefore we can determine the asymptotes of f(θ) = tan 12(θ − 30◦):
• −90◦0,5 + 30◦ = −150◦
• 90◦
0,5 + 30◦ = 210◦
The asymptote at θ = 210◦ lies outside the required interval.
231Chapter 5. Functions

Step 4: Plot the points and join with a smooth curve
1
2
3
4
5
6
−1
−2
−3
−4
−5
−6
45◦ 90◦ 135◦ 180◦−45◦−90◦−135◦−180◦θ
f(θ)
Period: 360◦
Domain: {θ : −180◦ ≤ θ ≤ 180◦, θ 6= −150◦}Range: (−∞;∞)y-intercepts: (0◦;−0,27)x-intercept: (30◦; 0)Asymptotes: θ = −150◦
Exercise 5 – 31: The tangent function
1. Sketch the following graphs on separate axes:
a) y = tan θ − 1 for −90◦ ≤ θ ≤ 90◦
b) f(θ) = − tan 2θ for 0◦ ≤ θ ≤ 90◦
c) y = 12 tan(θ + 45◦) for 0◦ ≤ θ ≤ 360◦
d) y = tan(30◦ − θ) for −180◦ ≤ θ ≤ 180◦
2. Given the graph of y = a tan kθ, determine the values of a and k.
θ
f(θ)
b
b
(90◦;−1)360◦
Think you got it? Get this answer and more practice on our Intelligent Practice Service
1a. 22WF 1b. 22WG 1c. 22WH 1d. 22WJ 2. 22WK
www.everythingmaths.co.za m.everythingmaths.co.za
232 5.7. The tangent function

Exercise 5 – 32: Mixed exercises
1. Determine the equation for each of the following:
a) f(θ) = a sin kθ and g(θ) = a tan θ
θ
y
b b
f
(45◦;− 3
2)
g
(180◦; 0)
(135◦;−1 1
2)
b) f(θ) = a sin kθ and g(θ) = a cos(θ + p)
θ0
y
b
(−90◦; 2)
−180◦ 180◦
f and g
c) y = a tan kθ
θ0
y
b
(90◦; 3)
360◦180◦
d) y = a cos θ + q
θ0
y
4
360◦180◦
233Chapter 5. Functions
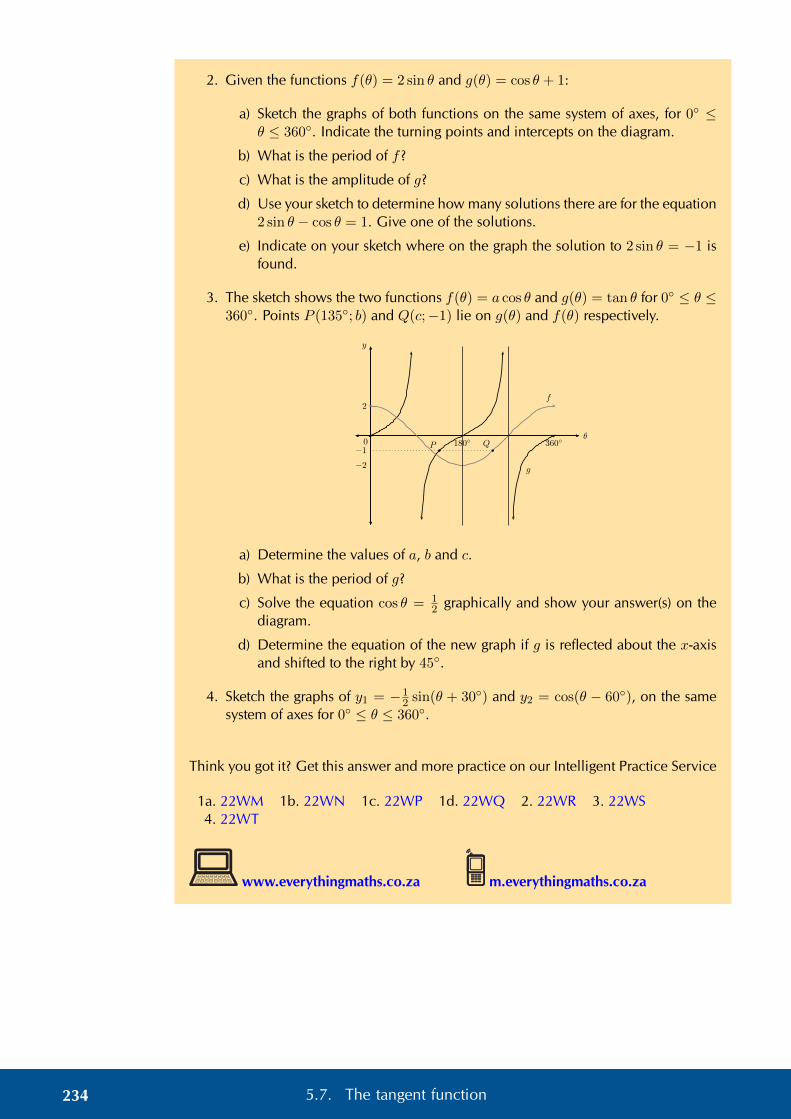
2. Given the functions f(θ) = 2 sin θ and g(θ) = cos θ + 1:
a) Sketch the graphs of both functions on the same system of axes, for 0◦ ≤θ ≤ 360◦. Indicate the turning points and intercepts on the diagram.
b) What is the period of f?
c) What is the amplitude of g?
d) Use your sketch to determine how many solutions there are for the equation2 sin θ − cos θ = 1. Give one of the solutions.
e) Indicate on your sketch where on the graph the solution to 2 sin θ = −1 isfound.
3. The sketch shows the two functions f(θ) = a cos θ and g(θ) = tan θ for 0◦ ≤ θ ≤360◦. Points P (135◦; b) and Q(c;−1) lie on g(θ) and f(θ) respectively.
θ0
y
b b360◦180◦P Q
g
f
−1
2
−2
a) Determine the values of a, b and c.
b) What is the period of g?
c) Solve the equation cos θ = 12 graphically and show your answer(s) on the
diagram.
d) Determine the equation of the new graph if g is reflected about the x-axisand shifted to the right by 45◦.
4. Sketch the graphs of y1 = −12 sin(θ + 30◦) and y2 = cos(θ − 60◦), on the same
system of axes for 0◦ ≤ θ ≤ 360◦.
Think you got it? Get this answer and more practice on our Intelligent Practice Service
1a. 22WM 1b. 22WN 1c. 22WP 1d. 22WQ 2. 22WR 3. 22WS4. 22WT
www.everythingmaths.co.za m.everythingmaths.co.za
234 5.7. The tangent function
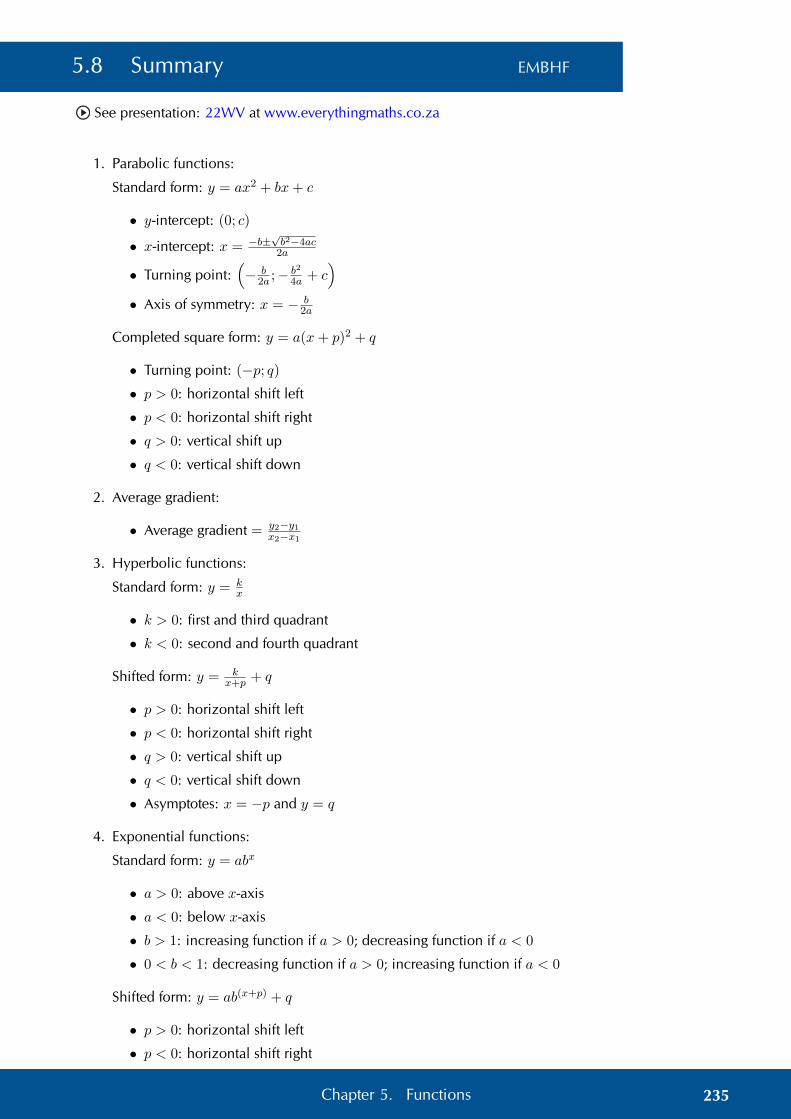
5.8 Summary EMBHF
See presentation: 22WV at www.everythingmaths.co.za
1. Parabolic functions:
Standard form: y = ax2 + bx+ c
• y-intercept: (0; c)
• x-intercept: x = −b±√b2−4ac2a
• Turning point:(− b
2a ;− b2
4a + c)
• Axis of symmetry: x = − b2a
Completed square form: y = a(x+ p)2 + q
• Turning point: (−p; q)• p > 0: horizontal shift left
• p < 0: horizontal shift right
• q > 0: vertical shift up
• q < 0: vertical shift down
2. Average gradient:
• Average gradient = y2−y1x2−x1
3. Hyperbolic functions:
Standard form: y = kx
• k > 0: first and third quadrant
• k < 0: second and fourth quadrant
Shifted form: y = kx+p + q
• p > 0: horizontal shift left
• p < 0: horizontal shift right
• q > 0: vertical shift up
• q < 0: vertical shift down
• Asymptotes: x = −p and y = q
4. Exponential functions:
Standard form: y = abx
• a > 0: above x-axis
• a < 0: below x-axis
• b > 1: increasing function if a > 0; decreasing function if a < 0
• 0 < b < 1: decreasing function if a > 0; increasing function if a < 0
Shifted form: y = ab(x+p) + q
• p > 0: horizontal shift left
• p < 0: horizontal shift right
235Chapter 5. Functions

• q > 0: vertical shift up
• q < 0: vertical shift down
• Asymptotes: y = q
5. Sine functions:
Shifted form: y = a sin(kθ + p) + q
• Period = 360◦
|k|
• k > 1 or k < −1: period decreases
• 0 < k < 1 or −1 < k < 0: period increases
• p > 0: horizontal shift left
• p < 0: horizontal shift right
• q > 0: vertical shift up
• q < 0: vertical shift down
• sin(−θ) = − sin θ
6. Cosine functions:
Shifted form: y = a cos(kθ + p) + q
• Period = 360◦
|k|
• k > 1 or k < −1: period decreases
• 0 < k < 1 or −1 < k < 0: period increases
• p > 0: horizontal shift left
• p < 0: horizontal shift right
• q > 0: vertical shift up
• q < 0: vertical shift down
• cos(−θ) = cos θ
7. Tangent functions:
Shifted form: y = a tan(kθ + p) + q
• Period = 180◦
|k|
• k > 1 or k < −1: period decreases
• 0 < k < 1 or −1 < k < 0: period increases
• p > 0: horizontal shift left
• p < 0: horizontal shift right
• q > 0: vertical shift up
• q < 0: vertical shift down
• tan(−θ) = − tan θ
• Asymptotes: 90◦−pk ± 180◦n
k , n ∈ Z
236 5.8. Summary

Exercise 5 – 33: End of chapter exercises
1. Show that if a < 0, then the range of f(x) = a(x+ p)2 + q is{f(x) : f(x) ∈ (−∞, q]}.
2. If (2; 7) is the turning point of f(x) = −2x2 − 4ax + k, find the values of theconstants a and k.
3. The following graph is represented by the equation f(x) = ax2 + bx. The coor-dinates of the turning point are (3; 9). Show that a = −1 and b = 6.
b (3; 9)
x0
y
4. Given: f(x) = x2 − 2x+ 3. Give the equation of the new graph originating if:
a) the graph of f is moved three units to the left.
b) the x-axis is moved down three units.
5. A parabola with turning point (−1;−4) is shifted vertically by 4 units upwards.What are the coordinates of the turning point of the shifted parabola?
6. Plot the graph of the hyperbola defined by y = 2x for −4 ≤ x ≤ 4. Suppose
the hyperbola is shifted 3 units to the right and 1 unit down. What is the newequation then?
7. Based on the graph of y = k(x+p) + q, determine the equation of the graph with
asymptotes y = 2 and x = 1 and passing through the point (2; 3).
y
x0
2
1
b (2; 3)
237Chapter 5. Functions

8. The columns in the table below give the y-values for the following functions:y = ax, y = ax+1 and y = ax + 1. Match each function to the correct column.
x A B C−2 7,25 6,25 2,5
−1 3,5 2,5 1
0 2 1 0,4
1 1,4 0,4 0,16
2 1,16 0,16 0,064
9. The graph of f(x) = 1 + a . 2x (a is a constant) passes through the origin.
a) Determine the value of a.
b) Determine the value of f(−15) correct to five decimal places.
c) Determine the value of x, if P (x; 0,5) lies on the graph of f .
d) If the graph of f is shifted 2 units to the right to give the function h, writedown the equation of h.
10. The graph of f(x) = a . bx (a 6= 0) has the point P (2; 144) on f .
a) If b = 0,75, calculate the value of a.
b) Hence write down the equation of f .
c) Determine, correct to two decimal places, the value of f(13).
d) Describe the transformation of the curve of f to h if h(x) = f(−x).
11. Using your knowledge of the effects of p and k draw a rough sketch of the fol-lowing graphs without a table of values.
a) y = sin 3θ for −180◦ ≤ θ ≤ 180◦
b) y = − cos 2θ for 0◦ ≤ θ ≤ 180◦
c) y = tan 12θ for 0◦ ≤ θ ≤ 360◦
d) y = sin(θ − 45◦) for −360◦ ≤ θ ≤ 360◦
e) y = cos(θ + 45◦) for 0◦ ≤ θ ≤ 360◦
f) y = tan(θ − 45◦) for 0◦ ≤ θ ≤ 360◦
g) y = 2 sin 2θ for −180◦ ≤ θ ≤ 180◦
h) y = sin(θ + 30◦) + 1 for −360◦ ≤ θ ≤ 0◦
Think you got it? Get this answer and more practice on our Intelligent Practice Service
1. 22WW 2. 22WX 3. 22WY 4. 22WZ 5. 22X2 6. 22X37. 22X4 8. 22X5 9. 22X6 10. 22X7 11a. 22X8 11b. 22X9
11c. 22XB 11d. 22XC 11e. 22XD 11f. 22XF 11g. 22XG 11h. 22XH
www.everythingmaths.co.za m.everythingmaths.co.za
238 5.8. Summary

CHAPTER 6
Trigonometry
6.1 Revision 240
6.2 Trigonometric identities 247
6.3 Reduction formula 253
6.4 Trigonometric equations 266
6.5 Area, sine, and cosine rules 280
6.6 Summary 301

6 Trigonometry
6.1 Revision EMBHG
Trigonometric ratios
bbb b
y
x
P (x; y)Q(−x; y)
Oα
β
rr
We plot the points P (x; y) andQ(−x; y) in the Cartesian plane and measure the anglesfrom the positive x-axis to the terminal arms (OP and OQ).
P (x; y) lies in the first quadrant with POX = α and Q(−x; y) lies in the secondquadrant with QOX = β.
Using the theorem of Pythagoras we have that
OP 2 = x2 + y2
And OQ2 = (−x)2 + y2
= x2 + y2
∴ OP = OQ
Let OP = OQ = r.
Trigonometric ratios
sinα =y
r
cosα =x
r
tanα =y
x
In the second quadrant we notice that −x < 0
sinβ =y
r
cosβ = −xr
tanβ = −yx
240 6.1. Revision
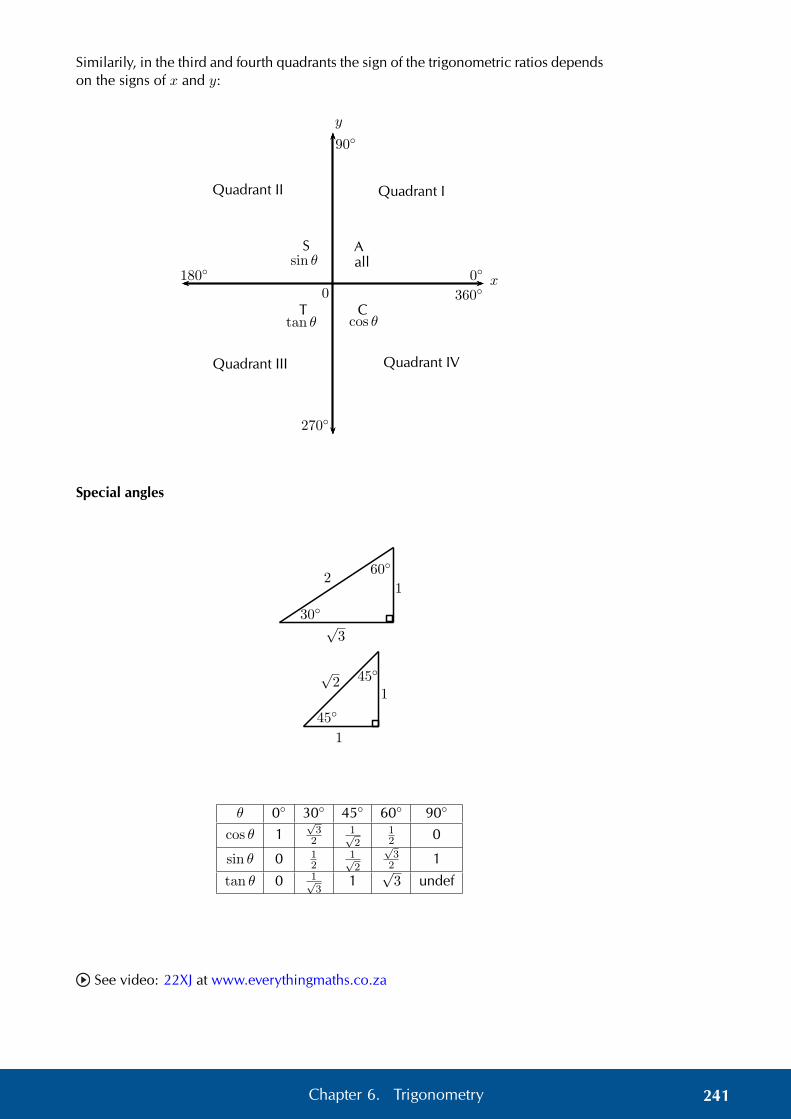
Similarily, in the third and fourth quadrants the sign of the trigonometric ratios dependson the signs of x and y:
Quadrant IQuadrant II
Quadrant III Quadrant IV
Aall
Ssin θ
Ttan θ
Ccos θ
x
y
0◦
360◦
90◦
180◦
270◦
0
Special angles
30◦
60◦
1
√3
2
45◦
45◦
1
1
√2
θ 0◦ 30◦ 45◦ 60◦ 90◦
cos θ 1√32
1√2
12 0
sin θ 0 12
1√2
√32 1
tan θ 0 1√3
1√
3 undef
See video: 22XJ at www.everythingmaths.co.za
241Chapter 6. Trigonometry

Solving equations
Worked example 1: Solving equations
QUESTION
Determine the values of a and b in the right-angled triangle TUW (correct to onedecimal place):
T
WU
47◦
b
30
a
SOLUTION
Step 1: Identify the opposite and adjacent sides and the hypotenuse
Step 2: Determine the value of a
sin θ =opposite sidehypotenuse
sin 47◦ =30
a
a =30
sin 47◦
∴ a = 41,0
Step 3: Determine the value of b
Always try to use the information that is given for calculations and not answers that youhave worked out in case you have made an error. For example, avoid using a = 41,0to determine the value of b.
tan θ =opposite sideadjacent side
tan 47◦ =30
b
b =30
tan 47◦
∴ b = 28,0
Step 4: Write the final answer
a = 41,0 units and b = 28,0 units.
242 6.1. Revision

Finding an angle
Worked example 2: Finding an angle
QUESTION
Calculate the value of θ in the right-angled triangle MNP (correct to one decimalplace):
P
NM
41
θ
24
SOLUTION
Step 1: Identify the opposite and adjacent sides and the hypotenuse
Step 2: Determine the value of θ
tan θ =opposite sideadjacent side
tan θ =41
24
∴ θ = tan−1(
41
24
)θ = 59,7◦
243Chapter 6. Trigonometry

Worked example 3: Finding an angle
QUESTION
Given 2 sin θ2 = cos 43◦, for θ ∈ [0◦; 90◦], determine the value of θ (correct to one
decimal place).
SOLUTION
Step 1: Simplify the equation
Avoiding rounding off in calculations until you have determined the final answer. Inthe calculation below, the dots indicate that the number has not been rounded so thatthe answer is as accurate as possible.
2 sinθ
2= cos 43◦
sinθ
2=
cos 43◦
2θ
2= sin−1(0,365 . . .)
θ = 2(21,449 . . .)
∴ θ = 42,9◦
Two-dimensional problems
Worked example 4: Flying a kite
QUESTION
Thelma flies a kite on a 22 m piece of string and the height of the kite above theground is 20,4 m. Determine the angle of inclination of the string (correct to onedecimal place).
SOLUTION
Step 1: Draw a sketch and identify the opposite and adjacent sides and the hy-potenuse
Let the angle of inclination of the string be θ.
244 6.1. Revision

Kite
Thelma
20,4
θ
22
Step 2: Use an appropriate trigonometric ratio to find θ
sin θ =opposite sidehypotenuse
=20,422
θ = sin−1(0,927 . . .)
∴ θ = 68,0◦
Exercise 6 – 1: Revision
1. If p = 49◦ and q = 32◦, use a calculator to determine whether the followingstatements are true of false:
a) sin p+ 3 sin p = 4 sin p
b)sin q
cos q= tan q
c) cos(p− q) = cos p− cos q
d) sin(2p) = 2 sin p cos p
2. Determine the following angles (correct to one decimal place):
a) cosα = 0,64
b) sin θ + 2 = 2,65
c)1
2cos 2β = 0,3
d) tan θ3 = sin 48◦
e) cos 3p = 1,03
f) 2 sin 3β + 1 = 2,6
g)sin θ
cos θ= 42
3
3. In 4ABC,ACB = 30◦, AC = 20 cm and BC = 22 cm. The perpendicularline from A intersects BC at T .
245Chapter 6. Trigonometry

Determine:A
C BT
20 cm
22 cm
30◦
a) the length TC
b) the length AT
c) the angle BAT
4. A rhombus has a perimeter of 40 cm and one of the internal angles is 30◦.
a) Determine the length of the sides.
b) Determine the lengths of the diagonals.
c) Calculate the area of the rhombus.
5. Simplify the following without using a calculator:
a) 2 sin 45◦ × 2 cos 45◦
b) cos2 30◦ − sin2 60◦
c) sin 60◦ cos 30◦ − cos 60◦ sin 30◦ − tan 45◦
d) 4 sin 60◦ cos 30◦ − 2 tan 45◦ + tan 60◦ − 2 sin 60◦
e) sin 60◦ ×√
2 tan 45◦ + 1− sin 30◦
6. Given the diagram below.
b
x
y
0
B(2; 2√3)
β
Determine the following without using a calculator:
a) β
b) cosβ
c) cos2 β + sin2 β
7. The 10 m ladder of a fire truck leans against the wall of a burning building at anangle of 60◦. The height of an open window is 9 m from the ground. Will theladder reach the window?
Think you got it? Get this answer and more practice on our Intelligent Practice Service
1. 22XK 2a. 22XM 2b. 22XN 2c. 22XP 2d. 22XQ 2e. 22XR2f. 22XS 2g. 22XT 3. 22XV 4. 22XW 5a. 22XX 5b. 22XY5c. 22XZ 5d. 22Y2 5e. 22Y3 6. 22Y4 7. 22Y5
www.everythingmaths.co.za m.everythingmaths.co.za
246 6.1. Revision

6.2 Trigonometric identities EMBHH
An identity is a mathematical statement that equates one quantity with another. Trigono-metric identities allow us to simplify a given expression so that it contains sine and co-sine ratios only. This enables us to solve equations and also to prove other identities.
Quotient identity
Investigation: Quotient identity
1. Complete the table without using a calculator, leaving your answer in surd formwhere applicable:
θ = 45◦
θ
35
x
y
(3; 2)
θ
b
sin θ
cos θ
sin θcos θ
tan θ
2. Examine the last two rows of the table and make a conjecture.
3. Are there any values of θ for which your conjecture would not be true? Explainyour answer.
We know that tan θ is defined as:
tan θ =opposite sideadjacent side
Using the diagram below and the theorem of Pythagoras, we can write the tangentfunction in terms of x, y and r:
x
y
(x; y)
θ
b
O
247Chapter 6. Trigonometry

tan θ =y
x
=y
x× r
r
=y
r× r
x
=y
r÷ x
r
= sin θ ÷ cos θ
=sin θ
cos θ
This is the quotient identity:
tan θ =sin θ
cos θ
Notice that tan θ is undefined if cos θ = 0, therefore θ 6= k × 90◦, where k is an oddinteger.
1
2
3
4
5
6
−1
−2
−3
−4
−5
−6
45◦ 90◦ 135◦ 180◦−45◦−90◦−135◦−180◦θ
f(θ)
tan θ
Square identity
Investigation: Square identity
1. Use a calculator to complete the following table:
sin2 80◦ + cos2 80◦ =
cos2 23◦ + sin2 23◦ =
sin 50◦ + cos 50◦ =
sin2 67◦ − cos2 67◦ =
sin2 67◦ + cos2 67◦ =
2. What do you notice? Make a conjecture.
3. Draw a sketch and prove your conjecture in general terms, using x, y and r.
248 6.2. Trigonometric identities

x
y
(x; y)
α
b
O
r
Using the theorem of Pythagoras, we can write the sine and cosine functions in termsof x, y and r:
sin2 θ + cos2 θ =(yr
)2+(xr
)2=y2
r2+x2
r2
=y2 + x2
r2
=r2
r2
= 1
This is the square identity:
sin2 θ + cos2 θ = 1
Other forms of the square identity
Complete the following:
1. sin2 θ = 1− . . . . . .
2. cos θ = ±√. . . . . .
3. sin2 θ = (1 + . . . . . .)(1− . . . . . .)
4. cos2 θ − 1 = . . . . . .
Here are some useful tips for proving identities:
• Change all trigonometric ratios to sine and cosine.
• Choose one side of the equation to simplify and show that it is equal to the otherside.
• Usually it is better to choose the more complicated side to simplify.
• Sometimes we need to simplify both sides of the equation to show that they areequal.
• A square root sign often indicates that we need to use the square identity.
• We can also add to the expression to make simplifying easier:
– replace 1 with sin2 θ + cos2 θ.
– multiply by 1 in the form of a suitable fraction, for example1 + sin θ
1 + sin θ.
249Chapter 6. Trigonometry

See video: 22Y6 at www.everythingmaths.co.za
Worked example 5: Trigonometric identities
QUESTION
Simplify the following:
1. tan2 θ × cos2 θ
2.1
cos2 θ− tan2 θ
SOLUTION
Step 1: Write the expression in terms of sine and cosine only
We use the square and quotient identities to write the given expression in terms of sineand cosine and then simplify as far as possible.
1.
tan2 θ × cos2 θ =
(sin θ
cos θ
)2
× cos2 θ
=sin2 θ
cos2 θ× cos2 θ
= sin2 θ
2.
1
cos2 θ− tan2 θ =
1
cos2 θ−(
sin θ
cos θ
)2
=1
cos2 θ− sin2 θ
cos2 θ
=1− sin2 θ
cos2 θ
=cos2 θ
cos2 θ
= 1
250 6.2. Trigonometric identities

Worked example 6: Trigonometric identities
QUESTION
Prove:1− sinα
cosα=
cosα
1 + sinα
SOLUTION
Step 1: Note restrictions
When working with fractions, we must be careful that the denominator does not equal0. Therefore cos θ 6= 0 for the fraction on the left-hand side and sin θ + 1 6= 0 for thefraction on the right-hand side.
Step 2: Simplify the left-hand side
This is not an equation that needs to be solved. We are required to show that one sideof the equation is equal to the other. We can choose either of the two sides to simplify.
LHS =1− sinα
cosα
=1− sinα
cosα× 1 + sinα
1 + sinα
Notice that we have not changed the equation — this is the same as multiplying by 1since the numerator and the denominator are the same.
Step 3: Determine the lowest common denominator and simplify
LHS =1− sin2 α
cosα(1 + sinα)
=cos2 α
cosα(1 + sinα)
=cosα
1 + sinα
= RHS
251Chapter 6. Trigonometry

Exercise 6 – 2: Trigonometric identities
1. Reduce the following to one trigonometric ratio:
a)sinα
tanα
b) cos2 θ tan2 θ + tan2 θ sin2 θ
c) 1− sin θ cos θ tan θ
d)(
1− cos2 β
cos2 β
)− tan2 β
2. Prove the following identities and state restrictions where appropriate:
a)1 + sin θ
cos θ=
cos θ
1− sin θ
b) sin2α+ (cosα− tanα) (cosα+ tanα) = 1− tan2α
c)1
cos θ− cos θtan2θ
1= cos θ
d)2 sin θ cos θ
sin θ + cos θ= sin θ + cos θ − 1
sin θ + cos θ
e)(
cosβ
sinβ+ tanβ
)cosβ =
1
sinβ
f)1
1 + sin θ+
1
1− sin θ= d 2 tan θ
sin θ cos θ
g)(1 + tan2 α) cosα
(1− tanα)=
1
cosα− sinα
Think you got it? Get this answer and more practice on our Intelligent Practice Service
1a. 22Y7 1b. 22Y8 1c. 22Y9 1d. 22YB 2a. 22YC 2b. 22YD2c. 22YF 2d. 22YG 2e. 22YH 2f. 22YJ 2g. 22YK
www.everythingmaths.co.za m.everythingmaths.co.za
252 6.2. Trigonometric identities

6.3 Reduction formula EMBHJ
Any trigonometric function whose argument is 90◦± θ; 180◦± θ and 360◦± θ can bewritten simply in terms of θ.
Deriving reduction formulae EMBHK
Investigation: Reduction formulae for function values of 180◦ ± θ
1. Function values of 180◦ − θ
In the figure P (√
3; 1) and P ′ lie on the circle with radius 2. OP makes an angleθ = 30◦ with the x-axis.
b P
O x
y
θ
b
θ 180◦ − θ
P ′
22
a) If points P and P ′ are symmetrical about the y-axis, determine the coordi-nates of P ′.
b) Write down values for sin θ, cos θ and tan θ.
c) Use the coordinates for P ′ to determine sin(180◦ − θ), cos(180◦ − θ),tan(180◦ − θ).
d) From your results determine a relationship between the trigonometric func-tion values of (180◦ − θ) and θ.
253Chapter 6. Trigonometry
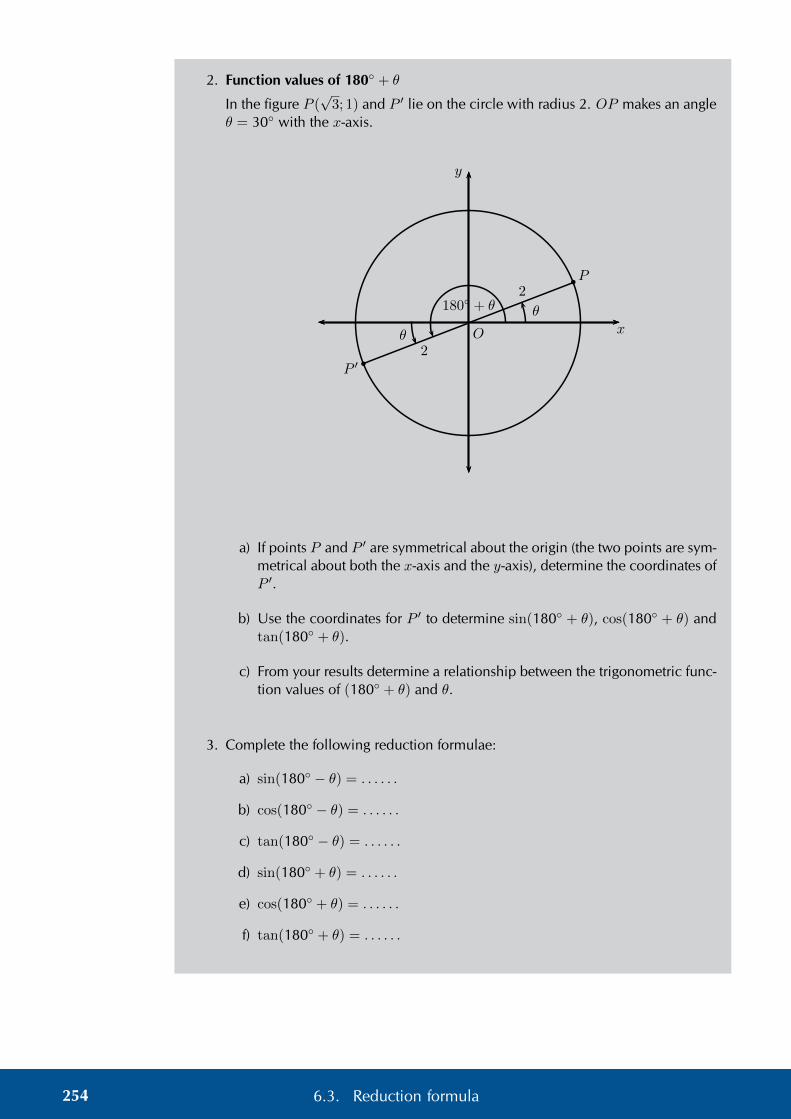
2. Function values of 180◦ + θ
In the figure P (√
3; 1) and P ′ lie on the circle with radius 2. OP makes an angleθ = 30◦ with the x-axis.
b P
O x
y
θ
b
θ
180◦ + θ
P ′
2
2
a) If points P and P ′ are symmetrical about the origin (the two points are sym-metrical about both the x-axis and the y-axis), determine the coordinates ofP ′.
b) Use the coordinates for P ′ to determine sin(180◦ + θ), cos(180◦ + θ) andtan(180◦ + θ).
c) From your results determine a relationship between the trigonometric func-tion values of (180◦ + θ) and θ.
3. Complete the following reduction formulae:
a) sin(180◦ − θ) = . . . . . .
b) cos(180◦ − θ) = . . . . . .
c) tan(180◦ − θ) = . . . . . .
d) sin(180◦ + θ) = . . . . . .
e) cos(180◦ + θ) = . . . . . .
f) tan(180◦ + θ) = . . . . . .
254 6.3. Reduction formula

Worked example 7: Reduction formulae for function values of 180◦ ± θ
QUESTION
Write the following as a single trigonometric ratio:
sin 163◦
cos 197◦+ tan 17◦ + cos(180◦ − θ)× tan(180◦ + θ)
SOLUTION
Step 1: Use reduction formulae to write the trigonometric function values in termsof acute angles and θ
=sin(180◦ − 17◦)cos(180◦ + 17◦)
+ tan 17◦ + (− cos θ)× tan θ
Step 2: Simplify
=sin 17◦
− cos 17◦+ tan 17◦ − cos θ × sin θ
cos θ
= − tan 17◦ + tan 17◦ − sin θ
= − sin θ
Exercise 6 – 3: Reduction formulae for function values of 180◦ ± θ
1. Determine the value of the following expressions without using a calculator:
a) tan 150◦ sin 30◦ − cos 210◦
b) (1 + cos 120◦)(1− sin2 240◦)
c) cos2 140◦ + sin2 220◦
2. Write the following in terms of a single trigonometric ratio:
a) tan(180◦ − θ)× sin(180◦ + θ)
b)tan(180◦ + θ) cos(180◦ − θ)
sin(180◦ − θ)
255Chapter 6. Trigonometry

3. If t = tan 40◦, express the following in terms of t:
a) tan 140◦ + 3 tan 220◦
b)cos 220◦
sin 140◦
Think you got it? Get this answer and more practice on our Intelligent Practice Service
1a. 22YM 1b. 22YN 1c. 22YP 2a. 22YQ 2b. 22YR 3. 22YS
www.everythingmaths.co.za m.everythingmaths.co.za
Investigation: Reduction formulae for function values of (360◦ ± θ) and (−θ)
1. Function values of (360◦ − θ) and (−θ)In the Cartesian plane we measure angles from the positive x-axis to the terminalarm, which means that an anti-clockwise rotation gives a positive angle. We cantherefore measure negative angles by rotating in a clockwise direction.
For an acute angle θ, we know that −θ will lie in the fourth quadrant.
In the figure P (√
3; 1) and P ′ lie on the circle with radius 2. OP makes an angleθ = 30◦ with the x-axis.
b P
O x
y
θ
b
θ
360◦ − θ
P ′
2
2
a) If points P and P ′ are symmetrical about the x-axis (y = 0), determine thecoordinates of P ′.
b) Use the coordinates of P ′ to determine sin(360◦ − θ), cos(360◦ − θ) andtan(360◦ − θ).
c) Use the coordinates of P ′ to determine sin(−θ), cos(−θ) and tan(−θ).d) From your results determine a relationship between the function values of
(360◦ − θ) and −θ.
256 6.3. Reduction formula

e) Complete the following reduction formulae:
i. sin(360◦ − θ) = . . . . . .
ii. cos(360◦ − θ) = . . . . . .
iii. tan(360◦ − θ) = . . . . . .
iv. sin(−θ) = . . . . . .
v. cos(−θ) = . . . . . .
vi. tan(−θ) = . . . . . .
2. Function values of 360◦ + θ
We can also have an angle that is larger than 360◦. The angle completes arevolution of 360◦ and then continues to give an angle of θ.
Complete the following reduction formulae:
a) sin(360◦ + θ) = . . . . . .
b) cos(360◦ + θ) = . . . . . .
c) tan(360◦ + θ) = . . . . . .
From working with functions, we know that the graph of y = sin θ has a period of360◦. Therefore, one complete wave of a sine graph is the same as one completerevolution for sin θ in the Cartesian plane.
0
1
−1
90◦ 180◦ 270◦ 360◦
1st 2nd 3rd 4th
positive positive negative negative
0◦/360◦
90◦
180◦
270◦
2nd
pos.
neg.3rd
neg.4th
1st
pos.
We can also have multiple revolutions. The periodicity of the trigonometric graphsshows this clearly. A complete sine or cosine curve is completed in 360◦.
y = cos θ
y = sin θ
θ
y
257Chapter 6. Trigonometry

If k is any integer, then
sin(k . 360◦ + θ) = sin θ
cos(k . 360◦ + θ) = cos θ
tan(k . 360◦ + θ) = tan θ
Worked example 8: Reduction formulae for function values of 360◦ ± θ
QUESTION
If f = tan 67◦, express the following in terms of f
sin 293◦
cos 427◦+ tan(−67◦) + tan 1147◦
SOLUTION
Step 1: Using reduction formula
=sin(360◦ − 67◦)cos(360◦ + 67◦)
− tan(67◦) + tan (3(360◦) + 67◦)
=− sin 67◦
cos 67◦− tan 67◦ + tan 67◦
= − tan 67◦
= −f
Worked example 9: Using reduction formula
QUESTION
Evaluate without using a calculator:
tan2 210◦ − (1 + cos 120◦) sin2 405◦
SOLUTION
Step 1: Simplify the expression using reduction formulae and special angles
258 6.3. Reduction formula

= tan2(180◦ + 30◦)− (1 + cos(180◦ − 60◦)) sin2(360◦ + 45◦)
= tan2 30◦ − (1 + (− cos 60◦)) sin2 45◦
=
(1√3
)2
−(
1− 1
2
)(1√2
)2
=1
3−(
1
2
)(1
2
)
=1
3− 1
4
=1
12
Exercise 6 – 4: Using reduction formula
1. Simplify the following:
a)tan(180◦ − θ) sin(360◦ + θ)
cos(180◦ + θ) tan(360◦ − θ)
b) cos2(360◦ + θ) + cos(180◦ + θ) tan(360◦ − θ) sin(360◦ + θ)
c)sin(360◦ + α) tan(180◦ + α)
cos(360◦ − α) tan2(360◦ + α)
2. Write the following in terms of cosβ:cos(360◦ − β) cos(−β)− 1
sin(360◦ + β) tan(360◦ − β)
3. Simplify the following without using a calculator:
a)cos 300◦ tan 150◦
sin 225◦ cos(−45◦)
b) 3 tan 405◦ + 2 tan 330◦ cos 750◦
c)cos 315◦ cos 405◦ + sin 45◦ sin 135◦
sin 750◦
d) tan 150◦ cos 390◦ − 2 sin 510◦
e)2 sin 120◦ + 3 cos 765◦ − 2 sin 240◦ − 3 cos 45◦
5 sin 300◦ + 3 tan 225◦ − 6 cos 60◦
4. Given 90◦ < α < 180◦, use a sketch to help explain why:
a) sin(−α) = − sinα
b) cos(−α) = − cosα
259Chapter 6. Trigonometry
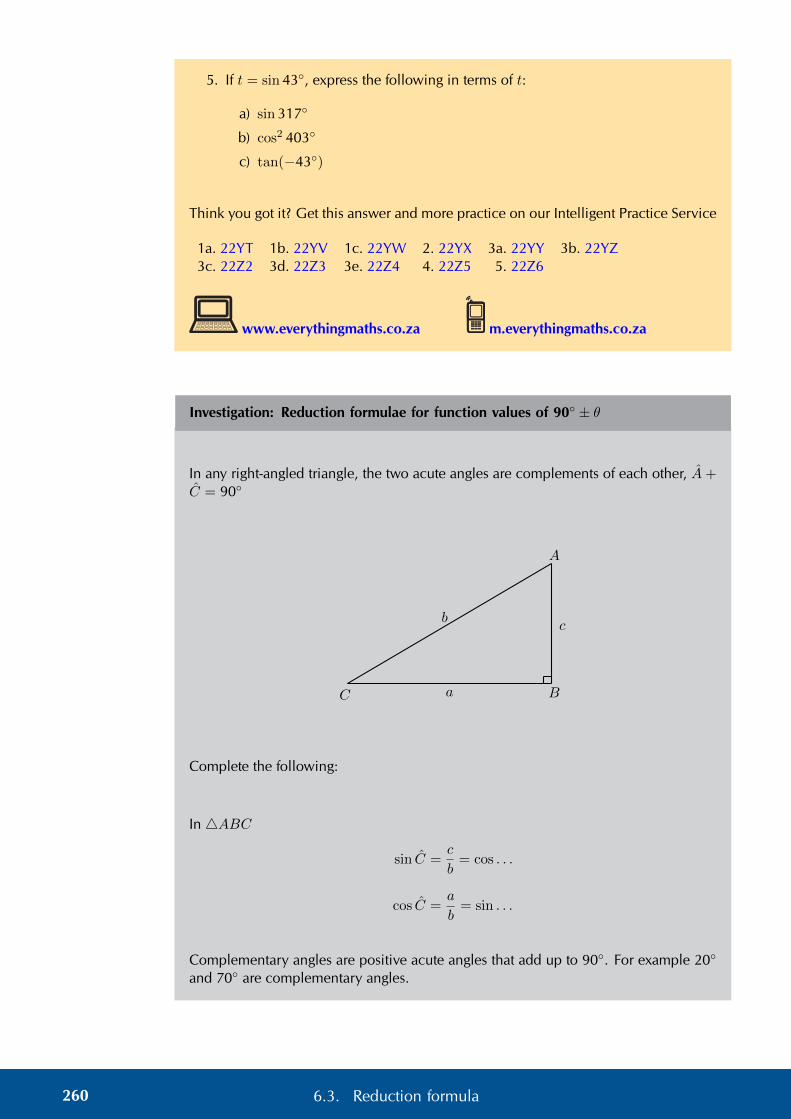
5. If t = sin 43◦, express the following in terms of t:
a) sin 317◦
b) cos2 403◦
c) tan(−43◦)
Think you got it? Get this answer and more practice on our Intelligent Practice Service
1a. 22YT 1b. 22YV 1c. 22YW 2. 22YX 3a. 22YY 3b. 22YZ3c. 22Z2 3d. 22Z3 3e. 22Z4 4. 22Z5 5. 22Z6
www.everythingmaths.co.za m.everythingmaths.co.za
Investigation: Reduction formulae for function values of 90◦ ± θ
In any right-angled triangle, the two acute angles are complements of each other, A+C = 90◦
A
BC
b
a
c
Complete the following:
In 4ABC
sin C =c
b= cos . . .
cos C =a
b= sin . . .
Complementary angles are positive acute angles that add up to 90◦. For example 20◦
and 70◦ are complementary angles.
260 6.3. Reduction formula

In the figure P (√
3; 1) and P ′ lie on a circle with radius 2. OP makes an angle ofθ = 30◦ with the x-axis.
bP
O x
y
θ
b
θ
P ′
2
2
90◦ − θ
1. Function values of 90◦ − θ
a) If points P and P ′ are symmetrical about the line y = x, determine thecoordinates of P ′.
b) Use the coordinates for P ′ to determine sin(90◦ − θ) and cos(90◦ − θ).
c) From your results determine a relationship between the function values of(90◦ − θ) and θ.
2. Function values of 90◦ + θ
In the figure P (√
3; 1) and P ′ lie on the circle with radius 2. OP makes an angleθ = 30◦ with the x-axis.
θ
bP
O x
y
θ
bP ′
90◦ + θ 2
2
261Chapter 6. Trigonometry

a) If point P is rotated through 90◦ to get point P ′, determine the coordinatesof P ′.
b) Use the coordinates for P ′ to determine sin(90◦ + θ) and cos(90◦ + θ).
c) From your results determine a relationship between the function values of(90◦ + θ) and θ.
3. Complete the following reduction formulae:
a) sin(90◦ − θ) = . . . . . .
b) cos(90◦ − θ) = . . . . . .
c) sin(90◦ + θ) = . . . . . .
d) cos(90◦ + θ) = . . . . . .
Sine and cosine are known as co-functions. Two functions are called co-functions iff (A) = g (B) whenever A+B = 90◦ (that is, A and B are complementary angles).
The function value of an angle is equal to the co-function of its complement.
Thus for sine and cosine we have
sin(90◦ − θ) = cos θ
cos(90◦ − θ) = sin θ
The sine and cosine graphs illustrate this clearly: the two graphs are identical exceptthat they have a 90◦ phase difference.
θ
y
y = cos θ
y = sin θ
262 6.3. Reduction formula
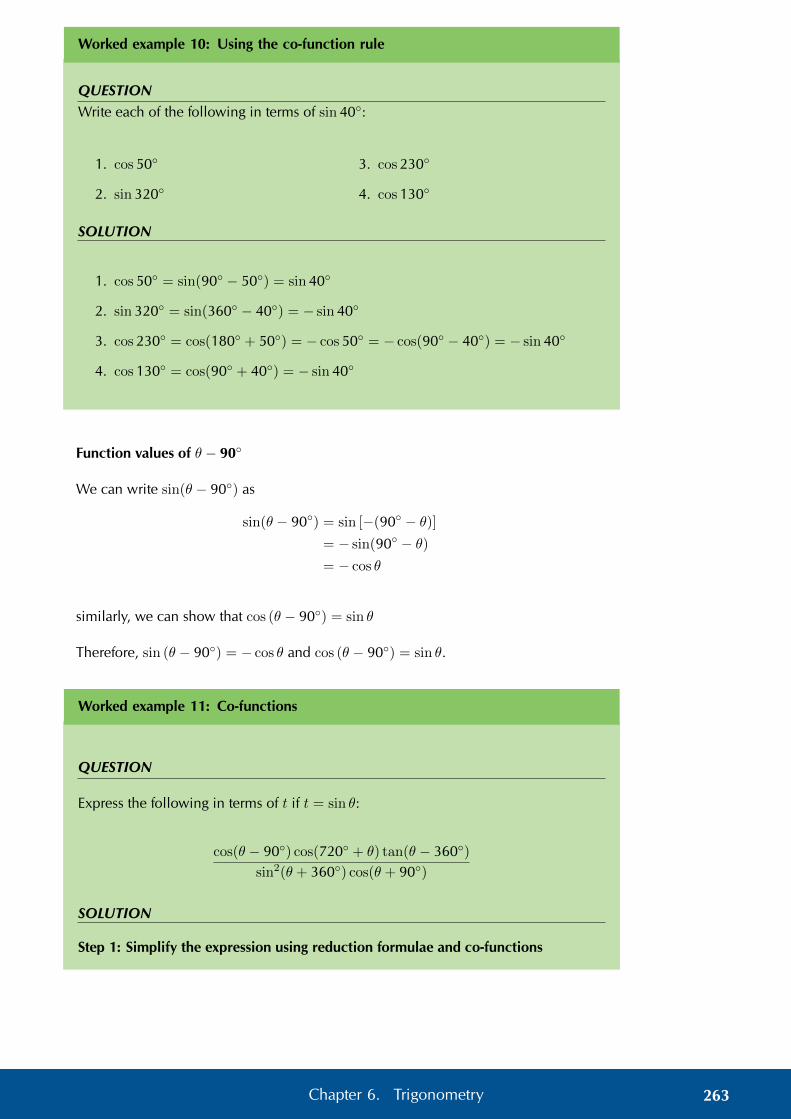
Worked example 10: Using the co-function rule
QUESTIONWrite each of the following in terms of sin 40◦:
1. cos 50◦
2. sin 320◦
3. cos 230◦
4. cos 130◦
SOLUTION
1. cos 50◦ = sin(90◦ − 50◦) = sin 40◦
2. sin 320◦ = sin(360◦ − 40◦) = − sin 40◦
3. cos 230◦ = cos(180◦ + 50◦) = − cos 50◦ = − cos(90◦ − 40◦) = − sin 40◦
4. cos 130◦ = cos(90◦ + 40◦) = − sin 40◦
Function values of θ − 90◦
We can write sin(θ − 90◦) as
sin(θ − 90◦) = sin [−(90◦ − θ)]= − sin(90◦ − θ)= − cos θ
similarly, we can show that cos (θ − 90◦) = sin θ
Therefore, sin (θ − 90◦) = − cos θ and cos (θ − 90◦) = sin θ.
Worked example 11: Co-functions
QUESTION
Express the following in terms of t if t = sin θ:
cos(θ − 90◦) cos(720◦ + θ) tan(θ − 360◦)sin2(θ + 360◦) cos(θ + 90◦)
SOLUTION
Step 1: Simplify the expression using reduction formulae and co-functions
263Chapter 6. Trigonometry
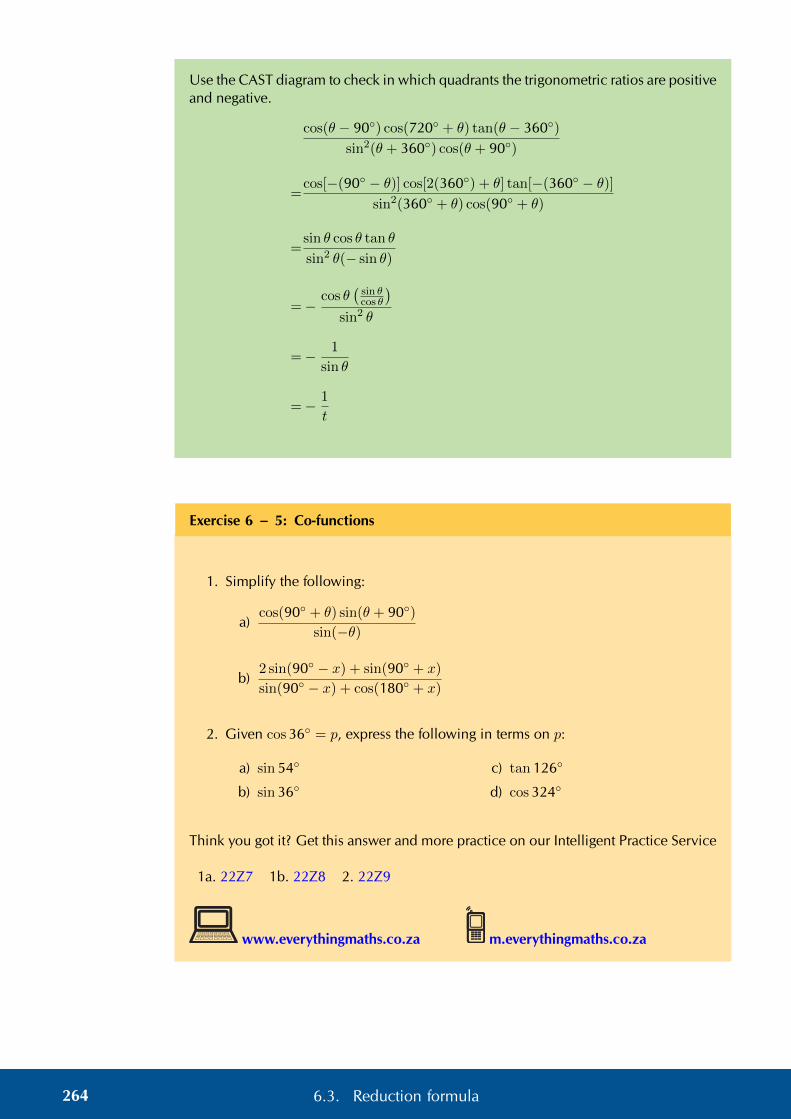
Use the CAST diagram to check in which quadrants the trigonometric ratios are positiveand negative.
cos(θ − 90◦) cos(720◦ + θ) tan(θ − 360◦)sin2(θ + 360◦) cos(θ + 90◦)
=cos[−(90◦ − θ)] cos[2(360◦) + θ] tan[−(360◦ − θ)]
sin2(360◦ + θ) cos(90◦ + θ)
=sin θ cos θ tan θ
sin2 θ(− sin θ)
=−cos θ
(sin θcos θ
)sin2 θ
=− 1
sin θ
=− 1
t
Exercise 6 – 5: Co-functions
1. Simplify the following:
a)cos(90◦ + θ) sin(θ + 90◦)
sin(−θ)
b)2 sin(90◦ − x) + sin(90◦ + x)
sin(90◦ − x) + cos(180◦ + x)
2. Given cos 36◦ = p, express the following in terms on p:
a) sin 54◦
b) sin 36◦c) tan 126◦
d) cos 324◦
Think you got it? Get this answer and more practice on our Intelligent Practice Service
1a. 22Z7 1b. 22Z8 2. 22Z9
www.everythingmaths.co.za m.everythingmaths.co.za
264 6.3. Reduction formula

Reduction formulae and co-functions:
1. The reduction formulae hold for any angle θ. For convenience, we assume θ isan acute angle (0◦ < θ < 90◦).
2. When determining function values of (180◦±θ), (360◦±θ) and (−θ) the functiondoes not change.
3. When determining function values of (90◦±θ) and (θ±90◦) the function changesto its co-function.
second quadrant (180◦ − θ) or (90◦ + θ) first quadrant (θ) or (90◦ − θ)sin(180◦ − θ) = + sin θ all trig functions are positivecos(180◦ − θ) = − cos θ sin(360◦ + θ) = sin θ
tan(180◦ − θ) = − tan θ cos(360◦ + θ) = cos θ
sin(90◦ + θ) = + cos θ tan(360◦ + θ) = tan θ
cos(90◦ + θ) = − sin θ sin(90◦ − θ) = cos θ
cos(90◦ − θ) = sin θ
third quadrant (180◦ + θ) fourth quadrant (360◦ − θ)sin(180◦ + θ) = − sin θ sin(360◦ − θ) = − sin θ
cos(180◦ + θ) = − cos θ cos(360◦ − θ) = + cos θ
tan(180◦ + θ) = + tan θ tan(360◦ − θ) = − tan θ
Exercise 6 – 6: Reduction formulae
1. Write A and B as a single trigonometric ratio:
a) A = sin(360◦ − θ) cos(180◦ − θ) tan(360◦ + θ)
b) B =cos(360◦ + θ) cos(−θ) sin(−θ)
cos(90◦ + θ)
c) Hence, determine:
i. A+B = . . .
ii. AB = . . .
2. Write the following as a function of an acute angle:
a) sin 163◦
b) cos 327◦c) tan 248◦
d) cos(−213◦)
3. Determine the value of the following, without using a calculator:
a)sin(−30◦)tan(150◦)
+ cos 330◦
b) tan 300◦ cos 120◦
c) (1− cos 30◦)(1− cos 210◦)
d) cos 780◦ − (sin 315◦)(cos 405◦)
4. Prove that the following identity is true and state any restrictions:sin(180◦ + α) tan(360◦ + α) cosα
cos(90◦ − α)= sinα
Think you got it? Get this answer and more practice on our Intelligent Practice Service
1. 22ZB 2a. 22ZC 2b. 22ZD 2c. 22ZF 2d. 22ZG 3a. 22ZH3b. 22ZJ 3c. 22ZK 3d. 22ZM 4. 22ZN
www.everythingmaths.co.za m.everythingmaths.co.za
265Chapter 6. Trigonometry

6.4 Trigonometric equations EMBHM
Solving trigonometric equations requires that we find the value of the angles that satisfythe equation. If a specific interval for the solution is given, then we need only find thevalue of the angles within the given interval that satisfy the equation. If no interval isgiven, then we need to find the general solution. The periodic nature of trigonometricfunctions means that there are many values that satisfy a given equation, as shown inthe diagram below.
1
−1
90◦ 180◦ 270◦ 360◦−90◦−180◦−270◦−360◦
b bbb
θ0
y
y = 0,5
y = sin θ
Worked example 12: Solving trigonometric equations
QUESTION
Solve for θ (correct to one decimal place), given tan θ = 5 and θ ∈ [0◦; 360◦].
SOLUTION
Step 1: Use a calculator to solve for θ
tan θ = 5
∴ θ = tan−1 5
= 78,7◦
This value of θ is an acute angle which lies in the first quadrant and is called thereference angle.
Step 2: Use the CAST diagram to determine in which quadrants tan θ is positive
The CAST diagram indicates that tan θ is positive in the first and third quadrants, there-fore we must determine the value of θ such that 180◦ < θ < 270◦.
Using reduction formulae, we know that tan(180◦ + θ) = tan θ
θ = 180◦ + 78,7◦
∴ θ = 258,7◦
Step 3: Use a calculator to check that the solution satisfies the original equation
Step 4: Write the final answer
θ = 78,7◦ or θ = 258,7◦.
266 6.4. Trigonometric equations

Worked example 13: Solving trigonometric equations
QUESTION
Solve for α (correct to one decimal place), given cosα = −0,7 and θ ∈ [0◦; 360◦].
SOLUTION
Step 1: Use a calculator to find the reference angle
To determine the reference angle, we do not include the negative sign. The referenceangle must be an acute angle in the first quadrant, where all the trigonometric functionsare positive.
ref ∠ = cos−1 0,7
= 45,6◦
Step 2: Use the CAST diagram to determine in which quadrants cosα is negative
The CAST diagram indicates that cosα is negative in the second and third quadrants,therefore we must determine the value of α such that 90◦ < α < 270◦.
Using reduction formulae, we know that cos(180◦−α) = − cosα and cos(180◦+α) =− cosα
In the second quadrant:
α = 180◦ − 45,6◦
= 134,4◦
In the third quadrant:
α = 180◦ + 45,6◦
= 225,6◦
Note: the reference angle (45,6◦) does not form part of the solution.
Step 3: Use a calculator to check that the solution satisfies the original equation
Step 4: Write the final answer
α = 134,4◦ or α = 225,6◦.
267Chapter 6. Trigonometry

Worked example 14: Solving trigonometric equations
QUESTION
Solve for β (correct to one decimal place), given sinβ = −0,5 and β ∈ [−360◦; 360◦].
SOLUTION
Step 1: Use a calculator to find the reference angle
To determine the reference angle, we use a positive value.
ref ∠ = sin−1 0,5
= 30◦
Step 2: Use the CAST diagram to determine in which quadrants sinβ is negative
The CAST diagram indicates that sinβ is negative in the third and fourth quadrants.We also need to find the values of β such that −360◦ ≤ β ≤ 360◦.
Using reduction formulae, we know that sin(180◦+β) = − sinβ and sin(360◦−β) =− sinβ
In the third quadrant:
β = 180◦ + 30◦
= 210◦
or β = −180◦ + 30◦
= −150◦
In the fourth quadrant:
β = 360◦ − 30◦
= 330◦
or β = 0◦ − 30◦
= −30◦
Notice: the reference angle (30◦) does not form part of the solution.
Step 3: Use a calculator to check that the solution satisfies the original equation
Step 4: Write the final answer
β = −150◦, −30◦, 210◦ or 330◦.
268 6.4. Trigonometric equations

Exercise 6 – 7: Solving trigonometric equations
1. Determine the values of α for α ∈ [0◦; 360◦] if:
a) 4 cosα = 2
b) sinα+ 3,65 = 3
c) tanα = 514
d) cosα+ 0,939 = 0
e) 5 sinα = 3
f) 12 tanα = −1,4
2. Determine the values of θ for θ ∈ [−360◦; 360◦] if:
a) sin θ = 0,6
b) cos θ + 34 = 0
c) 3 tan θ = 20
d) sin θ = cos 180◦
e) 2 cos θ = 45
Think you got it? Get this answer and more practice on our Intelligent Practice Service
1a. 22ZP 1b. 22ZQ 1c. 22ZR 1d. 22ZS 1e. 22ZT 1f. 22ZV2a. 22ZW 2b. 22ZX 2c. 22ZY 2d. 22ZZ 2e. 2322
www.everythingmaths.co.za m.everythingmaths.co.za
The general solution EMBHN
In the previous worked example, the solution was restricted to a certain interval. How-ever, the periodicity of the trigonometric functions means that there are an infinitenumber of positive and negative angles that satisfy an equation. If we do not restrictthe solution, then we need to determine the general solution to the equation. We knowthat the sine and cosine functions have a period of 360◦ and the tangent function hasa period of 180◦.
Method for finding the general solution:
1. Determine the reference angle (use a positive value).
2. Use the CAST diagram to determine where the function is positive or negative(depending on the given equation).
3. Find the angles in the interval [0◦; 360◦] that satisfy the equation and add multi-ples of the period to each answer.
4. Check answers using a calculator.
269Chapter 6. Trigonometry

Worked example 15: Finding the general solution
QUESTION
Determine the general solution for sin θ = 0,3 (correct to one decimal place).
SOLUTION
Step 1: Use a calculator to find the reference angle
sin θ = 0,3
∴ ref ∠ = sin−1 0,3
= 17,5◦
Step 2: Use CAST diagram to determine in which quadrants sin θ is positive
The CAST diagram indicates that sin θ is positive in the first and second quadrants.
Using reduction formulae, we know that sin(180◦ − θ) = sin θ.
In the first quadrant:
θ = 17,5◦
∴ θ = 17,5◦ + k . 360◦
In the second quadrant:
θ = 180◦ − 17,5◦
∴ θ = 162,5◦ + k . 360◦
where k ∈ Z.
Step 3: Check that the solution satisfies the original equation
We can select random values of k to check that the answers satisfy the original equa-tion.
Let k = 4:
θ = 17,5◦ + 4(360)◦
∴ θ = 1457,5◦
And sin 1457,5◦ = 0,3007 . . .
This solution is correct.
Similarly, if we let k = −2:
θ = 162,5◦ − 2(360)◦
∴ θ = −557,5◦
And sin(−557,5◦) = 0,3007 . . .
This solution is also correct.
Step 4: Write the final answer
θ = 17,5◦ + k . 360◦ or θ = 162,5◦ + k . 360◦.
270 6.4. Trigonometric equations

Worked example 16: Finding the general solution
QUESTION
Determine the general solution for cos 2θ = −0,6427 (give answers correct to onedecimal place).
SOLUTION
Step 1: Use a calculator to find the reference angle
ref ∠ = sin−1 0,6427
= 50,0◦
Step 2: Use CAST diagram to determine in which quadrants cos θ is negative
The CAST diagram shows that cos θ is negative in the second and third quadrants.
Therefore we use the reduction formulae cos(180◦−θ) = − cos θ and cos(180◦+θ) =− cos θ.
In the second quadrant:
2θ = 180◦ − 50◦ + k . 360◦
= 130◦ + k . 360◦
∴ θ = 65◦ + k . 180◦
In the third quadrant:
2θ = 180◦ + 50◦ + k . 360◦
= 230◦ + k . 360◦
∴ θ = 115◦ + k . 180◦
where k ∈ Z.
Remember: also divide the period (360◦) by the coefficient of θ.
Step 3: Check that the solution satisfies the original equation
We can select random values of k to check that the answers satisfy the original equa-tion.
Let k = 2:
θ = 65◦ + 2(180◦)
∴ θ = 425◦
And cos 2(425)◦ = −0,6427 . . .
This solution is correct.
271Chapter 6. Trigonometry
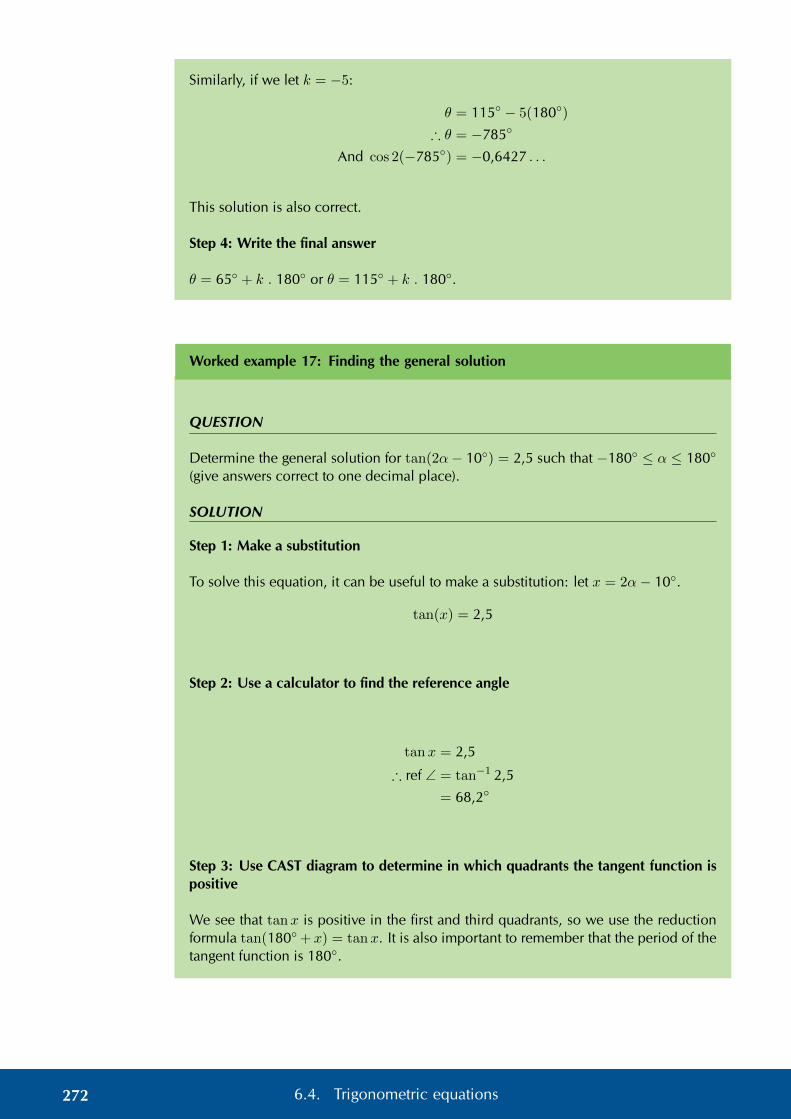
Similarly, if we let k = −5:
θ = 115◦ − 5(180◦)
∴ θ = −785◦
And cos 2(−785◦) = −0,6427 . . .
This solution is also correct.
Step 4: Write the final answer
θ = 65◦ + k . 180◦ or θ = 115◦ + k . 180◦.
Worked example 17: Finding the general solution
QUESTION
Determine the general solution for tan(2α− 10◦) = 2,5 such that −180◦ ≤ α ≤ 180◦
(give answers correct to one decimal place).
SOLUTION
Step 1: Make a substitution
To solve this equation, it can be useful to make a substitution: let x = 2α− 10◦.
tan(x) = 2,5
Step 2: Use a calculator to find the reference angle
tanx = 2,5
∴ ref ∠ = tan−1 2,5
= 68,2◦
Step 3: Use CAST diagram to determine in which quadrants the tangent function ispositive
We see that tanx is positive in the first and third quadrants, so we use the reductionformula tan(180◦+ x) = tanx. It is also important to remember that the period of thetangent function is 180◦.
272 6.4. Trigonometric equations

In the first quadrant:
x = 68,2◦ + k . 180◦
Substitute x = 2α− 10◦
2α− 10◦ = 68,2◦ + k . 180◦
2α = 78,2◦ + k . 180◦
∴ α = 39,1◦ + k . 90◦
In the third quadrant:
x = 180◦ + 68,2◦ + k . 180◦
= 248,2◦ + k . 180◦
Substitute x = 2α− 10◦
2α− 10◦ = 248,2◦ + k . 180◦
2α = 258,2◦ + k . 180◦
∴ α = 129,1◦ + k . 90◦
where k ∈ Z.
Remember: to divide the period (180◦) by the coefficient of α.
Step 4: Find the answers within the given interval
Substitute suitable values of k to determine the values of α that lie within the interval(−180◦ ≤ α ≤ 180◦).
I: α = 39,1◦ + k . 90◦ III: α = 129,1◦ + k . 90◦
k = 0 39,1◦ 129,1◦
k = 1 129,1◦ 219,1◦ (outside)
k = 2 219,1◦ (outside)
k = −1 −50,9◦ 39,1◦
k = −2 −140,9◦ −50,9◦
k = −3 −230,9◦ (outside) −140,9◦
k = −4 −230,9◦ (outside)
Notice how some of the values repeat. This is because of the periodic nature of thetangent function. Therefore we need only determine the solution:
α = 39,1◦ + k . 90◦
for k ∈ Z.
Step 5: Write the final answer
α = −140,9◦; −50,9◦; 39,1◦ or 129,1◦.
273Chapter 6. Trigonometry

Worked example 18: Finding the general solution using co-functions
QUESTION
Determine the general solution for sin(θ − 20◦) = cos 2θ.
SOLUTION
Step 1: Use co-functions to simplify the equation
sin(θ − 20◦) = cos 2θ
= sin(90◦ − 2θ)
∴ θ − 20◦ = 90◦ − 2θ + k . 360◦, k ∈ Z
3θ = 110◦ + k . 360◦
∴ θ = 36,7◦ + k . 120◦
Step 2: Use the CAST diagram to determine the correct quadrants
Since the original equation equates a sine and cosine function, we need to work in thequadrant where both functions are positive or in the quadrant where both functionsare negative so that the equation holds true. We therefore determine the solution usingthe first and third quadrants.
In the first quadrant: θ = 36,7◦ + k . 120◦.
In the third quadrant:
3θ = 180◦ + 110◦ + k . 360◦
= 290◦ + k . 360◦
∴ θ = 96,6◦ + k . 120◦
where k ∈ Z.
Step 3: Check that the solution satisfies the original equation
Step 4: Write the final answer
θ = 36,7◦ + k . 120◦ or θ = 96,6◦ + k . 120◦
274 6.4. Trigonometric equations
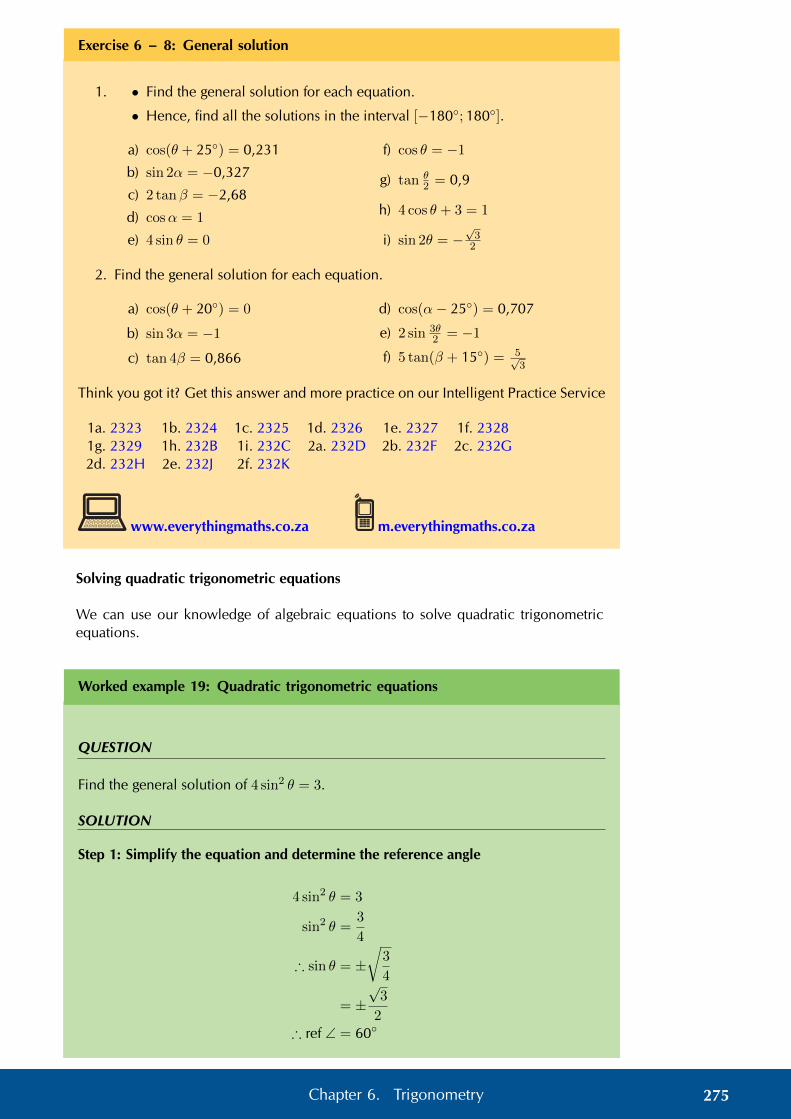
Exercise 6 – 8: General solution
1. • Find the general solution for each equation.
• Hence, find all the solutions in the interval [−180◦; 180◦].
a) cos(θ + 25◦) = 0,231
b) sin 2α = −0,327
c) 2 tanβ = −2,68
d) cosα = 1
e) 4 sin θ = 0
f) cos θ = −1
g) tan θ2 = 0,9
h) 4 cos θ + 3 = 1
i) sin 2θ = −√32
2. Find the general solution for each equation.
a) cos(θ + 20◦) = 0
b) sin 3α = −1
c) tan 4β = 0,866
d) cos(α− 25◦) = 0,707
e) 2 sin 3θ2 = −1
f) 5 tan(β + 15◦) = 5√3
Think you got it? Get this answer and more practice on our Intelligent Practice Service
1a. 2323 1b. 2324 1c. 2325 1d. 2326 1e. 2327 1f. 23281g. 2329 1h. 232B 1i. 232C 2a. 232D 2b. 232F 2c. 232G2d. 232H 2e. 232J 2f. 232K
www.everythingmaths.co.za m.everythingmaths.co.za
Solving quadratic trigonometric equations
We can use our knowledge of algebraic equations to solve quadratic trigonometricequations.
Worked example 19: Quadratic trigonometric equations
QUESTION
Find the general solution of 4 sin2 θ = 3.
SOLUTION
Step 1: Simplify the equation and determine the reference angle
4 sin2 θ = 3
sin2 θ =3
4
∴ sin θ = ±√
3
4
= ±√
3
2∴ ref ∠ = 60◦
275Chapter 6. Trigonometry

Step 2: Determine in which quadrants the sine function is positive and negative
The CAST diagram shows that sin θ is positive in the first and second quadrants andnegative in the third and fourth quadrants.
Positive in the first and second quadrants:
θ = 60◦ + k . 360◦
or θ = 180◦ − 60◦ + k . 360◦
= 120◦ + k . 360◦
Negative in the third and fourth quadrants:
θ = 180◦ + 60◦ + k . 360◦
= 240◦ + k . 360◦
or θ = 360◦ − 60◦ + k . 360◦
= 300◦ + k . 360◦
where k ∈ Z.
Step 3: Check that the solution satisfies the original equation
Step 4: Write the final answer
θ = 60◦ + k . 360◦ or 120◦ + k . 360◦ or 240◦ + k . 360◦ or 300◦ + k . 360◦
Worked example 20: Quadratic trigonometric equations
QUESTION
Find θ if 2 cos2 θ − cos θ − 1 = 0 for θ ∈ [−180◦; 180◦].
SOLUTION
Step 1: Factorise the equation
2 cos2 θ − cos θ − 1 = 0
(2 cos θ + 1)(cos θ − 1) = 0
∴ 2 cos θ + 1 = 0 or cos θ − 1 = 0
276 6.4. Trigonometric equations
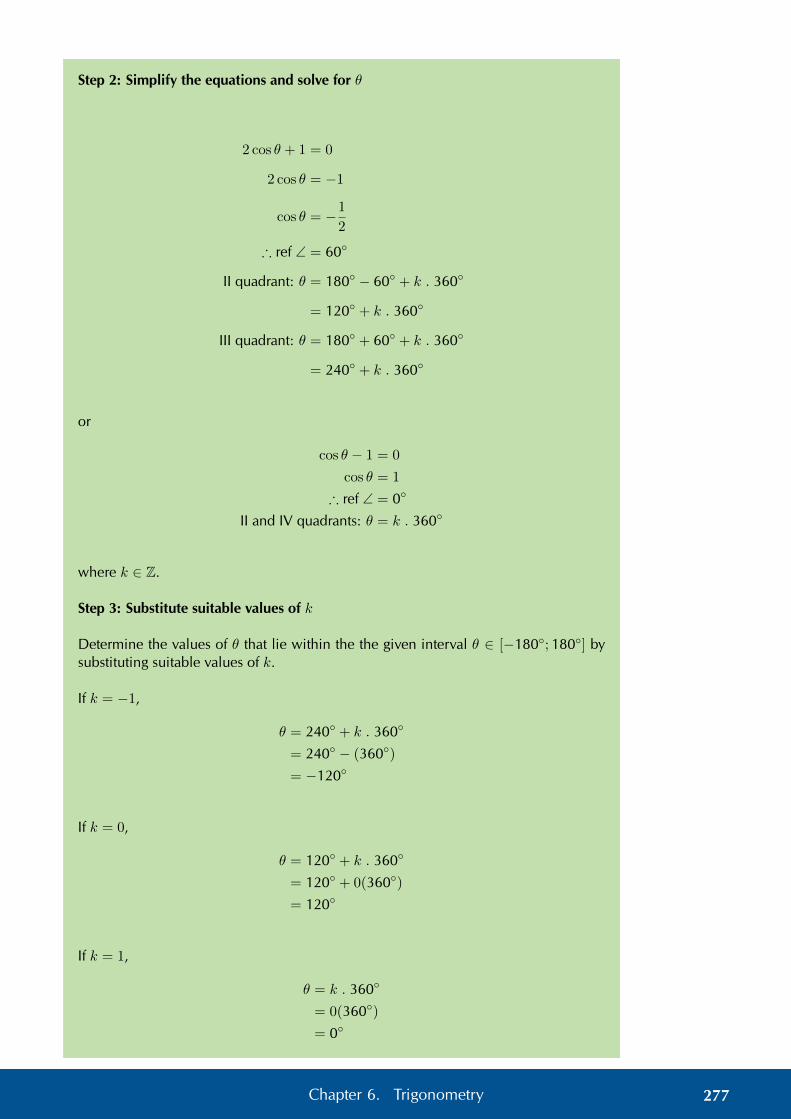
Step 2: Simplify the equations and solve for θ
2 cos θ + 1 = 0
2 cos θ = −1
cos θ = −1
2
∴ ref ∠ = 60◦
II quadrant: θ = 180◦ − 60◦ + k . 360◦
= 120◦ + k . 360◦
III quadrant: θ = 180◦ + 60◦ + k . 360◦
= 240◦ + k . 360◦
or
cos θ − 1 = 0
cos θ = 1
∴ ref ∠ = 0◦
II and IV quadrants: θ = k . 360◦
where k ∈ Z.
Step 3: Substitute suitable values of k
Determine the values of θ that lie within the the given interval θ ∈ [−180◦; 180◦] bysubstituting suitable values of k.
If k = −1,
θ = 240◦ + k . 360◦
= 240◦ − (360◦)
= −120◦
If k = 0,
θ = 120◦ + k . 360◦
= 120◦ + 0(360◦)
= 120◦
If k = 1,
θ = k . 360◦
= 0(360◦)
= 0◦
277Chapter 6. Trigonometry

Step 4: Alternative method: substitution
We can simplify the given equation by letting y = cos θ and then factorising as:
2y2 − y − 1 = 0
(2y + 1)(y − 1) = 0
∴ y = −1
2or y = 1
We substitute y = cos θ back into these two equations and solve for θ.
Step 5: Write the final answer
θ = −120◦; 0◦; 120◦
Worked example 21: Quadratic trigonometric equations
QUESTION
Find α if 2 sin2 α− sinα cosα = 0 for α ∈ [0◦; 360◦].
SOLUTION
Step 1: Factorise the equation by taking out a common factor
2 sin2 α− sinα cosα = 0
sinα(2 sinα− cosα) = 0
∴ sinα = 0 or 2 sinα− cosα = 0
Step 2: Simplify the equations and solve for α
sinα = 0
∴ ref ∠ = 0◦
∴ α = 0◦ + k . 360◦
or α = 180◦ + k . 360◦
and since 360◦ = 2× 180◦
we therefore have α = k . 180◦
278 6.4. Trigonometric equations

or
2 sinα− cosα = 0
2 sinα = cosα
To simplify further, we divide both sides of the equation by cosα.
2 sinα
cosα=
cosα
cosα(cosα 6= 0)
2 tanα = 1
tanα =1
2
∴ ref ∠ = 26,6◦
∴ α = 26,6◦ + k . 180◦
where k ∈ Z.
Step 3: Substitute suitable values of k
Determine the values of α that lie within the the given interval α ∈ [0◦; 360◦] bysubstituting suitable values of k.
If k = 0:
α = 0◦
or α = 26,6◦
If k = 1:
α = 180◦
or α = 26,6◦ + 180◦
= 206,6◦
If k = 2:α = 360◦
Step 4: Write the final answer
α = 0◦; 26,6◦; 180◦; 206,6◦; 360◦
279Chapter 6. Trigonometry

Exercise 6 – 9: Solving trigonometric equations
1. Find the general solution for each of the following equations:
a) cos 2θ = 0
b) sin(α+ 10◦) =√32
c) 2 cos θ2 −√
3 = 0
d) 12 tan(β − 30◦) = −1
e) 5 cos θ = tan 300◦
f) 3 sinα = −1,5
g) sin 2β = cos(β + 20◦)
h) 0,5 tan θ + 2,5 = 1,7
i) sin(3α− 10◦) = sin(α+ 32◦)
j) sin 2β = cos 2β
2. Find θ if sin2 θ + 12 sin θ = 0 for θ ∈ [0◦; 360◦].
3. Determine the general solution for each of the following:
a) 2 cos2 θ − 3 cos θ = 2
b) 3 tan2 θ + 2 tan θ = 0
c) cos2 α = 0,64
d) sin(4β + 35◦) = cos(10◦ − β)
e) sin(α+ 15◦) = 2 cos(α+ 15◦)
f) sin2 θ − 4 cos2 θ = 0
g)cos(2θ + 30◦)
2+ 0,38 = 0
4. Find β if 13 tanβ = cos 200◦ for β ∈ [−180◦; 180◦].
Think you got it? Get this answer and more practice on our Intelligent Practice Service
1a. 232M 1b. 232N 1c. 232P 1d. 232Q 1e. 232R 1f. 232S1g. 232T 1h. 232V 1i. 232W 1j. 232X 2. 232Y 3a. 232Z3b. 2332 3c. 2333 3d. 2334 3e. 2335 3f. 2336 3g. 2337
4. 2338
www.everythingmaths.co.za m.everythingmaths.co.za
6.5 Area, sine, and cosine rules EMBHP
There are three identities relating to the trigonometric functions that make workingwith triangles easier:
1. the area rule
2. the sine rule
3. the cosine rule
280 6.5. Area, sine, and cosine rules

The area rule EMBHQ
Investigation: The area rule
1. Consider 4ABC:
B
A
C
10
54◦
7
Complete the following:
a) Area 4ABC = 12 × . . .×AC
b) sin B = . . . and AC = . . .× . . .c) Therefore area 4ABC = . . .× . . .× . . .× . . .
2. Consider 4A′B′C ′:
B′
A′
C ′
10
54◦
7
Complete the following:
a) How is 4A′B′C ′ different from 4ABC?
b) Calculate area 4A′B′C ′.
3. Use your results to write a general formula for determining the area of 4PQR:
Q
P
R
r
p
q
281Chapter 6. Trigonometry
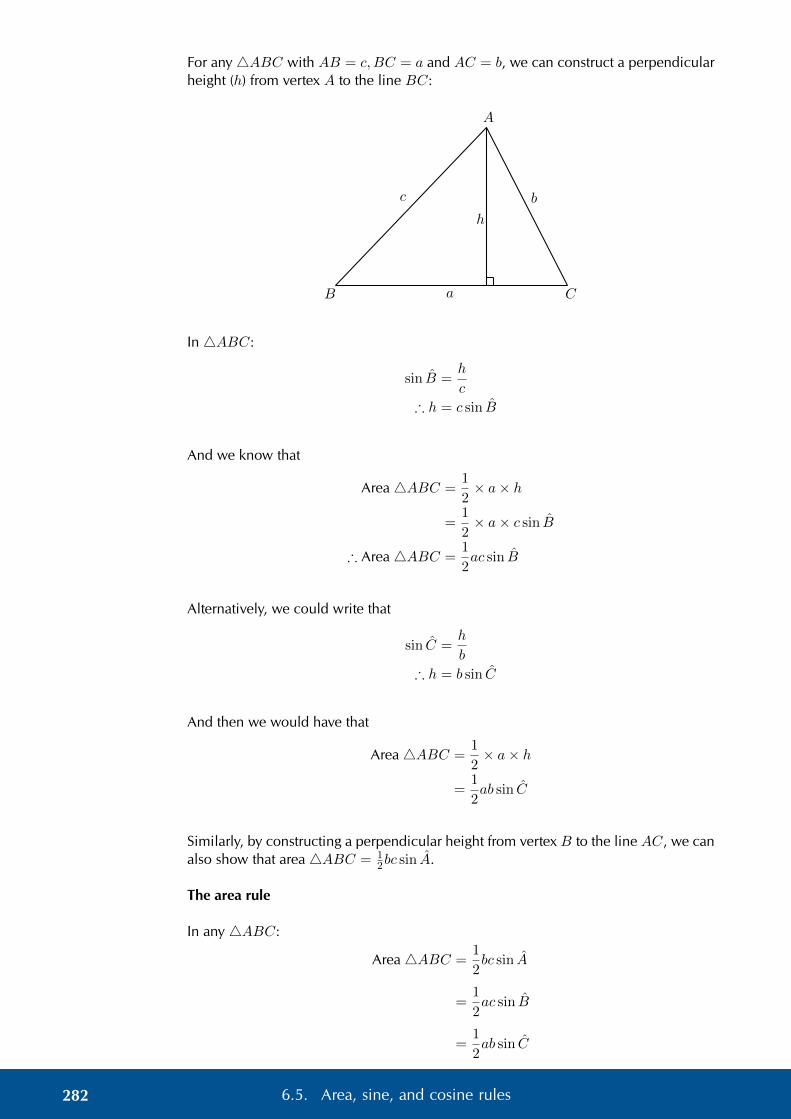
For any4ABC with AB = c,BC = a and AC = b, we can construct a perpendicularheight (h) from vertex A to the line BC:
B
A
C
c
a
b
h
In 4ABC:
sin B =h
c
∴ h = c sin B
And we know that
Area 4ABC =1
2× a× h
=1
2× a× c sin B
∴ Area 4ABC =1
2ac sin B
Alternatively, we could write that
sin C =h
b
∴ h = b sin C
And then we would have that
Area 4ABC =1
2× a× h
=1
2ab sin C
Similarly, by constructing a perpendicular height from vertex B to the line AC, we canalso show that area 4ABC = 1
2bc sin A.
The area rule
In any 4ABC:
Area 4ABC =1
2bc sin A
=1
2ac sin B
=1
2ab sin C
282 6.5. Area, sine, and cosine rules

Worked example 22: The area rule
QUESTION
Find the area of 4ABC (correct to two decimal places):
A
7
B C50◦
SOLUTION
Step 1: Use the given information to determine unknown angles and sides
AB = AC = 7 (given)
∴ B = C = 50◦ (∠s opp. equal sides)
And A = 180◦ − 50◦ − 50◦ (∠s sum of 4ABC)
∴ A = 80◦
Step 2: Use the area rule to calculate the area of 4ABC
Notice that we do not know the length of side a and must therefore choose the formof the area rule that does not include this side of the triangle.
In 4ABC:Area = 1
2bc sin A
= 12(7)(7) sin 80◦
= 24,13
Step 3: Write the final answer
Area of 4ABC = 24,13 square units.
283Chapter 6. Trigonometry

Worked example 23: The area rule
QUESTION
Show that the area of 4DEF = 12df sin E.
D
FEH
e
d
fh
12
SOLUTION
Step 1: Construct a perpendicular height h
Draw DH such that DH ⊥ EF and let DH = h, DEF = E1 and DEH = E2.
In 4DHE:
sin E2 =h
f
h = f sin(180◦ − E1) (∠s on str. line)
= f sin E1
Step 2: Use the area rule to calculate the area of 4DEF
In 4DEF :
Area =1
2d× h
=1
2df sin E1
284 6.5. Area, sine, and cosine rules

The area rule
In any 4PQR:
P
P
Q QR R
q
q
rr
p p
Area 4PQR =1
2qr sin P
=1
2pr sin Q
=1
2pq sin R
The area rule states that the area of any triangle is equal to half the product of thelengths of the two sides of the triangle multiplied by the sine of the angle included bythe two sides.
Exercise 6 – 10: The area rule
1. Draw a sketch and calculate the area of 4PQR given:
a) Q = 30◦; r = 10 and p = 7
b) R = 110◦; p = 8 and q = 9
2. Find the area of 4XY Z given XZ = 52 cm, XY = 29 cm and X = 58,9◦.
3. Determine the area of a parallelogram in which two adjacent sides are 10 cmand 13 cm and the angle between them is 55◦.
4. If the area of4ABC is 5000 m2 with a = 150 m and b = 70 m, what are the twopossible sizes of C?
Think you got it? Get this answer and more practice on our Intelligent Practice Service
1a. 2339 1b. 233B 2. 233C 3. 233D 4. 233F
www.everythingmaths.co.za m.everythingmaths.co.za
285Chapter 6. Trigonometry

The sine rule EMBHR
So far we have only applied the trigonometric ratios to right-angled triangles. We nowexpand the application of the trigonometric ratios to triangles that do not have a rightangle:
Investigation: The sine rule
In 4ABC, AC = 15, BC = 11 and A = 48◦. Find B.
A
C
B
b = 15
F
a = 11
48◦
1. Method 1: using the sine ratio
a) Draw a sketch of 4ABC.
b) Construct CF ⊥ AB.
c) In 4CBF :
CF
. . .= sin B
∴ CF = . . .× sin B
d) In 4CAF :
CF
15= . . .
∴ CF = 15× . . .
e) Therefore we have that:
CF = 15× . . .and CF = . . .× sin B
∴ 15× . . . = . . .× sin B
∴ sin B = . . . . . . . . .
∴ B = . . .
2. Method 2: using the area rule
286 6.5. Area, sine, and cosine rules

a) In 4ABC:
Area 4ABC =1
2AB ×AC × . . .
=1
2AB × . . .× . . .
b) And we also know that
Area 4ABC =1
2AB × . . .× sin B
c) We can equate these two equations and solve for B:
1
2AB × . . .× sin B =
1
2AB × . . .× . . .
∴ . . .× sin B = . . .× . . .∴ sin B = . . .× . . .
∴ B = . . .
3. Use your results to write a general formula for the sine rule given 4PQR:
P
Q R
qr
p
For any triangle ABC with AB = c,BC = a and AC = b, we can construct a perpen-dicular height (h) at F :
A
CB
b
Fa
h
c
Method 1: using the sine ratio
In 4ABF :
sin B =h
c
∴ h = c sin B
287Chapter 6. Trigonometry

In 4ACF :
sin C =h
b
∴ h = b sin C
We can equate the two equations
c sin B = b sin C
∴sin B
b=
sin C
c
orb
sin B=
c
sin C
Similarly, by constructing a perpendicular height from vertex B to the line AC, we canalso show that:
sin A
a=
sin C
c
ora
sin A=
c
sin C
Similarly, by constructing a perpendicular height from vertex B to the line AC, we canalso show that area 4ABC = 1
2bc sin A.
Method 2: using the area rule
In 4ABC:
Area 4ABC =1
2ac sin B
=1
2ab sin C
∴1
2ac sin B =
1
2ab sin C
c sin B = b sin C
sin B
b=
sin C
c
orb
sin B=
c
sin C
288 6.5. Area, sine, and cosine rules

The sine rule
In any 4ABC:
A
CB
b
a
c
sin A
a=
sin B
b=
sin C
c
a
sin A=
b
sin B=
c
sin C
See video: 233G at www.everythingmaths.co.za
Worked example 24: The sine rule
QUESTION
Given 4TRS with STR = 55◦, TR = 30 and RST = 40◦, determine RS, ST andTRS.
SOLUTION
Step 1: Draw a sketch
Let RS = t, ST = r and TR = s.
R
ST
55◦
30
40◦
Step 2: Find TRS using angles in a triangle
TRS +RST + STR = 180◦ (∠s sum of 4TRS)
∴ TRS = 180◦ − 40◦ − 55◦
= 85◦
289Chapter 6. Trigonometry

Step 3: Determine t and r using the sine rule
t
sin T=
s
sin S
t
sin 55◦=
30
sin 40◦
∴ t =30
sin 40◦× sin 55◦
= 38,2
r
sin R=
s
sin S
r
sin 85◦=
30
sin 40◦
∴ r =30
sin 40◦× sin 85◦
= 46,5
Worked example 25: The sine rule
QUESTION
Prove the sine rule for 4MNP with MS ⊥ NP .
M
PNS
n
m
ph
12
SOLUTION
Step 1: Use the sine ratio to express the angles in the triangle in terms of the lengthof the sides
In 4MSN :sin N2 = h
p
∴ h = p sin N2
and N2 = 180◦ − N1 ∠s on str. line
∴ h = p sin(180◦ − N1)
= p sin N1
290 6.5. Area, sine, and cosine rules

In 4MSP :
sin P =h
n
∴ h = n sin P
Step 2: Equate the two equations to derive the sine rule
p sin N1 = n sin P
∴sin N1
n=
sin P
p
orn
sin N1
=p
sin P
The ambiguous case
If two sides and an interior angle of a triangle are given, and the side opposite the givenangle is the shorter of the two sides, then we can draw two different triangles (4NMPand 4NMP ′), both having the given dimensions. We call this the ambiguous casebecause there are two ways of interpreting the given information and it is not certainwhich is the required solution.
M
P ′
p
N P
nn
Worked example 26: The ambiguous case
QUESTION
In 4ABC, AB = 82, BC = 65 and A = 50◦. Draw 4ABC and find C (correct toone decimal place).
SOLUTION
Step 1: Draw a sketch and identify the ambiguous case
We notice that for the given dimensions of 4ABC, the side BC opposite A is shorterthan AB. This means that we can draw two different triangles with the given dimen-sions.
A
B
C50
◦
6582
A′ C ′
B′
6582
50◦
291Chapter 6. Trigonometry

Step 2: Solve for unknown angle using the sine rule
In 4ABC:
sin A
BC=
sin C
AB
sin 50◦
65=
sin C
82
∴sin 50◦
65× 82 = sin C
∴ C = 75,1◦
In 4A′B′C ′:
We know that sin(180− C) = sin C, which means we can also have the solution
C ′ = 180◦ − 75,1◦
= 104,9◦
Both solutions are correct.
Worked example 27: Lighthouses
QUESTION
There is a coastline with two lighthouses, one on either side of a beach. The twolighthouses are 0,67 km apart and one is exactly due east of the other. The lighthousestell how close a boat is by taking bearings to the boat (a bearing is an angle measuredclockwise from north). These bearings are shown on the diagram below.
Calculate how far the boat is from each lighthouse.
A = 127◦
B = 255◦
C
SOLUTION
We see that the two lighthouses and the boat form a triangle. Since we know thedistance between the lighthouses and we have two angles we can use trigonometry
292 6.5. Area, sine, and cosine rules

to find the remaining two sides of the triangle, the distance of the boat from the twolighthouses.
bA b B
b
C
15◦37◦
128◦
0,67 km
We need to determine the lengths of the two sides AC and BC. We can use the sinerule to find the missing lengths.
BC
sin A=
AB
sin C
BC =AB . sin A
sin C
=(0,67 km) sin 37◦
sin 128◦
= 0,51 km
AC
sin B=
AB
sin C
AC =AB . sin B
sin C
=(0,67 km) sin 15◦
sin 128◦
= 0,22 km
Exercise 6 – 11: Sine rule
1. Find all the unknown sides and angles of the following triangles:
a) 4PQR in which Q = 64◦; R = 24◦ and r = 3
b) 4KLM in which K = 43◦; M = 50◦ and m = 1
c) 4ABC in which A = 32,7◦; C = 70,5◦ and a = 52,3
d) 4XY Z in which X = 56◦; Z = 40◦ and x = 50
2. In 4ABC, A = 116◦; C = 32◦ and AC = 23 m. Find the lengths of the sidesAB and BC.
3. In 4RST , R = 19◦; S = 30◦ and RT = 120 km. Find the length of the sideST .
4. In 4KMS, K = 20◦; M = 100◦ and s = 23 cm. Find the length of the side m.
293Chapter 6. Trigonometry

5. In 4ABD, B = 90◦, AB = 10 cm and ADB = 40◦. In 4BCD, C = 106◦ andCDB = 15◦. Determine BC.
A
B D
C10
106◦
15◦40◦
6. In4ABC, A = 33◦, AC = 21 mm and AB = 17 mm. Can you determine BC?
Think you got it? Get this answer and more practice on our Intelligent Practice Service
1a. 233H 1b. 233J 1c. 233K 1d. 233M 2. 233N 3. 233P4. 233Q 5. 233R 6. 233S
www.everythingmaths.co.za m.everythingmaths.co.za
The cosine rule EMBHS
Investigation: The cosine rule
If a triangle is given with two sides and the included angle known, then we can notsolve for the remaining unknown sides and angles using the sine rule. We thereforeinvestigate the cosine rule:
In 4ABC,AB = 21, AC = 17 and A = 33◦. Find B.
A
C
BH
21
c
17
33◦
1. Determine CB:
a) Construct CH ⊥ AB.
b) Let AH = c and therefore HB = . . .
294 6.5. Area, sine, and cosine rules

c) Applying the theorem of Pythagoras in the right-angled triangles:In4CHB:
CB2 = BH2 + CH2
= (. . .)2 + CH2
= 212 − (2)(21)c+ c2 + CH2 . . . . . . (1)
In 4CHA:
CA2 = c2 + CH2
172 = c2 + CH2 . . . . . . (2)
Substitute equation (2) into equation (1):
CB2 = 212 − (2)(21)c+ 172
Now c is the only remaining unknown. In 4CHA:
c
17= cos 33◦
∴ c = 17 cos 33◦
Therefore we have that
CB2 = 212 − (2)(21)c+ 172
= 212 − (2)(21)(17 cos 33◦) + 172
= 212 + 172 − (2)(21)(17) cos 33◦
= 131,189 . . .
∴ CB = 11,5
2. Use your results to write a general formula for the cosine rule given 4PQR:
P
Q R
qr
p
The cosine rule relates the length of a side of a triangle to the angle opposite it and thelengths of the other two sides.
295Chapter 6. Trigonometry

Consider 4ABC with CD ⊥ AB:
b
D
b
Ab
B
bC
hab
c
c− dd
In 4DCB: a2 = (c− d)2 + h2 from the theorem of Pythagoras.
In 4ACD: b2 = d2 + h2 from the theorem of Pythagoras.
Since h2 is common to both equations we can write:
a2 = (c− d)2 + h2
∴ h2 = a2 − (c− d)2
And b2 = d2 + h2
∴ h2 = b2 − d2
∴ b2 − d2 = a2 − (c− d)2
a2 = b2 + (c2 − 2cd+ d2)− d2
= b2 + c2 − 2cd
In order to eliminate d we look at4ACD, where we have: cos A = db . So, d = b cos A.
Substituting back we get: a2 = b2 + c2 − 2bc cos A.
The cosine rule
In any 4ABC:
A
A
B BC C
b
b
cc
a a
a2 = b2 + c2 − 2bc cos A
b2 = a2 + c2 − 2ac cos B
c2 = a2 + b2 − 2ab cos C
See video: 233T at www.everythingmaths.co.za
296 6.5. Area, sine, and cosine rules

Worked example 28: The cosine rule
QUESTION
Determine the length of QR.P
RQ
13 cm4 cm
70◦
SOLUTION
Step 1: Use the cosine rule to solve for the unknown side
QR2 = PR2 +QP 2 − 2(PR)(QP ) cos P
= 42 + 132 − 2(4)(13) cos 70◦
= 149,42 . . .
∴ QR = 12,2
Step 2: Write the final answer
QR = 12,2 cm
Worked example 29: The cosine rule
QUESTION
Determine A.
5
7
8
A
B C
SOLUTION
Applying the cosine rule:
a2 = b2 + c2 − 2bc cos A
∴ cos A =b2 + c2 − a2
2bc
=82 + 52 − 72
2 . 8 . 5= 0,5
∴ A = 60◦
297Chapter 6. Trigonometry

It is very important:
• not to round off before the final answer as this will affect accuracy;
• to take the square root;
• to remember to give units where applicable.
How to determine which rule to use:
1. Area rule:
• if no perpendicular height is given
2. Sine rule:
• if no right angle is given
• if two sides and an angle are given (not the included angle)
• if two angles and a side are given
3. Cosine rule:
• if no right angle is given
• if two sides and the included angle are given
• if three sides are given
Exercise 6 – 12: The cosine rule
1. Solve the following triangles (that is, find all unknown sides and angles):
a) 4ABC in which A = 70◦; b = 4 and c = 9
b) 4RST in which RS = 14; ST = 26 and RT = 16
c) 4KLM in which KL = 5; LM = 10 and KM = 7
d) 4JHK in which H = 130◦; JH = 13 and HK = 8
e) 4DEF in which d = 4; e = 5 and f = 7
2. Find the length of the third side of the 4XY Z where:
a) X = 71,4◦; y = 3,42 km and z = 4,03 km
b) x = 103,2 cm; Y = 20,8◦ and z = 44,59 cm
3. Determine the largest angle in:
a) 4JHK in which JH = 6; HK = 4 and JK = 3
b) 4PQR where p = 50; q = 70 and r = 60
Think you got it? Get this answer and more practice on our Intelligent Practice Service
1a. 233V 1b. 233W 1c. 233X 1d. 233Y 1e. 233Z 2a. 23422b. 2343 3a. 2344 3b. 2345
www.everythingmaths.co.za m.everythingmaths.co.za
298 6.5. Area, sine, and cosine rules

See video: 2346 at www.everythingmaths.co.za
Exercise 6 – 13: Area, sine and cosine rule
1. Q is a ship at a point 10 km due south of another ship P . R is a lighthouse onthe coast such that P = Q = 50◦.
10 km
P
Q
R
50◦
50◦
Determine:
a) the distance QR
b) the shortest distance from the lighthouse to the line joining the two ships(PQ).
2. WXY Z is a trapezium, WX ‖ Y Z with WX = 3 m; Y Z = 1,5 m; Z = 120◦
and W = 30◦.
Determine the distances XZ and XY .
1,5 m
3 m
30◦
120◦
W
XY
Z
3. On a flight from Johannesburg to Cape Town, the pilot discovers that he hasbeen flying 3◦ off course. At this point the plane is 500 km from Johannesburg.The direct distance between Cape Town and Johannesburg airports is 1552 km.Determine, to the nearest km:
a) The distance the plane has to travel to get to Cape Town and hence theextra distance that the plane has had to travel due to the pilot’s error.
b) The correction, to one hundredth of a degree, to the plane’s heading (ordirection).
4. ABCD is a trapezium (meaning that AB ‖ CD). AB = x; BAD = a; BCD = band BDC = c.
Find an expression for the length of CD in terms of x, a, b and c.
A B
CD
a
bc
x
299Chapter 6. Trigonometry

5. A surveyor is trying to determine the distance between pointsX and Z. Howeverthe distance cannot be determined directly as a ridge lies between the two points.From a point Y which is equidistant fromX and Z, he measures the angleXY Z.
Y
X Z
x θ
a) If XY = x and XY Z = θ, show that XZ = x√
2(1− cos θ).
b) Calculate XZ (to the nearest kilometre) if x = 240 km and θ = 132◦.
6. Find the area of WXY Z (to two decimal places):
W
X
YZ
120◦ 3
4
3,5
7. Find the area of the shaded triangle in terms of x, α, β, θ and φ:
A B
CDE
x
αβθ
φ
Think you got it? Get this answer and more practice on our Intelligent Practice Service
1. 2347 2. 2348 3. 2349 4. 234B 5. 234C 6. 234D7. 234F
www.everythingmaths.co.za m.everythingmaths.co.za
300 6.5. Area, sine, and cosine rules

6.6 Summary EMBHT
See presentation: 234G at www.everythingmaths.co.za
square identity quotient identity
cos2 θ + sin2 θ = 1 tan θ =sin θ
cos θ
A
A
B BC C
b
b
cc
a a
negative angles periodicity identities co-function identities
sin(−θ) = − sin θ sin(θ ± 360◦) = sin θ sin(90◦ − θ) = cos θ
cos(−θ) = cos θ cos(θ ± 360◦) = cos θ cos(90◦ − θ) = sin θ
sine rule area rule cosine rule
sinAa = sinB
b = sinCc area 4ABC = 1
2bc sinA a2 = b2 + c2 − 2bc cosA
asinA = b
sinB = csinC area 4ABC = 1
2ac sinB b2 = a2 + c2 − 2ac cosB
area 4ABC = 12ab sinC c2 = a2 + b2 − 2ab cosC
Quadrant IQuadrant II
Quadrant III Quadrant IV
Aall
Ssin θ
Ttan θ
Ccos θ
x
y
0◦
360◦
90◦
180◦
270◦
0
General solution:
301Chapter 6. Trigonometry

1.
If sin θ = x
θ = sin−1 x+ k . 360◦
or θ =(180◦ − sin−1 x
)+ k . 360◦
2.
If cos θ = x
θ = cos−1 x+ k . 360◦
or θ =(360◦ − cos−1 x
)+ k . 360◦
3.
If tan θ = x
θ = tan−1 x+ k . 180◦
for k ∈ Z.
How to determine which rule to use:
1. Area rule:
• no perpendicular height is given
2. Sine rule:
• no right angle is given
• two sides and an angle are given (not the included angle)
• two angles and a side are given
3. Cosine rule:
• no right angle is given
• two sides and the included angle angle are given
• three sides are given
Exercise 6 – 14: End of chapter exercises
1. Write the following as a single trigonometric ratio:
cos(90◦ −A) sin 20◦
sin(180◦ −A) cos 70◦+ cos(180◦ +A) sin(90◦ +A)
2. Determine the value of the following expression without using a calculator:
sin 240◦ cos 210◦ − tan2 225◦ cos 300◦ cos 180◦
302 6.6. Summary

3. Simplify:sin(180◦ + θ) sin(θ + 360◦)
sin(−θ) tan(θ − 360◦)
4. Without the use of a calculator, evaluate:
3 sin 55◦ sin2 325◦
cos(−145◦)− 3 cos 395◦ sin 125◦
5. Prove the following identities:
a)1
(cosx− 1)(cosx+ 1)=
−1
tan2 x cos2 x
b) (1− tanα) cosα = sin(90 + α) + cos(90 + α)
6. a) Prove: tan y +1
tan y=
1
cos2 y tan y
b) For which values of y ∈ [0◦; 360◦] is the identity above undefined?
7. a) Simplify:sin(180◦ + θ) tan(360◦ − θ)
sin(−θ) tan(180◦ + θ)
b) Hence, solve the equation
sin(180◦ + θ) tan(360◦ − θ)sin(−θ) tan(180◦ + θ)
= tan θ
for θ ∈ [0◦; 360◦].
8. Given 12 tan θ = 5 and θ > 90◦.
a) Draw a sketch.
b) Determine without using a calculator sin θ and cos(180◦ + θ).
c) Use a calculator to find θ (correct to two decimal places).
9.
θ
P (a; b)
2
x
y
O
b
In the figure, P is a point on the Cartesian plane such that OP = 2 units andθ = 300◦. Without the use of a calculator, determine:
a) the values of a and b
b) the value of sin(180◦ − θ)
10. Solve for x with x ∈ [−180◦; 180◦] (correct to one decimal place):
a) 2 sin x2 = 0,86
303Chapter 6. Trigonometry

b) tan(x+ 10◦) = cos 202,6◦
c) cos2 x− 4 sin2 x = 0
11. Find the general solution for the following equations:
a) 12 sin(x− 25◦) = 0,25
b) sin2 x+ 2 cosx = −2
12. Given the equation: sin 2α = 0,84
a) Find the general solution of the equation.
b) Illustrate how this equation could be solved graphically for α ∈ [0◦; 360◦].
c) Write down the solutions for sin 2α = 0,84 for α ∈ [0◦; 360◦].
13.
A
TG
N
H
n
α
β
A is the highest point of a vertical tower AT . At point N on the tower, n metresfrom the top of the tower, a bird has made its nest. The angle of inclination fromG to point A is α and the angle of inclination from G to point N is β.
a) Express AGN in terms of α and β.
b) Express A in terms of α and/or β.
c) Show that the height of the nest from the ground (H) can be determined bythe formula
H =n cosα sinβ
sin(α− β)
d) Calculate the height of the nest H if n = 10 m, α = 68◦ and β = 40◦ (giveyour answer correct to the nearest metre).
304 6.6. Summary

14.
A
D
B
C11
8
5
Mr. Collins wants to pave his trapezium-shaped backyard, ABCD. AB ‖ DCand B = 90◦. DC = 11 m, AB = 8 m and BC = 5 m.
a) Calculate the length of the diagonal AC.
b) Calculate the length of the side AD.
c) Calculate the area of the patio using geometry.
d) Calculate the area of the patio using trigonometry.
15.
A
CB
2t
F
tn
n 2n
α
In 4ABC, AC = 2A, AF = BF , AFB = α and FC = 2AF . Prove thatcosα = 1
4 .
Think you got it? Get this answer and more practice on our Intelligent Practice Service
1. 234H 2. 234J 3. 234K 4. 234M 5a. 234N 5b. 234P6. 234Q 7. 234R 8. 234S 9. 234T 10a. 234V 10b. 234W
10c. 234X 11a. 234Y 11b. 234Z 12. 2352 13. 2353 14. 235415. 2355
www.everythingmaths.co.za m.everythingmaths.co.za
305Chapter 6. Trigonometry

CHAPTER 7
Measurement
7.1 Area of a polygon 308
7.2 Right prisms and cylinders 311
7.3 Right pyramids, right cones and spheres 318
7.4 Multiplying a dimension by a constant factor 322
7.5 Summary 326

7 Measurement
This chapter is a revision of perimeters and areas of two dimensional objects andvolumes of three dimensional objects. We also examine different combinations ofgeometric objects and calculate areas and volumes in a variety of real-life contexts.
See video: 2356 at www.everythingmaths.co.za
7.1 Area of a polygon EMBHV
Squares
s
Area = s2
Rectangle h
b
Area = b× h
Triangle h
b
Area = 12b× h
See video: 2357 at www.everythingmaths.co.za
Trapezium h
b
a
Area = 12 (a+ b)× h
Parallelogram h
b
Area = b× h
Circle br Area = πr2
(Circumference = 2πr)
See video: 2358 at www.everythingmaths.co.za
308 7.1. Area of a polygon

Worked example 1: Finding the area of a polygon
QUESTION
ABCD is a parallelogram with DC = 15 cm, h = 8 cm and BF = 9 cm.
A B
CD
H9 cm
15 cm
h
F
Calculate:
1. the area of ABCD
2. the perimeter of ABCD
SOLUTION
Step 1: Determine the area
The area of a parallelogram ABCD = base × height:
Area = 15× 8
= 120 cm2
Step 2: Determine the perimeter
The perimeter of a parallelogram ABCD = 2DC + 2BC.
To find the length of BC, we use AF ⊥ BC and the theorem of Pythagoras.
In 4ABF : AF 2 = AB2 −BF 2
= 152 − 92
= 144
∴ AF = 12 cm
AreaABCD = BC ×AF120 = BC × 12
∴ BC = 10 cm
∴ PerimeterABCD = 2(15) + 2(10)
= 50 cm
309Chapter 7. Measurement

Exercise 7 – 1: Area of a polygon
1. Vuyo and Banele are having a competition to see who can build the best kiteusing balsa wood (a lightweight wood) and paper. Vuyo decides to make his kitewith one diagonal 1 m long and the other diagonal 60 cm long. The intersectionof the two diagonals cuts the longer diagonal in the ratio 1 : 3.
Banele also uses diagonals of length 60 cm and 1 m, but he designs his kite tobe rhombus-shaped.
a) Draw a sketch of Vuyo’s kite and write down all the known measurements.
b) Determine how much balsa wood Vuyo will need to build the outside frameof the kite (give answer correct to the nearest cm).
c) Calculate how much paper he will need to cover the frame of the kite.
d) Draw a sketch of Banele’s kite and write down all the known measure-ments.
e) Determine how much wood and paper Banele will need for his kite.
f) Compare the two designs and comment on the similarities and differences.Which do you think is the better design? Motivate your answer.
2. O is the centre of the bigger semi-circle with a radius of 10 units. Two smallersemi-circles are inscribed into the bigger one, as shown on the diagram. Calcu-late the following (in terms of π):
Ob b
a) The area of the shaded figure.
b) The perimeter enclosing the shaded area.
3. Karen’s engineering textbook is 30 cm long and 20 cm wide. She notices thatthe dimensions of her desk are in the same proportion as the dimensions of hertextbook.
a) If the desk is 90 cm wide, calculate the area of the top of the desk.
b) Karen uses some cardboard to cover each corner of her desk with an isosce-les triangle, as shown in the diagram:
150 mm
150 mm
desk
Calculate the new perimeter and area of the visible part of the top of herdesk.
310 7.1. Area of a polygon
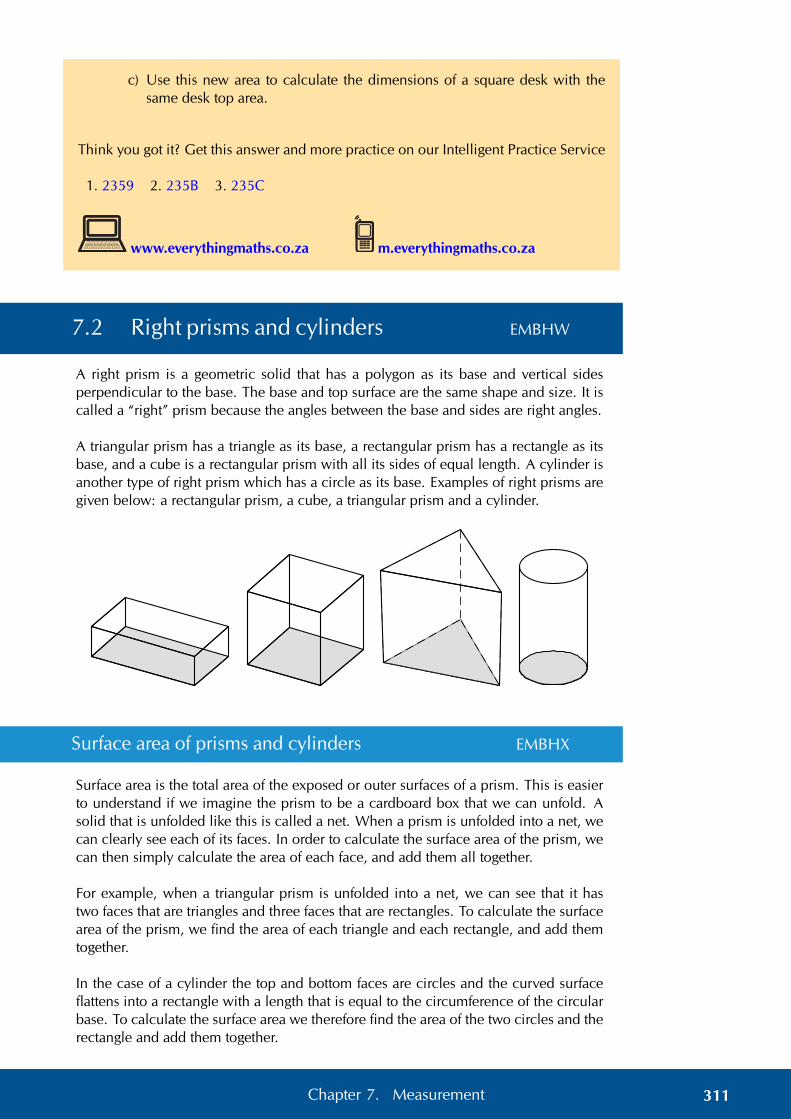
c) Use this new area to calculate the dimensions of a square desk with thesame desk top area.
Think you got it? Get this answer and more practice on our Intelligent Practice Service
1. 2359 2. 235B 3. 235C
www.everythingmaths.co.za m.everythingmaths.co.za
7.2 Right prisms and cylinders EMBHW
A right prism is a geometric solid that has a polygon as its base and vertical sidesperpendicular to the base. The base and top surface are the same shape and size. It iscalled a “right” prism because the angles between the base and sides are right angles.
A triangular prism has a triangle as its base, a rectangular prism has a rectangle as itsbase, and a cube is a rectangular prism with all its sides of equal length. A cylinder isanother type of right prism which has a circle as its base. Examples of right prisms aregiven below: a rectangular prism, a cube, a triangular prism and a cylinder.
Surface area of prisms and cylinders EMBHX
Surface area is the total area of the exposed or outer surfaces of a prism. This is easierto understand if we imagine the prism to be a cardboard box that we can unfold. Asolid that is unfolded like this is called a net. When a prism is unfolded into a net, wecan clearly see each of its faces. In order to calculate the surface area of the prism, wecan then simply calculate the area of each face, and add them all together.
For example, when a triangular prism is unfolded into a net, we can see that it hastwo faces that are triangles and three faces that are rectangles. To calculate the surfacearea of the prism, we find the area of each triangle and each rectangle, and add themtogether.
In the case of a cylinder the top and bottom faces are circles and the curved surfaceflattens into a rectangle with a length that is equal to the circumference of the circularbase. To calculate the surface area we therefore find the area of the two circles and therectangle and add them together.
311Chapter 7. Measurement

Below are examples of right prisms that have been unfolded into nets. A rectangularprism unfolded into a net is made up of six rectangles.
A cube unfolded into a net is made up of six identical squares.
A triangular prism unfolded into a net is made up of two triangles and three rectangles.The sum of the lengths of the rectangles is equal to the perimeter of the triangles.
A cylinder unfolded into a net is made up of two identical circles and a rectangle withlength equal to the circumference of the circles.
312 7.2. Right prisms and cylinders

Worked example 2: Calculating surface area
QUESTION
A box of chocolates has the following dimensions:
length = 25 cm
width = 20 cm
height = 4 cm
25 cm
20 cm
4 cm
And a cylindrical tin of biscuits has the following dimensions:
diameter = 20 cm
height = 20 cm
b20 cm
20 cm
1. Calculate the area of the wrapping paper needed to cover the entire box (assumeno overlapping at the corners).
2. Determine if this same sheet of wrapping paper would be enough to cover thetin of biscuits.
SOLUTION
Step 1: Determine the area of the rectangular box
Surface area = 2× (25× 20) + 2× (20× 4) + 2× (25× 4)
= 1360 cm2
313Chapter 7. Measurement

Step 2: Determine the area of the cylindrical tin
The radius of the cylinder = 202 = 10 cm.
Surface area = 2× π(10)2 + 2π(10)(20)
= 1885 cm2
Step 3: Write the final answer
No, the area of the sheet of wrapping paper used to cover the box is not big enough tocover the tin.
Exercise 7 – 2: Calculating surface area
1. A popular chocolate container is an equilateral right triangular prism with sidesof 34 mm. The box is 170 mm long. Calculate the surface area of the box (to thenearest square centimetre).
34m
m
34 mm
34
mm
170 mm
2. Gordon buys a cylindrical water tank to catch rain water off his roof. He discov-ers a full 2 ` tin of green paint in his garage and decides to paint the tank (not thebase). If he uses 250 ml to cover 1 m2, will he have enough green paint to coverthe tank with one layer of paint?
Dimensions of the tank:
diameter = 1,1 m
height = 1,4 m
b1,1 m
1,4 m
Think you got it? Get this answer and more practice on our Intelligent Practice Service
1. 235D 2. 235F
www.everythingmaths.co.za m.everythingmaths.co.za
314 7.2. Right prisms and cylinders
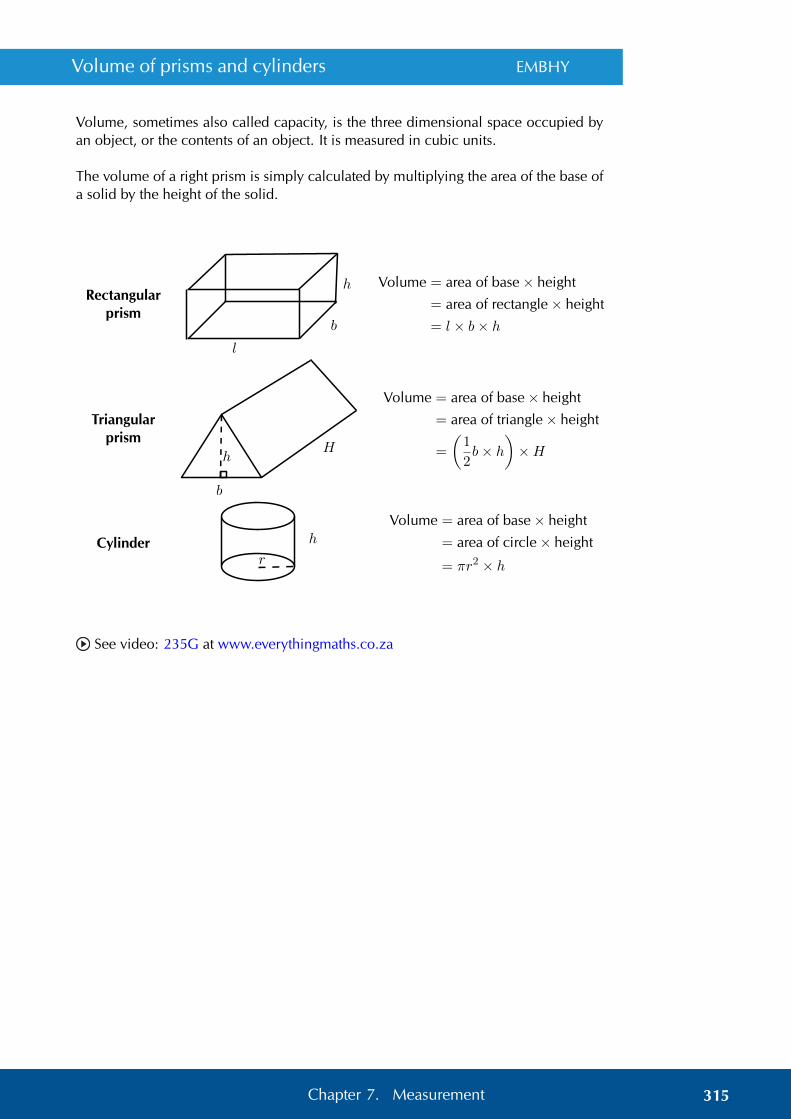
Volume of prisms and cylinders EMBHY
Volume, sometimes also called capacity, is the three dimensional space occupied byan object, or the contents of an object. It is measured in cubic units.
The volume of a right prism is simply calculated by multiplying the area of the base ofa solid by the height of the solid.
Rectangularprism
l
b
h Volume = area of base× height
= area of rectangle× height
= l × b× h
Triangularprism
H
b
h
Volume = area of base× height
= area of triangle× height
=
(1
2b× h
)×H
Cylinder h
r
Volume = area of base× height
= area of circle× height
= πr2 × h
See video: 235G at www.everythingmaths.co.za
315Chapter 7. Measurement

Worked example 3: Calculating volume
QUESTION
A rectangular glass vase with dimensions 28 cm × 18 cm × 8 cm is used for flowerarrangements. A florist uses a platic cylindrical jug to pour water into the glass vase.The jug has a diameter of 142 mm and a height of 28 cm.
28 cm
18 cm
8 cm
142m
m
28cm
jug
vase
1. Will the plastic jug hold 5 ` of water?
2. Will a full jug of water be enough to fill the glass vase?
SOLUTION
Step 1: Determine the volume of the plastic jug
The diameter of the jug is 142 mm, therefore the radius = 1422×10 = 7,1 cm.
Volume of a cylinder = area of the base × height
Volume of the jug = πr2 × h= π × (7,1)2 × 28
= 4434 cm3
And 1000 cm3 = 1 `
∴ Volume of the jug =4434
1000= 4,434 `
No, the capacity of the jug is not enough to hold 5 ` of water.
316 7.2. Right prisms and cylinders

Step 2: Determine the volume of the glass vase
Volume of a rectangular prism = area of the base × height
Volume of the vase = l × b× h= 28× 18× 8
= 4032 cm3
∴ Volume of the vase =4032
1000= 4,032 `
Yes, the volume of the jug is greater than the volume of the vase.
Exercise 7 – 3: Calculating volume
1. The roof of Phumza’s house is the shape of a right-angled trapezium. A cylindri-cal water tank is positioned next to the house so that the rain on the roof runsinto the tank. The diameter of the tank is 140 cm and the height is 2,2 m.
10 m
8 m
7,5 m
2,2 m
140 cm
a) Determine the area of the roof.
b) Determine how many litres of water the tank can hold.
2. The length of a side of a hexagonal sweet tin is 8 cm and its height is equal tohalf of the side length.
A B
C
DE
F
8 cm
h
a) Show that the interior angles are equal to 120◦.
317Chapter 7. Measurement

b) Determine the length of the line AE.
c) Calculate the volume of the tin.
Think you got it? Get this answer and more practice on our Intelligent Practice Service
1. 235H 2. 235J
www.everythingmaths.co.za m.everythingmaths.co.za
7.3 Right pyramids, right cones and spheres EMBHZ
A pyramid is a geometric solid that has a polygon as its base and sides that convergeat a point called the apex. In other words the sides are not perpendicular to the base.
b
The triangular pyramid and square pyramid take their names from the shape of theirbase. We call a pyramid a “right pyramid” if the line between the apex and the centreof the base is perpendicular to the base. Cones are similar to pyramids except thattheir bases are circles instead of polygons. Spheres are solids that are perfectly roundand look the same from any direction.
Surface area of pyramids, cones and spheres EMBJ2
Squarepyramid
hs
b
H Surface area = area of base +area of triangular sides
= b2 + 4(12bhs
)= b (b+ 2hs)
318 7.3. Right pyramids, right cones and spheres

Triangularpyramid
hs
b
HSurface area = area of base +
area of triangular sides=(12b× hb
)+ 3
(12b× hs
)= 1
2b (hb + 3hs)
Right cone
h
r
HSurface area = area of base +
area of walls= πr2 + 1
2 × 2πrh= πr (r + h)
Sphere b
rSurface area = 4πr2
Volume of pyramids, cones and spheres EMBJ3
Squarepyramid
b
H Volume = 13 × area of base ×height of pyramid
= 13 × b
2 ×H
Triangularpyramid
bh
H Volume = 13 × area of base ×height of pyramid
= 13 ×
12bh×H
319Chapter 7. Measurement

Right cone
r
HVolume = 1
3 × area of base ×height of cone
= 13 × πr
2 ×H
Sphere b
rVolume = 4
3πr3
See video: 235K at www.everythingmaths.co.za
Worked example 4: Finding surface area and volume
QUESTION
The Southern African Large Telescope (SALT) is housed in a cylindrical building witha domed roof in the shape of a hemisphere. The height of the building wall is 17 mand the diameter is 26 m.
17 m
26 m
1. Calculate the total surface area of the building.
2. Calculate the total volume of the building.
320 7.3. Right pyramids, right cones and spheres

SOLUTION
Step 1: Calculate the total surface area
Total surface area = area of the dome + area of the cylinder
Surface area =
[1
2(4πr2)
]+ [2πr × h]
=1
2(4π)(13)2 + 2π(13)(17)
= 2450 m2
Step 2: Calculate the total volume
Total volume = volume of the dome + volume of the cylinder
Volume =
[1
2×(
4
3πr3)]
+[πr2h
]=
2
3π(13)3 + π(11)2(13)
= 9543 m3
Exercise 7 – 4: Finding surface area and volume
1. An ice-cream cone has a diameter of 52,4 mm and a total height of 146 mm.
52,4 mm
146 mm
a) Calculate the surface area of the ice-cream and the cone.
b) Calculate the total volume of the ice-cream and the cone.
c) How many ice-cream cones can be made from a 5 ` tub of ice-cream (as-sume the cone is completely filled with ice-cream)?
321Chapter 7. Measurement

d) Consider the net of the cone given below. R is the length from the tip ofthe cone to its perimeter, P .
P
R
b
M
i. Determine the value of R.ii. Calculate the length of arc P .
iii. Determine the length of arc M .
Think you got it? Get this answer and more practice on our Intelligent Practice Service
1. 235M
www.everythingmaths.co.za m.everythingmaths.co.za
7.4 Multiplying a dimension by a constant factor EMBJ4
When one or more of the dimensions of a prism or cylinder is multiplied by a constant,the surface area and volume will change. The new surface area and volume can becalculated by using the formulae from the preceding section.
It is important to see a relationship between the change in dimensions and the resultingchange in surface area and volume. These relationships make it simpler to calculatethe new volume or surface area of an object when its dimensions are scaled up ordown.
Consider a rectangular prism of dimensions l, b and h. Below we multiply one, twoand three of its dimensions by a constant factor of 5 and calculate the new volume andsurface area.
322 7.4. Multiplying a dimension by a constant factor
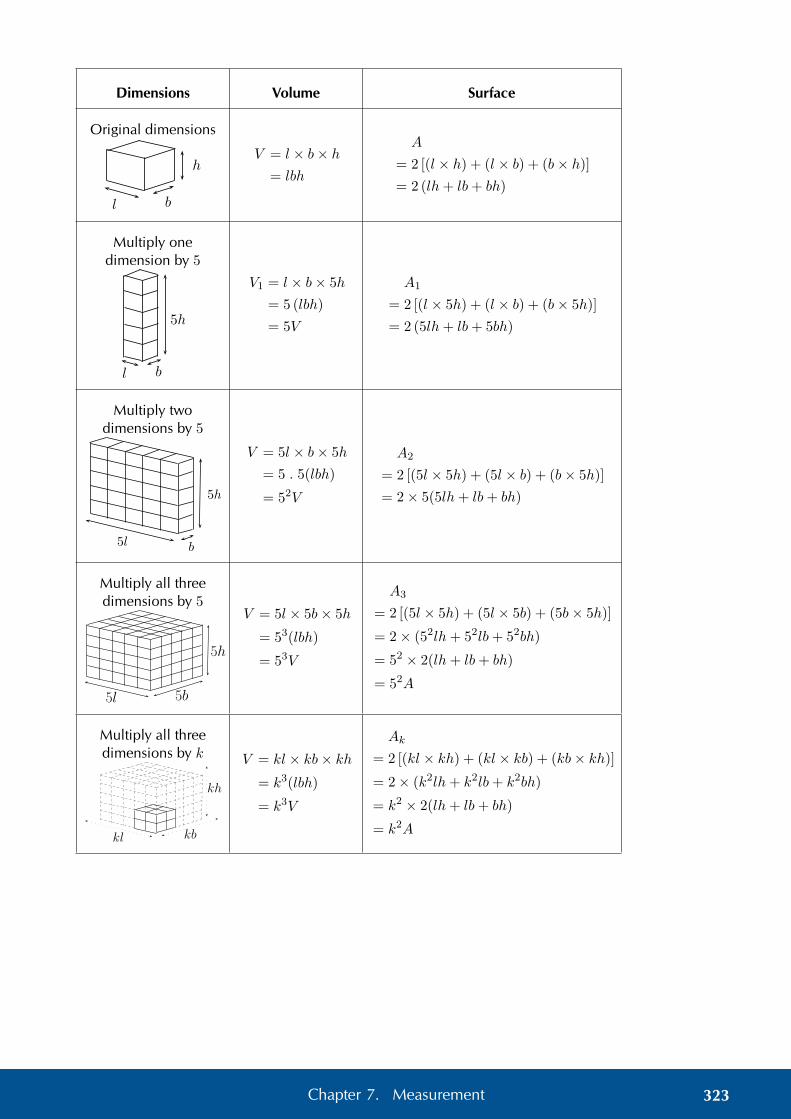
Dimensions Volume Surface
Original dimensions
l b
hV = l × b× h
= lbh
A
= 2 [(l × h) + (l × b) + (b× h)]
= 2 (lh+ lb+ bh)
Multiply onedimension by 5
l b
5h
V1 = l × b× 5h
= 5 (lbh)
= 5V
A1
= 2 [(l × 5h) + (l × b) + (b× 5h)]
= 2 (5lh+ lb+ 5bh)
Multiply twodimensions by 5
5l b
5h
V = 5l × b× 5h
= 5 . 5(lbh)
= 52V
A2
= 2 [(5l × 5h) + (5l × b) + (b× 5h)]
= 2× 5(5lh+ lb+ bh)
Multiply all threedimensions by 5
5l 5b
5h
V = 5l × 5b× 5h
= 53(lbh)
= 53V
A3
= 2 [(5l × 5h) + (5l × 5b) + (5b× 5h)]
= 2× (52lh+ 52lb+ 52bh)
= 52 × 2(lh+ lb+ bh)
= 52A
Multiply all threedimensions by k
kl kb
kh
V = kl × kb× kh= k3(lbh)
= k3V
Ak
= 2 [(kl × kh) + (kl × kb) + (kb× kh)]
= 2× (k2lh+ k2lb+ k2bh)
= k2 × 2(lh+ lb+ bh)
= k2A
323Chapter 7. Measurement

Worked example 5: The effects of k
QUESTION
The Nash family wants to build a television room onto their house. The dad draws upthe plans for the new square room of length k metres. The mum looks at the plans anddecides that the area of the room needs to be doubled. To achieve this:
• the mum suggests doubling the length of the sides of the room
• the dad recommends adding 2 m to the length of the sides
• the daughter suggests multiplying the length of the sides by a factor of√
2
• the son suggests doubling only the width of the room
Who’s suggestion will double the area of the square room? Show all calculations.
SOLUTION
Step 1: Draw a sketch
k
k
2k
2k
k + 2
k+2
√2k
√2k
2k
k
Area O
Area M
Area D
Area dArea s
Step 2: Calculate and compare
First calculate the area of the square room in the original plan:
Area O = length× length
= k2
Therefore, double the area of the room would be 2k2.
324 7.4. Multiplying a dimension by a constant factor

Consider the mum’s suggestion of doubling the length of the sides of the room:
Area M = length× length
= 2k × 2k
= 4k2
This area would be 4 times the original area.
The dad suggests adding 2 m to the length of the sides of the room:
Area D = length× length
= (k + 2)× (k + 2)
= k2 + 4k + 2
6= 2k2
This is not double the original area.
The daughter suggests multiplying the length of the sides by a factor of√
2:
Area d = length× length
=√
2k ×√
2k
= 2k2
The daughter’s suggestion would double the area of the room. Practically, the lengthof the room could be multiplied by
√2 ≈ 1,41 which would given an area of 1,96 m2.
The son suggests doubling only the width of the room:
Area s = length× length
= 2k × k= 2k2
The son’s suggestion would double the area of the room, however the room would nolonger be a square.
Step 3: Write the final answer
The daughter’s suggestion of multiplying the length of the sides of the room by a factorof√
2 would keep the shape of the room a square and would double the area of theroom.
Exercise 7 – 5: The effects of k
1. Complete the following sentences:
a) If one dimension of a cube is multiplied by a factor 12 , the volume of the
cube . . .
b) If two dimensions of a cube are multiplied by a factor 7, the volume of thecube . . .
325Chapter 7. Measurement

c) If three dimensions of a cube are multiplied by a factor 3, then:
i. each side of the cube will . . .ii. the outer surface area of the cube will . . .
iii. the volume of the cube will . . .
d) If each side of a cube is halved, then:
i. the outer surface area of the cube will . . .ii. the volume of the cube will . . .
2. The municipality intends building a swimming pool of volumeW 3 cubic metres.However, they realise that it will be very expensive to fill the pool with water, sothey decide to make the pool smaller.
a) The length and breadth of the pool are reduced by a factor of 710 . Express
the new volume in terms of W .
b) The dimensions of the pool are reduced so that the volume of the pooldecreases by a factor of 0,8. Determine the new dimensions of the pool interms of W (remember that the pool must be a cube).
Think you got it? Get this answer and more practice on our Intelligent Practice Service
1. 235N 2. 235P
www.everythingmaths.co.za m.everythingmaths.co.za
7.5 Summary EMBJ5
See presentation: 235Q at www.everythingmaths.co.za
1. Area is the two dimensional space inside the boundary of a flat object.
2. Area formulae:
• square: s2
• rectangle: b× h• triangle: 1
2b× h• trapezium: 1
2 (a+ b)× h• parallelogram: b× h• circle: πr2
3. Surface area is the total area of the exposed or outer surfaces of a prism.
4. A net is the unfolded “plan” of a solid.
5. Volume is the three dimensional space occupied by an object, or the contentsof an object.
• Volume of a rectangular prism: l × b× h
326 7.5. Summary

• Volume of a triangular prism:(12b× h
)×H
• Volume of a square prism or cube: s3
• Volume of a cylinder: πr2 × h
6. A pyramid is a geometric solid that has a polygon as its base and sides thatconverge at a point called the apex. The sides are not perpendicular to the base.
7. Surface area formulae:
• square pyramid: b (b+ 2h)
• triangular pyramid: 12b (hb + 3hs)
• right cone: πr (r + hs)
• sphere: 4πr2
8. Volume formulae:
• square pyramid: 13 × b
2 ×H• triangular pyramid: 1
3 ×12bh×H
• right cone: 13 × πr
2 ×H• sphere: 4
3πr3
Exercise 7 – 6: End of chapter exercises
1.
a) Describe this figure in terms of a prism.
b) Draw a net of this figure.
2. Which of the following is a net of a cube?
a)
b)
c)
d)
e)
327Chapter 7. Measurement

3. Name and draw the following figures:
a) A prism with the least number of sides.
b) A pyramid with the least number of vertices.
c) A right prism with a kite base.
4. a) i. Determine how much paper is needed to make a box of width 16 cm,height 3 cm and length 20 cm (assume no overlapping at corners).
ii. Give a mathematical name for the shape of the box.iii. Calculate the volume of the box.
b) Determine how much paper is needed to make a cube with a capacity of1 `.
c) Compare the box and the cube. Which has the greater volume and whichrequires the most paper to make?
5. ABCD is a rhombus with sides of length 32xmillimetres. The diagonals intersect
at O and length DO = x millimetres. Express the area of ABCD in terms of x.
O
B
D
x
CA
32x
6. The diagram shows a rectangular pyramid with a base of length 80 cm andbreadth 60 cm. The vertical height of the pyramid is 45 cm.
60 cm80 cm
45
cm
bhH
a) Calculate the volume of the pyramid.
b) Calculate H and h.
c) Calculate the surface area of the pyramid.
7. A group of children are playing soccer in a field. The soccer ball has a capacityof 5000 cc (cubic centimetres). A drain pipe in the corner of the field has adiameter of 20 cm. Is it possible for the children to lose their ball down the pipe?Show your calculations.
328 7.5. Summary

8. A litre of washing powder goes into a standard cubic container at the factory.
a) Determine the length of the sides of the container.
b) Determine the dimensions of the cubic container required to hold doublethe volume of washing powder.
9. A cube has sides of length k units.
a) Describe the effect on the volume of the cube if the height is tripled.
b) If all three dimensions of the cube are tripled, determine the effect on theouter surface area.
c) If all three dimensions of the cube are tripled, determine the effect on thevolume.
Think you got it? Get this answer and more practice on our Intelligent Practice Service
1. 235R 2. 235S 3a. 235T 3b. 235V 3c. 235W 4. 235X5. 235Y 6. 235Z 7. 2362 8. 2363 9. 2364
www.everythingmaths.co.za m.everythingmaths.co.za
329Chapter 7. Measurement


CHAPTER 8
Euclidean geometry
8.1 Revision 332
8.2 Circle geometry 333
8.3 Summary 363

8 Euclidean geometry
8.1 Revision EMBJ6
Parallelogram EMBJ7
A parallelogram is a quadrilateral with both pairs of opposite sides parallel.
Summary of the properties of a parallelogram:
• Both pairs of opposite sides are parallel.
• Both pairs of opposite sides are equal in length.
• Both pairs of opposite angles are equal.
• Both diagonals bisect each other.
bA b B
b CbD
b
///
////
/
The mid-point theorem EMBJ8
The line joining the mid-points of two sides of a triangle is parallel to the third sideand equal to half the length of the third side.
A
B C
D E
Given: AD = DB and AE = EC, we can conclude that DE ‖ BC and DE = 12BC.
332 8.1. Revision

8.2 Circle geometry EMBJ9
Terminology
The following terms are regularly used when referring to circles:
• Arc — a portion of the circumference of a circle.
• Chord — a straight line joining the ends of an arc.
• Circumference — the perimeter or boundary line of a circle.
• Radius (r) — any straight line from the centre of the circle to a point on thecircumference.
• Diameter — a special chord that passes through the centre of the circle. A di-ameter is a straight line segment from one point on the circumference to anotherpoint on the circumference that passes through the centre of the circle.
• Segment — part of the circle that is cut off by a chord. A chord divides a circleinto two segments.
• Tangent — a straight line that makes contact with a circle at only one point onthe circumference.
b
bA B
O
P
arc
chord
tangent
diameter
radi
us
segment
See video: 2365 at www.everythingmaths.co.za
Axioms
An axiom is an established or accepted principle. For this section, the following areaccepted as axioms.
333Chapter 8. Euclidean geometry

1. The theorem of Pythagoras states that the square of the hypotenuse of a right-angled triangle is equal to the sum of the squares of the other two sides.
(AC)2 = (AB)2 + (BC)2
CB
A (AC)2
(AB)2
(BC)2
2. A tangent is perpendicular to the radius (OT ⊥ ST ), drawn at the point of contactwith the circle.
T
S
b
O
Theorems EMBJB
A theorem is a hypothesis (proposition) that can be shown to be true by acceptedmathematical operations and arguments. A proof is the process of showing a theoremto be correct.
The converse of a theorem is the reverse of the hypothesis and the conclusion. Forexample, given the theorem “if A, then B”, the converse is “if B, then A”.
334 8.2. Circle geometry
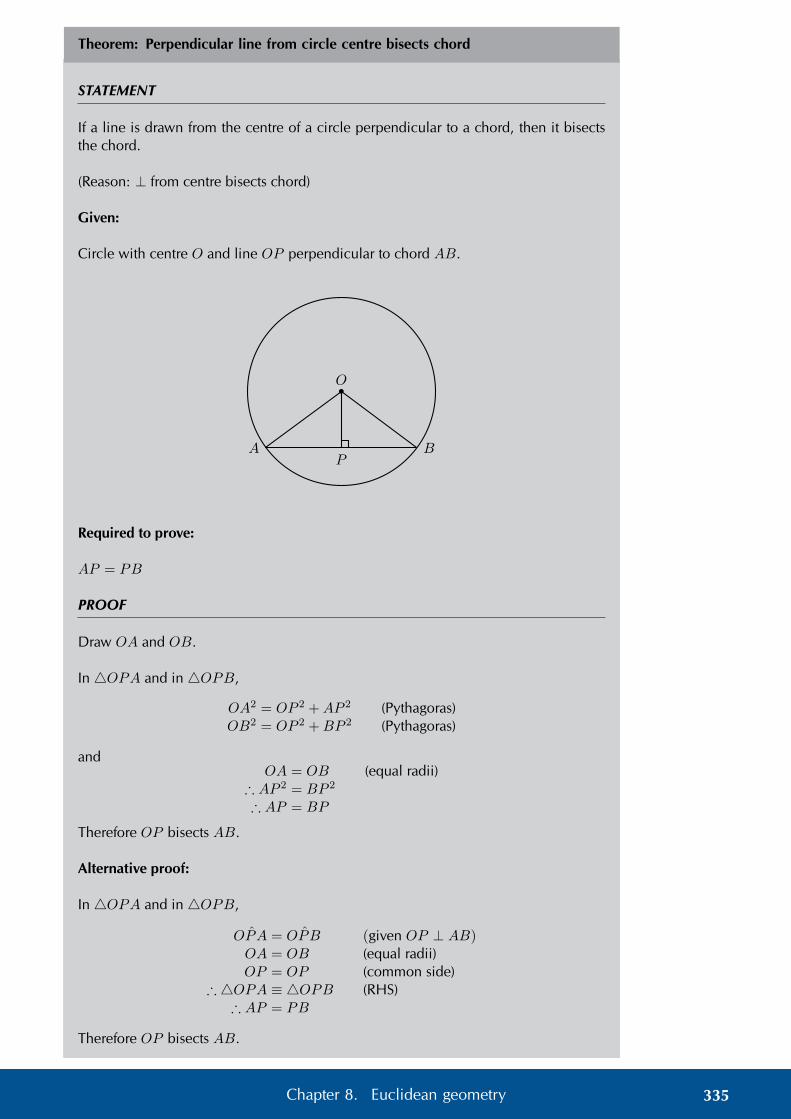
Theorem: Perpendicular line from circle centre bisects chord
STATEMENT
If a line is drawn from the centre of a circle perpendicular to a chord, then it bisectsthe chord.
(Reason: ⊥ from centre bisects chord)
Given:
Circle with centre O and line OP perpendicular to chord AB.
b
A B
O
P
Required to prove:
AP = PB
PROOF
Draw OA and OB.
In 4OPA and in 4OPB,
OA2 = OP 2 +AP 2 (Pythagoras)OB2 = OP 2 +BP 2 (Pythagoras)
andOA = OB (equal radii)
∴ AP 2 = BP 2
∴ AP = BP
Therefore OP bisects AB.
Alternative proof:
In 4OPA and in 4OPB,
OPA = OPB (given OP ⊥ AB)OA = OB (equal radii)OP = OP (common side)
∴ 4OPA ≡ 4OPB (RHS)∴ AP = PB
Therefore OP bisects AB.
335Chapter 8. Euclidean geometry

(PROOF NOT FOR EXAMS) Converse: Line from circle centre to mid-point ofchord is perpendicular
STATEMENT
If a line is drawn from the centre of a circle to the mid-point of a chord, then the lineis perpendicular to the chord.
(Reason: line from centre to mid-point ⊥)
Given:
Circle with centre O and line OP to mid-point P on chord AB.
b
A B
O
P
Required to prove:
OP ⊥ AB
PROOF
Draw OA and OB.
In 4OPA and in 4OPB,
OA = OB (equal radii)AP = PB (given)OP = OP (common side)
∴ 4OPA ≡ 4OPB (SSS)∴ OPA = OPB
and OPA+OPB = 180◦ (∠ on str. line)
∴ OPA = OPB = 90◦
Therefore OP ⊥ AB.
See video: 2366 at www.everythingmaths.co.za
336 8.2. Circle geometry

Theorem: Perpendicular bisector of chord passes through circle centre
STATEMENT
If the perpendicular bisector of a chord is drawn, then the line will pass through thecentre of the circle.
(Reason: ⊥ bisector through centre)
Given:
Circle with mid-point P on chord AB.
Line QP is drawn such that QPA = QPB = 90◦.
Line RP is drawn such that RPA = RPB = 90◦.
b
b
A B
Q
P
R
Required to prove:
Circle centre O lies on the line PR
PROOF
Draw lines QA and QB.
Draw lines RA and RB.
In 4QPA and in 4QPB,
AP = PB (given)QP = QP (common side)
QPA = QPB = 90◦ (given)∴ 4QPA ≡ 4QPB (SAS)
∴ QA = QB
Similarly it can be shown that in 4RPA and in 4RPB, RA = RB.
We conclude that all the points that are equidistant from A and B will lie on theline PR extended. Therefore the centre O, which is equidistant to all points on thecircumference, must also lie on the line PR.
337Chapter 8. Euclidean geometry

Worked example 1: Perpendicular line from circle centre bisects chord
QUESTION
Given OQ ⊥ PR and PR = 8 units, determine the value of x.
O
x5
P
Q
R
SOLUTION
Step 1: Use theorems and the given information to find all equal angles and sides onthe diagram
PQ = QR = 4 (⊥ from centre bisects chord)
Step 2: Solve for x
In 4OQP :
PQ = 4 (⊥ from centre bisects chord)OP 2 = OQ2 +QP 2 (Pythagoras)
52 = x2 + 42
∴ x2 = 25− 16x2 = 9x = 3
Step 3: Write the final answer
x = 3 units.
338 8.2. Circle geometry

Exercise 8 – 1: Perpendicular line from center bisects chord
1. In the circle with centre O, OQ ⊥ PR,OQ = 4 units and PR = 10. Determinex.
O
4
P Q R
x
2. In the circle with centre O and radius= 10 units, OQ ⊥ PR and PR = 8. De-termine x.
O
x
10
PQ
R
3. In the circle with centre O, OQ ⊥ PR,PR = 12 units and SQ = 2 units. Deter-mine x. O
xP
Q R
S
4. In the circle with centre O, OT ⊥ SQ,OT ⊥ PR, OP = 10 units, ST = 5 unitsand PU = 8 units. Determine TU . O
V
8P R
U
10
5 TQS
5. In the circle with centre O, OT ⊥ QP ,OS ⊥ PR, OT = 5 units, PQ = 24 unitsand PR = 25 units. Determine OS = x.
OxP
S
5T
Q
R
25
24
Think you got it? Get this answer and more practice on our Intelligent Practice Service
1. 2367 2. 2368 3. 2369 4. 236B 5. 236C
www.everythingmaths.co.za m.everythingmaths.co.za
339Chapter 8. Euclidean geometry

Investigation: Angles subtended by an arc at the centre and the circumference ofa circle
1. Measure angles x and y in each of the following graphs:
bx1
y1
bx2
y2
bx3
y3
2. Complete the table:
x y
3. Use your results to make a conjecture about the relationship between anglessubtended by an arc at the centre of a circle and angles at the circumference ofa circle.
4. Now draw three of your own similar diagrams and measure the angles to checkyour conjecture.
340 8.2. Circle geometry

Theorem: Angle at the centre of a circle is twice the size of the angle at the cir-cumference
STATEMENT
If an arc subtends an angle at the centre of a circle and at the circumference, then theangle at the centre is twice the size of the angle at the circumference.
(Reason: ∠ at centre = 2∠ at circum.)
Given:
Circle with centre O, arc AB subtending AOB at the centre of the circle, and APB atthe circumference.
b
Q
O
P
BA
b
Q
O
P
BA
b
Q
O
P
BA
Required to prove:
AOB = 2APB
PROOF
Draw PO extended to Q and let AOQ = O1 and BOQ = O2.
O1 = APO + PAO (ext. ∠4 = sum int. opp. ∠s)and APO = PAO (equal radii, isosceles 4APO)
∴ O1 = APO +APO
O1 = 2APO
Similarly, we can also show that O2 = 2BPO.
For the first two diagrams shown above we have that:
AOB = O1 + O2
= 2APO + 2BPO
= 2(APO +BPO)
∴ AOB = 2(APB)
And for the last diagram:
AOB = O2 − O1
= 2BPO − 2APO
= 2(BPO −APO)
∴ AOB = 2(APB)
341Chapter 8. Euclidean geometry

Worked example 2: Angle at the centre of circle is twice angle at circumference
QUESTION
Given HK, the diameter of the circle passing through centre O.
b
J
H KO
a
SOLUTION
Step 1: Use theorems and the given information to find all equal angles and sides onthe diagram
Step 2: Solve for a
In 4HJK:HOK = 180◦ (∠ on str. line)
= 2a (∠ at centre = 2∠ at circum.)∴ 2a = 180◦
a = 180◦
2= 90◦
Step 3: Conclusion
The diameter of a circle subtends a right angle at the circumference (angles in a semi-circle).
342 8.2. Circle geometry

Exercise 8 – 2: Angle at the centre of circle is twice angle at circumference
Given O is the centre of the circle, determine the unknown angle in each of the fol-lowing diagrams:
1.
b
J
H
KO
b
45◦
2.
bO
J
K
H
45◦
c
3.
bO
K
J 100◦
H
d
4.
bO
HJ
e
K
35◦
5.
bO
J
K
H
120◦
f
Think you got it? Get this answer and more practice on our Intelligent Practice Service
1. 236D 2. 236F 3. 236G 4. 236H 5. 236J
www.everythingmaths.co.za m.everythingmaths.co.za
343Chapter 8. Euclidean geometry

Investigation: Subtended angles in the same segment of a circle
1. Measure angles a, b, c, d and e in the diagram below:
a
ed
b
c
P Q
2. Choose any two points on the circumference of the circle and label them A andB.
3. Draw AP and BP , and measure APB.
4. Draw AQ and BQ, and measure AQB.
5. What do you observe? Make a conjecture about these types of angles.
Theorem: Subtended angles in the same segment of a circle are equal
STATEMENT
If the angles subtended by a chord of the circle are on the same side of the chord, thenthe angles are equal.
(Reason: ∠s in same seg.)
Given:
Circle with centre O, and points P and Q on the circumference of the circle. Arc ABsubtends APB and AQB in the same segment of the circle.
344 8.2. Circle geometry

bO
A
B
P
Q
Required to prove:
APB = AQB
PROOF
AOB = 2APB (∠ at centre = 2∠ at circum.)AOB = 2AQB (∠ at centre = 2∠ at circum.)
∴ 2APB = 2AQB
APB = AQB
Equal arcs subtend equal angles
From the theorem above we can deduce that if angles at the circumference of a circleare subtended by arcs of equal length, then the angles are equal. In the figure below,notice that if we were to move the two chords with equal length closer to each other,until they overlap, we would have the same situation as with the theorem above. Thisshows that the angles subtended by arcs of equal length are also equal.
b
b
345Chapter 8. Euclidean geometry

(PROOF NOT FOR EXAMS) Converse: Concyclic points
STATEMENT
If a line segment subtends equal angles at two other points on the same side of the linesegment, then these four points are concyclic (lie on a circle).
Given:
Line segment AB subtending equal angles at points P and Q on the same side of theline segment AB.
A
B
RQ
P
Required to prove:
A, B, P and Q lie on a circle.
PROOF
Proof by contradiction:
Points on the circumference of a circle: we know that there are only two possibleoptions regarding a given point — it either lies on circumference or it does not.
We will assume that point P does not lie on the circumference.
We draw a circle that cuts AP at R and passes through A, B and Q.
AQB = ARB (∠s in same seg.)but AQB = APB (given)
∴ ARB = APB
but ARB = APB +RBP (ext. ∠4 = sum int. opp.)∴ RBP = 0◦
Therefore the assumption that the circle does not pass through P must be false.
We can conclude that A, B, Q and P lie on a circle (A, B, Q and P are concyclic).
346 8.2. Circle geometry

Worked example 3: Concyclic points
QUESTION
Given FH ‖ EI and EIF = 15◦, determine the value of b.
E
F
G
H
I
15◦
b
SOLUTION
Step 1: Use theorems and the given information to find all equal angles on the dia-gram
Step 2: Solve for b
HF I = 15◦ (alt. ∠, FH ‖ EI)
and b = HFI (∠s in same seg.)∴ b = 15◦
Exercise 8 – 3: Subtended angles in the same segment
1. Find the values of the unknown angles.
a)A
B
C
D
21◦
a
b)J
K
L
M
24◦
c
102◦
d
c)N
O
P
Q
17◦
d
347Chapter 8. Euclidean geometry

2.
R
ST
UV
45◦
35◦
15◦
e
a) Given T V S = SV R, deter-mine the value of e.
b) Is TV a diameter of the cir-cle? Explain your answer.
3.
b
W
X
Y Z
O
35◦
f
T12
Given circle with centre O, WT =TY and XWT = 35◦. Determinef .
Think you got it? Get this answer and more practice on our Intelligent Practice Service
1a. 236K 1b. 236M 1c. 236N 2. 236P 3. 236Q
www.everythingmaths.co.za m.everythingmaths.co.za
Cyclic quadrilaterals
Cyclic quadrilaterals are quadrilaterals with all four vertices lying on the circumferenceof a circle (concyclic).
Investigation: Cyclic quadrilaterals
Consider the diagrams given below:
Circle 1 Circle 2 Circle 3A
B
C
D
A
B
CD
A
B
C
D
348 8.2. Circle geometry

1. Complete the following:
ABCD is a cyclic quadrilateral because . . . . . .
2. Complete the table:
Circle 1 Circle 2 Circle 3
A =
B =
C =
D =
A+ C =
B + D =
3. Use your results to make a conjecture about the relationship between angles ofcyclic quadrilaterals.
Theorem: Opposite angles of a cyclic quadrilateral
STATEMENT
The opposite angles of a cyclic quadrilateral are supplementary.
(Reason: opp. ∠s cyclic quad.)
Given:
Circle with centre O with points A,B, P and Q on the circumference such that ABPQis a cyclic quadrilateral.
bO
A
B
PQ
1
2
Required to prove:
ABP +AQP = 180◦ and QAB +QPB = 180◦
349Chapter 8. Euclidean geometry

PROOF
Draw AO and OP . Label O1 and O2.
O1 = 2ABP (∠ at centre = 2∠ at circum.)O2 = 2AQP (∠ at centre = 2∠ at circum.)
and O1 + O2 = 360◦ (∠s around a point)∴ 2ABP + 2AQP = 360◦
ABP +AQP = 180◦
Similarly, we can show that QAB +QPB = 180◦.
Converse: interior opposite angles of a quadrilateral
If the interior opposite angles of a quadrilateral are supplementary, then the quadrilat-eral is cyclic.
Exterior angle of a cyclic quadrilateral
If a quadrilateral is cyclic, then the exterior angle is equal to the interior opposite angle.
b
b
Worked example 4: Opposite angles of a cyclic quadrilateral
QUESTION
Given the circle with centre O and cyclic quadrilateral PQRS. SQ is drawn andSPQ = 34◦. Determine the values of a, b and c.
bOP Q
RS
a
b
c
34◦
350 8.2. Circle geometry

SOLUTION
Step 1: Use theorems and the given information to find all equal angles on the dia-gram
Step 2: Solve for b
SPQ+ c = 180◦ (opp. ∠s cyclic quad supp.)∴ c = 180◦ − 34◦
= 146◦
a = 90◦ (∠ in semi circle)
In 4PSQ:a+ b+ 34◦ = 180◦ (∠ sum of 4)
∴ b = 180◦ − 90◦ − 34◦
= 56◦
Methods for proving a quadrilateral is cyclic
There are three ways to prove that a quadrilateral is a cyclic quadrilateral:
Method of proof Reason
RQ
S
P
If P + R = 180◦ or S +Q = 180◦, then PQRS isa cyclic quad.
opp. int. anglessuppl.
R
Q
S
P If P = Q or S = R, thenPQRS is a cyclic quad.
angles in the sameseg.
R
Q
S
P
T
If TQR = S, then PQRSis a cyclic quad.
ext. angle equal toint. opp. angle
351Chapter 8. Euclidean geometry
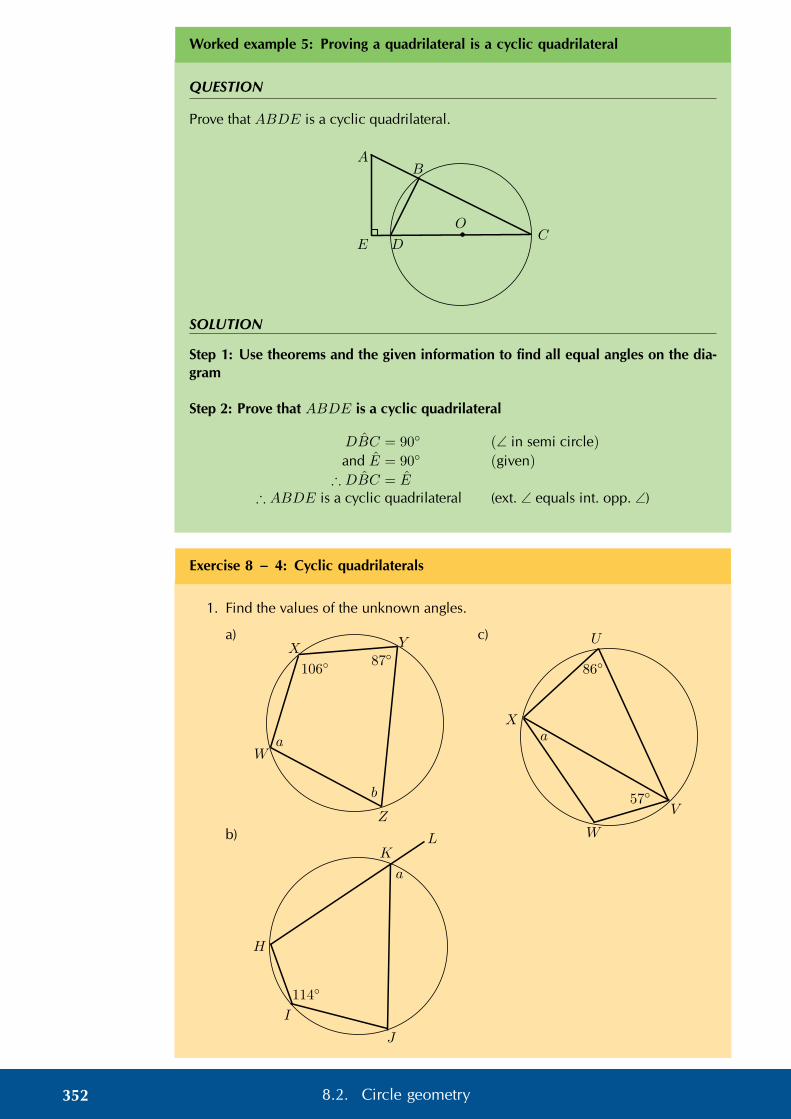
Worked example 5: Proving a quadrilateral is a cyclic quadrilateral
QUESTION
Prove that ABDE is a cyclic quadrilateral.
bO
EC
D
AB
SOLUTION
Step 1: Use theorems and the given information to find all equal angles on the dia-gram
Step 2: Prove that ABDE is a cyclic quadrilateral
DBC = 90◦ (∠ in semi circle)
and E = 90◦ (given)
∴ DBC = E∴ ABDE is a cyclic quadrilateral (ext. ∠ equals int. opp. ∠)
Exercise 8 – 4: Cyclic quadrilaterals
1. Find the values of the unknown angles.
a)X Y
Z
Wa
b
106◦87◦
b)
H
I
J
KL
114◦
a
c) U
V
W
X
57◦
a
86◦
352 8.2. Circle geometry

2. Prove that ABCD is a cyclic quadrilateral:
a) D C
72◦
B
A
32◦
M
40◦
b) D C70
◦
BA
35◦
Think you got it? Get this answer and more practice on our Intelligent Practice Service
1a. 236R 1b. 236S 1c. 236T 2a. 236V 2b. 236W
www.everythingmaths.co.za m.everythingmaths.co.za
Tangent line to a circle
A tangent is a line that touches the circumference of a circle at only one place. Theradius of a circle is perpendicular to the tangent at the point of contact.
bO
353Chapter 8. Euclidean geometry

Theorem: Two tangents drawn from the same point outside a circle
STATEMENT
If two tangents are drawn from the same point outside a circle, then they are equal inlength.
(Reason: tangents from same point equal)
Given:
Circle with centre O and tangents PA and PB, where A and B are the respectivepoints of contact for the two lines.
b
A
B
O
P
Required to prove:
AP = BP
PROOF
In 4AOP and 4BOP ,
OAP = OBP = 90◦ (tangent ⊥ radius)AO = BO (equal radii)OP = OP (common side)
∴ 4AOP ≡ 4BOP (RHS)∴ AP = BP
354 8.2. Circle geometry

Worked example 6: Tangents from the same point outside a circle
QUESTION
In the diagram below AE = 5 cm, AC = 8 cm and CE = 9 cm. Determine the valuesof a, b and c.
A
B
C
D
E
F
AE = 5 cmAC = 8 cmCE = 9 cma
b
c
b
b
b
SOLUTION
Step 1: Use theorems and the given information to find all equal angles on the dia-gram
Step 2: Solve for a, b and c
AB = AF = a (tangents from A)EF = ED = c (tangents from E)CB = CD = b (tangents from C)
∴ AE = a+ c = 5and AC = a+ b = 8and CE = b+ c = 9
Step 3: Solve for the unknown variables using simultaneous equations
a+ c = 5 . . . (1)a+ b = 8 . . . (2)b+ c = 9 . . . (3)
Subtract equation (1) from equation (2) and then substitute into equation (3):
(2)− (1) b− c = 8− 5= 3
∴ b = c+ 3Substitute into (3) c+ 3 + c = 9
2c = 6c = 3
∴ a = 2and b = 6
355Chapter 8. Euclidean geometry

Exercise 8 – 5: Tangents to a circle
Find the values of the unknown lengths.
1.
b
G
HI
J
d
5cm
8 cm
2.
b
K
LM N
OP
e
LN = 7,5 cm
2 cm
6cm
3.b
b
R
Q
S
f
3 cm
Think you got it? Get this answer and more practice on our Intelligent Practice Service
1. 236X 2. 236Y 3. 236Z
www.everythingmaths.co.za m.everythingmaths.co.za
Investigation: Tangent-chord theorem
Consider the diagrams given below:
Diagram 1 Diagram 2 Diagram 3
D
C
E
B
A
D
C
E
B
A D
C
E
B
A
1. Measure the following angles with a protractor and complete the table:
Diagram 1 Diagram 2 Diagram 3
ABC =
D =
E =
2. Use your results to complete the following: the angle between a tangent to acircle and a chord is . . . . . . to the angle in the alternate segment.
356 8.2. Circle geometry

Theorem: Tangent-chord theorem
STATEMENT
The angle between a tangent to a circle and a chord drawn at the point of contact, isequal to the angle which the chord subtends in the alternate segment.
(Reason: tan. chord theorem)
Given:
Circle with centre O and tangent SR touching the circle at B. Chord AB subtends P1
and Q1.
bO
A
B
P1
1
Q
T
1
S R
Required to prove:
1. ABR = APB
2. ABS = AQB
PROOF
Draw diameter BT and join T to A.
Let ATB = T1.
ABS +ABT = 90◦ (tangent ⊥ radius)BAT = 90◦ (∠ in semi circle)
∴ ABT + T1 = 90◦ (∠ sum of 4BAT )
∴ ABS = T1but Q1 = T1 (∠s in same segment)∴ Q1 = ABS
ABS +ABR = 180◦ (∠s on str. line)
Q1 + P1 = 180◦ (opp. ∠s cyclic quad. supp.)∴ ABS +ABR = Q1 + P1
and ABS = Q1
∴ ABR = P1
357Chapter 8. Euclidean geometry

Worked example 7: Tangent-chord theorem
QUESTION
Determine the values of h and s.
P
O
Q
S
R
h+ 20◦s
4h
4h− 70◦
SOLUTION
Step 1: Use theorems and the given information to find all equal angles on the dia-gram
Step 2: Solve for h
OQS = SRQ (tangent chord theorem)h+ 20◦ = 4h− 70◦
90◦ = 3h∴ h = 30◦
Step 3: Solve for s
PQR = QSR (tangent chord theorem)s = 4h
= 4(30◦)= 120◦
358 8.2. Circle geometry

Exercise 8 – 6: Tangent-chord theorem
1. Find the values of the unknown letters, stating reasons.
Q
R
S
O
P
ab
33◦
a)
O
P
Q
R
S c
d
72◦
b)
O
P
Q
RS g
f
38◦47◦
c)
R
P
O
Q
l
1
1
66◦
d)
O
PQ
R
S
i
j
k
39◦101◦
e)
O
R
Q
S
T
m n
o
34◦
f)
O•
P
R
Q
S
T
p
q
r52◦
g)
359Chapter 8. Euclidean geometry

2. O is the centre of the circle and SPT is a tangent, with OP ⊥ ST . Determinea, b and c, giving reasons.
O•
S TP
M
N
a
bc
64◦
3.
P
L
A
B
C
1 23
1
2
D
Given AB = AC, AP ‖ BC and A2 = B2. Prove:
a) PAL is a tangent to the circle ABC.
b) AB is a tangent to the circle ADP .
Think you got it? Get this answer and more practice on our Intelligent Practice Service
1a. 2372 1b. 2373 1c. 2374 1d. 2375 1e. 2376 1f. 23771g. 2378 2. 2379 3. 237B
www.everythingmaths.co.za m.everythingmaths.co.za
Converse: tangent-chord theorem
If a line drawn through the end point of a chord forms an angle equal to the anglesubtended by the chord in the alternate segment, then the line is a tangent to thecircle.
(Reason: ∠ between line and chord = ∠ in alt. seg. )
360 8.2. Circle geometry

Worked example 8: Applying the theorems
QUESTION
A D
B
C
O E
F
BD is a tangent to the circle with centre O, with BO ⊥ AD.
Prove that:
1. CFOE is a cyclic quadrilateral
2. FB = BC
3. ∠AOC = 2BFC
4. Will DC be a tangent to the circle passing through C,F,O and E? Motivate youranswer.
SOLUTION
Step 1: Prove CFOE is a cyclic quadrilateral by showing opposite angles are supple-mentary
BO ⊥ OD (given)
∴ FOE = 90◦
FCE = 90◦ (∠ in semi circle)∴ CFOE is a cyclic quad. (opp. ∠s suppl.)
Step 2: Prove BFC is an isosceles triangle
To show that FB = BC we first prove 4BFC is an isosceles triangle by showing thatBFC = BCF .
BCF = CEO (tangent-chord)
CEO = BFC (ext. ∠ cyclic quad. CFOE)
∴ BFC = BCF∴ FB = BC (4BFC isosceles)
361Chapter 8. Euclidean geometry

Step 3: Prove AOC = 2BFC
AOC = 2AEC (∠ at centre = 2∠ at circum.)and AEC = BFC (ext. ∠ cyclic quad. CFOE)
∴ AOC = 2BFC
Step 4: Determine if DC is a tangent to the circle through C, F , O and E
Proof by contradiction.
Let us assume that DC is a tangent to the circle passing through the points C, F , Oand E:
∴ DCE = COE (tangent-chord)
And using the circle with centre O and tangent BD we have that:
DCE = CAE (tangent-chord)
but CAE = 12COE (∠ at centre = 2∠ at circum.)
∴ DCE 6= COE
Therefore our assumption is not correct and we can conclude that DC is not a tangentto the circle passing through the points C, F , O and E.
Worked example 9: Applying the theorems
QUESTION
A
B
C
D
E
F
G H
FD is drawn parallel to the tangent CB
362 8.2. Circle geometry

Prove that:
1. FADE is a cyclic quadrilateral
2. FEA = B
SOLUTION
Step 1: Prove FADE is a cyclic quadrilateral using angles in the same segment
FDC = DCB (alt. ∠s FD ‖ CB)
and DCB = CAE (tangent-chord)
∴ FDC = CAE∴ FADE is a cyclic quad. (∠s in same seg.)
Step 2: Prove FEA = B
F DA = B (corresp. ∠s FD ‖ CB)
and FEA = FDA (∠s same seg. cyclic quad. FADE)
∴ FEA = B
8.3 Summary EMBJC
See presentation: 237C at www.everythingmaths.co.za
• Arc An arc is a portion of the circumference of a circle.
• Chord - a straight line joining the ends of an arc.
• Circumference - perimeter or boundary line of a circle.
• Radius (r) - any straight line from the centre of the circle to a point on the cir-cumference.
• Diameter - a special chord that passes through the centre of the circle. A diame-ter is the length of a straight line segment from one point on the circumference toanother point on the circumference, that passes through the centre of the circle.
• Segment A segment is a part of the circle that is cut off by a chord. A chorddivides a circle into two segments.
• Tangent - a straight line that makes contact with a circle at only one point on thecircumference.
• A tangent line is perpendicular to the radius, drawn at the point of contact withthe circle.
363Chapter 8. Euclidean geometry

b O
M
A
B
• If O is the centre and OM ⊥ AB, then AM =MB.
• If O is the centre and AM = MB, thenAMO = BMO = 90◦.
• If AM = MB and OM ⊥ AB, then ⇒ MOpasses through centre O.
b2x
x
2y
y
xIf an arc subtends an angle at the centre of a cir-cle and at the circumference, then the angle at thecentre is twice the size of the angle at the circum-ference.
b
b
Angles at the circumference subtended by the samearc (or arcs of equal length) are equal.
AB
C
D
12
E
The four sides of a cyclic quadrilateral ABCD arechords of the circle with centre O.
• A+ C = 180◦ (opp. ∠s supp.)
• B + D = 180◦ (opp. ∠s supp.)
• EBC = D (ext. ∠ cyclic quad.)
• A1 = A2 = C (vert. opp. ∠, ext. ∠ cyclicquad.)
AB
CD
Proving a quadrilateral is cyclic: If A+ C = 180◦ orB+D = 180◦, then ABCD is a cyclic quadrilateral.
364 8.3. Summary

AB
C
D
1
1
If A1 = C or D1 = B, then ABCD is a cyclicquadrilateral.
AB
CD
If A = B or C = D, then ABCD is a cyclic quadri-lateral.
b
A
B
O
T
If AT and BT are tangents to circle O, then
• OA ⊥ AT (tangent ⊥ radius)
• OB ⊥ BT (tangent ⊥ radius)
• TA = TB (tangents from same point equal)
A
B
T
D
C
x
y
xy
• If DC is a tangent, then DTA = TBA andCTB = TAB
• If DTA = TBA or CTB = TAB, then DC isa tangent touching at T
365Chapter 8. Euclidean geometry

Exercise 8 – 7: End of chapter exercises
1.
O•
A
B C
D
E
F××
x
AOC is a diameter of the circle with centre O. F is the mid-point of chord EC.BOC = COD and B = x. Express the following angles in terms of x, statingreasons:
a) A
b) COD
c) D
2.
M•
D
E
F
G1 2
1
2
1
2
1 2
D, E, F and G are points on circle with centre M . F1 = 7◦ and D2 = 51◦.Determine the sizes of the following angles, stating reasons:
a) M1
b) D1
c) F2
d) G
e) E1
366 8.3. Summary

3.
M•O•
D
A
B
C
1 2
O is a point on the circle with centre M . O is also the centre of a second circle.DA cuts the smaller circle at C and D1 = x. Express the following angles interms of x, stating reasons:
a) D2
b) OAB
c) OBA
d) AOB
e) C
4.
O•
A
B CM
O is the centre of the circle with radius 5 cm and chord BC = 8 cm. Calculatethe lengths of:
a) OM
b) AM
c) AB
5.
O•A
BC
70◦x
AO ‖ CB in circle with centre O. AOB = 70◦ and OAC = x. Calculate thevalue of x, giving reasons.
367Chapter 8. Euclidean geometry

6.
O•
P
Q R
ST
x
PQ is a diameter of the circle with centre O. SQ bisects PQR and PQS = x.
a) Write down two other angles that are also equal to x.
b) Calculate POS in terms of x, giving reasons.
c) Prove that OS is a perpendicular bisector of PR.
7.
O•
A
B
C
D
35◦
BOD is a diameter of the circle with centre O. AB = AD and OCD = 35◦.Calculate the value of the following angles, giving reasons:
a) ODC
b) COD
c) CBD
d) BAD
e) ADB
8.
O•
R
P
T
Q
x
y
QP in the circle with centre O is protracted to T so that PR = PT . Express y interms of x.
368 8.3. Summary

9.
O•A
B
C
D
E
PF
O is the centre of the circle with diameter AB. CD ⊥ AB at P and chord DEcuts AB at F . Prove that:
a) CBP = DPB
b) CED = 2CBA
c) ABD = 12COA
10.
O•
PQ
R
x
S
In the circle with centre O, OR ⊥ QP , PQ = 30 mm and RS = 9 mm. Deter-mine the length of OQ.
11.
M •
P
QR
S
T
P , Q, R and S are points on the circle with centre M . PS and QR are extendedand meet at T . PQ = PR and PQR = 70◦.
a) Determine, stating reasons, three more angles equal to 70◦.
b) If QPS = 80◦, calculate SRT , STR and PQS.
c) Explain why PQ is a tangent to the circle QST at point Q.
d) Determine PMQ.
369Chapter 8. Euclidean geometry

12.
O•
A PQ
C
B
POQ is a diameter of the circle with centre O. QP is protruded to A and AC isa tangent to the circle. BA ⊥ AQ and BCQ is a straight line. Prove:
a) PCQ = BAP
b) BAPC is a cyclic quadrilateral
c) AB = AC
13.
O• TC
A
B
x
TA and TB are tangents to the circle with centre O. C is a point on the circum-ference and ATB = x. Express the following in terms of x, giving reasons:
a) ABT
b) OBA
c) C
14.
O•
A
B
C
E
D
AOB is a diameter of the circleAECB with centre O. OE ‖ BCand cuts AC at D.
a) Prove AD = DC
b) Show that ABC is bisectedby EB
c) If OEB = x, express BACin terms of x
d) Calculate the radius of thecircle if AC = 10 cm andDE = 1 cm
370 8.3. Summary

15.V
Q
S
RP
T
W
x
y
PQ and RS are chords of the circle and PQ ‖ RS. The tangent to the circle atQ meets RS protruded at T . The tangent at S meets QT at V . QS and PR aredrawn.
Let TQS = x and QRP = y. Prove that:
a) T V S = 2QRS
b) QV SW is a cyclic quadrilateral
c) QPS + T = PRT
d) W is the centre of the circle
16.
F
DBC
E
A
K
T
1 21
2
12 3
4
The two circles shown intersect at points F and D. BFT is a tangent to thesmaller circle at F . Straight line AFE is drawn such that DF = EF . CDE is astraight line and chord AC and BF cut at K. Prove that:
a) BT ‖ CEb) BCEF is a parallelogram
c) AC = BF
Think you got it? Get this answer and more practice on our Intelligent Practice Service
1. 237D 2. 237F 3. 237G 4. 237H 5. 237J 6. 237K7. 237M 8. 237N 9. 237P 10. 237Q 11. 237R 12. 237S
13. 237T 14. 237V 15. 237W 16. 237X
www.everythingmaths.co.za m.everythingmaths.co.za
371Chapter 8. Euclidean geometry


CHAPTER 9
Finance, growth and decay
9.1 Revision 374
9.2 Simple and compound depreciation 377
9.3 Timelines 388
9.4 Nominal and effective interest rates 394
9.5 Summary 398

9 Finance, growth and decay
9.1 Revision EMBJD
Simple interest is the interest calculated only on the initial amount invested, the prin-cipal amount. Compound interest is the interest earned on the principal amount andon its accumulated interest. This means that interest is being earned on interest. Theaccumulated amount is the final amount; the sum of the principal amount and theamount of interest earned.
Formula for simple interest:A = P (1 + in)
Formula for compound interest:
A = P (1 + i)n
where
A = accumulated amount
P = principal amount
i = interest rate written as a decimal
n = time period in years
Worked example 1: Simple and compound interest
QUESTION
Sam wants to invest R 3450 for 5 years. Wise Bank offers a savings account which payssimple interest at a rate of 12,5% per annum, and Grand Bank offers a savings accountpaying compound interest at a rate of 10,4% per annum. Which bank account wouldgive Sam the greatest accumulated balance at the end of the 5 year period?
SOLUTION
Step 1: Calculation using the simple interest formula
Write down the known variables and the simple interest formula
P = 3450
i = 0,125
n = 5
A = P (1 + in)
Substitute the values to determine the accumulated amount for the Wise Bank savings
374 9.1. Revision

account.
A = 3450(1 + 0,125× 5)
= R 5606,25
Step 2: Calculation using the compound interest formula
Write down the known variables and the compound interest formula.
P = 3450
i = 0,104
n = 5
A = P (1 + i)n
Substitute the values to determine the accumulated amount for the Grand Bank savingsaccount.
A = 3450(1 + 0,104)5
= R 5658,02
Step 3: Write the final answer
The Grand Bank savings account would give Sam the highest accumulated balance atthe end of the 5 year period.
Worked example 2: Finding i
QUESTION
Bongani decides to put R 30 000 in an investment account. What compound interestrate must the investment account achieve for Bongani to double his money in 6 years?Give your answer correct to one decimal place.
SOLUTION
Step 1: Write down the known variables and the compound interest formula
A = 60 000
P = 30 000
n = 6
A = P (1 + i)n
375Chapter 9. Finance, growth and decay

Step 2: Substitute the values and solve for i
60 000 = 30 000(1 + i)6
60 00030 000
= (1 + i)6
2 = (1 + i)6
6√
2 = 1 + i6√
2− 1 = i
∴ i = 0,122 . . .
Step 3: Write the final answer and comment
We round up to a rate of 12,3% p.a. to make sure that Bongani doubles his invest-ment.
Exercise 9 – 1: Revision
1. Determine the value of an investment of R 10 000 at 12,1% p.a. simple interestfor 3 years.
2. Calculate the value of R 8000 invested at 8,6% p.a. compound interest for 4years.
3. Calculate how much interest John will earn if he invests R 2000 for 4 years at:
a) 6,7% p.a. simple interest
b) 5,4% p.a. compound interest
4. The value of an investment grows from R 2200 to R 3850 in 8 years. Determinethe simple interest rate at which it was invested.
5. James had R 12 000 and invested it for 5 years. If the value of his investment isR 15 600, what compound interest rate did it earn?
Think you got it? Get this answer and more practice on our Intelligent Practice Service
1. 237Y 2. 237Z 3. 2382 4. 2383 5. 2384
www.everythingmaths.co.za m.everythingmaths.co.za
376 9.1. Revision

9.2 Simple and compound depreciation EMBJF
As soon as a new car leaves the dealership, its value decreases and it is considered“second-hand”. Vehicles, equipment, machinery and other similar assets, all losevalue over time as a result of usage and age. This loss in value is called deprecia-tion. Assets that have a relatively long useful lifetime, such as machines, trucks, farm-ing equipment etc., depreciate slower than assets like office equipment, computers,furniture etc. which need to be replaced more often and therefore depreciate morequickly.
Depreciation is used to calculate the value of a company’s assets, which determineshow much tax a company must pay. Companies can take depreciation into account asan expense, and thereby reduce their taxable income. A lower taxable income meansthat the company will pay less income tax to SARS (South African Revenue Service).
We can calculate two different kinds of depreciation: simple decay and compounddecay. Decay is also a term used to describe a reduction or decline in value. Simpledecay is also called straight-line depreciation and compound decay can also be re-ferred to as reducing-balance depreciation. In the straight-line method the value of theasset is reduced by a constant amount each year, which is calculated on the principalamount. In reducing-balance depreciation we calculate the depreciation on the re-duced value of the asset. This means that the value of an asset decreases by a differentamount each year.
Investigation: Simple and compound depreciation
1. Mr. Sontange buys an Opel Fiesta for R 72 000. He expects that the value of thecar will depreciate by R 6000 every year. He draws up a table to calculate thedepreciated value of his Opel Fiesta.
Complete Mr. Sontange’s table of values for the 7 year period:
YearValue at
beginning ofyear
Depreciationamount
Value at end ofyear
1 R 72 000 R 6000 R 66 000
2 R 66 000 R 6000
3
4
5
6
7
2. His son, David, does not agree that the value of the car will reduce by the sameamount each year. David thinks that the car will depreciate by 10% every year.
Complete David’s table of values:
377Chapter 9. Finance, growth and decay

YearValue at
beginning ofyear
Depreciationamount
Value at end ofyear
1 R 72 000 R 7200 R 64 800
2 R 64 800 R 6480
3
4
5
6
7
3. Compare and discuss the results of the two different tables.
4. Consider the graph below, which represents Mr. Sontange’s table of values:
10 000
20 000
30 000
40 000
50 000
60 000
70 000
80 000
1 2 3 4 5 6 7 80 Time (years)
Value (Rands)
a) Draw a similar graph using David’s table of values.
b) Interpret the two graphs and discuss the differences between them.
c) Explain how the graphs can be used to determine the total depreciation ineach case.
d) i. Draw two new graphs by plotting the maximum value of each bar.ii. Join the points with a line to show the general trend.
iii. Is it mathematically correct to join these points? Explain your answer.
378 9.2. Simple and compound depreciation

Simple depreciation EMBJG
Worked example 3: Straight-line depreciation
QUESTION
A new smartphone costs R 6000 and depreciates at 22% p.a. on a straight-line basis.Determine the value of the smartphone at the end of each year over a 4 year period.
SOLUTION
Step 1: Calculate depreciation amount
Depreciation = 6000× 22
100= 1320
Therefore the smartphone depreciates by R 1320 every year.
Step 2: Complete a table of values
YearValue at
beginning ofyear
Depreciationamount
Value at end ofyear
1 R 6000 R 1320 R 46802 R 4680 R 1320 R 33603 R 3360 R 1320 R 20404 R 2040 R 1320 R 720
We notice thatTotal depreciation = P × i× n
where
P = principal amount
i = interest rate written as a decimal
n = time period in years
Therefore the depreciated value of the asset (also called the book value) can be calcu-lated as:
A = P (1− in)
Note the similarity to the simple interest formula A = P (1 + in). Interest increases thevalue of the principal amount, whereas with simple decay, depreciation reduces thevalue of the principal amount.
Important: to get an accurate answer do all calculations in one step on your calculator.Do not round off answers in your calculations until the final answer. In the workedexamples in this chapter, we use dots to show that the answer has not been roundedoff. We always round the final answer to two decimal places (cents).
379Chapter 9. Finance, growth and decay

Worked example 4: Straight-line depreciation method
QUESTION
A car is valued at R 240 000. If it depreciates at 15% p.a. using straight-line deprecia-tion, calculate the value of the car after 5 years.
SOLUTION
Step 1: Write down the known variables and the simple decay formula
P = 240 000
i = 0,15
n = 5
A = P (1− in)
Step 2: Substitute the values and solve for A
A = 240 000(1− 0,15× 5)
= 240 000(0,25)
= 60 000
Step 3: Write the final answer
At the end of 5 years, the car is worth R 60 000.
Worked example 5: Simple decay
QUESTION
A small business buys a photocopier for R 12 000. For the tax return the owner depre-ciates this asset over 3 years using a straight-line depreciation method. What amountwill he fill in on his tax form at the end of each year?
SOLUTION
Step 1: Write down the known variables
The owner of the business wants the photocopier to have a book value of R 0 after 3years.
A = 0
P = 12 000
n = 3
380 9.2. Simple and compound depreciation

Therefore we can calculate the annual depreciation as
Depreciation =P
n
=12 000
3= R 4000
Step 2: Determine the book value at the end of each year
Book value end of first year = 12 000− 4000
= R 8000
Book value end of second year = 8000− 4000
= R 4000
Book value end of third year = 4000− 4000
= R 0
Exercise 9 – 2: Simple decay
1. A business buys a truck for R 560 000. Over a period of 10 years the value ofthe truck depreciates to R 0 using the straight-line method. What is the value ofthe truck after 8 years?
2. Harry wants to buy his grandpa’s donkey for R 800. His grandpa is quite pleasedwith the offer, seeing that it only depreciated at a rate of 3% per year using thestraight-line method. Grandpa bought the donkey 5 years ago. What did grandpapay for the donkey then?
3. Seven years ago, Rocco’s drum kit cost him R 12 500. It has now been valued atR 2300. What rate of simple depreciation does this represent?
4. Fiona buys a DStv satellite dish for R 3000. Due to weathering, its value depre-ciates simply at 15% per annum. After how long will the satellite dish have abook value of zero?
Think you got it? Get this answer and more practice on our Intelligent Practice Service
1. 2385 2. 2386 3. 2387 4. 2388
www.everythingmaths.co.za m.everythingmaths.co.za
381Chapter 9. Finance, growth and decay
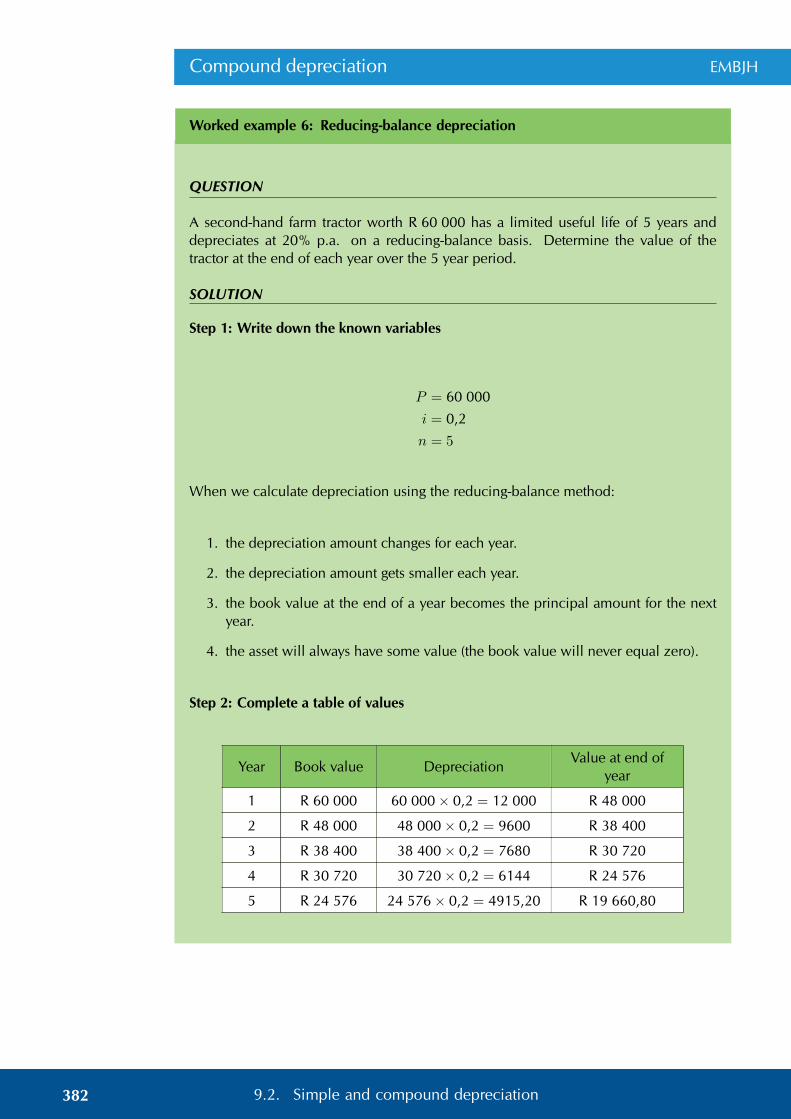
Compound depreciation EMBJH
Worked example 6: Reducing-balance depreciation
QUESTION
A second-hand farm tractor worth R 60 000 has a limited useful life of 5 years anddepreciates at 20% p.a. on a reducing-balance basis. Determine the value of thetractor at the end of each year over the 5 year period.
SOLUTION
Step 1: Write down the known variables
P = 60 000
i = 0,2
n = 5
When we calculate depreciation using the reducing-balance method:
1. the depreciation amount changes for each year.
2. the depreciation amount gets smaller each year.
3. the book value at the end of a year becomes the principal amount for the nextyear.
4. the asset will always have some value (the book value will never equal zero).
Step 2: Complete a table of values
Year Book value DepreciationValue at end of
year
1 R 60 000 60 000× 0,2 = 12 000 R 48 000
2 R 48 000 48 000× 0,2 = 9600 R 38 400
3 R 38 400 38 400× 0,2 = 7680 R 30 720
4 R 30 720 30 720× 0,2 = 6144 R 24 576
5 R 24 576 24 576× 0,2 = 4915,20 R 19 660,80
382 9.2. Simple and compound depreciation

Notice in the example above that we could also write the book value at the end ofeach year as:
Book value end of first year = 60 000(1− 0,2)
Book value end of second year = 48 000(1− 0,2) = 60 000(1− 0,2)2
Book value end of third year = 38 400(1− 0,2) = 60 000(1− 0,2)3
Book value end of fourth year = 30 720(1− 0,2) = 60 000(1− 0,2)4
Book value end of fifth year = 24 576(1− 0,2) = 60 000(1− 0,2)5
Using the formula for simple decay and the observed pattern in the calculation above,we obtain the following formula for compound decay:
A = P (1− i)n
whereA = book value or depreciated value
P = principal amount
i = interest rate written as a decimal
n = time period in years
Again, notice the similarity to the compound interest formula A = P (1 + i)n.
Worked example 7: Reducing-balance depreciation
QUESTION
The number of pelicans at the Berg river mouth is decreasing at a compound rate of12% p.a. If there are currently 3200 pelicans in the wetlands of the Berg river mouth,what will the population be in 5 years?
SOLUTION
Step 1: Write down the known variables and the compound decay formula
P = 3200
i = 0,12
n = 5
A = P (1− i)n
Step 2: Substitute the values and solve for A
A = 3200(1− 0,12)5
= 3200(0,88)5
= 1688,7421 . . .
Step 3: Write the final answer
In 5 years, the pelican population will be approximately 1689.
383Chapter 9. Finance, growth and decay
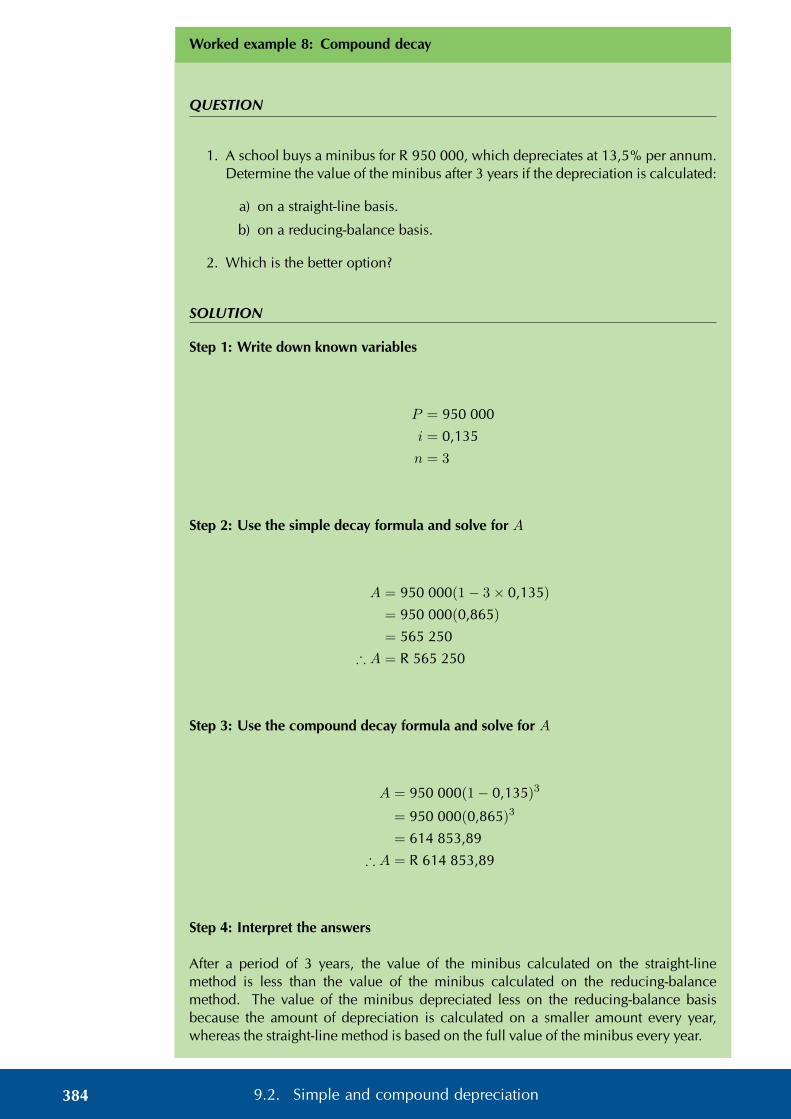
Worked example 8: Compound decay
QUESTION
1. A school buys a minibus for R 950 000, which depreciates at 13,5% per annum.Determine the value of the minibus after 3 years if the depreciation is calculated:
a) on a straight-line basis.
b) on a reducing-balance basis.
2. Which is the better option?
SOLUTION
Step 1: Write down known variables
P = 950 000
i = 0,135
n = 3
Step 2: Use the simple decay formula and solve for A
A = 950 000(1− 3× 0,135)
= 950 000(0,865)
= 565 250
∴ A = R 565 250
Step 3: Use the compound decay formula and solve for A
A = 950 000(1− 0,135)3
= 950 000(0,865)3
= 614 853,89
∴ A = R 614 853,89
Step 4: Interpret the answers
After a period of 3 years, the value of the minibus calculated on the straight-linemethod is less than the value of the minibus calculated on the reducing-balancemethod. The value of the minibus depreciated less on the reducing-balance basisbecause the amount of depreciation is calculated on a smaller amount every year,whereas the straight-line method is based on the full value of the minibus every year.
384 9.2. Simple and compound depreciation

Worked example 9: Compound depreciation
QUESTION
Farmer Jack bought a tractor and it has depreciated by 20% p.a. on a reducing-balancebasis. If the current value of the tractor is R 52 429, calculate how much Farmer Jackpaid for his tractor if he bought it 7 years ago.
SOLUTION
Step 1: Write down known variables and compound decay formula
A = 52 429
i = 0,2
n = 7
A = P (1− i)n
Step 2: Substitute the values and solve for P
52 429 = P (1− 0,2)7
= P (0,8)7
∴ P =52 429(0,8)7
= 250 000,95 . . .
Step 3: Write the final answer
7 years ago, Farmer Jack paid R 250 000 for his tractor.
Exercise 9 – 3: Compound depreciation
1. Jwayelani buys a truck for R 89 000 and depreciates it by 9% p.a. using thecompound depreciation method. What is the value of the truck after 14 years?
2. The number of cormorants at the Amanzimtoti river mouth is decreasing at acompound rate of 8% p.a. If there are now 10 000 cormorants, how many willthere be in 18 years’ time?
3. On January 1, 2008 the value of my Kia Sorento is R 320 000. Each year afterthat, the car’s value will decrease 20% of the previous year’s value. What is thevalue of the car on January 1, 2012?
385Chapter 9. Finance, growth and decay

4. The population of Bonduel decreases at a reducing-balance rate of 9,5% perannum as people migrate to the cities. Calculate the decrease in population overa period of 5 years if the initial population was 2 178 000.
5. A 20 kg watermelon consists of 98% water. If it is left outside in the sun it loses3% of its water each day. How much does it weigh after a month of 31 days?
6. Richard bought a car 15 years ago and it depreciated by 17% p.a. on a com-pound depreciation basis. How much did he pay for the car if it is now worthR 5256?
Think you got it? Get this answer and more practice on our Intelligent Practice Service
1. 2389 2. 238B 3. 238C 4. 238D 5. 238F 6. 238G
www.everythingmaths.co.za m.everythingmaths.co.za
Finding i EMBJJ
Worked example 10: Finding i for simple decay
QUESTION
After 4 years, the value of a computer is halved. Assuming simple decay, at whatannual rate did it depreciate? Give your answer correct to two decimal places.
SOLUTION
Step 1: Write down known variables and simple decay formula
Let the value of the computer be x, therefore:
A =x
2P = x
n = 4
A = P (1− in)
Step 2: Substitute the values and solve for i
386 9.2. Simple and compound depreciation

x
2= x(1− 3i)
1
2= 1− 3i
∴ 3i = 1− 1
2∴ i = 0,1667
Step 3: Write the final answer
The computer depreciated at a rate of 16,67% p.a.
Worked example 11: Finding i for compound decay
QUESTION
Cristina bought a fridge at the beginning of 2009 for R 8999 and sold it at the endof 2011 for R 4500. At what rate did the value of her fridge depreciate assuming areducing-balance method? Give your answer correct to two decimal places.
SOLUTION
Step 1: Write down known variables and compound decay formula
A = 4500
P = 8999
n = 3
A = P (1− i)n
Step 2: Substitute the values and solve for i
4500 = 8999(1− i)3
45008999
= (1− i)3
3
√45008999
= 1− i
∴ i = 1− 3
√45008999
= 0,206
Step 3: Write the final answer
Cristina’s fridge depreciated at a rate of 20,6% p.a.
387Chapter 9. Finance, growth and decay
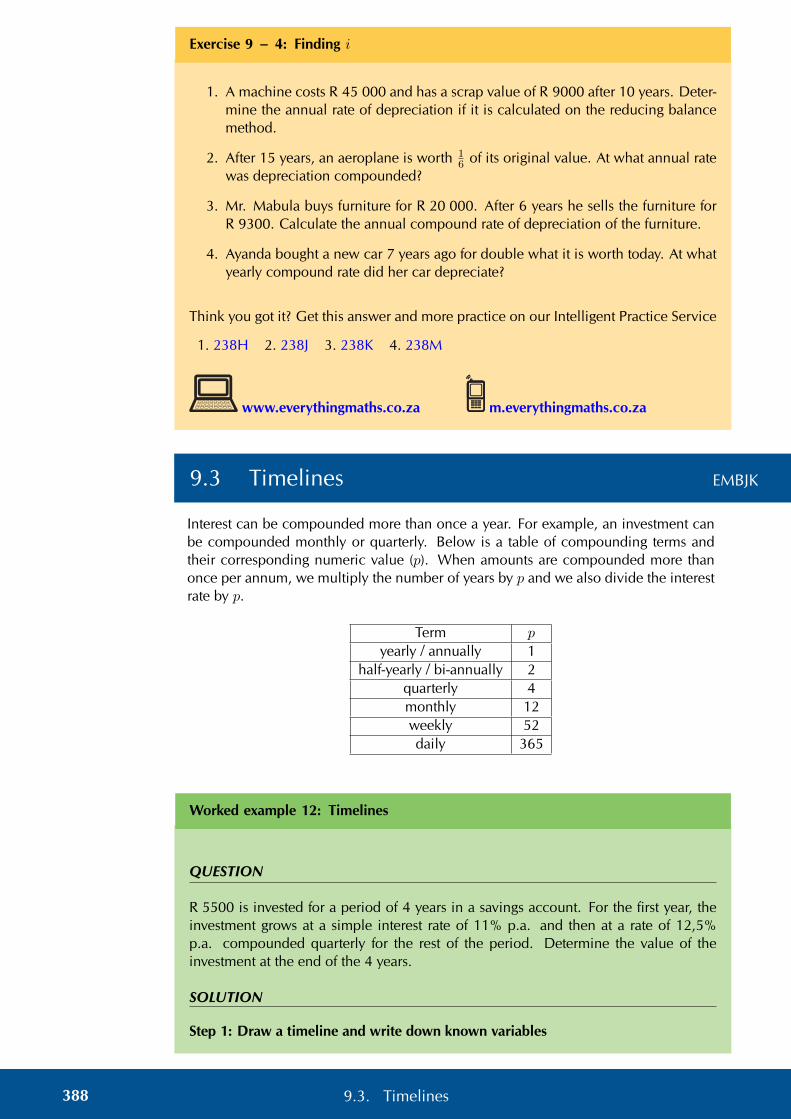
Exercise 9 – 4: Finding i
1. A machine costs R 45 000 and has a scrap value of R 9000 after 10 years. Deter-mine the annual rate of depreciation if it is calculated on the reducing balancemethod.
2. After 15 years, an aeroplane is worth 16 of its original value. At what annual rate
was depreciation compounded?
3. Mr. Mabula buys furniture for R 20 000. After 6 years he sells the furniture forR 9300. Calculate the annual compound rate of depreciation of the furniture.
4. Ayanda bought a new car 7 years ago for double what it is worth today. At whatyearly compound rate did her car depreciate?
Think you got it? Get this answer and more practice on our Intelligent Practice Service
1. 238H 2. 238J 3. 238K 4. 238M
www.everythingmaths.co.za m.everythingmaths.co.za
9.3 Timelines EMBJK
Interest can be compounded more than once a year. For example, an investment canbe compounded monthly or quarterly. Below is a table of compounding terms andtheir corresponding numeric value (p). When amounts are compounded more thanonce per annum, we multiply the number of years by p and we also divide the interestrate by p.
Term p
yearly / annually 1half-yearly / bi-annually 2
quarterly 4monthly 12weekly 52daily 365
Worked example 12: Timelines
QUESTION
R 5500 is invested for a period of 4 years in a savings account. For the first year, theinvestment grows at a simple interest rate of 11% p.a. and then at a rate of 12,5%p.a. compounded quarterly for the rest of the period. Determine the value of theinvestment at the end of the 4 years.
SOLUTION
Step 1: Draw a timeline and write down known variables
388 9.3. Timelines

T0 T1 T2 T3 T4
11% p.a. simple interest 12,5% p.a. compounded quarterly
R 5500
In the timeline above, the intervals are given in years. For example, T0 is the start ofthe investment, T1 is the end of the first year and T4 is the end of the fourth year.
Step 2: Use the simple interest formula to calculate A at T1
A = P (1 + in)
= 5500(1 + 0,11)
= R 6105
Step 3: Use the compound interest formula to calculate A at T4
The investment is compounded quarterly, therefore:
n = 3× 4
= 12
and i =0,125
4
Also notice that the accumulated amount at the end of the first year becomes theprincipal amount at the beginning of the second year.
A = P (1 + i)n
= 6105(
1 +0,125
4
)12
= R 8831,88
Step 4: Write the final answer
The value of the investment at the end of the 4 years is R 8831,88.
389Chapter 9. Finance, growth and decay

Worked example 13: Timelines
QUESTION
R 150 000 is deposited in an investment account for a period of 6 years at an interestrate of 12% p.a. compounded half-yearly for the first 4 years and then 8,5% p.a.compounded yearly for the rest of the period. A deposit of R 8000 is made into theaccount after the first year and then another deposit of R 2000 is made 5 years afterthe initial investment. Calculate the value of the investment at the end of the 6 years.
SOLUTION
Step 1: Draw a timeline and write down known variables
T0 T1 T2 T3 T4
8,5% p.a. compounded yearly
R 15 000
T5 T6
12% p.a. compounded half-yearly
+R 8000 +R 2000
Remember to show when the additional deposits of R 8000 and R 2000 where madeinto the account. It is very important to note that the interest rate changes at T4.
We break this question down into parts and consider each amount separately.
Step 2: The initial deposit at T0
Between T0 and T4:
We notice that interest for the first 4 years is compounded half-yearly, therefore:
n1 = 4× 2
= 8
and i1 =0,12
2
Between T4 and T6:
n2 = 2
and i2 = 0,085
Therefore the total growth of the initial deposit over the 6 years is:
A = P (1 + i1)n1(1 + i2)
n2
= 150 000(
1 +0,12
2
)8
(1 + 0,085)2
Step 3: The deposit at T1
Between T1 and T4:
390 9.3. Timelines

Interest on this deposit is compounded half-yearly for 3 years, therefore:
n3 = 3× 2
= 6
and i3 =0,12
2
Between T4 and T6:
n4 = 2
and i4 = 0,085
Therefore the total growth of the deposit over the 5 years is:
A = P (1 + i3)n3(1 + i4)
n4
= 8000(
1 +0,12
2
)6
(1 + 0,085)2
Step 4: The deposit at T5
Accumulate interest for only 1 year:
A = P (1 + i)n
= 2000(1 + 0,085)1
Step 5: Determine the total calculation
To get as accurate an answer as possible, we do the the calculation on the calculatorin one step. Using the memory and answer recall function on the calculator, we avoidrounding off until we get the final answer.
A = 150 000(
1 +0,12
2
)8
(1 + 0,085)2
+ 8000(
1 +0,12
2
)6
(1 + 0,085)2 + 2000(1 + 0,085)1
= R 296 977,00
Step 6: Write the final answer
The value of the investment at the end of the 6 years is R 296 977,00.
391Chapter 9. Finance, growth and decay

Worked example 14: Timelines
QUESTION
R 60 000 is invested in an account which offers interest at 7% p.a. compoundedquarterly for the first 18 months. Thereafter the interest rate changes to 5% p.a. com-pounded monthly. Three years after the initial investment, R 5000 is withdrawn fromthe account. How much will be in the account at the end of 5 years?
SOLUTION
Step 1: Draw a timeline and write down known variables
T0 T1 T2 T3 T4
5% p.a. compounded monthly
R 60 000
T5
7% p.a. compounded quarterly
−R 5000
Remember to show when the withdrawal of R 5000 was taken out of the account. It isalso important to note that the interest rate changes after 18 months (T1 1
2).
We break this question down into parts and consider each amount separately.
Step 2: The initial deposit at T0
Interest for the first 1,5 years is compounded quarterly, therefore:
n1 = 1,5× 4
= 6
and i1 =0,07
4
Interest for the remaining 3,5 years is compounded monthly, therefore:
n2 = 3,5× 12
= 42
and i2 =0,0512
Therefore the total growth of the initial deposit over the 5 years is:
A = P (1 + i1)n1(1 + i2)
n2
= 60 000(
1 +0,07
4
)6(1 +
0,0512
)42
392 9.3. Timelines

Step 3: The withdrawal at T3
We calculate the interest that the R 5000 would have earned if it had remained in theaccount:
n = 2× 12
= 24
and i =0,0512
Therefore we have that:
A = P (1 + i)n
= 5000(
1 +0,0512
)24
Step 4: Determine the total calculation
We subtract the withdrawal and the interest it would have earned from the accumu-lated amount at the end of the 5 years:
A = 60 000(
1 +0,07
4
)6(1 +
0,0512
)42
− 5000(
1 +0,0512
)24
= R 73 762,19
Step 5: Write the final answer
The value of the investment at the end of the 5 years is R 73 762,19.
Exercise 9 – 5: Timelines
1. After a 20-year period Josh’s lump sum investment matures to an amount ofR 313 550. How much did he invest if his money earned interest at a rate of13,65% p.a. compounded half yearly for the first 10 years, 8,4% p.a. com-pounded quarterly for the next five years and 7,2% p.a. compounded monthlyfor the remaining period?
2. Sindisiwe wants to buy a motorcycle. The cost of the motorcycle is R 55 000.In 1998 Sindisiwe opened an account at Sutherland Bank with R 16 000. Thenin 2003 she added R 2000 more into the account. In 2007 Sindisiwe madeanother change: she took R 3500 from the account. If the account pays 6% p.a.compounded half-yearly, will Sindisiwe have enough money in the account atthe end of 2012 to buy the motorcycle?
3. A loan has to be returned in two equal semi-annual instalments. If the rate ofinterest is 16% per annum, compounded semi-annually and each instalment isR 1458, find the sum borrowed.
393Chapter 9. Finance, growth and decay

4. A man named Phillip invests R 10 000 into an account at North Bank at aninterest rate of 7,5% p.a. compounded monthly. After 5 years the bank changesthe interest rate to 8% p.a. compounded quarterly. How much money willPhillip have in his account 9 years after the original deposit?
5. R 75 000 is invested in an account which offers interest at 11% p.a. com-pounded monthly for the first 24 months. Then the interest rate changes to7,7% p.a. compounded half-yearly. If R 9000 is withdrawn from the accountafter one year and then a deposit of R 3000 is made three years after the initialinvestment, how much will be in the account at the end of 6 years?
6. Christopher wants to buy a computer, but right now he doesn’t have enoughmoney. A friend told Christopher that in 5 years the computer will cost R 9150.He decides to start saving money today at Durban United Bank. Christopherdeposits R 5000 into a savings account with an interest rate of 7,95% p.a. com-pounded monthly. Then after 18 months the bank changes the interest rateto 6,95% p.a. compounded weekly. After another 6 months, the interest ratechanges again to 7,92% p.a. compounded two times per year. How muchmoney will Christopher have in the account after 5 years, and will he then haveenough money to buy the computer?
Think you got it? Get this answer and more practice on our Intelligent Practice Service
1. 238N 2. 238P 3. 238Q 4. 238R 5. 238S 6. 238T
www.everythingmaths.co.za m.everythingmaths.co.za
9.4 Nominal and effective interest rates EMBJM
We have seen that although interest is quoted as a percentage per annum it can becompounded more than once a year. We therefore need a way of comparing interestrates. For example, is an annual interest rate of 8% compounded quarterly higher orlower than an interest rate of 8% p.a. compounded yearly?
Investigation: Nominal and effective interest rates
1. Calculate the accumulated amount at the end of one year if R 1000 is investedat 8% p.a. compound interest:
A = P (1 + i)n
= . . . . . .
2. Calculate the value of R 1000 if it is invested for one year at 8% p.a. com-pounded:
394 9.4. Nominal and effective interest rates

Frequency Calculation Accumulatedamount
Interestamount
half-yearly A = 1000(
1 + 0,082
)1×2R 1081,60 R 81,60
quarterly
monthly
weekly
daily
3. Use your results from the table above to calculate the effective rate that theinvestment of R 1000 earns in one year:
Frequency Accumulatedamount
CalculationEffectiveinterest
rate
half-yearly R 1081,60
1081,60 = 1000(1 + i)
1081,601000
= 1 + i
1081,601000
− 1 = i
∴ i = 0,0816
i = 8,16%
quarterly
monthly
weekly
daily
4. If you wanted to borrow R 10 000 from the bank, would it be better to pay itback at an interest rate of 22% p.a. compounded quarterly or 22% compoundedmonthly? Show your calculations.
An interest rate compounded more than once a year is called the nominal interest rate.In the investigation above, we determined that the nominal interest rate of 8% p.a.compounded half-yearly is actually an effective rate of 8,16% p.a.
Given a nominal interest rate i(m) compounded at a frequency of m times per yearand the effective interest rate i, the accumulated amount calculated using both interestrates will be equal so we can write:
P (1 + i) = P
(1 +
i(m)
m
)m
∴ 1 + i =
(1 +
i(m)
m
)m
395Chapter 9. Finance, growth and decay

Worked example 15: Nominal and effective interest rates
QUESTION
Interest on a credit card is quoted as 23% p.a. compounded monthly. What is theeffective annual interest rate? Give your answer correct to two decimal places.
SOLUTION
Step 1: Write down the known variables
Interest is being added monthly, therefore:
m = 12
i(12) = 0,23
1 + i =
(1 +
i(m)
m
)m
Step 2: Substitute values and solve for i
1 + i =
(1 +
0,2312
)12
∴ i = 1−(
1 +0,2312
)12
= 25,59%
Step 3: Write the final answer
The effective interest rate is 25,59% per annum.
Worked example 16: Nominal and effective interest rates
QUESTION
Determine the nominal interest rate compounded quarterly if the effective interest rateis 9% per annum (correct to two decimal places).
SOLUTION
Step 1: Write down the known variables
396 9.4. Nominal and effective interest rates

Interest is being added quarterly, therefore:
m = 4
i = 0,09
1 + i =
(1 +
i(m)
m
)m
Step 2: Substitute values and solve for i(m)
1 + 0,09 =
(1 +
i(4)
4
)4
4√
1,09 = 1 +i(4)
4
4√
1,09− 1 =i(4)
4
4(
4√
1,09− 1)
= i(4)
∴ i(4) = 8,71%
Step 3: Write the final answer
The nominal interest rate is 8,71% p.a. compounded quarterly.
Exercise 9 – 6: Nominal and effect interest rates
1. Determine the effective annual interest rate if the nominal interest rate is:
a) 12% p.a. compounded quarterly.
b) 14,5% p.a. compounded weekly.
c) 20% p.a. compounded daily.
2. Consider the following:
• 16,8% p.a. compounded annually.
• 16,4% p.a. compounded monthly.
• 16,5% p.a. compounded quarterly.
a) Determine the effective annual interest rate of each of the nominal rateslisted above.
b) Which is the best interest rate for an investment?
c) Which is the best interest rate for a loan?
397Chapter 9. Finance, growth and decay

3. Calculate the effective annual interest rate equivalent to a nominal interest rateof 8,75% p.a. compounded monthly.
4. Cebela is quoted a nominal interest rate of 9,15% per annum compounded everyfour months on her investment of R 85 000. Calculate the effective rate perannum.
5. Determine which of the following would be the better agreement for paying backa student loan:
a) 9,1% p.a. compounded quarterly.
b) 9% p.a. compounded monthly.
c) 9,3% p.a. compounded half-yearly.
6. Miranda invests R 8000 for 5 years for her son’s study fund. Determine howmuch money she will have at the end of the period and the effective annualinterest rate if the nominal interest of 6% is compounded:
CalculationAccumulated
amountEffective annual
interest rate
yearly
half-yearly
quarterly
monthly
Think you got it? Get this answer and more practice on our Intelligent Practice Service
1a. 238V 1b. 238W 1c. 238X 2. 238Y 3. 238Z 4. 23925. 2393 6. 2394
www.everythingmaths.co.za m.everythingmaths.co.za
9.5 Summary EMBJN
See presentation: 2395 at www.everythingmaths.co.za
• Simple interest: A = P (1 + in)
• Compound interest: A = P (1 + i)n
• Simple depreciation: A = P (1− in)
• Compound depreciation: A = P (1− i)n
• Nominal and effective annual interest rates: 1 + i =(
1 + i(m)
m
)m
398 9.5. Summary

Exercise 9 – 7: End of chapter exercises
1. Thabang buys a Mercedes worth R 385 000 in 2007. What will the value of theMercedes be at the end of 2013 if:
a) the car depreciates at 6% p.a. straight-line depreciation.
b) the car depreciates at 6% p.a. reducing-balance depreciation.
2. Greg enters into a 5-year hire-purchase agreement to buy a computer for R 8900.The interest rate is quoted as 11% per annum based on simple interest. Calculatethe required monthly payment for this contract.
3. A computer is purchased for R 16 000. It depreciates at 15% per annum.
a) Determine the book value of the computer after 3 years if depreciation iscalculated according to the straight-line method.
b) Find the rate according to the reducing-balance method that would yield,after 3 years, the same book value as calculated in the previous question.
4. Maggie invests R 12 500 for 5 years at 12% per annum compounded monthlyfor the first 2 years and 14% per annum compounded semi-annually for the next3 years. How much will Maggie receive in total after 5 years?
5. Tintin invests R 120 000. He is quoted a nominal interest rate of 7,2% per an-num compounded monthly.
a) Calculate the effective rate per annum (correct to two decimal places).
b) Use the effective rate to calculate the value of Tintin’s investment if heinvested the money for 3 years.
c) Suppose Tintin invests his money for a total period of 4 years, but after 18months makes a withdrawal of R 20 000, how much will he receive at theend of the 4 years?
6. Ntombi opens accounts at a number of clothing stores and spends freely. Shegets herself into terrible debt and she cannot pay off her accounts. She owesFashion World R 5000 and the shop agrees to let her pay the bill at a nominalinterest rate of 24% compounded monthly.
a) How much money will she owe Fashion World after two years?
b) What is the effective rate of interest that Fashion World is charging her?
7. John invests R 30 000 in the bank for a period of 18 months. Calculate howmuch money he will have at the end of the period and the effective annualinterest rate if the nominal interest of 8% is compounded:
CalculationAccumulated
amountEffective annual
interest rate
yearly
half-yearly
quarterly
monthly
daily
399Chapter 9. Finance, growth and decay

8. Convert an effective annual interest rate of 11,6% p.a. to a nominal interest ratecompounded:
a) half-yearly
b) quarterly
c) monthly
9. Joseph must sell his plot on the West Coast and he needs to get R 300 000 on thesale of the land. If the estate agent charges him 7% commission on the sellingprice, what must the buyer pay for the plot?
10. Mrs. Brown retired and received a lump sum of R 200 000. She deposited themoney in a fixed deposit savings account for 6 years. At the end of the 6 yearsthe value of the investment was R 265 000. If the interest on her investment wascompounded monthly, determine:
a) the nominal interest rate per annum
b) the effective annual interest rate
11. R 145 000 is invested in an account which offers interest at 9% p.a. com-pounded half-yearly for the first 2 years. Then the interest rate changes to 4%p.a. compounded quarterly. Four years after the initial investment, R 20 000 iswithdrawn. 6 years after the initial investment, a deposit of R 15 000 is made.Determine the balance of the account at the end of 8 years.
Think you got it? Get this answer and more practice on our Intelligent Practice Service
1. 2396 2. 2397 3. 2398 4. 2399 5. 239B 6. 239C7. 239D 8. 239F 9. 239G 10. 239H 11. 239J
www.everythingmaths.co.za m.everythingmaths.co.za
400 9.5. Summary

CHAPTER 10
Probability
10.1 Revision 402
10.2 Dependent and independent events 411
10.3 More Venn diagrams 419
10.4 Tree diagrams 426
10.5 Contingency tables 431
10.6 Summary 435
10 Probability
10.1 Revision EMBJP
Terminology EMBJQ
Outcome: a single observation of an uncertain or random process (called an experi-ment). For example, when you accidentally drop a book, it might fall on its cover, onits back or on its side. Each of these options is a possible outcome.
Sample space of an experiment: the set of all possible outcomes of the experiment. Forexample, the sample space when you roll a single 6-sided die is the set {1; 2; 3; 4; 5; 6}.For a given experiment, there is exactly one sample space. The sample space is de-noted by the letter S.
Event: a set of outcomes of an experiment. For example, during radioactive decay of1 gramme of uranium-234, one possible event is that the number of alpha-particlesemitted during 1 microsecond is between 225 and 235.
Probability of an event: a real number between 0 and 1 that describes how likely itis that the event will occur. A probability of 0 means the outcome of the experimentwill never be in the event set. A probability of 1 means the outcome of the experimentwill always be in the event set. When all possible outcomes of an experiment haveequal chance of occurring, the probability of an event is the number of outcomes inthe event set as a fraction of the number of outcomes in the sample space.
Relative frequency of an event: the number of times that the event occurs duringexperimental trials, divided by the total number of trials conducted. For example, ifwe flip a coin 10 times and it landed on heads 3 times, then the relative frequency ofthe heads event is 3
10 = 0,3.
Union of events: the set of all outcomes that occur in at least one of the events. For2 events called A and B, we write the union as “A or B”. Another way of writing theunion is using set notation: A ∪B.
Intersection of events: the set of all outcomes that occur in all of the events. For 2events called A and B, we write the intersection as “A and B”. Another way of writingthe intersection is using set notation: A ∩B.
Mutually exclusive events: events with no outcomes in common, that is (A and B) =∅. Mutually exclusive events can never occur simultaneously. For example the eventthat a number is even and the event that the same number is odd are mutually exclu-sive, since a number can never be both even and odd.
Complementary events: two mutually exclusive events that together contain all theoutcomes in the sample space. For an event called A, we write the complement as“not A”. Another way of writing the complement is as A′.
See video: 239K at www.everythingmaths.co.za
402 10.1. Revision
Identities EMBJR
The addition rule (also called the sum rule) for any 2 events, A and B is
P (A or B) = P (A) + P (B)− P (A and B)
This rule relates the probabilities of 2 events with the probabilities of their union andintersection.
The addition rule for 2 mutually exclusive events is
P (A or B) = P (A) + P (B)
This rule is a special case of the previous rule. Because the events are mutually exclu-sive, P (A and B) = 0.
The complementary rule is
P (not A) = 1− P (A)
This rule is a special case of the previous rule. Since A and (not A) are mutuallyexclusive, P (A or (not A)) = 1.
See video: 239M at www.everythingmaths.co.za
Worked example 1: Events
QUESTION
You take all the hearts from a deck of cards. You then select a random card from the setof hearts. What is the sample space? What is the probability of each of the followingevents?
1. The card is the ace of hearts.
2. The card has a prime number on it.
3. The card has a letter of the alphabet on it.
SOLUTION
Step 1: Write down the sample space
Since we are considering only one suit from the deck of cards (the hearts), we need towrite down only the letters and numbers on the cards. Therefore the sample space is
S = {A; 2; 3; 4; 5; 6; 7; 8; 9; 10; J; Q; K}
Step 2: Write down the event sets
• ace of hearts: {A}
• prime number: {2; 3; 5; 7}
• letter of alphabet: {A; J; Q; K}
403Chapter 10. Probability

Step 3: Compute the probabilities
The probability of an event is defined as the number of elements in the event setdivided by the number of elements in the sample space. There are 13 elements in thesample space. So the probability of each event is
• ace of hearts: 113
• prime number: 413
• letter of alphabet: 413
Worked example 2: Events
QUESTION
You roll two 6-sided dice. Let E be the event that the total number of dots on the diceis 10. Let F be the event that at least one die is a 3.
1. Write down the event sets for E and F .
2. Determine the probabilities for E and F .
3. Are E and F mutually exclusive? Why or why not?
SOLUTION
Step 1: Write down the sample space
The sample space of a single 6-sided die is just {1; 2; 3; 4; 5; 6}. To get the samplespace of two 6-sided dice, we have to take every possible pair of numbers from 1 to 6.
S =
(1; 1) (1; 2) (1; 3) (1; 4) (1; 5) (1; 6)(2; 1) (2; 2) (2; 3) (2; 4) (2; 5) (2; 6)(3; 1) (3; 2) (3; 3) (3; 4) (3; 5) (3; 6)(4; 1) (4; 2) (4; 3) (4; 4) (4; 5) (4; 6)(5; 1) (5; 2) (5; 3) (5; 4) (5; 5) (5; 6)(6; 1) (6; 2) (6; 3) (6; 4) (6; 5) (6; 6)
Step 2: Write down the events
For E the dice have to add to 10.
E = {(4; 6); (5; 5); (6; 4)}
For F at least one die has to be 3.
F = {(1; 3); (3; 1); (2; 3); (3; 2); (3; 3); (4; 3); (3; 4); (5; 3); (3; 5); (6; 3); (3; 6)}
404 10.1. Revision

Step 3: Compute the probabilities
The probability of an event is defined as the number of elements in the event setdivided by the number of elements in the sample space. There are
• 6× 6 = 36 outcomes in the sample space, S;
• 3 outcomes in event E; and
• 11 outcomes in event F .
ThereforeP (E) =
3
36=
1
12
andP (F ) =
11
36
Step 4: Are they mutually exclusive
To test whether two events are mutually exclusive, we have to test whether their in-tersection is empty. Since E has no outcomes that contain a 3 on one of the dice,the intersection of E and F is empty: (E and F ) = ∅. This means that the events aremutually exclusive.
See video: 239N at www.everythingmaths.co.za
Exercise 10 – 1: Revision
1. A bag contains r red balls, b blue balls and y yellow balls. What is the probabilitythat a ball drawn from the bag at random is yellow?
2. A packet has yellow and pink sweets. The probability of taking out a pink sweetis 7
12 . What is the probability of taking out a yellow sweet?
3. You flip a coin 4 times. What is the probability that you get 2 heads and 2 tails?Write down the sample space and the event set to determine the probability ofthis event.
4. In a class of 37 children, 15 children walk to school, 20 children have pets athome and 12 children who have a pet at home also walk to school. How manychildren walk to school and do not have a pet at home?
5. You roll two 6-sided dice and are interested in the following two events:
• A: the sum of the dice equals 8
• B: at least one of the dice shows a 1
Show that these events are mutually exclusive.
405Chapter 10. Probability

6. You ask a friend to think of a number from 1 to 100. You then ask her thefollowing questions:
• Is the number even?
• Is the number divisible by 7?
How many possible numbers are less than 80 if she answered “yes” to bothquestions?
7. In a group of 42 pupils, all but 3 had a packet of chips or a Fanta or both. If 23had a packet of chips and 7 of these also had a Fanta, what is the probability thatone pupil chosen at random has:
a) both chips and Fanta
b) only Fanta
8. Tamara has 18 loose socks in a drawer. Eight of these are orange and two arepink. Calculate the probability that the first sock taken out at random is:
a) orange
b) not orange
c) pink
d) not pink
e) orange or pink
f) neither orange nor pink
9. A box contains coloured blocks. The number of blocks of each colour is givenin the following table.
Colour Purple Orange White PinkNumber of blocks 24 32 41 19
A block is selected randomly. What is the probability that the block will be:
a) purple
b) purple or white
c) pink and orange
d) not orange?
10. The surface of a soccer ball is made up of 32 faces. 12 faces are regular pen-tagons, each with a surface area of about 37 cm2. The other 20 faces are regularhexagons, each with a surface area of about 56 cm2.
You roll the soccer ball. What is the probability that it stops with a pentagontouching the ground?
Think you got it? Get this answer and more practice on our Intelligent Practice Service
1. 239P 2. 239Q 3. 239R 4. 239S 5. 239T 6. 239V7. 239W 8. 239X 9. 239Y 10. 239Z
www.everythingmaths.co.za m.everythingmaths.co.za
406 10.1. Revision

Venn diagrams EMBJS
A Venn diagram is used to show how events are related to one another. A Venndiagram can be very helpful when doing calculations with probabilities. In a Venndiagram each event is represented by a shape, often a circle or a rectangle. The regioninside the shape represents the outcomes included in the event and the region outsidethe shape represents the outcomes that are not in the event.
S
A
B
A and B
A Venn diagram representing a sample space, S, as a square; and two events, A andB, as circles. The intersection of the two circles contains outcomes that are in both Aand B.
Venn diagrams can be used in slightly different ways and it is important to notice thedifferences between them. The following 3 examples show how a Venn diagram isused to represent
• the outcomes included in each event;
• the number of outcomes in each event; and
• the probability of each event.
Worked example 3: Venn diagrams with outcomes
QUESTION
Choose a number between 1 and 20. Draw a Venn diagram to answer the followingquestions.
1. What is the probability that the number is a multiple of 3?
2. What is the probability that the number is a multiple of 5?
3. What is the probability that the number is a multiple of 3 or 5?
4. What is the probability that the number is a multiple of 3 and 5?
SOLUTION
Step 1: Draw a Venn diagram
The Venn diagram should show the sample space of all numbers from 1 to 20. It shouldalso show an event set that contains all the multiples of 3, let A = {3; 6; 9; 12; 15; 18},
407Chapter 10. Probability

and another event set that contains all the multiples of 5, let B = {5; 10; 15; 20}. Notethat there is one shared outcome between these two events, namely 15.
3
18
15
129
610
20
5
12 4 7
8
11131416
17
19
Step 2: Compute probabilities
The probability of an event is the number of outcomes in the event set divided by thenumber of outcomes in the sample space. There are 20 outcomes in the sample space.
1. Since there are 6 outcomes in the multiples of 3 event set, the probability of amultiple of 3 is P (A) = 6
20 = 310 .
2. Since there are 4 outcomes in the multiples of 5 event set, the probability of amultiple of 5 is P (B) = 4
20 = 15 .
3. The event that the number is a multiple of 3 or 5 is the union of the above twoevent sets. There are 9 elements in the union of the event sets, so the probabilityis 9
20 .
4. The event that the number is a multiple of 3 and 5 is the intersection of thetwo event sets. There is 1 element in the intersection of the event sets, so theprobability is 1
20 .
Worked example 4: Venn diagrams with counts
QUESTION
In a group of 50 learners, 35 take Mathematics and 30 take History, while 12 takeneither of the two subjects. Draw a Venn diagram representing this information. If alearner is chosen at random from this group, what is the probability that he takes bothMathematics and History?
SOLUTION
Step 1: Draw outline of Venn diagram
There are 2 events in this question, namely
• M : that a learner takes Mathematics; and
• H: that a learner takes History.
408 10.1. Revision

We need to do some calculations before drawing the full Venn diagram, but with theinformation above we can already draw the outline.
S
M H
Step 2: Write down sizes of the event sets, their union and intersection
We are told that 12 learners take neither of the two subjects. Graphically we canrepresent this as:
S
M H
12
Since there are 50 elements in the sample space, we can see from this figure that thereare 50− 12 = 38 elements in (M or H). So far we know
• n(M) = 35
• n(H) = 30
• n(M or H) = 38
From the addition rule,
n(M or H) = n(M) + n(H)− n(M and H)
∴ n(M and H) = 35 + 30− 38
= 27
Step 3: Draw the final Venn diagram
S
M H
12
278 3
409Chapter 10. Probability

Worked example 5: Venn diagrams with probabilities
QUESTION
Draw a Venn diagram to represent the same information as in the previous example,except showing the probabilities of the different events, rather than the counts.
If a learner is chosen at random from this group, what is the probability that she takesboth Mathematics and History?
SOLUTION
Step 1: Use counts to compute probabilities
Since there are 50 elements (learners) in the sample space, we can compute the prob-ability of any event by dividing the size of the event set by 50. This gives the followingprobabilities:
• P (M) = 3550 = 7
10
• P (H) = 3050 = 3
5
• P (M or H) = 3850 = 19
25
• P (M and H) = 2750
Step 2: Draw the Venn diagram
Next we replace each count from the Venn diagram in the previous example with aprobability.
S
M H
625
2750
425
350
Step 3: Find the answer
The probability that a random learner will take both Mathematics and History isP (M and H) = 27
50 .
See video: 23B2 at www.everythingmaths.co.za
410 10.1. Revision

Exercise 10 – 2: Venn diagram revision
1. Given the following information:
• P (A) = 0,3
• P (B and A) = 0,2
• P (B) = 0,7
First draw a Venn diagram to represent this information. Then compute the valueof P (B and (not A)).
2. You are given the following information:
• P (A) = 0,5
• P (A and B) = 0,2
• P (not B) = 0,6
Draw a Venn diagram to represent this information and determine P (A or B).
3. A study was undertaken to see how many people in Port Elizabeth owned eithera Volkswagen or a Toyota. 3% owned both, 25% owned a Toyota and 60%owned a Volkswagen. What percentage of people owned neither car?
4. Let S denote the set of whole numbers from 1 to 15, X denote the set of evennumbers from 1 to 15 and Y denote the set of prime numbers from 1 to 15.Draw a Venn diagram depicting S, X and Y .
Think you got it? Get this answer and more practice on our Intelligent Practice Service
1. 23B3 2. 23B4 3. 23B5 4. 23B6
www.everythingmaths.co.za m.everythingmaths.co.za
10.2 Dependent and independent events EMBJT
Sometimes the presence or absence of one event tells us something about other events.We call events dependent if knowing whether one of them happened tells us some-thing about whether the others happened. Independent events give us no informationabout one another; the probability of one event occurring does not affect the probabil-ity of the other events occurring.
DEFINITION: Independent events
Two events, A and B are independent if and only if
P (A and B) = P (A)× P (B)
At first it might not be clear why we should call events that satisfy the equation aboveindependent. We will explore this further using a number of examples.
411Chapter 10. Probability

Investigation: Independence
Roll a single 6-sided die and consider the following two events:
• E: you get an even number
• T : you get a number that is divisible by three
Now answer the following questions:
• What is the probability of E?
• What is the probability of getting an even number if you are told that the numberwas also divisible by three?
• Does knowing that the number was divisible by three change the probability thatthe number was even?
Are the events E and T dependent or independent according to the definition (hint:compute the probabilities in the definition of independence)?
See video: 23B7 at www.everythingmaths.co.za
So, why do we call it independence when P (A and B) = P (A) × P (B)? For twoevents, A and B, independence means that knowing the outcome of B does not affectthe probability of A.
Consider the following Venn diagram.
S
A B
A and B
The probability of A is the ratio between the number of outcomes in A and the numberof outcomes in the sample space, S.
P (A) =n(A)
n(S)
412 10.2. Dependent and independent events

Now, let’s say that we know that event B happened. How does this affect the proba-bility of A? Here is how the Venn diagram changes:
S
A B
A and B
A lot of the possible outcomes (all of the outcomes outside B) are now out of the pic-ture, because we know that they did not happen. Now the probability of A happening,given that we know that B happened, is the ratio between the size of the region whereA is present (A and B) and the size of all possible events (B).
P (A if we know B) =n(A and B)
n(B)
If P (A) = P (A if we know B) we call them independent, because knowing B doesnot change the probability of A.
With some algebra, we can prove that this statement of independence is the sameas the definition of independence that we saw at the beginning of this section. Forindependent events
P (A and B) = P (A)× P (B)
This is equivalent to
P (A) = P (A and B)÷ P (B)
=n(A and B)
n(S)÷ n(B)
n(S)
=n(A and B)
n(B)
= P (A if we know B)
That is why we call events independent!
(For enrichment only):
The ratioP (A and B)
P (B)
is called a conditional probability and written using the notation P (A | B). Thisnotation is read as “the probability of A given B.”
If (and only if) A and B are independent: P (A | B) = P (A) and P (B | A) = P (B).Try to prove this using the definition of independence.
413Chapter 10. Probability
Worked example 6: Independent and dependent events
QUESTION
A bag contains 5 red and 5 blue balls. We remove a random ball from the bag, recordits colour and put it back into the bag. We then remove another random ball from thebag and record its colour.
1. What is the probability that the first ball is red?
2. What is the probability that the second ball is blue?
3. What is the probability that the first ball is red and the second ball is blue?
4. Are the first ball being red and the second ball being blue independent events?
SOLUTION
Step 1: Probability of a red ball first
Since there are a total of 10 balls, of which 5 are red, the probability of getting a redball is
P (first ball red) =5
10=
1
2
Step 2: Probability of a blue ball second
The problem states that the first ball is placed back into the bag before we take thesecond ball. This means that when we draw the second ball, there are again a total of10 balls in the bag, of which 5 are blue. Therefore the probability of drawing a blueball is
P (second ball blue) =5
10=
1
2
Step 3: Probability of red first and blue second
When drawing two balls from the bag, there are 4 possibilities. We can get
• a red ball and then another red ball;
• a red ball and then a blue ball;
• a blue ball and then a red ball;
• a blue ball and then another blue ball.
We want to know the probability of the second outcome, where we have to get a redball first. Since there are 5 red balls and 10 balls in total, there are 5
10 ways to get ared ball first. Now we put the first ball back, so there are again 5 red balls and 5 blueballs in the bag. Therefore there are 5
10 ways to get a blue ball second if the first ballwas red. This means that there are
5
10× 5
10=
25
100
414 10.2. Dependent and independent events

ways to get a red ball first and a blue ball second. So, the probability of getting a redball first and a blue ball second is 1
4 .
Step 4: Dependent or independent?
According to the definition, events are independent if and only if
P (A and B) = P (A)× P (B)
In this problem:
• P (first ball red) = 12
• P (second ball blue) = 12
• P (first ball red and second ball blue) = 14
Since 14 = 1
2 ×12 , the events are independent.
See video: 23B8 at www.everythingmaths.co.za
Worked example 7: Independent and dependent events
QUESTION
In the previous example, we picked a random ball and put it back into the bag beforecontinuing. This is called sampling with replacement. In this example, we will followthe same process, except that we will not put the first ball back into the bag. This iscalled sampling without replacement.
So, from a bag with 5 red and 5 blue balls, we remove a random ball and record itscolour. Then, without putting back the first ball, we remove another random ball fromthe bag and record its colour.
1. What is the probability that the first ball is red?
2. What is the probability that the second ball is blue?
3. What is the probability that the first ball is red and the second ball is blue?
4. Are the first ball being red and the second ball being blue independent events?
SOLUTION
Step 1: Count the number of outcomes
We will look directly at the number of possible ways in which we can get the 4 possibleoutcomes when removing 2 balls. In the previous example, we saw that the 4 possibleoutcomes are
415Chapter 10. Probability

• a red ball and then another red ball;
• a red ball and then a blue ball;
• a blue ball and then a red ball;
• a blue ball and then another blue ball.
For the first outcome, we have to get a red ball first. Since there are 5 red balls and10 balls in total, there are 5
10 ways to get a red ball first. After we have taken out a redball, there are now 4 red balls and 5 blue balls left. Therefore there are 4
9 ways to geta red ball second if the first ball was also red. This means that there are
5
10× 4
9=
20
90
ways to get a red ball first and a red ball second. The probability of the first outcomeis 2
9 .
For the second outcome, we have to get a red ball first. As in the first outcome, thereare 5
10 ways to get a red ball first; and there are now 4 red balls and 5 blue balls left.Therefore there are 5
9 ways to get a blue ball second if the first ball was red. This meansthat there are
5
10× 5
9=
25
90
ways to get a red ball first and a blue ball second. The probability of the secondoutcome is 5
18 .
We can compute the probabilities of the third and fourth outcomes in the same way asthe first two, but there is an easier way. Notice that there are only 2 types of ball andthat there are exactly equal numbers of them at the start. This means that the problemis completely symmetric in red and blue. We can use this symmetry to compute theprobabilities of the other two outcomes.
In the third outcome, the first ball is blue and the second ball is red. Because ofsymmetry this outcome must have the same probability as the second outcome (whenthe first ball is red and the second ball is blue). Therefore the probability of the thirdoutcome is 5
18 .
In the fourth outcome, the first and second balls are both blue. From symmetry, thisoutcome must have the same probability as the first outcome (when both balls are red).Therefore the probability of the fourth outcome is 2
9 .
To summarise, these are the possible outcomes and their probabilities:
• first ball red and second ball red: 29 ;
• first ball red and second ball blue: 518 ;
• first ball blue and second ball red: 518 ;
• first ball blue and second ball blue: 29 .
Step 2: Probability of a red ball first
To determine the probability of getting a red ball on the first draw, we look at all of theoutcomes that contain a red ball first. These are
416 10.2. Dependent and independent events

• a red ball and then another red ball;
• a red ball and then a blue ball.
The probability of the first outcome is 29 and the probability of the second outcome is
518 . By adding these two probabilities, we see that the probability of getting a red ballfirst is
P (first ball red) =2
9+
5
18=
1
2
This is the same as in the previous exercise, which should not be too surprising sincethe probability of the first ball being red is not affected by whether or not we put itback into the bag before drawing the second ball.
Step 3: Probability of a blue ball second
To determine the probability of getting a blue ball on the second draw, we look at allof the outcomes that contain a blue ball second. These are
• a red ball and then a blue ball;
• a blue ball and then another blue ball.
The probability of the first outcome is 518 and the probability of the second outcome is
29 . By adding these two probabilities, we see that the probability of getting a blue ballsecond is
P (second ball blue) =5
18+
2
9=
1
2
This is also the same as in the previous exercise! You might find it surprising that theprobability of the second ball is not affected by whether or not we replace the first ball.The reason why this probability is still 1
2 is that we are computing the probability thatthe second ball is blue without knowing the colour of the first ball. Because there areonly two equal possibilities for the second ball (red and blue) and because we don’tknow whether the first ball is red or blue, there is an equal chance that the second ballwill be one colour or the other.
Step 4: Probability of red first and blue second
We have already calculated the probability that the first ball is red and the second ballis blue. It is 5
18 .
Step 5: Dependent or independent?
According to the definition, events are independent if and only if
P (A and B) = P (A)× P (B)
In this problem:
• P (first ball red) = 12
• P (second ball blue) = 12
• P (first ball red and second ball blue) = 518
Since 518 6=
12 ×
12 , the events are dependent.
417Chapter 10. Probability

WARNING!
Just because two events are mutually exclusive does not necessarily mean that theyare independent. To test whether events are mutually exclusive, always check thatP (A and B) = 0. To test whether events are independent, always check that P (A and B) =P (A) × P (B). See the exercises below for examples of events that are mutually ex-clusive and independent in different combinations.
Exercise 10 – 3: Dependent and independent events
1. Use the following Venn diagram to determine whether events X and Y are
a) mutually exclusive or not mutually exclusive;
b) dependent or independent.
S
X Y
11 73
14
2. Of the 30 learners in a class 17 have black hair, 11 have brown hair and 2 havered hair. A learner is selected from the class at random.
a) What is the probability that the learner has black hair?
b) What is the probability that the learner has brown hair?
c) Are these two events mutually exclusive?
d) Are these two events independent?
3. P (M) = 0,45; P (N) = 0,3 and P (M or N) = 0,615. Are the events M and Nmutually exclusive, independent or neither mutually exclusive nor independent?
4. (For enrichment)
Prove that if event A and event B are mutually exclusive with P (A) 6= 0 andP (B) 6= 0, then A and B are always dependent.
Think you got it? Get this answer and more practice on our Intelligent Practice Service
1. 23B9 2. 23BB 3. 23BC 4. 23BD
www.everythingmaths.co.za m.everythingmaths.co.za
418 10.2. Dependent and independent events
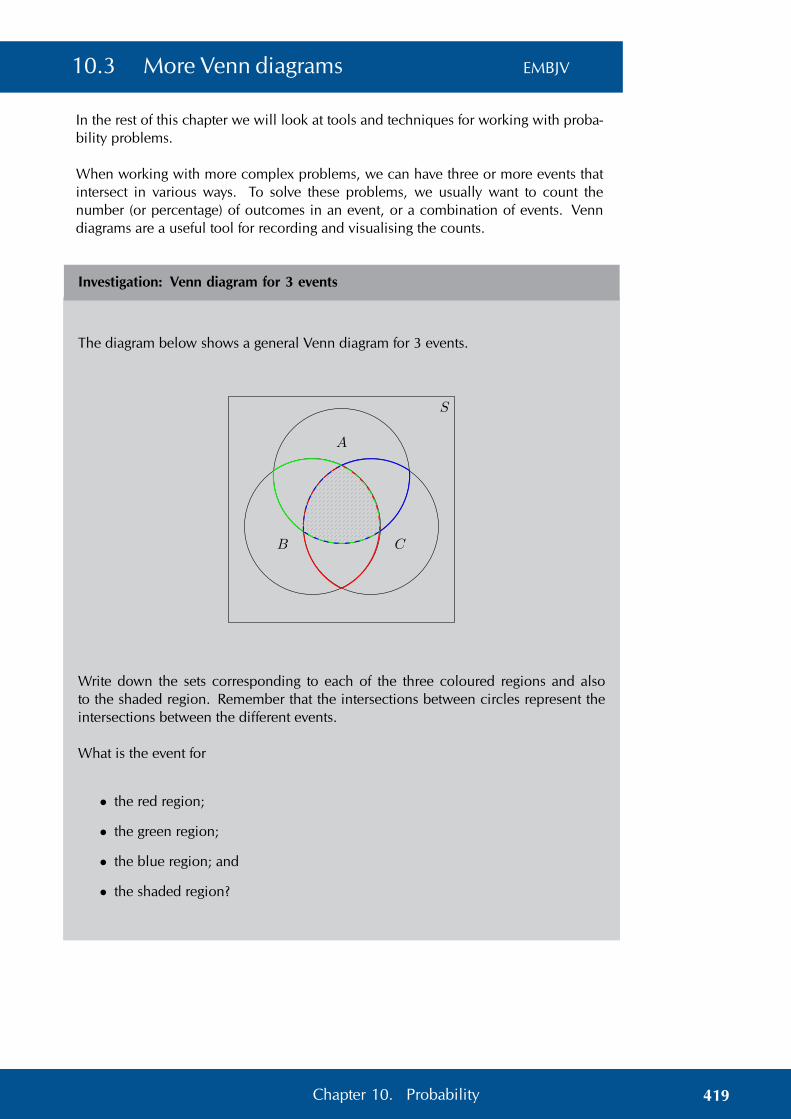
10.3 More Venn diagrams EMBJV
In the rest of this chapter we will look at tools and techniques for working with proba-bility problems.
When working with more complex problems, we can have three or more events thatintersect in various ways. To solve these problems, we usually want to count thenumber (or percentage) of outcomes in an event, or a combination of events. Venndiagrams are a useful tool for recording and visualising the counts.
Investigation: Venn diagram for 3 events
The diagram below shows a general Venn diagram for 3 events.
S
A
B C
Write down the sets corresponding to each of the three coloured regions and alsoto the shaded region. Remember that the intersections between circles represent theintersections between the different events.
What is the event for
• the red region;
• the green region;
• the blue region; and
• the shaded region?
419Chapter 10. Probability

Worked example 8: Venn diagram for 3 events
QUESTION
Draw a Venn diagram that shows the following sample space and events:
• S: all the integers from 1 to 30
• P : prime numbers
• M : multiples of 3
• F : factors of 30
SOLUTION
Step 1: Write down the sample space and event sets
The sample space contains all the positive integers up to 30.
S = {1; 2; 3; . . . ; 30}
The prime numbers between 1 and 30 are
P = {2; 3; 5; 7; 11; 13; 17; 19; 23; 29}
The multiples of 3 between 1 and 30 are
M = {3; 6; 9; 12; 15; 18; 21; 24; 27; 30}
The factors of 30 areF = {1; 2; 3; 5; 6; 10; 15; 30}
Step 2: Draw the outline of the Venn diagram
There are 3 events, namely P , M and F , and the sample space, S. Put this informationon a Venn diagram:
S
P
M F
420 10.3. More Venn diagrams

Step 3: Place the outcomes in the appropriate event sets
S
P
M F
32
5
61530
1
10
711
13
17
19
23
29
912
2124
18 27
4
814 16
20
22
252628
Worked example 9: Venn diagram for 3 events
QUESTION
At Dawnview High there are 400 Grade 11 learners. 270 do Computer Science, 300do English and 50 do Business studies. All those doing Computer Science do English,20 take Computer Science and Business studies and 35 take English and Businessstudies. Using a Venn diagram, calculate the probability that a pupil drawn at randomwill take:
1. English, but not Business studies or Computer Science
2. English but not Business studies
3. English or Business studies but not Computer Science
4. English or Business studies
SOLUTION
Step 1: Draw the outline of the Venn diagram
We need to be careful with this problem. In the question statement we are told that allthe learners who do Computer Science also do English. This means that the circle forComputer Science on the Venn diagram needs to be inside the circle for English.
421Chapter 10. Probability
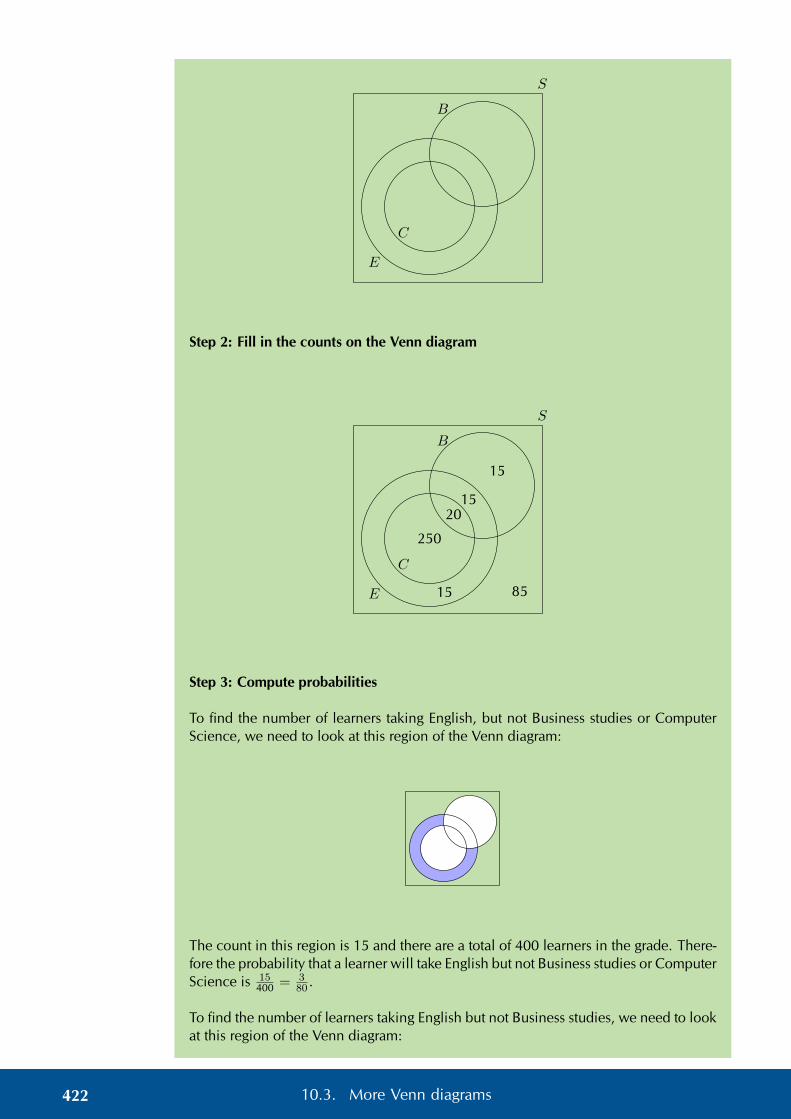
S
E
C
B
Step 2: Fill in the counts on the Venn diagram
S
E
C
B
20
250
15
15
15 85
Step 3: Compute probabilities
To find the number of learners taking English, but not Business studies or ComputerScience, we need to look at this region of the Venn diagram:
The count in this region is 15 and there are a total of 400 learners in the grade. There-fore the probability that a learner will take English but not Business studies or ComputerScience is 15
400 = 380 .
To find the number of learners taking English but not Business studies, we need to lookat this region of the Venn diagram:
422 10.3. More Venn diagrams

The count in this region is 265. Therefore the probability that a learner will takeEnglish but not Business studies is 265
400 = 5380 .
To find the number of learners taking English or Business studies but not ComputerScience, we need to look at this region of the Venn diagram:
The count in this region is 45. Therefore the probability that a learner will take Englishor Business studies but not Computer Science is 45
400 = 980 .
To find the number of learners taking English or Business studies, we need to look atthis region of the Venn diagram:
The count in this region is 315. Therefore the probability that a learner will takeEnglish or Business studies is 315
400 = 6380 .
423Chapter 10. Probability

There are some words that tell you which part of the Venn diagram should be filled in.The following table summarises the most important ones:
Words Symbols Venn diagram
“all” A and B and C / A ∩B ∩ C
“none”
“at least one” A or B or C / A ∪B ∪ C
“both A and B” A and B / A ∩B
“A or B” A or B / A ∪B
Exercise 10 – 4: Venn diagrams
1. Use the Venn diagram below to answer the following questions. Also given:n(S) = 120.
SF
8
10
G
2415 H
14
7
2
a) Compute P (F ).
b) Compute P (G or H).
c) Compute P (F and G).
d) Are F and G dependent or independent?
424 10.3. More Venn diagrams

2. The Venn diagram below shows the probabilities of 3 events. Complete the Venndiagram using the additional information provided.
SZ
125
Y17100 X
17100
320
• P (Z and (not Y )) = 31100
• P (Y and X) = 23100
• P (Y ) = 39100
After completing the Venn diagram, compute the following:
P (Z and not (X or Y ))
3. There are 79 Grade 10 learners at school. All of these take some combination ofMaths, Geography and History. The number who take Geography is 41; thosewho take History is 36; and 30 take Maths. The number who take Maths andHistory is 16; the number who take Geography and History is 6, and there are 8who take Maths only and 16 who take History only.
a) Draw a Venn diagram to illustrate all this information.
b) How many learners take Maths and Geography but not History?
c) How many learners take Geography only?
d) How many learners take all three subjects?
4. Draw a Venn diagram with 3 mutually exclusive events. Use the diagram toshow that for 3 mutually exclusive events, A, B and C, the following is true:
P (A or B or C) = P (A) + P (B) + P (C)
This is the addition rule for 3 mutually exclusive events.
Think you got it? Get this answer and more practice on our Intelligent Practice Service
1. 23BF 2. 23BG 3. 23BH 4. 23BJ
www.everythingmaths.co.za m.everythingmaths.co.za
425Chapter 10. Probability

10.4 Tree diagrams EMBJW
Tree diagrams are useful for organising and visualising the different possible outcomesof a sequence of events. For each possible outcome of the first event, we draw a linewhere we write down the probability of that outcome and the state of the world if thatoutcome happened. Then, for each possible outcome of the second event we do thesame thing.
Below is an example of a simple tree diagram, showing the possible outcomes ofrolling a 6-sided die.
1
16
2
16
3
16
4
16
5
16
6
16
outcomes
probabilities
Note that each outcome (the numbers 1 to 6) is shown at the end of a line; and thatthe probability of each outcome (all 1
6 in this case) is shown shown on a line. Theprobabilities have to add up to 1 in order to cover all of the possible outcomes. In theexamples below, we will see how to draw tree diagrams with multiple events and howto compute probabilities using the diagrams.
Earlier in this chapter you learned about dependent and independent events. Treediagrams are very helpful for analysing dependent events. A tree diagram allows youto show how each possible outcome of one event affects the probabilities of the otherevents.
Tree diagrams are not so useful for independent events since we can just multiply theprobabilities of separate events to get the probability of the combined event. Remem-ber that for independent events:
P (A and B) = P (A)× P (B)
So if you already know that events are independent, it is usually easier to solve aproblem without using tree diagrams. But if you are uncertain about whether eventsare independent or if you know that they are not, you should use a tree diagram.
Worked example 10: Drawing a tree diagram
QUESTION
If it rains on a given day, the probability that it rains the next day is 13 . If it does not rain
on a given day, the probability that it rains the next day is 16 . The probability that it will
rain tomorrow is 15 . What is the probability that it will rain the day after tomorrow?
Draw a tree diagram of all the possibilities to determine the answer.
SOLUTION
Step 1: Draw the first level of the tree diagram
Before we can determine what happens on the day after tomorrow, we first have todetermine what might happen tomorrow. We are told that there is a 1
5 probability that
426 10.4. Tree diagrams

it will rain tomorrow. Here is how to represent this information using a tree diagram:
15
rain
45
no rain
today:
tomorrow:
Step 2: Draw the second level of the tree diagram
We are also told that if it does rain on one day, there is a 13 probability that it will also
rain on the following day. On the other hand, if it does not rain on one day, there isonly a 1
6 probability that it will also rain on the following day. Using this informationwe complete the tree diagram:
15
rain
45
no rain
13
rain
23
no rain
16
rain
56
no rain
today:
tomorrow:
day after tomorrow:
Step 3: Compute the probability
We are asked what the probability is that it will rain the day after tomorrow. On thetree diagram above we can see that there are 2 situations where it rains on the dayafter tomorrow. They are marked in red below.
15
rain
45
no rain
13
rain
23
no rain
16
rain
56
no rain
today:
tomorrow:
day after tomorrow:
To get the probability for the first situation (that it rains tomorrow and the day aftertomorrow) we have to multiply the probabilies along the first red line.
P (rain tomorrow and rain day after tomorrow)
=1
5× 1
3
=1
15
427Chapter 10. Probability

To get the probability for the second situation (that it does not rain tomorrow, but itdoes rain the day after tomorrow) we have to multiply the probabilies along the secondred line.
P (not rain tomorrow and rain day after tomorrow)
=4
5× 1
6
=2
15
Therefore the total probability that it will rain the day after tomorrow is the sum of theprobabilities along the two red paths, namely
1
15+
2
15=
1
5
Worked example 11: Drawing a tree diagram
QUESTION
You play the following game. You flip a coin. If it comes up tails, you get 2 pointsand your turn ends. If it comes up heads, you get only 1 point, but you can flip thecoin again. If you flip the coin multiple times in one turn, you add up the points. Youcan flip the coin at most 3 times in one turn. What is the probability that you will getexactly 3 points in one turn? Draw a tree diagram to visualise the different possibilities.
SOLUTION
Step 1: Write down the events and their symbols
Each coin toss has on of two possible outcomes, namely heads (H) and tails (T ). Eachoutcome has a probability of 1
2 . We are asked to count the number of points, so wewill also indicate how many points we have for each outcome.
Step 2: Draw the first level of the tree diagram
12
H1 pt
12
T2 pts
This tree diagram shows the possible outcomes after 1 flip of the coin. Remember thatwe can have up to 3 flips, so the diagram is not complete yet. If the coin comes upheads, we flip the coin again. If the coin comes up tails, we stop.
428 10.4. Tree diagrams

Step 3: Draw the second and third level of the tree diagram
12
H1 pt
12
T2 pts
12
H2 pts
12
T3 pts
12
H3 pts
12
T4 pts
In this tree diagram you can see that we add up the points we get with each coin flip.After three coin flips, the game is over.
Step 4: Find the relevant outcomes and compute the probability
We are interested in getting exactly 3 points during the game. To find these outcomeswe look only at the tips of the tree. We end with exactly 3 points when the coin flipsare
• (H;T ) with probability 12 ×
12 = 1
4 ;
• (H;H;H) with probability 12 ×
12 ×
12 = 1
8 .
Notice that we compute the probability of an outcome by multiplying all the probabil-ities along the path from the start of the tree to the tip where the outcome is. We addthe above two probabilites to obtain the final probability of getting exactly 3 points as14 + 1
8 = 38 .
Worked example 12: Drawing a tree diagram
QUESTION
A person takes part in a medical trial that tests the effect of a medicine on a disease.Half the people are given medicine and the other half are given a sugar pill, which hasno effect on the disease. The medicine has a 60% chance of curing someone. But,people who do not get the medicine still have a 10% chance of getting well. There are50 people in the trial and they all have the disease. Talwar takes part in the trial, butwe do not know whether he got the medicine or the sugar pill. Draw a tree diagramof all the possible cases. What is the probability that Talwar gets cured?
SOLUTION
Step 1: Summarise the information in the problem
There are two uncertain events in this problem. Each person either receives medicine(probability 1
2 ) or a sugar pill (probability 12 ). Each person also gets cured (probability
429Chapter 10. Probability

35 with medicine and 1
10 without) or stays ill (probability 25 with medicine and 9
10without).
Step 2: Draw the tree diagram
12
medicine
12
sugar pill
35
cured
25
not cured
110
cured
910
not cured
In the first level of the tree diagram we show that Talwar either gets the medicine orthe sugar pill. The second level of the tree diagram shows whether Talwar is cured ornot, depending on which one of the pills he got.
Step 3: Compute the required probability
We multiply the probabilites along each path in the tree diagram that leads to Talwerbeing cured:
1
2× 3
5=
3
101
2× 1
10=
1
20
We then add these probabilites to get the final answer. The probability that Talwar iscured is 7
20 .
Exercise 10 – 5: Tree diagrams
1. You roll a die twice and add up the dots to get a score. Draw a tree diagram torepresent this experiment. What is the probability that your score is a multipleof 5?
2. What is the probability of throwing at least one five in four rolls of a regular6-sided die? Hint: do not show all possible outcomes of each roll of the die. Weare interested in whether the outcome is 5 or not 5 only.
3. You flip one coin 4 times.
a) What is the probability of getting exactly 3 heads?
b) What is the probability of getting at least 3 heads?
430 10.4. Tree diagrams

4. You flip 4 different coins at the same time.
a) What is the probability of getting exactly 3 heads?
b) What is the probability of getting at least 3 heads?
Think you got it? Get this answer and more practice on our Intelligent Practice Service
1. 23BK 2. 23BM 3. 23BN 4. 23BP
www.everythingmaths.co.za m.everythingmaths.co.za
10.5 Contingency tables EMBJX
A contingency table is another tool for keeping a record of the counts or percentagesin a probability problem. Contingency tables are especially helpful for figuring outwhether events are dependent or independent.
We will be studying two-way contingency tables, where we count the number of out-comes for 2 events and their complements, making 4 events in total. A two-way contin-gency table always shows the counts for the 4 possible combinations of events, as wellas the totals for each event and its complement. We can use a contingency table tocompute the probabilities of various events by computing the ratios between counts,and to determine whether the events are dependent or independent. The examplebelow shows a two-way contingency table, representing the outcome of a medicalstudy.
Worked example 13: Contingency tables
QUESTION
A medical trial into the effectiveness of a new medication was carried out. 120 femalesand 90 males took part in the trial. Out of those people, 50 females and 30 malesresponded positively to the medication. Given below is a contingency table with thegiven information filled in.
Female Male TotalsPositive 50 30Negative
Totals 120 90
1. What is the probability that the medicine gives a positive result for females?
2. What is the probability that the medicine gives a negative result for males?
3. Was the medication’s success independent of gender? Explain.
431Chapter 10. Probability
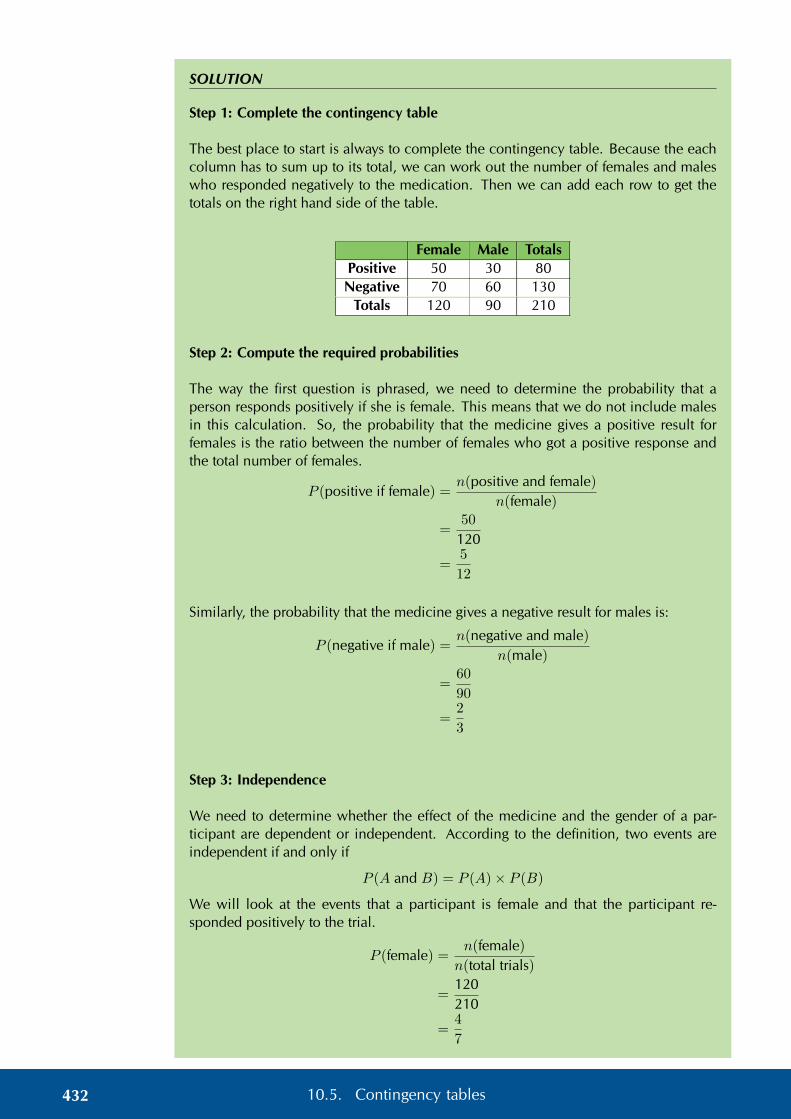
SOLUTION
Step 1: Complete the contingency table
The best place to start is always to complete the contingency table. Because the eachcolumn has to sum up to its total, we can work out the number of females and maleswho responded negatively to the medication. Then we can add each row to get thetotals on the right hand side of the table.
Female Male TotalsPositive 50 30 80Negative 70 60 130
Totals 120 90 210
Step 2: Compute the required probabilities
The way the first question is phrased, we need to determine the probability that aperson responds positively if she is female. This means that we do not include malesin this calculation. So, the probability that the medicine gives a positive result forfemales is the ratio between the number of females who got a positive response andthe total number of females.
P (positive if female) =n(positive and female)
n(female)
=50
120
=5
12
Similarly, the probability that the medicine gives a negative result for males is:
P (negative if male) =n(negative and male)
n(male)
=60
90
=2
3
Step 3: Independence
We need to determine whether the effect of the medicine and the gender of a par-ticipant are dependent or independent. According to the definition, two events areindependent if and only if
P (A and B) = P (A)× P (B)
We will look at the events that a participant is female and that the participant re-sponded positively to the trial.
P (female) =n(female)
n(total trials)
=120210
=4
7
432 10.5. Contingency tables

P (positive) =n(positive)
n(total trials)
=80
210
=8
21
P (female and positive) =n(female and positive)
n(total trials)
=50
210
=5
21
From these probabilities we can see that
P (female and positive) 6= P (female)× P (positive)
and therefore the gender of a participant and the outcome of a trial are dependentevents.
Worked example 14: Contingency tables
QUESTION
Use the contingency table below to answer the following questions.
Grade 11 Grade 12 TotalsHas cellphone 59 50 109No cellphone 6 3 9
Totals 65 53 118
1. What is the probability that a learner from Grade 11 has a cellphone?
2. What is the probability that a learner who does not have a cellphone is fromGrade 11.
3. Are the grade of a learner and whether he has a cellphone or not independentevents? Explain your answer.
SOLUTION
1. There are 65 learners in Grade 11 and 59 of them have a cellphone. Thereforethe probability that a learner from Grade 11 has a cellphone is 59
65 .
2. There are 9 learners who do not have a cellphone and 6 of them are in Grade11. Therefore the probability that a learner who does not have a cellphone isfrom from Grade 11 is 6
9 = 23 .
433Chapter 10. Probability

3. To test for independence, we will consider whether a learner is in Grade 11 andwhether a learner has a cellphone. The probability that a learner is in Grade 11is 65
118 . The probability that a learner has a cellphone is 109118 . The probability that
a learner is in Grade 11 and has a cellphone is 59118 = 1
2 . Since 12 6=
65118 ×
109118
the grade of a learner and whether he has a cellphone are dependent.
Exercise 10 – 6: Contingency tables
1. Use the contingency table below to answer the following questions.
Brown eyes Not brown eyes TotalsBlack hair 50 30 80Red hair 70 80 150Totals 120 110 230
a) What is the probability that someone with black hair has brown eyes?
b) What is the probability that someone has black hair?
c) What is the probability that someone has brown eyes?
d) Are having black hair and having brown eyes dependent or independentevents?
2. Given the following contingency table, identify the events and determinewhether they are dependent or independent.
Location A Location B TotalsBuses left late 15 40 55
Buses left on time 25 20 45Totals 40 60 100
3. You are given the following information.
• Events A and B are independent.
• P (not A) = 0,3.
• P (B) = 0,4.
Complete the contingency table below.
A not A TotalsB
not BTotals 50
Think you got it? Get this answer and more practice on our Intelligent Practice Service
1. 23BQ 2. 23BR 3. 23BS
www.everythingmaths.co.za m.everythingmaths.co.za
434 10.5. Contingency tables

10.6 Summary EMBJY
See presentation: 23BT at www.everythingmaths.co.za
• Terminology:
– Outcome: a single observation of an experiment.
– Sample space of an experiment: the set of all possible outcomes of theexperiment.
– Event: a set of outcomes of an experiment.
– Probability of an event: a real number between 0 and 1 that describes howlikely it is that the event will occur.
– Relative frequency of an event: the number of times that the event occursduring experimental trials, divided by the total number of trials conducted.
– Union of events: the set of all outcomes that occur in at least one of theevents, written as “A or B”.
– Intersection of events: the set of all outcomes that occur in all of the events,written as “A and B”.
– Mutually exclusive events: events with no outcomes in common, that is(A and B) = ∅.
– Complementary events: two mutually exclusive events that together con-tain all the outcomes in the sample space. We write the complement as“not A”.
– Independent events: two events where knowing the outcome of one eventdoes not affect the probability of the other event. Events are independent ifand only if P (A and B) = P (A)× P (B).
• Identities:
– The addition rule: P (A or B) = P (A) + P (B)− P (A and B)
– The addition rule for 2 mutually exclusive events: P (A or B) = P (A) +P (B)
– The complementary rule: P (not A) = 1− P (A)
• A Venn diagram is a visual tool used to show how events overlap. Each regionin a Venn diagram represents an event and could contain either the outcomes inthe event, the number of outcomes in the event or the probability of the event.
• A tree diagram is a visual tool that helps with computing probabilities for depen-dent events. The outcomes of each event are shown along with the probabilityof each outcome. For each event that depends on a previous event, we go onelevel deeper into the tree. To compute the probability of some combination ofoutcomes, we
– find all the paths that contain the outcome of interest;
– multiply the probabilities along each path;
– add the probabilities between different paths.
• A 2-way contingency table is a tool for organising data, especially when we wantto determine whether two events, each with only two outcomes, are dependentor independent. The counts for each possible combination of outcomes areentered into the table, along with the totals of each row and column.
435Chapter 10. Probability

Exercise 10 – 7: End of chapter exercises
1. Jane invested in the stock market. The probability that she will not lose all hermoney is 0,32. What is the probability that she will lose all her money? Explain.
2. If D and F are mutually exclusive events, with P (not D) = 0,3 andP (D or F ) = 0,94, find P (F ).
3. A car sales person has pink, lime-green and purple models of car A and purple,orange and multicolour models of car B. One dark night a thief steals a car.
a) What is the experiment and sample space?
b) What is the probability of stealing either a model of A or a model of B?
c) What is the probability of stealing both a model of A and a model of B?
4. The probability of event X is 0,43 and the probability of event Y is 0,24. Theprobability of both occurring together is 0,10. What is the probability that X orY will occur?
5. P (H) = 0,62; P (J) = 0,39 and P (H and J) = 0,31. Calculate:
a) P (H ′)
b) P (H or J)
c) P (H ′ or J ′)
d) P (H ′ or J)
e) P (H ′ and J ′)
6. The last ten letters of the alphabet are placed in a hat and people are asked topick one of them. Event D is picking a vowel, event E is picking a consonantand event F is picking one of the last four letters. Draw a Venn diagram showingthe outcomes in the sample space and the different events. Then calculate thefollowing probabilities:
a) P (not F )
b) P (F or D)
c) P (neither E nor F )
d) P (D and E)
e) P (E and F )
f) P (E and D′)
7. Thobeka compares three neighbourhoods (we’ll call them A, B and C) to seewhere the best place is to live. She interviews 80 people and asks them whetherthey like each of the neighbourhoods, or not.
• 40 people like neighbourhood A.
• 35 people like neighbourhood B.
• 40 people like neighbourhood C.
• 21 people like both neighbourhoods A and C.
• 18 people like both neighbourhoods B and C.
• 68 people like at least one neighbourhood.
• 7 people like all three neighbourhoods.
436 10.6. Summary

a) Use this information to draw a Venn diagram.
b) How many people like none of the neighbourhoods?
c) How many people like neighbourhoods A and B, but not C?
d) What is the probability that a randomly chosen person from the survey likesat least one of the neighbourhoods?
8. Let G and H be two events in a sample space. Suppose that P (G) = 0,4;P (H) = h; and P (G or H) = 0,7.
a) For what value of h are G and H mutually exclusive?
b) For what value of h are G and H independent?
9. The following tree diagram represents points scored by two teams in a soccergame. At each level in the tree, the points are shown as (points for Team 1;points for Team 2).
0,75
(3; 0)
0,25
(2; 1)
0,5
(2; 1)
0,5
(1; 2)
0,65
(2; 0)
0,35
(1; 1)
0,4
(1; 1)
0,6
(0; 2)
0,52
(1; 0)
0,48
(0; 1)
(0; 0)
Use this diagram to determine the probability that:
a) Team 1 will win
b) The game will be a draw
c) The game will end with an even number of total points
10. A bag contains 10 orange balls and 7 black balls. You draw 3 balls from the bagwithout replacement. What is the probability that you will end up with exactly2 orange balls? Represent this experiment using a tree diagram.
11. Complete the following contingency table and determine whether the events aredependent or independent.
Durban Bloemfontein TotalsLiked living there 130 30
Did not like living there 140 340Totals 230 500
12. Summarise the following information about a medical trial with 2 types of multi-vitamin in a contingency table and determine whether the events are dependentor independent.
• 960 people took part in the medical trial.
• 540 people used multivitamin A for a month and 400 of those peopleshowed an improvement in their health.
437Chapter 10. Probability

• 300 people showed an improvement in health when using multivitamin Bfor a month.
If the events are independent, it means that the two multivitamins have the sameeffect on people. If the events are dependent, it means that one multivitamin isbetter than the other. Which multivitamin is better than the other, or are the bothequally effective?
Think you got it? Get this answer and more practice on our Intelligent Practice Service
1. 23BV 2. 23BW 3. 23BX 4. 23BY 5. 23BZ 6. 23C27. 23C3 8. 23C4 9. 23C5 10. 23C6 11. 23C7 12. 23C8
www.everythingmaths.co.za m.everythingmaths.co.za
438 10.6. Summary

CHAPTER 11
Statistics
11.1 Revision 440
11.2 Histograms 444
11.3 Ogives 451
11.4 Variance and standard deviation 455
11.5 Symmetric and skewed data 461
11.6 Identification of outliers 464
11.7 Summary 467
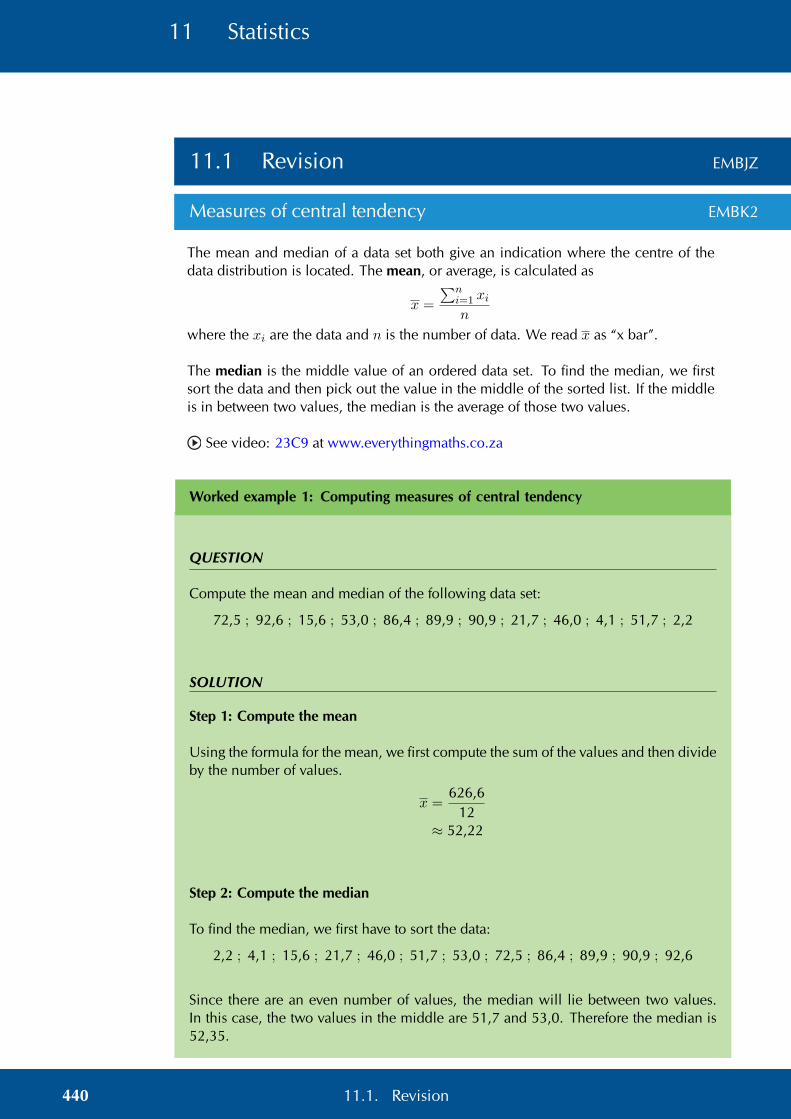
11 Statistics
11.1 Revision EMBJZ
Measures of central tendency EMBK2
The mean and median of a data set both give an indication where the centre of thedata distribution is located. The mean, or average, is calculated as
x =
∑ni=1 xin
where the xi are the data and n is the number of data. We read x as “x bar”.
The median is the middle value of an ordered data set. To find the median, we firstsort the data and then pick out the value in the middle of the sorted list. If the middleis in between two values, the median is the average of those two values.
See video: 23C9 at www.everythingmaths.co.za
Worked example 1: Computing measures of central tendency
QUESTION
Compute the mean and median of the following data set:
72,5 ; 92,6 ; 15,6 ; 53,0 ; 86,4 ; 89,9 ; 90,9 ; 21,7 ; 46,0 ; 4,1 ; 51,7 ; 2,2
SOLUTION
Step 1: Compute the mean
Using the formula for the mean, we first compute the sum of the values and then divideby the number of values.
x =626,6
12≈ 52,22
Step 2: Compute the median
To find the median, we first have to sort the data:
2,2 ; 4,1 ; 15,6 ; 21,7 ; 46,0 ; 51,7 ; 53,0 ; 72,5 ; 86,4 ; 89,9 ; 90,9 ; 92,6
Since there are an even number of values, the median will lie between two values.In this case, the two values in the middle are 51,7 and 53,0. Therefore the median is52,35.
440 11.1. Revision

Measures of dispersion EMBK3
Measures of dispersion tell us how spread out a data set is. If a measure of dispersionis small, the data are clustered in a small region. If a measure of dispersion is large,the data are spread out over a large region.
The range is the difference between the maximum and minimum values in the dataset.
The inter-quartile range is the difference between the first and third quartiles of thedata set. The quartiles are computed in a similar way to the median. The median ishalfway into the ordered data set and is sometimes also called the second quartile.The first quartile is one quarter of the way into the ordered data set; whereas the thirdquartile is three quarters of the way into the ordered data set.
See video: 23CB at www.everythingmaths.co.za
Worked example 2: Range and inter-quartile range
QUESTION
Determine the range and the inter-quartile range of the following data set.
14 ; 17 ; 45 ; 20 ; 19 ; 36 ; 7 ; 30 ; 8
SOLUTION
Step 1: Sort the values in the data set
To determine the range we need to find the minimum and maximum values in thedata set. To determine the inter-quartile range we need to compute the first and thirdquartiles of the data set. For both of these requirements, it is easier to order the dataset first.
The sorted data set is
7 ; 8 ; 14 ; 17 ; 19 ; 20 ; 30 ; 36 ; 45
Step 2: Find the minimum, maximum and range
The minimum value is the first value in the ordered data set, namely 7. The maximumis the last value in the ordered data set, namely 45. The range is the difference betweenthe minimum and maximum: 45− 7 = 38.
Step 3: Find the quartiles and inter-quartile range
The diagram below shows how we find the quartiles one quarter, one half and threequarters of the way into the ordered list of values.
441Chapter 11. Statistics

7 8 14 17 19 20 30 36 45
014
12
34 1
From this diagram we can see that the first quartile is at a value of 14, the secondquartile (median) is at a value of 19 and the third quartile is at a value of 30.
The inter-quartile range is the difference between the first and third quartiles. Thefirst quartile is 14 and the third quartile is 30. Therefore the inter-quartile range is30− 14 = 16.
Five number summary EMBK4
The five number summary combines a measure of central tendency, namely the me-dian, with measures of dispersion, namely the range and the inter-quartile range. Thisgives a good overview of the overall data distribution. More precisely, the five numbersummary is written in the following order:
• minimum;
• first quartile;
• median;
• third quartile;
• maximum.
The five number summary is often presented visually using a box and whisker diagram.A box and whisker diagram is shown below, with the positions of the five relevantnumbers labelled. Note that this diagram is drawn vertically, but that it may also bedrawn horizontally.
maximum
upper quartile
median
lower quartile
minimum
inter-quartile range data range
See video: 23CC at www.everythingmaths.co.za
442 11.1. Revision

Worked example 3: Five number summary
QUESTION
Draw a box and whisker diagram for the following data set:
1,25 ; 1,5 ; 2,5 ; 2,5 ; 3,1 ; 3,2 ; 4,1 ; 4,25 ; 4,75 ; 4,8 ; 4,95 ; 5,1
SOLUTION
Step 1: Determine the minimum and maximum
Since the data set is already ordered, we can read off the minimum as the first value(1,25) and the maximum as the last value (5,1).
Step 2: Determine the quartiles
There are 12 values in the data set.
1,25 1,5 2,5 2,5 3,1 3,2 4,1 4,25 4,75 4,8 4,95 5,1
014
12
34 1
Using the figure above we can see that the median is between the sixth and seventhvalues, making it.
3,2 + 4,12
= 3,65
The first quartile lies between the third and fourth values, making it
Q1 =2,5 + 2,5
2= 2,5
The third quartile lies between the ninth and tenth values, making it
Q3 =4,75 + 4,8
2= 4,775
Step 3: Draw the box and whisker diagram
We now have the five number summary as (1,25; 2,5; 3,65; 4,775; 5,1). The box andwhisker diagram representing the five number summary is given below.
1,25 2,5 3,65 4,775 5,1
443Chapter 11. Statistics
Exercise 11 – 1: Revision
1. For each of the following data sets, compute the mean and all the quartiles.Round your answers to one decimal place.
a) −3,4 ; −3,1 ; −6,1 ; −1,5 ; −7,8 ; −3,4 ; −2,7 ; −6,2
b) −6 ; −99 ; 90 ; 81 ; 13 ; −85 ; −60 ; 65 ; −49
c) 7 ; 45 ; 11 ; 3 ; 9 ; 35 ; 31 ; 7 ; 16 ; 40 ; 12 ; 6
2. Use the following box and whisker diagram to determine the range and inter-quartile range of the data.
−5,52 −2,41−1,53 0,10 4,08
3. Draw the box and whisker diagram for the following data.
0,2 ; −0,2 ; −2,7 ; 2,9 ; −0,2 ; −4,2 ; −1,8 ; 0,4 ; −1,7 ; −2,5 ; 2,7 ; 0,8 ; −0,5
Think you got it? Get this answer and more practice on our Intelligent Practice Service
1a. 23CD 1b. 23CF 1c. 23CG 2. 23CH 3. 23CJ
www.everythingmaths.co.za m.everythingmaths.co.za
11.2 Histograms EMBK5
A histogram is a graphical representation of how many times different, mutually exclu-sive events are observed in an experiment. To interpret a histogram, we find the eventson the x-axis and the counts on the y-axis. Each event has a rectangle that shows whatits count (or frequency) is.
See video: 23CK at www.everythingmaths.co.za
Worked example 4: Reading histograms
QUESTION
Use the following histogram to determine the events that were recorded and the rela-tive frequency of each event. Summarise your answer in a table.
444 11.2. Histograms

0
2
4
6
8
10
not yetin school
in primaryschool
in highschool
SOLUTION
Step 1: Determine the events
The events are shown on the x-axis. In this example we have “not yet in school”, “inprimary school” and “in high school”.
Step 2: Read off the count for each event
The counts are shown on the y-axis and the height of each rectangle shows the fre-quency for each event.
• not yet in school: 2
• in primary school: 5
• in high school: 9
Step 3: Calculate relative frequency
The relative frequency of an event in an experiment is the number of times that theevent occurred divided by the total number of times that the experiment was com-pleted. In this example we add up the frequencies for all the events to get a totalfrequency of 16. Therefore the relative frequencies are:
• not yet in school: 216 = 1
8
• in primary school: 516
• in high school: 916
Step 4: Summarise
Event Count Relative frequencynot yet in school 2 1
8
in primary school 5 516
in high school 9 916
445Chapter 11. Statistics

To draw a histogram of a data set containing numbers, the numbers first have to begrouped. Each group is defined by an interval. We then count how many timesnumbers from each group appear in the data set and draw a histogram using the counts.
Worked example 5: Draw a histogram
QUESTION
The following data represent the heights of 16 adults in centimetres.
162 ; 168 ; 177 ; 147 ; 189 ; 171 ; 173 ; 168178 ; 184 ; 165 ; 173 ; 179 ; 166 ; 168 ; 165
Divide the data into 5 equal length intervals between 140 cm and 190 cm and draw ahistogram.
SOLUTION
Step 1: Determine intervals
To have 5 intervals of the same length between 140 and 190, we need and intervallength of 10. Therefore the intervals are (140; 150]; (150; 160]; (160; 170]; (170; 180];and (180; 190].
Step 2: Count data
The following table summarises the number of data values in each of the intervals.
Interval (140; 150] (150; 160] (160; 170] (170; 180] (180; 190]
Count 1 0 7 6 2
Step 3: Draw the histogram
height (cm)
count
0
2
4
6
8
140 150 160 170 180 190
446 11.2. Histograms

Frequency polygons EMBK6
A frequency polygon is sometimes used to represent the same information as in a his-togram. A frequency polygon is drawn by using line segments to connect the middle ofthe top of each bar in the histogram. This means that the frequency polygon connectsthe coordinates at the centre of each interval and the count in each interval.
Worked example 6: Drawing a frequency polygon
QUESTION
Use the histogram from the previous example to draw a frequency polygon of the samedata.
SOLUTION
Step 1: Draw the histogram
We already know that the histogram looks like this:
height (cm)
count
0
2
4
6
8
140 150 160 170 180 190
Step 2: Connect the tops of the rectangles
When we draw line segments between the tops of the rectangles in the histogram, weget the following picture:
height (cm)
count
0
2
4
6
8
••
••
•
140 150 160 170 180 190
447Chapter 11. Statistics

Step 3: Draw final frequency polygon
Finally, we remove the histogram to show only the frequency polygon.
height (cm)
count
0
2
4
6
8
••
••
•
140 150 160 170 180 190
Frequency polygons are particularly useful for comparing two data sets. Comparingtwo histograms would be more difficult since we would have to draw the rectangles ofthe two data sets on top of each other. Because frequency polygons are just lines, theydo not pose the same problem.
Worked example 7: Drawing frequency polygons
QUESTION
Here is another data set of heights, this time of Grade 11 learners.
132 ; 132 ; 156 ; 147 ; 162 ; 168 ; 152 ; 174141 ; 136 ; 161 ; 148 ; 140 ; 174 ; 174 ; 162
Draw the frequency polygon for this data set using the same interval length as in theprevious example. Then compare the two frequency polygons on one graph to see thedifferences between the distributions.
SOLUTION
Step 1: Frequency table
We first create the table of counts for the new data set.
Interval (130; 140] (140; 150] (150; 160] (160; 170] (170; 180]
Count 4 3 2 4 3
448 11.2. Histograms
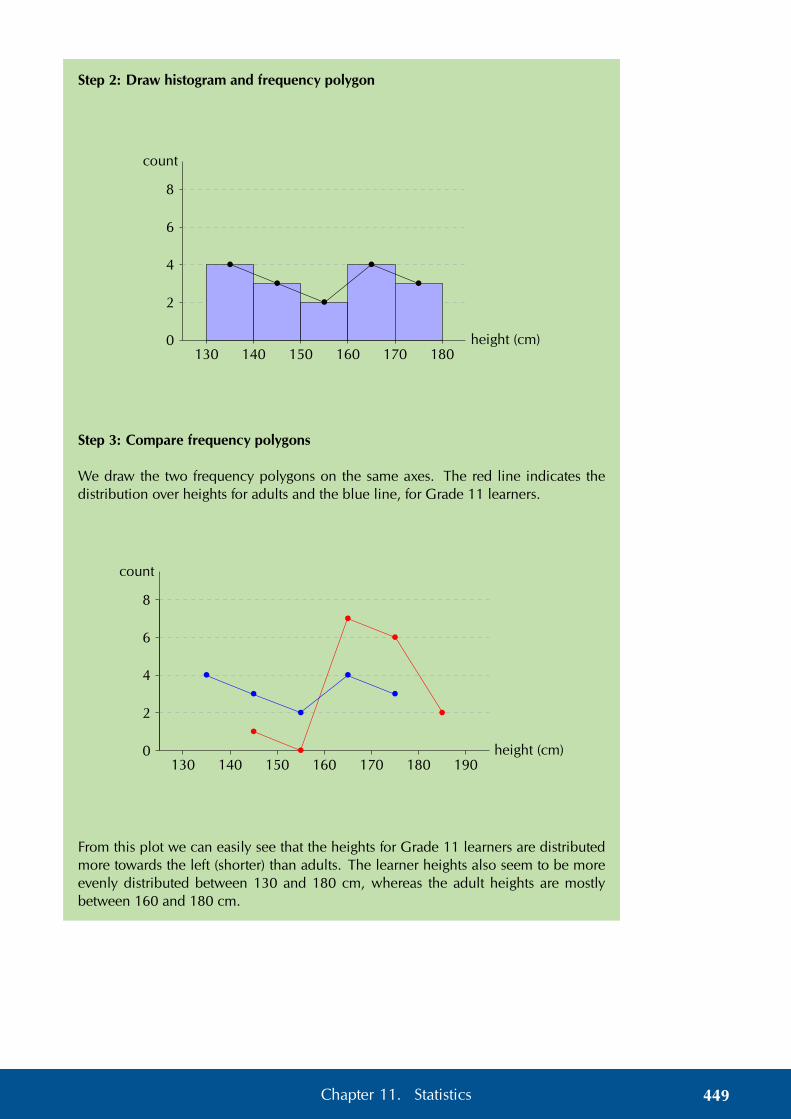
Step 2: Draw histogram and frequency polygon
height (cm)
count
0
2
4
6
8
••
•
••
130 140 150 160 170 180
Step 3: Compare frequency polygons
We draw the two frequency polygons on the same axes. The red line indicates thedistribution over heights for adults and the blue line, for Grade 11 learners.
height (cm)
count
0
2
4
6
8
••
••
•
••
•
••
130 140 150 160 170 180 190
From this plot we can easily see that the heights for Grade 11 learners are distributedmore towards the left (shorter) than adults. The learner heights also seem to be moreevenly distributed between 130 and 180 cm, whereas the adult heights are mostlybetween 160 and 180 cm.
449Chapter 11. Statistics

Exercise 11 – 2: Histograms
1. Use the histogram below to answer the following questions. The histogramshows the number of people born around the world each year. The ticks onthe x-axis are located at the start of each year.
people (millions)
year798081828384858687
1994 1995 1996 1997 1998 1999 2000 2001
a) How many people were born between the beginning of 1994 and the be-ginning of 1996?
b) Is the number people in the world population increasing or decreasing?(Ignore the rate at which people are dying for this question.)
c) How many more people were born in 1994 than in 1997?
2. In a traffic survey, a random sample of 50 motorists were asked the distance (d)they drove to work daily. The results of the survey are shown in the table below.Draw a histogram to represent the data.
d 0 < d ≤ 10 10 < d ≤ 20 20 < d ≤ 30 30 < d ≤ 40 40 < d ≤ 50f 9 19 15 5 4
3. Below is data for the prevalence of HIV in South Africa. HIV prevalence refers tothe percentage of people between the ages of 15 and 49 who are infected withHIV.
year 2002 2003 2004 2005 2006 2007 2008 2009prevalence (%) 17,7 18,0 18,1 18,1 18,1 18,0 17,9 17,9
Draw a frequency polygon of this data set.
Think you got it? Get this answer and more practice on our Intelligent Practice Service
1. 23CM 2. 23CN 3. 23CP
www.everythingmaths.co.za m.everythingmaths.co.za
450 11.2. Histograms

11.3 Ogives EMBK7
Cumulative histograms, also known as ogives, are graphs that can be used to deter-mine how many data values lie above or below a particular value in a data set. Thecumulative frequency is calculated from a frequency table, by adding each frequencyto the total of the frequencies of all data values before it in the data set. The last valuefor the cumulative frequency will always be equal to the total number of data values,since all frequencies will already have been added to the previous total.
An ogive is drawn by
• plotting the beginning of the first interval at a y-value of zero;
• plotting the end of every interval at the y-value equal to the cumulative count forthat interval; and
• connecting the points on the plot with straight lines.
In this way, the end of the final interval will always be at the total number of data sincewe will have added up across all intervals.
Worked example 8: Cumulative frequencies and ogives
QUESTION
Determine the cumulative frequencies of the following grouped data and complete thetable below. Use the table to draw an ogive of the data.
Interval Frequency Cumulative frequency10 < n ≤ 20 520 < n ≤ 30 730 < n ≤ 40 1240 < n ≤ 50 1050 < n ≤ 60 6
SOLUTION
Step 1: Compute cumulative frequencies
To determine the cumulative frequency, we add up the frequencies going down thetable. The first cumulative frequency is just the same as the frequency, because we areadding it to zero. The final cumulative frequency is always equal to the sum of all thefrequencies. This gives the following table:
Interval Frequency Cumulative frequency10 < n ≤ 20 5 520 < n ≤ 30 7 1230 < n ≤ 40 12 2440 < n ≤ 50 10 3450 < n ≤ 60 6 40
451Chapter 11. Statistics

Step 2: Plot the ogive
The first coordinate in the plot always starts at a y-value of 0 because we always startfrom a count of zero. So, the first coordinate is at (10; 0) — at the beginning of thefirst interval. The second coordinate is at the end of the first interval (which is also thebeginning of the second interval) and at the first cumulative count, so (20; 5). The thirdcoordinate is at the end of the second interval and at the second cumulative count,namely (30; 12), and so on.
Computing all the coordinates and connecting them with straight lines gives the fol-lowing ogive.
n0
10
20
30
40
10 20 30 40 50 60•
•
•
•
•
•
Ogives do look similar to frequency polygons, which we saw earlier. The most impor-tant difference between them is that an ogive is a plot of cumulative values, whereasa frequency polygon is a plot of the values themselves. So, to get from a frequencypolygon to an ogive, we would add up the counts as we move from left to right in thegraph.
Ogives are useful for determining the median, percentiles and five number summaryof data. Remember that the median is simply the value in the middle when we orderthe data. A quartile is simply a quarter of the way from the beginning or the end of anordered data set. With an ogive we already know how many data values are above orbelow a certain point, so it is easy to find the middle or a quarter of the data set.
Worked example 9: Ogives and the five number summary
QUESTION
Use the following ogive to compute the five number summary of the data. Rememberthat the five number summary consists of the minimum, all the quartiles (including themedian) and the maximum.
452 11.3. Ogives

count
value0
10
20
30
40
1 2 3 4 5 6 7 8 9 10•
•
•• • •
•
•
••
SOLUTION
Step 1: Find the minimum and maximum
The minimum value in the data set is 1 since this is where the ogive starts on thehorizontal axis. The maximum value in the data set is 10 since this is where the ogivestops on the horizontal axis.
Step 2: Find the quartiles
The quartiles are the values that are 14 , 1
2 and 34 of the way into the ordered data set.
Here the counts go up to 40, so we can find the quartiles by looking at the valuescorresponding to counts of 10, 20 and 30. On the ogive a count of
• 10 corresponds to a value of 3 (first quartile);
• 20 corresponds to a value of 7 (second quartile); and
• 30 corresponds to a value of 8 (third quartile).
Step 3: Write down the five number summary
The five number summary is (1; 3; 7; 8; 10). The box-and-whisker plot of this data setis given below.
1 3 7 8 10
453Chapter 11. Statistics

Exercise 11 – 3: Ogives
1. Use the ogive to answer the questions below. Note that marks are given as apercentage.
number of students
mark0
10
20
30
40
50
10 20 30 40 50 60 70 80 90 100•
••
•
•
•
•• •
a) How many students got between 50% and 70%?
b) How many students got at least 70%?
c) Compute the average mark for this class, rounded to the nearest integer.
2. Draw the histogram corresponding to this ogive.
0102030405060708090
100
−25 −15 −5 5 15 25•
•
••
••
3. The following data set lists the ages of 24 people.
2; 5; 1; 76; 34; 23; 65; 22; 63; 45; 53; 38
4; 28; 5; 73; 79; 17; 15; 5; 34; 37; 45; 56
Use the data to answer the following questions.
a) Using an interval width of 8 construct a cumulative frequency plot.
b) How many are below 30?
c) How many are below 60?
d) Giving an explanation state below what value the bottom 50% of the agesfall.
e) Below what value do the bottom 40% fall?
f) Construct a frequency polygon.
454 11.3. Ogives
4. The weights of bags of sand in grams is given below (rounded to the nearesttenth):
50,1; 40,4; 48,5; 29,4; 50,2; 55,3; 58,1; 35,3; 54,2; 43,5
60,1; 43,9; 45,3; 49,2; 36,6; 31,5; 63,1; 49,3; 43,4; 54,1
a) Decide on an interval width and state what you observe about your choice.
b) Give your lowest interval.
c) Give your highest interval.
d) Construct a cumulative frequency graph and a frequency polygon.
e) Below what value do 53% of the cases fall?
f) Below what value of 60% of the cases fall?
Think you got it? Get this answer and more practice on our Intelligent Practice Service
1. 23CQ 2. 23CR 3. 23CS 4. 23CT
www.everythingmaths.co.za m.everythingmaths.co.za
11.4 Variance and standard deviation EMBK8
Measures of central tendency (mean, median and mode) provide information on thedata values at the centre of the data set. Measures of dispersion (quartiles, percentiles,ranges) provide information on the spread of the data around the centre. In this sectionwe will look at two more measures of dispersion called the variance and the standarddeviation.
See video: 23CV at www.everythingmaths.co.za
Variance EMBK9
DEFINITION: Variance
Let a population consist of n elements, {x1;x2; . . . ;xn}. Write the mean of the data asx.The variance of the data is the average squared distance between the mean and eachdata value.
σ2 =
∑ni=1 (xi − x)2
n
NOTE:The variance is written as σ2. It might seem strange that it is written in squared form,but you will see why soon when we discuss the standard deviation.
455Chapter 11. Statistics

The variance has the following properties.
• It is never negative since every term in the variance sum is squared and thereforeeither positive or zero.
• It has squared units. For example, the variance of a set of heights measured incentimetres will be given in centimeters squared. Since the population varianceis squared, it is not directly comparable with the mean or the data themselves. Inthe next section we will describe a different measure of dispersion, the standarddeviation, which has the same units as the data.
Worked example 10: Variance
QUESTION
You flip a coin 100 times and it lands on heads 44 times. You then use the samecoin and do another 100 flips. This time in lands on heads 49 times. You repeat thisexperiment a total of 10 times and get the following results for the number of heads.
{44; 49; 52; 62; 53; 48; 54; 49; 46; 51}
Compute the mean and variance of this data set.
SOLUTION
Step 1: Compute the mean
The formula for the mean is
x =
∑ni=1 xin
In this case, we sum the data and divide by 10 to get x = 50,8.
Step 2: Compute the variance
The formula for the variance is
σ2 =
∑ni=1 (xi − x)2
n
We first subtract the mean from each datum and then square the result.
xi 44 49 52 62 53 48 54 49 46 51xi − x −6,8 −1,8 1,2 11,2 2,2 −2,8 3,2 −1,8 −4,8 0,2
(xi − x)2 46,24 3,24 1,44 125,44 4,84 7,84 10,24 3,24 23,04 0,04
The variance is the sum of the last row in this table divided by 10, so σ2 = 22,56.
456 11.4. Variance and standard deviation

Standard deviation EMBKB
Since the variance is a squared quantity, it cannot be directly compared to the data val-ues or the mean value of a data set. It is therefore more useful to have a quantity whichis the square root of the variance. This quantity is known as the standard deviation.
DEFINITION: Standard deviation
Let a population consist of n elements, {x1;x2; . . . ;xn}, with a mean of x. The stan-dard deviation of the data is
σ =
√∑ni=1 (xi − x)2
n
In statistics, the standard deviation is a very common measure of dispersion. Standarddeviation measures how spread out the values in a data set are around the mean. Moreprecisely, it is a measure of the average distance between the values of the data in theset and the mean. If the data values are all similar, then the standard deviation will below (closer to zero). If the data values are highly variable, then the standard variationis high (further from zero).
The standard deviation is always a positive number and is always measured in thesame units as the original data. For example, if the data are distance measurements inkilogrammes, the standard deviation will also be measured in kilogrammes.
The mean and the standard deviation of a set of data are usually reported together. Ina certain sense, the standard deviation is a natural measure of dispersion if the centreof the data is taken as the mean.
Investigation: Tabulating results
It is often useful to set your data out in a table so that you can apply the for-mulae easily. Complete the table below to calculate the standard deviation of{57; 53; 58; 65; 48; 50; 66; 51}.• Firstly, remember to calculate the mean, x.
• Complete the following table.
index: i datum: xi deviation: xi − x deviationsquared: (xi−x)2
1 572 533 584 655 486 507 668 51∑
xi = . . .∑
(xi − x) = . . .∑
(xi − x)2 = . . .
• The sum of the deviations is always zero. Why is this? Find out.
• Calculate the variance using the completed table.
• Then calculate the standard deviation.
457Chapter 11. Statistics

Worked example 11: Variance and standard deviation
QUESTION
What is the variance and standard deviation of the possibilities associated with rollinga fair die?
SOLUTION
Step 1: Determine all the possible outcomes
When rolling a fair die, the sample space consists of 6 outcomes. The data set istherefore x = {1; 2; 3; 4; 5; 6} and n = 6.
Step 2: Calculate the mean
The mean is:
x =1
6(1 + 2 + 3 + 4 + 5 + 6)
= 3,5
Step 3: Calculate the variance
The variance is:
σ2 =
∑(x− x)2
n
=1
6(6,25 + 2,25 + 0,25 + 0,25 + 2,25 + 6,25)
= 2,917
Step 4: Calculate the standard deviation
The standard deviation is:
σ =√
2,917
= 1,708
See video: 23CW at www.everythingmaths.co.za
458 11.4. Variance and standard deviation

Interpretation and application EMBKC
A large standard deviation indicates that the data values are far from the mean and asmall standard deviation indicates that they are clustered closely around the mean.
For example, consider the following three data sets:
{65; 75; 73; 50; 60; 64; 69; 62; 67; 85}{85; 79; 57; 39; 45; 71; 67; 87; 91; 49}{43; 51; 53; 110; 50; 48; 87; 69; 68; 91}
Each of these data sets has the same mean, namely 67. However, they have differentstandard deviations, namely 8,97, 17,75 and 21,23. The following figures show plotsof the data sets with the mean and standard deviation indicated on each. You can seehow the standard deviation is larger when the data are more spread out.
30 40 50 60 70 80 90 100 110
x = 67
σ = 8,97
data: {xi} = {65; 75; 73; 50; 60; 64; 69; 62; 67; 85}mean: x = 67standard deviation: σ ≈ 8,97
30 40 50 60 70 80 90 100 110
x = 67
σ = 17,75
data: {xi} = {85; 79; 57; 39; 45; 71; 67; 87; 91; 49}mean: x = 67standard deviation: σ ≈ 17,75
30 40 50 60 70 80 90 100 110
x = 67
σ = 21,23
data: {xi} = {43; 51; 53; 110; 50; 48; 87; 69; 68; 91}mean: x = 67standard deviation: σ ≈ 21,23
The standard deviation may also be thought of as a measure of uncertainty. In the phys-ical sciences, for example, the reported standard deviation of a group of repeated mea-surements represents the precision of those measurements. When deciding whether
459Chapter 11. Statistics
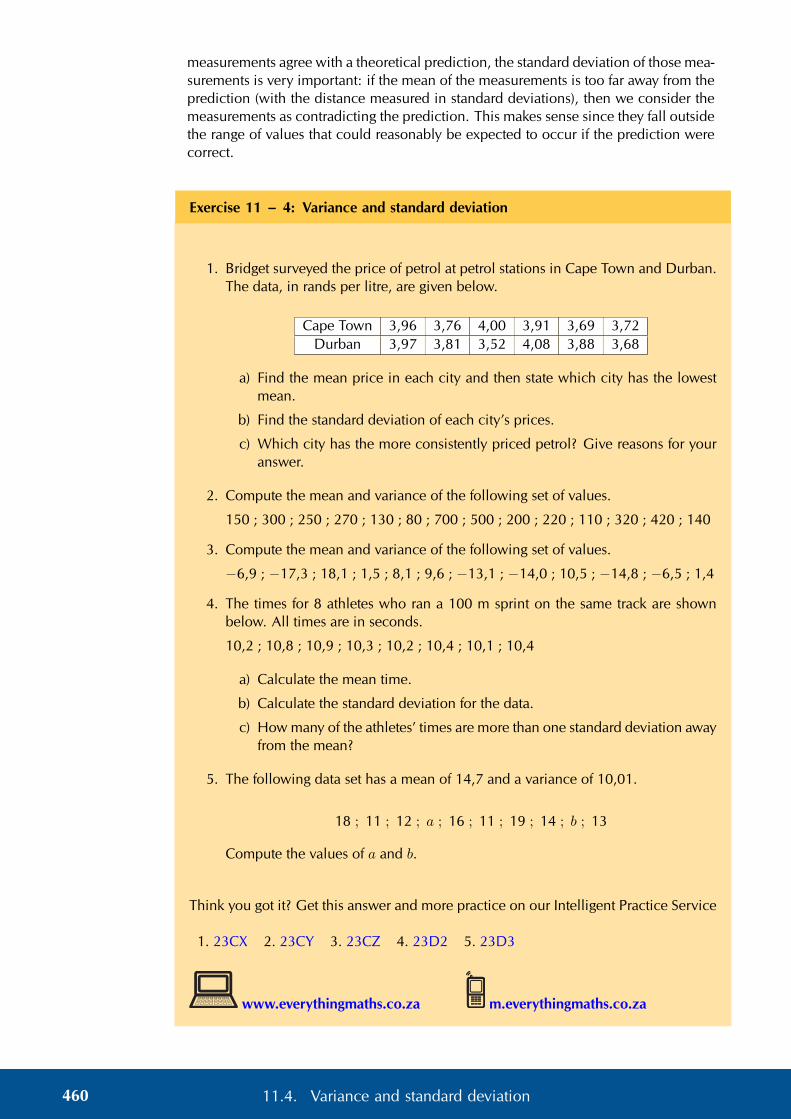
measurements agree with a theoretical prediction, the standard deviation of those mea-surements is very important: if the mean of the measurements is too far away from theprediction (with the distance measured in standard deviations), then we consider themeasurements as contradicting the prediction. This makes sense since they fall outsidethe range of values that could reasonably be expected to occur if the prediction werecorrect.
Exercise 11 – 4: Variance and standard deviation
1. Bridget surveyed the price of petrol at petrol stations in Cape Town and Durban.The data, in rands per litre, are given below.
Cape Town 3,96 3,76 4,00 3,91 3,69 3,72Durban 3,97 3,81 3,52 4,08 3,88 3,68
a) Find the mean price in each city and then state which city has the lowestmean.
b) Find the standard deviation of each city’s prices.
c) Which city has the more consistently priced petrol? Give reasons for youranswer.
2. Compute the mean and variance of the following set of values.
150 ; 300 ; 250 ; 270 ; 130 ; 80 ; 700 ; 500 ; 200 ; 220 ; 110 ; 320 ; 420 ; 140
3. Compute the mean and variance of the following set of values.
−6,9 ; −17,3 ; 18,1 ; 1,5 ; 8,1 ; 9,6 ; −13,1 ; −14,0 ; 10,5 ; −14,8 ; −6,5 ; 1,4
4. The times for 8 athletes who ran a 100 m sprint on the same track are shownbelow. All times are in seconds.
10,2 ; 10,8 ; 10,9 ; 10,3 ; 10,2 ; 10,4 ; 10,1 ; 10,4
a) Calculate the mean time.
b) Calculate the standard deviation for the data.
c) How many of the athletes’ times are more than one standard deviation awayfrom the mean?
5. The following data set has a mean of 14,7 and a variance of 10,01.
18 ; 11 ; 12 ; a ; 16 ; 11 ; 19 ; 14 ; b ; 13
Compute the values of a and b.
Think you got it? Get this answer and more practice on our Intelligent Practice Service
1. 23CX 2. 23CY 3. 23CZ 4. 23D2 5. 23D3
www.everythingmaths.co.za m.everythingmaths.co.za
460 11.4. Variance and standard deviation

11.5 Symmetric and skewed data EMBKD
We are now going to classify data sets into 3 categories that describe the shape of thedata distribution: symmetric, left skewed, right skewed. We can use this classificationfor any data set, but here we will look only at distributions with one peak. Most ofthe data distributions that you have seen so far have only one peak, so the plots in thissection should look familiar.
Distributions with one peak are called unimodal distributions. Unimodal literallymeans having one mode. (Remember that a mode is a maximum in the distribution.)
Symmetric distributions EMBKF
A symmetric distribution is one where the left and right hand sides of the distributionare roughly equally balanced around the mean. The histogram below shows a typicalsymmetric distribution.
mean ≈ median
balanced left and right tails
For symmetric distributions, the mean is approximately equal to the median. The tailsof the distribution are the parts to the left and to the right, away from the mean. Thetail is the part where the counts in the histogram become smaller. For a symmetricdistribution, the left and right tails are equally balanced, meaning that they have aboutthe same length.
The figure below shows the box and whisker diagram for a typical symmetric data set.
median halfwaybetween
first and third quartiles
Another property of a symmetric distribution is that its median (second quartile) liesin the middle of its first and third quartiles. Note that the whiskers of the plot (theminimum and maximum) do not have to be equally far away from the median. In thenext section on outliers, you will see that the minimum and maximum values do notnecessarily match the rest of the data distribution well.
461Chapter 11. Statistics

Skewed EMBKG
A distribution that is skewed right (also known as positively skewed) is shown below.
mean
medianmean > median
long right tailshort left tail
Now the picture is not symmetric around the mean anymore. For a right skeweddistribution, the mean is typically greater than the median. Also notice that the tail ofthe distribution on the right hand (positive) side is longer than on the left hand side.
median closer to first quartile
From the box and whisker diagram we can also see that the median is closer to the firstquartile than the third quartile. The fact that the right hand side tail of the distributionis longer than the left can also be seen.
A distribution that is skewed left has exactly the opposite characteristics of one that isskewed right:
• the mean is typically less than the median;
• the tail of the distribution is longer on the left hand side than on the right handside; and
• the median is closer to the third quartile than to the first quartile.
The table below summarises the different categories visually.
Symmetric Skewed right (positive) Skewed left (negative)
462 11.5. Symmetric and skewed data

Exercise 11 – 5: Symmetric and skewed data
1. Is the following data set symmetric, skewed right or skewed left? Motivate youranswer.
27 ; 28 ; 30 ; 32 ; 34 ; 38 ; 41 ; 42 ; 43 ; 44 ; 46 ; 53 ; 56 ; 62
2. State whether each of the following data sets are symmetric, skewed right orskewed left.
a) A data set with this histogram:
b) A data set with this box and whisker plot:
c) A data set with this frequency polygon:
• • • • ••• •
•
••
•
•• • •
d) The following data set:11,2 ; 5 ; 9,4 ; 14,9 ; 4,4 ; 18,8 ; −0,4 ; 10,5 ; 8,3 ; 17,8
3. Two data sets have the same range and interquartile range, but one is skewedright and the other is skewed left. Sketch the box and whisker plot for each ofthese data sets. Then, invent data (6 points in each data set) that matches thedescriptions of the two data sets.
Think you got it? Get this answer and more practice on our Intelligent Practice Service
1. 23D4 2a. 23D5 2b. 23D6 2c. 23D7 2d. 23D8 3. 23D9
www.everythingmaths.co.za m.everythingmaths.co.za
463Chapter 11. Statistics

11.6 Identification of outliers EMBKH
An outlier in a data set is a value that is far away from the rest of the values in thedata set. In a box and whisker diagram, outliers are usually close to the whiskers ofthe diagram. This is because the centre of the diagram represents the data betweenthe first and third quartiles, which is where 50% of the data lie, while the whiskersrepresent the extremes — the minimum and maximum — of the data.
Worked example 12: Identifying outliers
QUESTION
Find the outliers in the following data set by drawing a box and whisker diagram andlocating the data values on the diagram.
0,5 ; 1 ; 1,1 ; 1,4 ; 2,4 ; 2,8 ; 3,5 ; 5,1 ; 5,2 ; 6 ; 6,5 ; 9,5
SOLUTION
Step 1: Determine the five number summary
The minimum of the data set is 0,5. The maximum of the data set is 9,5. Since thereare 12 values in the data set, the median lies between the sixth and seventh values,making it equal to 2,8+3,5
2 = 3,15. The first quartile lies between the third and fourthvalues, making it equal to 1,1+1,4
2 = 1,25. The third quartile lies between the ninthand tenth values, making it equal to 5,2+6
2 = 5,6.
Step 2: Draw the box and whisker diagram
0,5 1,25 3,15 5,6 9,5
• •• • • • • •• • • •
In the figure above, each value in the data set is shown with a black dot.
Step 3: Find the outliers
From the diagram we can see that most of the values are between 1 and 6. The onlyvalue that is very far away from this range is the maximum at 9,5. Therefore 9,5 is theonly outlier in the data set.
You should also be able to identify outliers in plots of two variables. A scatter plotis a graph that shows the relationship between two random variables. We call thesedata bivariate (literally meaning two variables) and we plot the data for two differentvariables on one set of axes. The following example shows what a typical scatter plotlooks like. For Grade 11 you do not need to learn how to draw these 2-dimensional
464 11.6. Identification of outliers

scatter plots, but you should be able to identify outliers on them. As before, an outlieris a value that is far removed from the main distribution of data.
Worked example 13: Scatter plot
QUESTION
We have a data set that relates the heights and weights of a number of people. Theheight is the first variable and its value is plotted along the horizontal axis. The weightis the second variable and its value is plotted along the vertical axis. The data valuesare shown on the plot below. Identify any outliers on the scatter plot.
130 140 150 160 170 180height (cm)
30
40
50
60
70
80
90
wei
ght(
kg)
SOLUTION
We inspect the plot visually and notice that there are two points that lie far away fromthe main data distribution. These two points are circled in the plot below.
130 140 150 160 170 180height (cm)
30
40
50
60
70
80
90
wei
ght(
kg)
465Chapter 11. Statistics

Exercise 11 – 6: Outliers
1. For each of the following data sets, draw a box and whisker diagram and deter-mine whether there are any outliers in the data.
a) 30 ; 21,4 ; 39,4 ; 33,4 ; 21,1 ; 29,3 ; 32,8 ; 31,6 ; 36 ;27,9 ; 27,3 ; 29,4 ; 29,1 ; 38,6 ; 33,8 ; 29,1 ; 37,1
b) 198 ; 166 ; 175 ; 147 ; 125 ; 194 ; 119 ; 170 ; 142 ; 148
c) 7,1 ; 9,6 ; 6,3 ; −5,9 ; 0,7 ; −0,1 ; 4,4 ; −11,7 ; 10 ; 2,3 ; −3,7 ; 5,8 ; −1,4; 1,7 ; −0,7
2. A class’s results for a test were recorded along with the amount of time spentstudying for it. The results are given below. Identify any outliers in the data.
60 90 120 150 180study time (minutes)
40
50
60
70
80
90
100
mar
k(p
erce
ntag
e)
Think you got it? Get this answer and more practice on our Intelligent Practice Service
1a. 23DB 1b. 23DC 1c. 23DD 2. 23DF
www.everythingmaths.co.za m.everythingmaths.co.za
466 11.6. Identification of outliers

11.7 Summary EMBKJ
See presentation: 23DG at www.everythingmaths.co.za
• Histograms visualise how many times different events occurred. Each rectanglein a histogram represents one event and the height of the rectangle is relative tothe number of times that the event occurred.
• Frequency polygons represent the same information as histograms, but usinglines and points rather than rectangles. A frequency polygon connects the mid-dle of the top edge of each rectangle in a histogram.
• Ogives (also known as cumulative histograms) show the total number of timesthat a value or anything less than that value appears in the data set. To draw anogive you need to add up all the counts in a histogram from left to right.
– The first count in an ogive is always zero.
– The last count in an ogive is always the sum of all the counts in the dataset.
• The variance and standard deviation are measures of dispersion.
– The standard deviation is the square root of the variance.
– Variance: σ2 = 1n
∑ni=1(xi − x)2
– Standard deviation: σ =√
1n
∑ni=1(xi − x)2
– The standard deviation is measured in the same units as the mean and thedata, but the variance is not. The variance is measured in the square of thedata units.
• In a symmetric distribution
– the mean is approximately equal to the median; and
– the tails of the distribution are balanced.
• In a right (positively) skewed distribution
– the mean is greater than the median;
– the tail on the right hand side is longer than the tail on the left hand side;and
– the median is closer to the first quartile than the third quartile.
• In a left (negatively) skewed distribution
– the mean is less than the median;
– the tail on the left hand side is longer than the tail on the right hand side;and
– the median is closer to the third quartile than the first quartile.
• An outlier is a value that is far away from the rest of the data.
467Chapter 11. Statistics
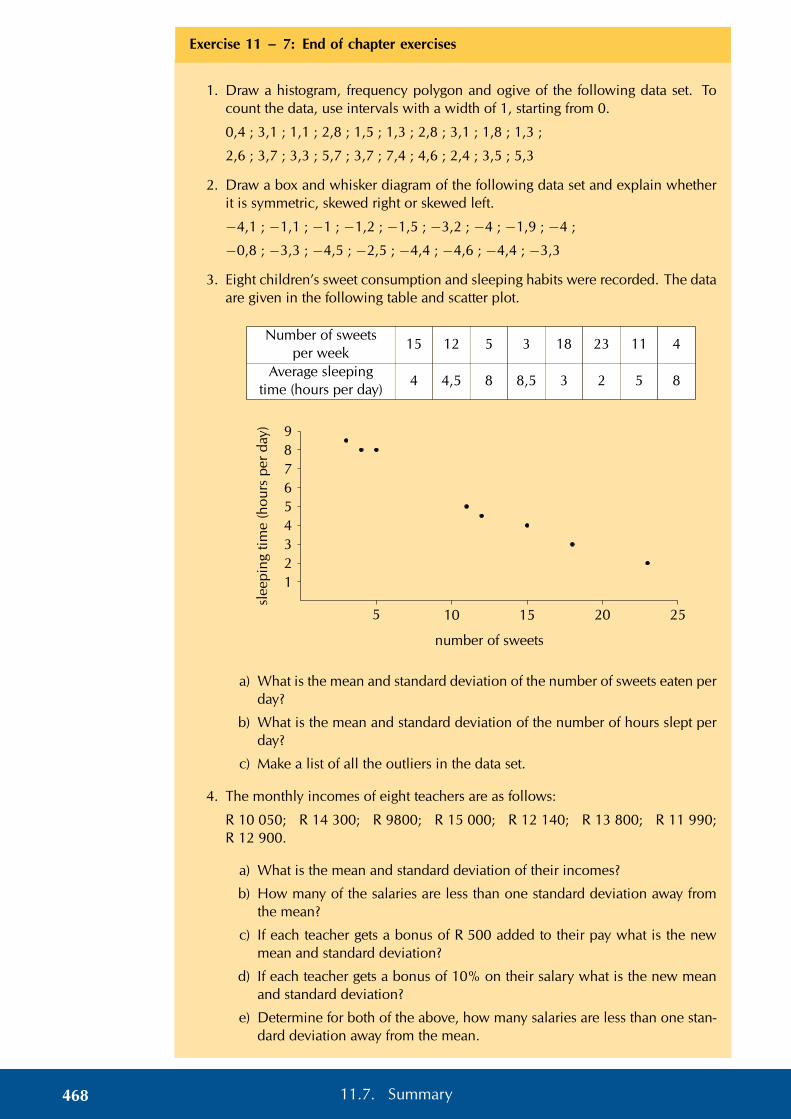
Exercise 11 – 7: End of chapter exercises
1. Draw a histogram, frequency polygon and ogive of the following data set. Tocount the data, use intervals with a width of 1, starting from 0.
0,4 ; 3,1 ; 1,1 ; 2,8 ; 1,5 ; 1,3 ; 2,8 ; 3,1 ; 1,8 ; 1,3 ;
2,6 ; 3,7 ; 3,3 ; 5,7 ; 3,7 ; 7,4 ; 4,6 ; 2,4 ; 3,5 ; 5,3
2. Draw a box and whisker diagram of the following data set and explain whetherit is symmetric, skewed right or skewed left.
−4,1 ; −1,1 ; −1 ; −1,2 ; −1,5 ; −3,2 ; −4 ; −1,9 ; −4 ;
−0,8 ; −3,3 ; −4,5 ; −2,5 ; −4,4 ; −4,6 ; −4,4 ; −3,3
3. Eight children’s sweet consumption and sleeping habits were recorded. The dataare given in the following table and scatter plot.
Number of sweetsper week
15 12 5 3 18 23 11 4
Average sleepingtime (hours per day)
4 4,5 8 8,5 3 2 5 8
5 10 15 20 25
number of sweets
123456789
slee
ping
time
(hou
rspe
rda
y)
a) What is the mean and standard deviation of the number of sweets eaten perday?
b) What is the mean and standard deviation of the number of hours slept perday?
c) Make a list of all the outliers in the data set.
4. The monthly incomes of eight teachers are as follows:
R 10 050; R 14 300; R 9800; R 15 000; R 12 140; R 13 800; R 11 990;R 12 900.
a) What is the mean and standard deviation of their incomes?
b) How many of the salaries are less than one standard deviation away fromthe mean?
c) If each teacher gets a bonus of R 500 added to their pay what is the newmean and standard deviation?
d) If each teacher gets a bonus of 10% on their salary what is the new meanand standard deviation?
e) Determine for both of the above, how many salaries are less than one stan-dard deviation away from the mean.
468 11.7. Summary

f) Using the above information work out which bonus is more beneficial fi-nancially for the teachers.
5. The weights of a random sample of boys in Grade 11 were recorded. The cumu-lative frequency graph (ogive) below represents the recorded weights.
0 10 20 30 40 50 60 70 80 90 100 110 1200
10
20
30
40
50
60
Weight (in kilogrammes)
Cum
ulat
ive
freq
uenc
yCumulative frequency curve showing weight of boys
a) How many of the boys weighed between 90 and 100 kilogrammes?
b) Estimate the median weight of the boys.
c) If there were 250 boys in Grade 11, estimate how many of them wouldweigh less than 80 kilogrammes?
6. Three sets of 12 learners each had their test scores recorded. The test was out of50. Use the given data to answer the following questions.
Set A Set B Set C25 32 4347 34 4715 35 1617 32 4316 25 3826 16 4424 38 4227 47 5022 43 5024 29 4412 18 4331 25 42
a) For each of the sets calculate the mean and the five number summary.
b) Make box and whisker plots of the three data sets on the same set of axes.
c) State, with reasons, whether each of the three data sets are symmetric orskewed (either right or left).
Think you got it? Get this answer and more practice on our Intelligent Practice Service
1. 23DH 2. 23DJ 3. 23DK 4. 23DM 5. 23DN 6. 23DP
www.everythingmaths.co.za m.everythingmaths.co.za
469Chapter 11. Statistics


CHAPTER 12
Linear programming
12.1 Introduction 472

12 Linear programming
12.1 Introduction EMBKK
In everyday life people are interested in knowing the most efficient way of carrying outa task or achieving a goal. For example, a farmer wants to know how many hectares toplant during a season in order to maximise the yield (produce), a stock broker wants toknow how much to invest in stocks in order to maximise profit, an entrepreneur wantsto know how many people to employ to minimise expenditure. These are optimisationproblems; we want to to determine either the maximum or the minimum in a specificsituation.
To describe this mathematically, we assign variables to represent the different factorsthat influence the situation. Optimisation means finding the combination of variablesthat gives the best result.
See video: 23DQ at www.everythingmaths.co.za
Worked example 1: Mountees and Roadees
QUESTION
Investigate the following situation and use your knowledge of mathematics to solve theproblem:
Mr. Hunter manufactures bicycles. He produces two different models of bicycles;strong mountain bikes called Mountees and fast road bikes called Roadees. He cannotproduce more than 5 Mountees on a day and he can manufacture a maximum of 3Roadees a day. He needs 1 technician to assemble a Mountee and 2 technicians toassemble a Roadee. The company has 8 technicians in the assembly department. Theprofit on a Mountee is R 800 and R 2400 on a Roadee. The demand is such that hecan sell all the bikes he manufactures.
Determine the number of each model of bicycle that must be manufactured in orderto make the maximum profit.
SOLUTION
Step 1: Assign variables
In this situation there are two variables that we need to consider: let the number ofMountees produced be M and let the number of Roadees produced be R.
Step 2: Organise the information given
Write down a summary of the information given in the problem so that we consider
472 12.1. Introduction

all the different components in the situation.
maximum number for M = 5
maximum number for R = 3
number of technicians needed for M = 1
number of technicians needed for R = 2
total number of technicians = 8
profit per M = 800
profit per R = 2400
Step 3: Draw up a table
Use the summary to draw up a table of all the possible combinations of the number ofMountees and Roadees that can be manufactured per day:
M R
0 1 2 3
0 (0; 0) (0; 1) (0; 2) (0; 3)
1 (1; 0) (1; 1) (1; 2) (1; 3)
2 (2; 0) (2; 1) (2; 2) (2; 3)
3 (3; 0) (3; 1) (3; 2) (3; 3)
4 (4; 0) (4; 1) (4; 2) (4; 3)
5 (5; 0) (5; 1) (5; 2) (5; 3)
Note that there are 24 possible combinations.
Step 4: Consider the limitation of the number of technicians
It takes 1 technician to assemble a Mountee and 2 technicians to assemble a Roadee.There are a total of 8 technicians in the assembly department, therefore we can writethat 1(M) + 2(R) ≤ 8.
With this limitation, we are able to eliminate some of the combinations in the tablewhere M + 2R > 8:
M R
0 1 2 30 (0; 0) (0; 1) (0; 2) (0; 3)
1 (1; 0) (1; 1) (1; 2) (1; 3)
2 (2; 0) (2; 1) (2; 2) (2; 3)
3 (3; 0) (3; 1) (3; 2) ���(3; 3)
4 (4; 0) (4; 1) (4; 2) ���(4; 3)
5 (5; 0) (5; 1) ���(5; 2) �
��(5; 3)
These combinations have been excluded as possible answers. For example, (5; 3) gives5 + 2(3) = 11 technicians.
473Chapter 12. Linear programming
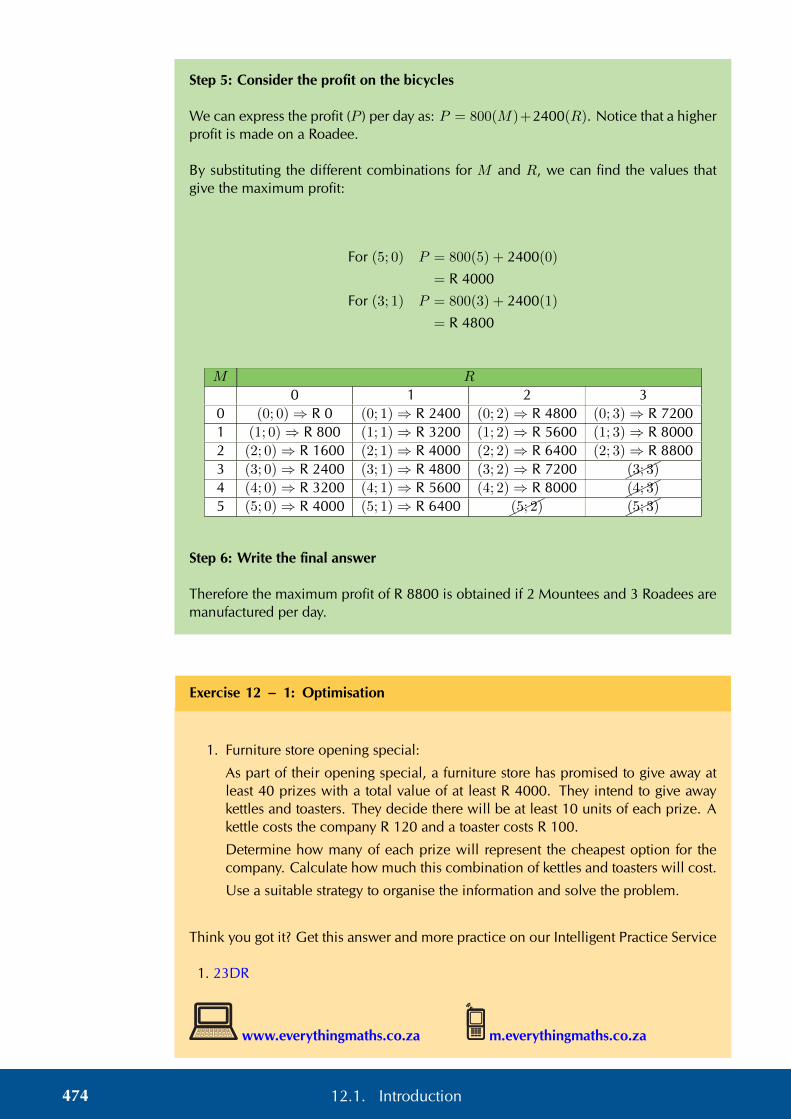
Step 5: Consider the profit on the bicycles
We can express the profit (P ) per day as: P = 800(M)+2400(R). Notice that a higherprofit is made on a Roadee.
By substituting the different combinations for M and R, we can find the values thatgive the maximum profit:
For (5; 0) P = 800(5) + 2400(0)
= R 4000
For (3; 1) P = 800(3) + 2400(1)
= R 4800
M R
0 1 2 30 (0; 0)⇒ R 0 (0; 1)⇒ R 2400 (0; 2)⇒ R 4800 (0; 3)⇒ R 72001 (1; 0)⇒ R 800 (1; 1)⇒ R 3200 (1; 2)⇒ R 5600 (1; 3)⇒ R 80002 (2; 0)⇒ R 1600 (2; 1)⇒ R 4000 (2; 2)⇒ R 6400 (2; 3)⇒ R 88003 (3; 0)⇒ R 2400 (3; 1)⇒ R 4800 (3; 2)⇒ R 7200 ���(3; 3)
4 (4; 0)⇒ R 3200 (4; 1)⇒ R 5600 (4; 2)⇒ R 8000 ���(4; 3)
5 (5; 0)⇒ R 4000 (5; 1)⇒ R 6400 ���(5; 2) ���(5; 3)
Step 6: Write the final answer
Therefore the maximum profit of R 8800 is obtained if 2 Mountees and 3 Roadees aremanufactured per day.
Exercise 12 – 1: Optimisation
1. Furniture store opening special:
As part of their opening special, a furniture store has promised to give away atleast 40 prizes with a total value of at least R 4000. They intend to give awaykettles and toasters. They decide there will be at least 10 units of each prize. Akettle costs the company R 120 and a toaster costs R 100.
Determine how many of each prize will represent the cheapest option for thecompany. Calculate how much this combination of kettles and toasters will cost.
Use a suitable strategy to organise the information and solve the problem.
Think you got it? Get this answer and more practice on our Intelligent Practice Service
1. 23DR
www.everythingmaths.co.za m.everythingmaths.co.za
474 12.1. Introduction

Optimisation using graphs
A more efficient way to solve optimisation problems is using graphs.
We write the limitations in the situation, called constraints, as inequalities. Some con-straints can be modelled by an equation, which needs to be maximised or minimized.We sketch the inequalities and indicate the region above or below the line that is to beconsidered in determining the solution. This method of solving optimisation problemsis called linear programming.
See video: 23DS at www.everythingmaths.co.za
Worked example 2: Optimisation using graphs
QUESTION
Consider again the example of Mr. Hunter who manufactures Mountees and Roadees:
Mr. Hunter manufactures bicycles. He produces two different models of bicycles;strong mountain bikes called Mountees and fast road bikes called Roadees. He cannotproduce more than 5 Mountees on a day and he can manufacture a maximum of 3Roadees a day. He needs 1 technician to assemble a Mountee and 2 technicians toassemble a Roadee. The company has 8 technicians in the assembly department. Theprofit on a Mountee is R 800 and R 2400 on a Roadee. The demand is such that hecan sell all the bikes he manufactures.
Determine the number of each model of bicycle that must be manufactured in orderto make a maximum profit.
SOLUTION
Step 1: Assign variables
In this situation there are two variables that we need to consider: let the number ofMountees produced be M and let the number of Roadees produced be R.
Notice that the values of M and R are limited to positive integers; Mr. Hunter cannotsell negative numbers of bikes nor can he sell a fraction of a bike.
Step 2: Organise the information
We can write these constraints as inequalities:
number of Mountees: 0 ≤M ≤ 5
number of Roadees: 0 ≤ R ≤ 3
total number of technicians: M + 2R ≤ 8
We also know that P = 800M + 2400R. This is called the objective function, some-times also referred to as the search line, because the objective (goal) is to determinethe maximum value of P .
475Chapter 12. Linear programming

Step 3: Solve using graphs
We represent the number of Mountees manufactured daily on the horizontal axis andthe number of Roadees manufactured daily on the vertical axis. Since M and R arepositive integers, we only use the first quadrant of the Cartesian plane. Note that thegraph only includes the integer values of M between 0 and 5 and R between 0 and 3.
Mountees (M )
Ro
ad
ees
(R)
0
1
2
3
4
0 1 2 3 4 5 6 7 8b b b b b b
b b b b b b
b b b b b b
b b b b b b
For the number of technicians in the assembly department M + 2R ≤ 8. If we makeR (represented on the y-axis) the subject of the inequality we get R ≤ −1
2M + 4.
Mountees (M )
Ro
ad
ees
(R)
0
1
2
3
4
0 1 2 3 4 5 6 7 8b b b b b b
b b b b b b
b b b b b b
b b b b b b
R = −12M + 4
The arrows indicate the region in which the solution will lie, where R ≤ −12M + 4.
This area is called the feasible region.
Mountees (M )
Ro
ad
ees
(R)
0
1
2
3
4
0 1 2 3 4 5 6 7 8b b b b b b
b b b b b b
b b b b b b
b b b b b b
R ≤ −12M + 4
A
476 12.1. Introduction

We substitute the possible combinations into the profit equation P = 800M + 2400R,and find the combination that gives the maximum profit.
At A(2; 3) : P = 800(2) + 2400(3)
= R 8800
Step 4: Write the final answer
Therefore the maximum profit is obtained if 2 Mountees and 3 Roadees are manufac-tured per day.
See video: 23DT at www.everythingmaths.co.za
Worked example 3: Optimisation using graphs
QUESTION
Solve the “furniture store opening special” problem using graphs:
As part of their opening special, a furniture store has promised to give away at least 40prizes. They intend to give away kettles and toasters. They decide there will be at least10 units of each prize. A kettle costs the company R 120 and a toaster costs R 100.
Determine how many of each prize will represent the cheapest option for the company.Calculate how much this combination of kettles and toasters will cost.
SOLUTION
Step 1: Assign variables
In this situation there are two variables that we need to consider: let the number ofkettles be k and the number of toasters be t, with k, t ∈ Z.
Step 2: Organise the information
We can write the given information as inequalities:
number of kettles: k ≥ 10
number of toasters: t ≥ 10
total number of prizes: k + t ≥ 40
We make t the subject of the inequality:
t ≥ −k + 40
477Chapter 12. Linear programming

Step 3: Solve using graphs
Represent the constraints on a set of axes:
Kettles (k)
Toasters (t)
0
10
20
30
40
0 10 20 30 40
b
Bb
t ≥ −k + 40
t ≥ 10
k ≥ 10
We shade the feasible region as shown in the diagram. Remember that in this situationonly the points with integer coordinates inside or on the border of the feasible regionare possible solutions. The combination giving the minimum cost will lie towards oron the lower border of the feasible region, which gives us many points to consider. Tofind the optimum value of C, we use the graph of the objective function
C = 120k + 100t
To draw the line, we make t the subject of the formula
t = −6
5k +
C
100
We see that the gradient of the objective function is −65 , but we do not know the exact
value of the t-intercept ( C100 ). To find the minimum value of C, we need to determinethe position of the objective function where it first touches the feasible region and alsogives the lowest t-intercept.
Kettles (k)
Toasters (t)
A
0
10
20
30
40
0 10 20 30 40
b
Bb
We indicate the gradient of the objective function on the graph (the green searchline). Keeping the gradient the same, we “slide” the objective function towards thelower border of the feasible region and find that it touches the feasible region at point
478 12.1. Introduction

A(10; 30). This optimum position of the objective function is indicated on the graphby the dotted line passing through point A.
We substitute the coordinates of A into the cost equation C = 120k + 100t:
At A(10; 30) : C = 120(10) + 100(30)
= R 4200
The minimum cost can also be determined graphically by reading off the coordinatesof the t-intercept of the objective function in the optimum position:
tint = 42
∴C
100= 42
∴ C = R 4200
Step 4: Write the final answer
Therefore the minimum cost to the company is R 4200 with 10 kettles and 30 toast-ers.
Exercise 12 – 2: Optimisation
1. You are given a test consisting of two sections. The first section is on algebra andthe second section is on geometry. You are not allowed to answer more than 10questions from any section, but you have to answer at least 4 algebra questions.The time allowed is not more than 30 minutes. An algebra problem will take 2minutes and a geometry problem will take 3 minutes to solve.
Let x be the number of algebra questions and y be the number of geometryquestions.
a) Formulate the equations and inequalities that satisfy the above constraints.
b) The algebra questions carry 5 marks each and the geometry questions carry10 marks each. If T is the total marks, write down an expression for T .
2. A local clinic wants to produce a guide to healthy living. The clinic intends toproduce the guide in two formats: a short video and a printed book. The clinicneeds to decide how many of each format to produce for sale. Estimates showthat no more than 10 000 copies of both items together will be sold. At least4000 copies of the video and at least 2000 copies of the book could be sold,although sales of the book are not expected to exceed 4000 copies. Let x be thenumber of videos sold, and y the number of printed books sold.
a) Write down the constraint inequalities that can be deduced from the giveninformation.
b) Represent these inequalities graphically and indicate the feasible regionclearly.
479Chapter 12. Linear programming

c) The clinic is seeking to maximise the income, I, earned from the sales ofthe two products. Each video will sell for R 50 and each book for R 30.Write down the objective function for the income.
d) What maximum income will be generated by the two guides?
3. A certain motorcycle manufacturer produces two basic models, the Super X andthe Super Y. These motorcycles are sold to dealers at a profit of R 20 000 perSuper X and R 10 000 per Super Y. A Super X requires 150 hours for assembly,50 hours for painting and finishing and 10 hours for checking and testing. TheSuper Y requires 60 hours for assembly, 40 hours for painting and finishing and20 hours for checking and testing. The total number of hours available per monthis: 30 000 in the assembly department, 13 000 in the painting and finishingdepartment and 5000 in the checking and testing department.
The above information is summarised by the following table:
DepartmentHours forSuper X
Hours forSuper Y
Hours availableper month
Assembly 150 60 30 000
Painting andfinishing
50 40 13 000
Checking and testing 10 20 5000
Let x be the number of Super X and y be the number of Super Y models manu-factured per month.
a) Write down the set of constraint inequalities.
b) Use graph paper to represent the set of constraint inequalities.
c) Shade the feasible region on the graph paper.
d) Write down the profit generated in terms of x and y.
e) How many motorcycles of each model must be produced in order to max-imise the monthly profit?
f) What is the maximum monthly profit?
4. A group of students plan to sell x hamburgers and y chicken burgers at a rugbymatch. They have meat for at most 300 hamburgers and at most 400 chickenburgers. Each burger of both types is sold in a packet. There are 500 packetsavailable. The demand is likely to be such that the number of chicken burgerssold is at least half the number of hamburgers sold.
a) Write the constraint inequalities and draw a graph of the feasible region.
b) A profit of R 3 is made on each hamburger sold and R 2 on each chickenburger sold. Write the equation which represents the total profit P in termsof x and y.
c) The objective is to maximise profit. How many of each type of burgershould be sold?
5. Fashion-Cards is a small company that makes two types of cards, type X and typeY. With the available labour and material, the company can make at most 150cards of type X and at most 120 cards of type Y per week. Altogether they cannotmake more than 200 cards per week.
480 12.1. Introduction

There is an order for at least 40 type X cards and 10 type Y cards per week.Fashion-Cards makes a profit of R 5 for each type X card sold and R 10 for eachtype Y card.
Let the number of type X cards manufactured per week be x and the number oftype Y cards manufactured per week be y.
a) One of the constraint inequalities which represents the restrictions above is0 ≤ x ≤ 150. Write the other constraint inequalities.
b) Represent the constraints graphically and shade the feasible region.
c) Write the equation that represents the profit P (the objective function), interms of x and y.
d) Calculate the maximum weekly profit.
6. To meet the requirements of a specialised diet a meal is prepared by mixingtwo types of cereal, Vuka and Molo. The mixture must contain x packets ofVuka cereal and y packets of Molo cereal. The meal requires at least 15 g ofprotein and at least 72 g of carbohydrates. Each packet of Vuka cereal contains4 g of protein and 16 g of carbohydrates. Each packet of Molo cereal contains3 g of protein and 24 g of carbohydrates. There are at most 5 packets of cerealavailable. The feasible region is shaded on the attached graph paper.
0 1 2 3 4 5 60
1
2
3
4
5
6
0
1
2
3
4
5
6
0 1 2 3 4 5 6Number of packets of Vuka
Nu
mb
er
of
pack
ets
of
Mo
lo
a) Write down the constraint inequalities.
b) If Vuka cereal costs R 6 per packet and Molo cereal also costs R 6 perpacket, use the graph to determine how many packets of each cereal mustbe used so that the total cost for the mixture is a minimum.
c) Use the graph to determine how many packets of each cereal must be usedso that the total cost for the mixture is a maximum (give all possibilities).
Think you got it? Get this answer and more practice on our Intelligent Practice Service
1. 23DV 2. 23DW 3. 23DX 4. 23DY 5. 23DZ 6. 23F2
www.everythingmaths.co.za m.everythingmaths.co.za
481Chapter 12. Linear programming

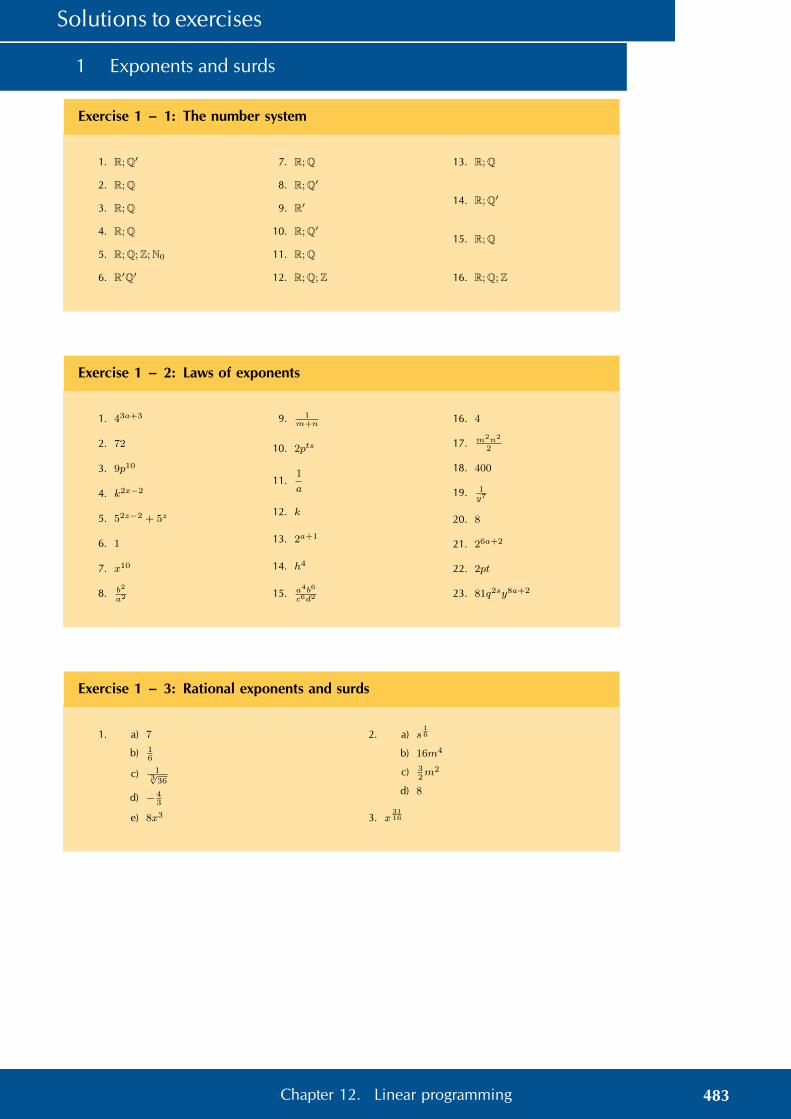
Solutions to exercises
1 Exponents and surds
Exercise 1 – 1: The number system
1. R;Q′
2. R;Q
3. R;Q
4. R;Q
5. R;Q;Z;N0
6. R′Q′
7. R;Q
8. R;Q′
9. R′
10. R;Q′
11. R;Q
12. R;Q;Z
13. R;Q
14. R;Q′
15. R;Q
16. R;Q;Z
Exercise 1 – 2: Laws of exponents
1. 43a+3
2. 72
3. 9p10
4. k2x−2
5. 52z−2 + 5z
6. 1
7. x10
8. b2
a2
9. 1m+n
10. 2pts
11.1
a
12. k
13. 2a+1
14. h4
15. a4b6
c6d2
16. 4
17. m2n2
2
18. 400
19. 1y7
20. 8
21. 26a+2
22. 2pt
23. 81q2sy8a+2
Exercise 1 – 3: Rational exponents and surds
1. a) 7
b) 16
c) 13√36
d) − 43
e) 8x3
2. a) s16
b) 16m4
c) 32m2
d) 8
3. x3116
483Chapter 12. Linear programming
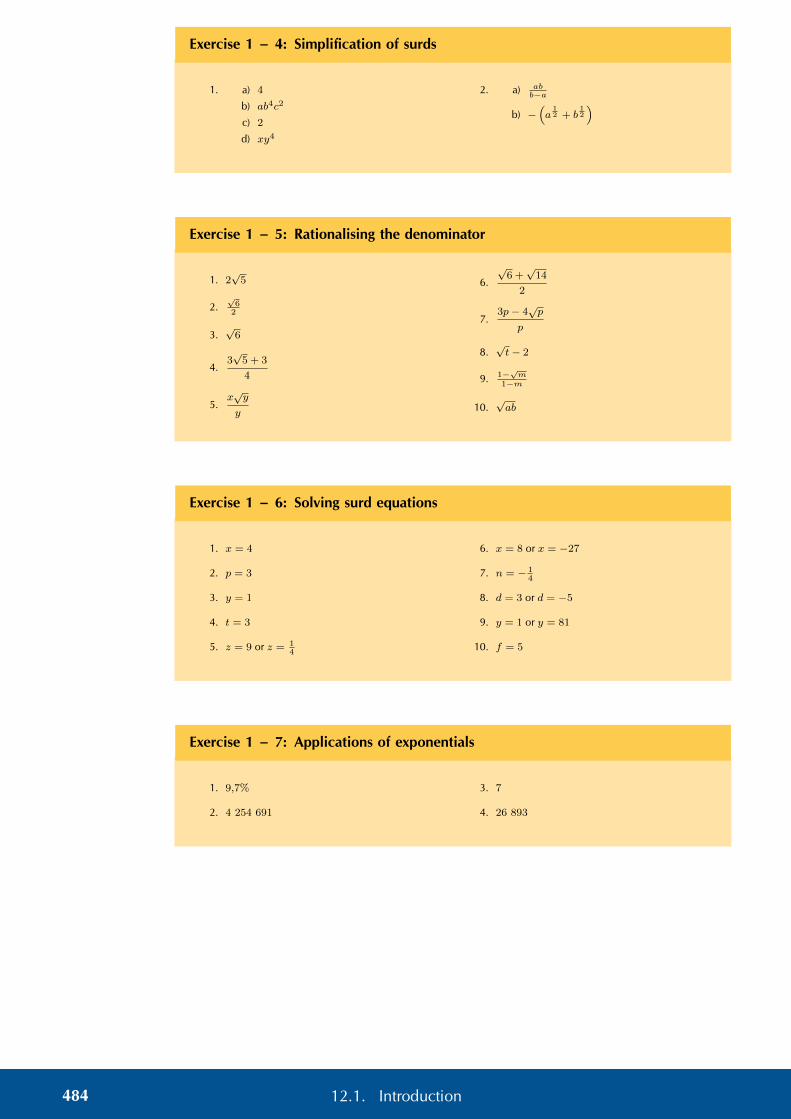
Exercise 1 – 4: Simplification of surds
1. a) 4
b) ab4c2
c) 2
d) xy4
2. a) abb−a
b) −(a
12 + b
12
)
Exercise 1 – 5: Rationalising the denominator
1. 2√5
2.√62
3.√6
4.3√5 + 3
4
5.x√y
y
6.
√6 +√14
2
7.3p− 4
√p
p
8.√t− 2
9. 1−√m
1−m
10.√ab
Exercise 1 – 6: Solving surd equations
1. x = 4
2. p = 3
3. y = 1
4. t = 3
5. z = 9 or z = 14
6. x = 8 or x = −27
7. n = − 14
8. d = 3 or d = −5
9. y = 1 or y = 81
10. f = 5
Exercise 1 – 7: Applications of exponentials
1. 9,7%
2. 4 254 691
3. 7
4. 26 893
484 12.1. Introduction
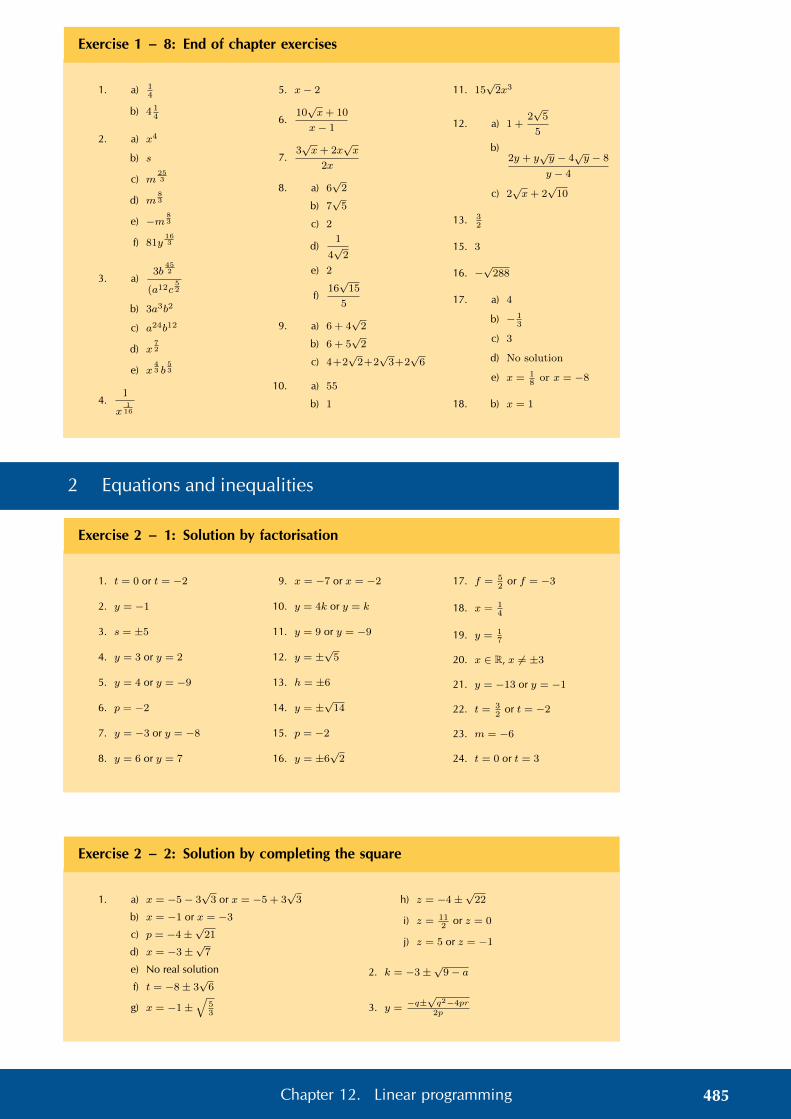
Exercise 1 – 8: End of chapter exercises
1. a) 14
b) 4 14
2. a) x4
b) s
c) m253
d) m83
e) −m83
f) 81y163
3. a)3b
452
(a12c52
b) 3a3b2
c) a24b12
d) x72
e) x43 b
53
4.1
x116
5. x− 2
6.10√x+ 10
x− 1
7.3√x+ 2x
√x
2x
8. a) 6√2
b) 7√5
c) 2
d)1
4√2
e) 2
f)16√15
5
9. a) 6 + 4√2
b) 6 + 5√2
c) 4+2√2+2√3+2√6
10. a) 55
b) 1
11. 15√2x3
12. a) 1 +2√5
5
b)2y + y
√y − 4
√y − 8
y − 4
c) 2√x+ 2
√10
13. 32
15. 3
16. −√288
17. a) 4
b) − 13
c) 3
d) No solution
e) x = 18or x = −8
18. b) x = 1
2 Equations and inequalities
Exercise 2 – 1: Solution by factorisation
1. t = 0 or t = −2
2. y = −1
3. s = ±5
4. y = 3 or y = 2
5. y = 4 or y = −9
6. p = −2
7. y = −3 or y = −8
8. y = 6 or y = 7
9. x = −7 or x = −2
10. y = 4k or y = k
11. y = 9 or y = −9
12. y = ±√5
13. h = ±6
14. y = ±√14
15. p = −2
16. y = ±6√2
17. f = 52
or f = −3
18. x = 14
19. y = 17
20. x ∈ R, x 6= ±3
21. y = −13 or y = −1
22. t = 32
or t = −2
23. m = −6
24. t = 0 or t = 3
Exercise 2 – 2: Solution by completing the square
1. a) x = −5− 3√3 or x = −5 + 3
√3
b) x = −1 or x = −3c) p = −4±
√21
d) x = −3±√7
e) No real solution
f) t = −8± 3√6
g) x = −1±√
53
h) z = −4±√22
i) z = 112
or z = 0
j) z = 5 or z = −1
2. k = −3±√9− a
3. y =−q±√q2−4pr2p
485Chapter 12. Linear programming

Exercise 2 – 3: Solution by the quadratic formula
1. t = 1 or t = −43
2. x = 5+√37
2or t = 5−
√37
2
3. No real solution
4. p = 12
or p = −1
5. No real solution
6. t = −3+√69
10or t = −3−
√69
10
7. t = 2±√2
8. k = 7+√373
18or k = 7−
√373
18
9. f = 12
or f = −2
10. No real solution
Exercise 2 – 4:
1. x = −1, x = −4, x = −2 and x = −3
2. x = 1, x = 4 and x = −2
3. x = −7, x = 4, x = −1 and x = −2
4. x = −4, x = 3, x = −3 and x = 2
5. x = 8±√40
4
6. x = −5, x = 3, x = −1 +√10 and
x = −1−√10
Exercise 2 – 5: Finding the equation
1. x2 − x− 6 = 0
2. x2 − 16 = 0
3. 2x2 − 5x− 3 = 0
4. k = 3 and x = 34
5. p = 5 and x = −1
Exercise 2 – 6: Mixed exercises
1. y = 18
or y = − 83
2. x = 32
or x = − 72
3. t = 23
or t = 2
4. y = 1 or y = −1
5. m = 1 or m = 4
6. y = ± 57
7. w = 32
or w = 4
8. y = 65
or y = 14
9. n = 83
or n = − 98
10. y = − 83
or y = 32
11. x = − 12
or x = 3
12. y = − 52
or y = − 59
13. y = 45
or y = 15
14. g = − 14
or g = 1
15. y = 2 or y = − 59
16. p = 37
or p = − 15
17. y = − 29
or y = −1
18. y = 92
or y = 97
486 12.1. Introduction

Exercise 2 – 7: From past papers
1. a) Real, unequal and rational
b) Real and equal
c) Real, unequal and irrational
d) Real, unequal and rational
e) Real, unequal and irrational
f) Non-real
g) Real, unequal and rational
h) Real, unequal and irrational
i) Non-real
j) Real and equal
2. b) real and unequal
c) k = −6± 2√6
4. a) k = 6
b) k = 13
5. a) k = 4 or k = 1
b) k = 0 or k = 5
6. a) all real values of a, b and p
b) a = b and p = 0
Exercise 2 – 8: Solving quadratic inequalities
1. a) −3 < x < 4
b) x < − 43
or when x > 1
c) no real solutions
d) −1 < t < 3
e) All real values of s.
f) All real values of x.
g) x ≤ − 14
or x ≥ 0
i) x < 3 or x > 6 with x 6= 3
j) −2 ≤ x ≤ 2 and x > 7 with x 6= 7
k) x > 0 with x 6= 0
2. a) x < −3 or x > 3
b) −√5 ≤ x ≤
√5
c) no solution
d) All real values of x
Exercise 2 – 9: Solving simultaneous equations
1. a) (0; 5) and (2; 3)
b) x = 3±√2 and y = 2±
√2
c) (−1; 0) and ( 14; 58)
d) b =2±√88
6and a =
11±√88
6e) (−3;−20) and (2; 0)
f) x =6±√264
2and y =
70±√264
2
2. a) (−3; 8) and (2; 3)
b) (−4; 14) and (3; 7)
c) (3; 4) and (4; 3)
Exercise 2 – 10:
1. b = 2 m, l = 4 m
2. 187
3. t = 10,5 s
4. t = 5d; 105 minutes; 1,4 km
5. 24 A; 70 W; 12 A
487Chapter 12. Linear programming

Exercise 2 – 11: End of chapter exercises
1. x = 1,62 or x = −0,62
2. x = ±4 or x = −1
3. y = 0 or y = ±1
4. x = ±2
5. a) x = 7 or x = 2
b) x = 2,3 or x = −1,3
c) x = 1,65 or x = −3,65
d) x = 0 or x = −3
6. x =
√16+p2−2
2
7. a = 3; b = 10 and c = −8
8. p = ±16
9. x2 + 2x− 15
10. Undefined:b = −2 Zero:b = 2 or b = 3
13. a ≥ 4
14. x = − 32
or x = 1
15. a) x < 3 or x ≥ 7:
b) x < 1 or x > 5:
c) 3 < x < 7:
d) x < −1 or x > 3
e) 0,5 < x < 2,5
f) x ≤ −3 or 0 < x ≤ 52
g) x < 23
h) −1 ≤ x < 0 or x ≥ 3
i) −4 ≤ x ≤ 1
j) 2 12≤ x < 3
16. a) x = ±√3 and y = ±2
√3
b) a = −3 and b = −1 or a = 12 and b = 4
c) x = −5 and y = 0 or x = 2 and y = 14
d) p = 53
and q = 29
or p = −1 and q = −23
e) b = 3±√5
2and a = 7±3
√5
2
f) b = −10±√140
4and a = −12±
√140
2
g) x = 3,4 and y = 5,4 or x = 3 and y = 5
h) b = −1,4 and a = 23,6 orb = 3 and a = 6
17. a)
1
2
−1
−2
−3
−4
1 2 3 4 5 6−1−2−3−4−5−6
x0
y
b
b
b)
1
2
3
4
5
6
7
8
9
10
11
1 2 3 4 5 6−1−2
x0
y
b
b
18. 35 m
20. a) y = − 54
or y = −9
b) x = − 94
or x = 1
c) p = − 87
or p = − 43
d) y = − 14
or y = 12
e) y = − 29
or y = −1
f) y = 73
or y = − 12
g) y = 94
or y = − 94
h) y = 83
or y = −6
i) y = 95
or y = −7
j) x = ±4
k) y = ±7
21. k = 76 and 49
22. x = 3 or x = −2 and y = 1±√−7
2
23. x = 4 or x = −1
24. y = 32, y = 1
2and p = 9
2, p = 7
2
25. 694
26. 7
27. 2±√12
2
28. t = 12, t = 1 or t = 3±
√33
4
488 12.1. Introduction

3 Number patterns
Exercise 3 – 1: Linear sequences
1. −19; −35; −51
2. a) −19
b) T2 = 15; T4 = 33
3. a) Tn = 10 + 3n; T10 = 40; T15 = 55;T30 = 100
b) Tn = 12 + 6n; T10 = 72; T15 = 102;T30 = 192
c) Tn = −5− 5n; T10 = −55; T15 = −80;T30 = −155
4. T9 = 36
5. a) 44; 66; 121
Exercise 3 – 2: Quadratic sequences
1. a) 10
b) 2
c) 2
d) −2
e) 2
f) −4
g) 4
h) −2
i) 6a
j) 6
k) 2t
2. a) T4 = 53
b) T2 = 30
c) T1 = 17
d) T2 = −3
e) T4 = 63
f) T1 = 2
3. a) 3; 9; 17; 27
b) −6; −9; −14; −21
c) 1; 8; 21; 40
d) 0; −5; −14; −27
Exercise 3 – 3: Quadratic sequences
1. a) 1
b) 2
c) 4
d) 8
e) −2
2. 12; 30; 58; 96; 144
3. T9 = 379
4. n = 4
5. a) T5 = 84; T6 = 111
b) Tn = 2n2 + 5n+ 9
489Chapter 12. Linear programming

Exercise 3 – 4: End of chapter exercises
1. −4; 9; 16; 25; 36
2. a) Quadratic sequence
b) Quadratic sequence
c) Quadratic sequence
d) Quadratic sequence
e) Quadratic sequence
f) Quadratic sequence
g) Linear sequence
h) Linear sequence
i) Quadratic sequence
j) Quadratic sequence
k) Quadratic sequence
l) Linear sequence
m) Quadratic sequence
3. x = 31
4. n = 11
5. T11 = 363
6. n = 9
7. T5 = 114
8. n = 8
9. a) T5 = 19;Tn = 4n− 1;T10 = 39
b) T5 = −3;Tn = 22− 5n;T10 = −28
c) T5 = 2 12
; Tn = 12n;
T10 = 5
d) T5 = a+ 4b;Tn = a− b+ bn;T10 = a+ 9b
e) T5 = −7;Tn = 3− 2n;T10 = −17
10. a) Tn = n2 + 3;T100 = 10 003
b) Tn = 6n− 4;T100 = 596
c) Tn = 2n2 + 5;T100 = 20 005
d) Tn = 3n2 + 2;T100 = 30 002
11. a) 2; 5; 8; 11; 14
b) Constant difference,d = 3
c) Yes
12. a) Tn = 4n− 19
b) n = 48
13. a) Incorrect
b) Correct
14. c) Linear
15. b) Linear
d) Quadratic
e) Tn = 12n2 + 3
2n+ 1
f) T21 = 253
g) 31 cm
16. a) −1
b) 7
17. b) 2
c) Tn = n2 − n
d) 210
e) 25
18. 4; 14; 34; 64; 104; 154
4 Analytical geometry
Exercise 4 – 1: Revision
1. a) 2√26units
b) 7 units
c) x+ 1units
2. p = 6 or p = 2
3. a) − 12
b) 3
5. 2
6. a) (1; 2)
b)(−1
2; −1
2
)7. B(4; 2)
8. a) y = −4x+ 3 andy = −4x+ 19
c) AD =√17units and
BC =√17units
d) y = 43x− 7
3
e) Parallelogram (oneopposite side equaland parallel)
9. N(0; 3)
10. a) PQ =√20 and
SR =√20
b) M( 32; 1)
d) PS: y = − 25x− 1
5
and SR: y = 12x− 2
e) No
f) Parallelogram
Exercise 4 – 2: The two-point form of the straight line equation
1. y = 23x+ 5
2. y = −3x+ 14
3. y = x+ 3
4. y = 2x− 1
5. y = −5
6. y = 34x+ 3
7. y = −x+ (s+ t)
8. y = 5x+ 2
9. y = qpx− q
490 12.1. Introduction

Exercise 4 – 3: Gradient–point form of a straight line equation
1. y = 23x+ 4
2. y = −x− 2
3. y = − 13x
4. y = 11
5. y = −2x+ 7
6. x = − 32
7. y = − 45x+ 1
8. x = 4
9. y = 3ax+ b
Exercise 4 – 4: The gradient–intercept form of a straight line equation
1. y = 2x+ 3
2. y = 4x− 4
3. y = −x− 1
4. y = − 37x
5. y = 12x− 1
5
6. y = 2x− 2
7. y = − 32
8. y = 3x+ 4
9. y = −5x
Exercise 4 – 5: Angle of inclination
1. a) 1,7
b) −1
c) 0
d) 1,4
e) Undefined
f) 1
g) −0,8h) 0
i) 3,7
2. a) 36,8◦
b) 26,6◦
c) 45◦
d) Horizontal line
e) 18,4◦
f) Vertical line
g) 71,6◦
h) 30◦
Exercise 4 – 6: Inclination of a straight line
1. a) 38,7◦
b) 135◦
c) 80◦
d) 80◦
e) 102,5◦
f) 45◦
g) 56,3◦
h) 63,4◦
i) 161,6◦
j) Gradient undefined
2. 85,2◦
3. 90◦
4. 81,8◦
Exercise 4 – 7: Parallel lines
1. a) Parallel
b) Parallel
c) Parallel
d) Not parallel
e) Parallel
f) Parallel
2. y = −2x− 3
3. y = 3x
4. y = 32x+ 1
5. y = − 710x− 1
491Chapter 12. Linear programming

Exercise 4 – 8: Perpendicular lines
1. a) Perpendicular
b) Not perpendicular
c) Perpendicular
d) Perpendicular
e) Perpendicular
f) Not perpendicular
g) Not perpendicular
2. y = 12x− 3
3. y = −5x+ 3
4. y = −x+ 2
5. x = −2
Exercise 4 – 9: End of chapter exercises
1. a) y = 12x+ 7
2
b) y = −x+ 4
c) y = 12x+ 4
d) y = 2x+ 4
e) y = 3x
2. a) θ = 63,4◦
b) θ = 18,4◦
c) θ = 36,9◦
d) θ = 146,3◦
e) θ = 161,6◦
3. a) y = −2x+ 7
b)(72; 0)
c) θ = 116,6◦
d) m = 12
e) QPR = 90◦
f) y = −2x
g)(12;− 3
2
)h) y = −2x− 1
2
4. a)
1
2
3
4
−1
−2
1 2 3−1−2−3
b
b
b
b
y
x
A(−3; 5)
B(−7;−4)
C(2; 0)
D(x; y)
b) D (6; 9)
5. a) (−1;−2)
b) (8; 3)
c) x = −1
d) MN = 5 units
e) MNP = 21,8◦
f) y = 52x+ 11
2
6. a)
1
2
3
4
5
−1
1 2 3 4 5−1−2
A(−2; 3)
B(2; 4)
C(3; 0)
y
x0
b
b
b
c) y = 14x+ 7
2
d) D(−1;−1)
e) E(52; 2)
7. a) y = 32x+ 2
b) T SV = 49,6◦
8. a)
1
2
3
4
5
−1
1 2 3 4 5−1−2
b
b
b
F (−1; 3)
H(4; 4)
G(2; 1)
y
x0
c) y = −5x+ 11
d) Yes
e) y = 32x+ 9
2
9. a)
1
2
3
4
5
−1
−2
−3
−4
−5
−6
1 2 3 4 5 6−1−2
b
b
b
b
b
A(−1; 5)
B(5;−3)
C(0;−6)
x
y
M
N
492 12.1. Introduction
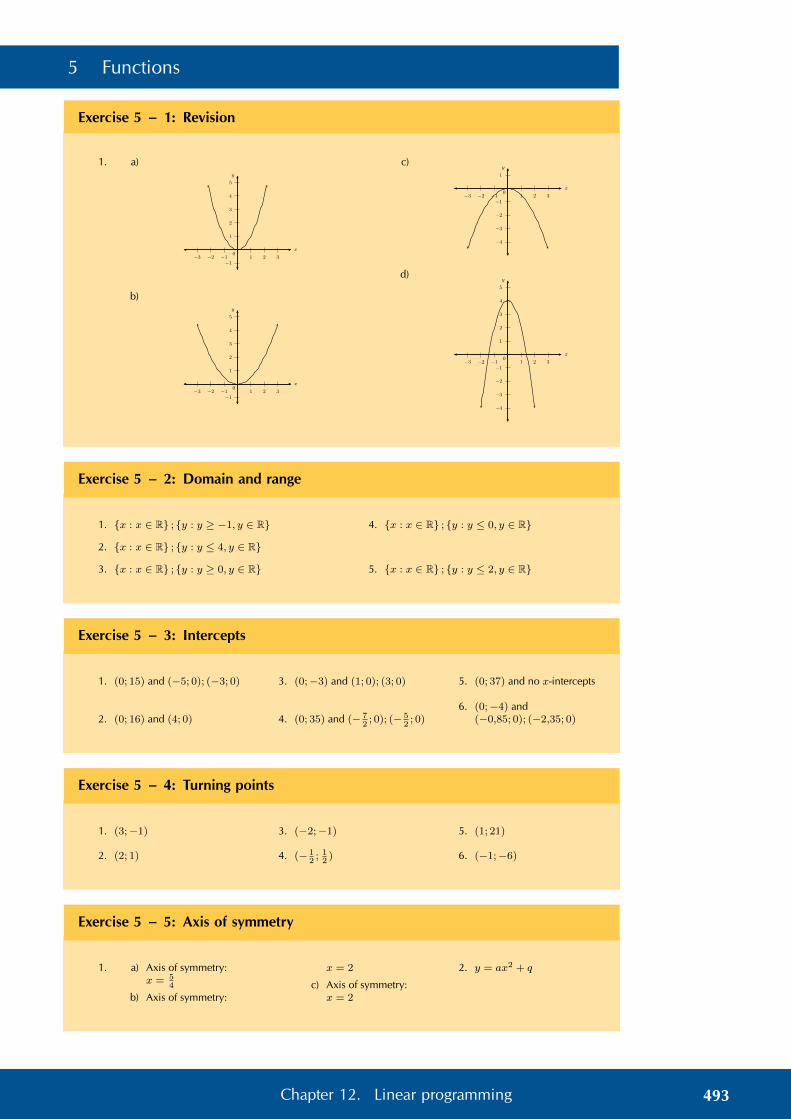
5 Functions
Exercise 5 – 1: Revision
1. a)
1
2
3
4
5
−11 2 3−1−2−3
y
x0
b)
1
2
3
4
5
−11 2 3−1−2−3
y
x0
c)1
−1
−2
−3
−4
1 2 3−1−2−3
y
x0
d)
1
2
3
4
5
−1
−2
−3
−4
1 2 3−1−2−3
y
x0
Exercise 5 – 2: Domain and range
1. {x : x ∈ R} ; {y : y ≥ −1, y ∈ R}
2. {x : x ∈ R} ; {y : y ≤ 4, y ∈ R}
3. {x : x ∈ R} ; {y : y ≥ 0, y ∈ R}
4. {x : x ∈ R} ; {y : y ≤ 0, y ∈ R}
5. {x : x ∈ R} ; {y : y ≤ 2, y ∈ R}
Exercise 5 – 3: Intercepts
1. (0; 15) and (−5; 0); (−3; 0)
2. (0; 16) and (4; 0)
3. (0;−3) and (1; 0); (3; 0)
4. (0; 35) and (− 72; 0); (− 5
2; 0)
5. (0; 37) and no x-intercepts
6. (0;−4) and(−0,85; 0); (−2,35; 0)
Exercise 5 – 4: Turning points
1. (3;−1)
2. (2; 1)
3. (−2;−1)
4. (− 12; 12)
5. (1; 21)
6. (−1;−6)
Exercise 5 – 5: Axis of symmetry
1. a) Axis of symmetry:x = 5
4
b) Axis of symmetry:
x = 2
c) Axis of symmetry:x = 2
2. y = ax2 + q
493Chapter 12. Linear programming

Exercise 5 – 6: Sketching parabolas
1. a)
1
2
3
4
5
6
7
8
9
−1
1 2 3 4 5 6−1
y
x0
Intercepts: (−1; 0), (5; 0), (0; 5)Turning point: (2; 9)Axes of symmetry: x = 2Domain: {x : x ∈ R}Range: {y : y ≤ 9, y ∈ R}
b)
1
2
3
4
5
−1
1 2 3−1−2−3
y
x0
Intercepts: (−1; 0), (0; 2)Turning point: (−1; 0)Axes of symmetry: x = −1Domain: {x : x ∈ R}Range: {y : y ≥ 0, y ∈ R}
c)
1
2
3
4
−1
−2
−3
−4
1 2 3−1−2−3
y
x0
Intercepts: (−0,87; 0), (1,54; 0), (0;−4)Turning point: (0,33;−4,33)Axes of symmetry: x = −0,33Domain: {x : x ∈ R}Range: {y : y ≥ 4,33, y ∈ R}
d)
1
2
3
4
5
6
−1
1 2 3 4−1
y
x0
Intercepts: (0; 13) Turning point: (2; 1)Axes of symmetry: x = 2Domain: {x : x ∈ R}Range: {y : y ≥ 1, y ∈ R}
3. a)y
x0
b)y
x0
c)y
x0
d)y
x0
e)y
x0
f)y
x0
4. a) yshifted = 2x2 + 16x+ 32
b) yshifted = −x2 − 2x
c) yshifted = 3x2 − 16x+ 22
494 12.1. Introduction

Exercise 5 – 7: Finding the equation
1. y = −3(x+ 1)2 + 6 or y = −3x2 − 6x+ 3
2. y = 12x2 − 5
2x
3. y = 23(x+ 2)2
4. y = −x2 + 3x+ 4
Exercise 5 – 8:
1. a) 11
2. a)
1
2
3
4
1 2−1−2
f(x)
x
0
A(1; 3)b
b) 6
c) y = 6x− 3
3. a)
1
2
−1
−2
−3
−4
1 2−1−2
g(x)
x
0
b) 1
c) 4
d) 0
Exercise 5 – 10: Domain and range
1. {x : x ∈ R, x 6= 0} ; {y : y ∈ R, y 6= 1}
2. {x : x ∈ R, x 6= 8} ; {y : y ∈ R, y 6= 4}
3. {x : x ∈ R, x 6= −1} ; {y : y ∈ R, y 6= −3}
4. {x : x ∈ R, x 6= 5} ; {y : y ∈ R, y 6= 3}
5. {x : x ∈ R, x 6= −2} ; {y : y ∈ R, y 6= 2}
Exercise 5 – 11: Intercepts
1. (0;−1 34) and
(−3 1
2; 0)
2.(52; 0) 3. (0; 1) and
(13; 0)
4.(0; 3
2
)and
(13; 0) 5. (0; 2) and (8; 0)
Exercise 5 – 12: Asymptotes
1. y = −2 and x = −4
2. y = 0 and x = 0
3. y = 1 and x = 2
4. y = −8 and x = 0
5. y = 0 and x = 2
495Chapter 12. Linear programming
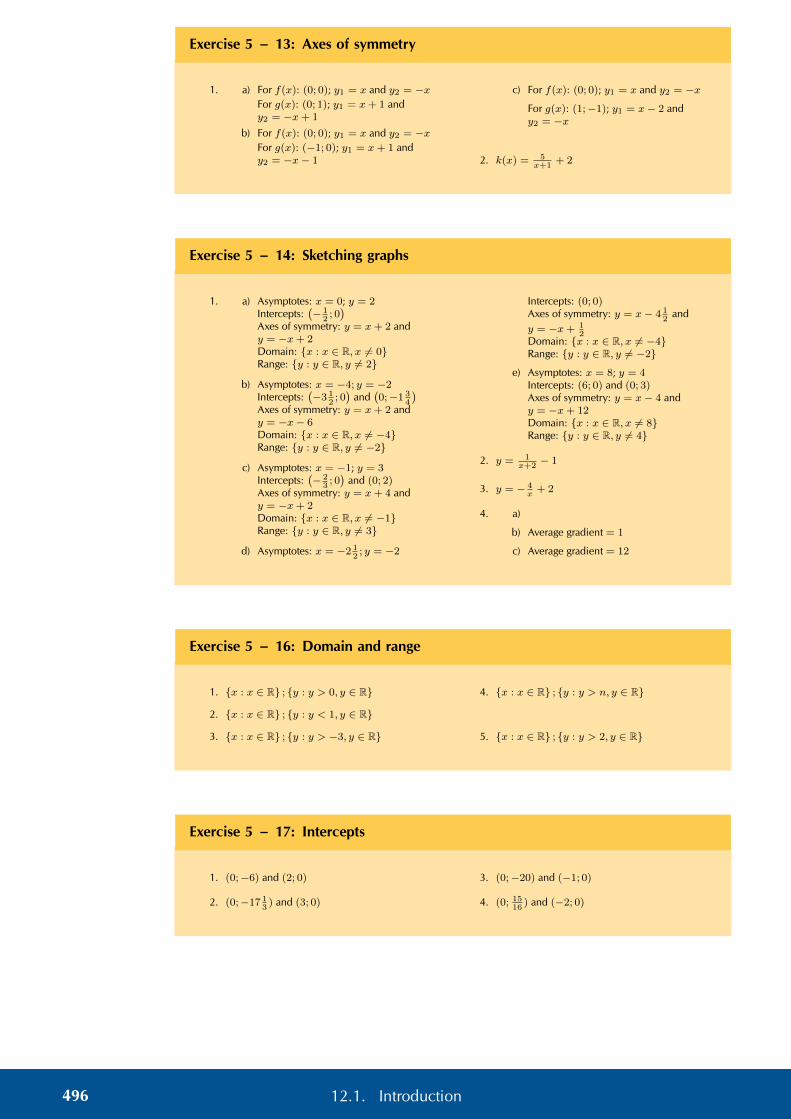
Exercise 5 – 13: Axes of symmetry
1. a) For f(x): (0; 0); y1 = x and y2 = −xFor g(x): (0; 1); y1 = x+ 1 andy2 = −x+ 1
b) For f(x): (0; 0); y1 = x and y2 = −xFor g(x): (−1; 0); y1 = x+ 1 andy2 = −x− 1
c) For f(x): (0; 0); y1 = x and y2 = −x
For g(x): (1;−1); y1 = x− 2 andy2 = −x
2. k(x) = 5x+1
+ 2
Exercise 5 – 14: Sketching graphs
1. a) Asymptotes: x = 0; y = 2Intercepts:
(− 1
2; 0)
Axes of symmetry: y = x+ 2 andy = −x+ 2Domain: {x : x ∈ R, x 6= 0}Range: {y : y ∈ R, y 6= 2}
b) Asymptotes: x = −4; y = −2Intercepts:
(−3 1
2; 0)
and(0;−1 3
4
)Axes of symmetry: y = x+ 2 andy = −x− 6Domain: {x : x ∈ R, x 6= −4}Range: {y : y ∈ R, y 6= −2}
c) Asymptotes: x = −1; y = 3Intercepts:
(− 2
3; 0)
and (0; 2)Axes of symmetry: y = x+ 4 andy = −x+ 2Domain: {x : x ∈ R, x 6= −1}Range: {y : y ∈ R, y 6= 3}
d) Asymptotes: x = −2 12; y = −2
Intercepts: (0; 0)Axes of symmetry: y = x− 4 1
2and
y = −x+ 12
Domain: {x : x ∈ R, x 6= −4}Range: {y : y ∈ R, y 6= −2}
e) Asymptotes: x = 8; y = 4Intercepts: (6; 0) and (0; 3)Axes of symmetry: y = x− 4 andy = −x+ 12Domain: {x : x ∈ R, x 6= 8}Range: {y : y ∈ R, y 6= 4}
2. y = 1x+2− 1
3. y = − 4x+ 2
4. a)
b) Average gradient = 1
c) Average gradient = 12
Exercise 5 – 16: Domain and range
1. {x : x ∈ R} ; {y : y > 0, y ∈ R}
2. {x : x ∈ R} ; {y : y < 1, y ∈ R}
3. {x : x ∈ R} ; {y : y > −3, y ∈ R}
4. {x : x ∈ R} ; {y : y > n, y ∈ R}
5. {x : x ∈ R} ; {y : y > 2, y ∈ R}
Exercise 5 – 17: Intercepts
1. (0;−6) and (2; 0)
2. (0;−17 13) and (3; 0)
3. (0;−20) and (−1; 0)
4. (0; 1516
) and (−2; 0)
496 12.1. Introduction
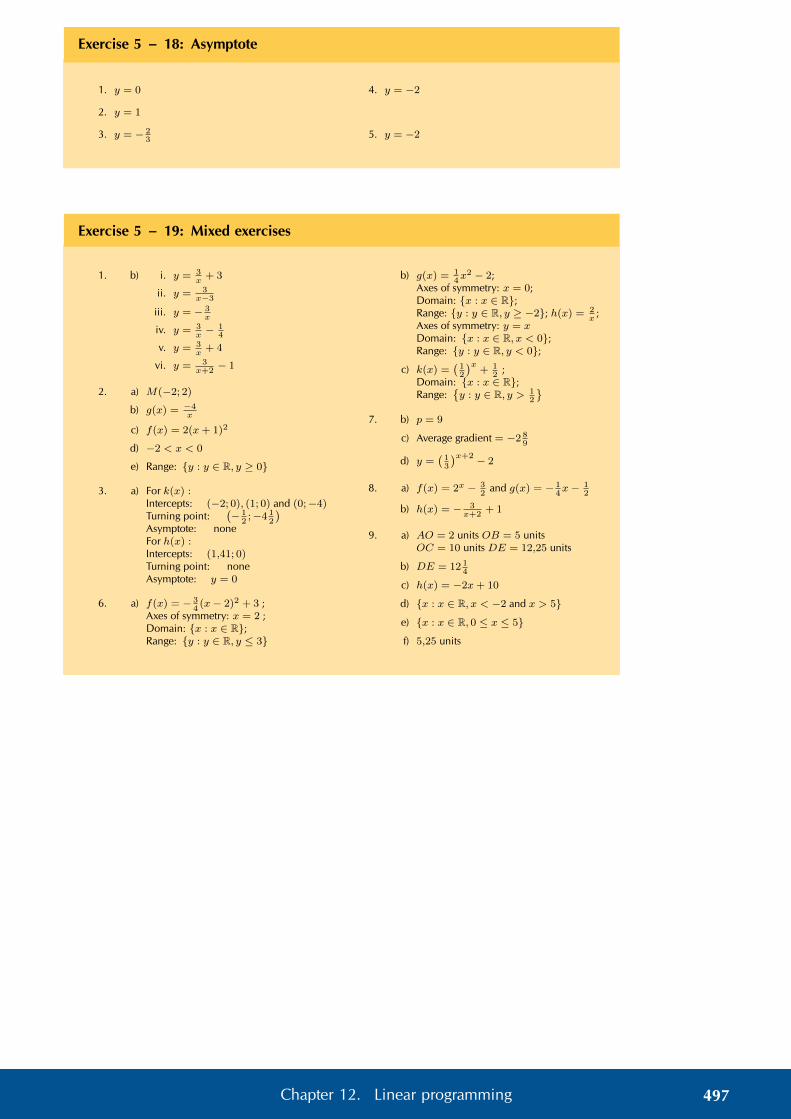
Exercise 5 – 18: Asymptote
1. y = 0
2. y = 1
3. y = − 23
4. y = −2
5. y = −2
Exercise 5 – 19: Mixed exercises
1. b) i. y = 3x+ 3
ii. y = 3x−3
iii. y = − 3x
iv. y = 3x− 1
4
v. y = 3x+ 4
vi. y = 3x+2− 1
2. a) M(−2; 2)
b) g(x) = −4x
c) f(x) = 2(x+ 1)2
d) −2 < x < 0
e) Range: {y : y ∈ R, y ≥ 0}
3. a) For k(x) :Intercepts: (−2; 0), (1; 0) and (0;−4)Turning point:
(− 1
2;−4 1
2
)Asymptote: noneFor h(x) :Intercepts: (1,41; 0)Turning point: noneAsymptote: y = 0
6. a) f(x) = − 34(x− 2)2 + 3 ;
Axes of symmetry: x = 2 ;Domain: {x : x ∈ R};Range: {y : y ∈ R, y ≤ 3}
b) g(x) = 14x2 − 2;
Axes of symmetry: x = 0;Domain: {x : x ∈ R};Range: {y : y ∈ R, y ≥ −2}; h(x) = 2
x;
Axes of symmetry: y = xDomain: {x : x ∈ R, x < 0};Range: {y : y ∈ R, y < 0};
c) k(x) =(12
)x+ 1
2;
Domain: {x : x ∈ R};Range:
{y : y ∈ R, y > 1
2
}7. b) p = 9
c) Average gradient = −2 89
d) y =(13
)x+2 − 2
8. a) f(x) = 2x − 32
and g(x) = − 14x− 1
2
b) h(x) = − 3x+2
+ 1
9. a) AO = 2 units OB = 5 unitsOC = 10 units DE = 12,25 units
b) DE = 12 14
c) h(x) = −2x+ 10
d) {x : x ∈ R, x < −2 and x > 5}
e) {x : x ∈ R, 0 ≤ x ≤ 5}
f) 5,25 units
497Chapter 12. Linear programming

Exercise 5 – 20: Revision
1.
1
−1
30◦ 60◦ 90◦ 120◦ 150◦ 180◦ 210◦ 240◦ 270◦ 300◦ 330◦ 360◦θ
0◦
y
y1 = sin θ
Period: = 360◦
Amplitude: = 1
Domain: = [0◦; 360◦]
Range: = [−1; 1]x-intercepts: = (0◦; 0); (180◦; 0); (360◦; 0)
y-intercepts: = (0◦; 0)
Max. turning point: = (90◦; 1)
Min. turning point: = (270◦;−1)
2.
1
2
−1
−2
30◦ 60◦ 90◦ 120◦ 150◦ 180◦ 210◦ 240◦ 270◦ 300◦ 330◦ 360◦θ
0◦
y
y2 = −2 sin θ
y1 = sin θ
Period: 360◦
Amplitude: 2
Domain: [0◦; 360◦]
Range: [−2; 2]x-intercepts: (0◦; 0); (180◦; 0); (360◦; 0)
y-intercepts: (0◦; 0)
Max. turning point: (270◦; 2)
Min. turning point: (90◦;−2)
3.
1
2
−1
30◦ 60◦ 90◦ 120◦ 150◦ 180◦ 210◦ 240◦ 270◦ 300◦ 330◦ 360◦θ
0◦
y
y3 = sin θ + 1
y1 = sin θ
Period: 360◦
Amplitude: 1
Domain: [0◦; 360◦]
Range: [0; 2]
x-intercepts: (270◦; 0)
y-intercepts: (0◦; 1)
Max. turning point: (90◦; 2)
Min. turning point: (270◦; 0)
4.
1
−1
−2
30◦ 60◦ 90◦ 120◦ 150◦ 180◦ 210◦ 240◦ 270◦ 300◦ 330◦ 360◦θ
0◦
y
y1 = sin θ
y4 = 1
2sin θ − 1
Period: 360◦
Amplitude:1
2
Domain: [0◦; 360◦]
Range: [−1
2;−
3
2]
x-intercepts: none
y-intercepts: (0◦;−1
2)
Max. turning point: (90◦;1
2)
Min. turning point: (270◦;−3
2)
Exercise 5 – 21: Sine functions of the form y = sin kθ
2. a) k = 2 b) k = − 34
498 12.1. Introduction

Exercise 5 – 23: The sine function
1. a)
1
2
−1
−2
60◦ 120◦ 180◦ 240◦ 300◦ 360◦−60◦−120◦−180◦−240◦−300◦−360◦θ
0◦
y
y1 = sin θ
y2 = 2 sin( θ2)
b)
1
−1
30◦ 60◦ 90◦−30◦−60◦−90◦θ
0◦
yy1 = sin θ
y2 = 1
2sin(θ − 45◦)
c)
1
2
−1
30◦ 60◦ 90◦ 120◦ 150◦ 180◦ 210◦ 240◦ 270◦ 300◦ 330◦ 360◦θ
0◦
y
y1 = sin θ
y2 = sin(θ + 90◦) + 1
d)
1
−1
60◦ 120◦ 180◦−60◦−120◦−180◦θ
0◦
yy1 = sin θ
y2 = sin(− 3θ
2)
e)
1
−1
60◦ 120◦ 180◦ 240◦ 300◦ 360◦−60◦−120◦−180◦−240◦−300◦−360◦θ
0◦
yy1 = sin θ
y2 = sin(30◦ − θ)
2. a = 2; p = 90◦ ∴ y = 2 sin(θ + 90◦) andy = 2 cos θ
Exercise 5 – 24: Revision
1.
1
−1
30◦ 60◦ 90◦ 120◦ 150◦ 180◦ 210◦ 240◦ 270◦ 300◦ 330◦ 360◦θ
0◦
y
y1 = cos θ
2.
1
2
3
−1
−2
−3
30◦ 60◦ 90◦ 120◦ 150◦ 180◦ 210◦ 240◦ 270◦ 300◦ 330◦ 360◦θ
0◦
y
y1 = cos θ
y2 = −3 cos θ
Period: 360◦
Amplitude: 1Domain: [0◦; 360◦]Range: [−3; 3]x-intercepts: noney-intercepts: (0◦; 3)Max. turning point: (0◦; 3); (360◦; 3)Min. turning point: (180◦;−3)
3.
1
2
3
−1
30◦ 60◦ 90◦ 120◦ 150◦ 180◦ 210◦ 240◦ 270◦ 300◦ 330◦ 360◦θ
0◦
y
y1 = cos θ
y3 = cos θ + 2
Period: 360◦
Amplitude: 1Domain: [0◦; 360◦]Range: [1; 3]x-intercepts: noney-intercepts: (0◦; 3)Max. turning point: (0◦; 3); (360◦; 3)Min. turning point: (180◦; 1)
4.
1
−1
30◦ 60◦ 90◦ 120◦ 150◦ 180◦ 210◦ 240◦ 270◦ 300◦ 330◦ 360◦θ
0◦
yy1 = cos θ
y4 = 1
2cos θ − 1
Period: 360◦
Amplitude: 12
Domain: [0◦; 360◦]Range: [− 1
2;− 3
2]
x-intercepts: noney-intercepts: (0◦;− 1
2)
Max. turning point: (0◦;− 12); (360◦;− 1
2)
Min. turning point: (180◦;− 32)
Exercise 5 – 25: Cosine functions of the form y = cos kθ
2. a) k = 32
b) k = 23
499Chapter 12. Linear programming

Exercise 5 – 27: The cosine function
1. a)
1
−1
30◦ 60◦ 90◦ 120◦ 150◦ 180◦−30◦−60◦−90◦−120◦−150◦−180◦θ
0◦
y
y = cos θ
y = cos(θ + 15◦)
b)
1
−1
30◦ 60◦ 90◦−30◦−60◦−90◦θ
0◦
y
y = cos θ
f(θ) = 1
3cos(θ − 60◦)
c)
1
2
−1
−2
30◦ 60◦ 90◦ 120◦ 150◦ 180◦ 210◦ 240◦ 270◦ 300◦ 330◦ 360◦θ
0◦
y
y = cos θ
y = −2 cos θ
d)
1
−1
60◦ 120◦ 180◦ 240◦ 300◦ 360◦−60◦−120◦−180◦−240◦−300◦−360◦θ
0◦
y
y1 = cos θ
y = cos(30◦ − θ)
e)
1
2
−1
−2
30◦ 60◦ 90◦ 120◦ 150◦ 180◦ 210◦ 240◦ 270◦ 300◦ 330◦ 360◦θ
0◦
y
y = cos θ
g(θ) = 1 + cos(θ − 90◦)
f)
1
−1
60◦ 120◦ 180◦ 240◦ 300◦ 360◦−60◦−120◦−180◦−240◦−300◦−360◦θ
0◦
yy1 = cos θ
y = cos(2θ + 60◦)
2. a) a = −1
b) p = −180◦
c) cos(θ − 180◦) = − cos θ
Exercise 5 – 28: Revision
1.
1
2
−1
−2
−3
90◦ 180◦ 270◦ 360◦
y
0◦θ
Period: 180◦
Domain: [0◦; 360◦]Range: [−∞;∞]x-intercepts: (26,6◦; 0); (206,6◦; 0)y-intercepts: (0◦;− 1
2)
Asymptotes: 90◦; 270◦
2.
1
2
3
−1
−2
−3
90◦ 180◦ 270◦ 360◦
y
0◦θ
Period: 180◦
Domain: [0◦; 360◦]Range: [−∞;∞]x-intercepts: (0◦; 0); (180◦; 0); (360◦; 0)y-intercepts: (0◦; 0)Asymptotes: 90◦; 270◦
3.
1
2
3
4
5
−1
90◦ 180◦ 270◦ 360◦
y
0◦θ
Period: 180◦
Domain: [0◦; 360◦]Range: [−∞;∞]x-intercepts: (116,6◦; 0); (296,6◦; 0)y-intercepts: (0◦; 2)Asymptotes: 90◦; 270◦
4.
1
2
−1
−2
−3
−4
90◦ 180◦ 270◦ 360◦
y
0◦θ
Period: 180◦
Domain: [0◦; 360◦]Range: [−∞;∞]x-intercepts: (26,6◦; 0); (206,6◦; 0)y-intercepts: (0◦;−1)Asymptotes: 90◦; 270◦
500 12.1. Introduction

Exercise 5 – 29: Tangent functions of the form y = tan kθ
1.
1
2
3
4
5
6
−1
−2
−3
−4
−5
−6
45◦ 90◦ 135◦ 180◦−45◦−90◦−135◦−180◦θ
f(θ)
Period: 90◦
Domain: [−180◦; 180◦] Range: [−∞;∞]x-intercepts: (−180◦; 0); (−90◦; 0); (0◦; 0);(90◦; 0); (180◦; 0)y-intercepts: (0◦; 0)Asymptotes: −135◦; −45◦; 45◦; 135◦
2.
1
2
3
4
5
6
−1
−2
−3
−4
−5
−6
45◦ 90◦ 135◦ 180◦−45◦−90◦−135◦−180◦θ
f(θ)
Period: 240◦
Domain: [−180◦; 180◦]Range: [−∞;∞]x-intercepts: (0◦; 0)y-intercepts: (0◦; 0)Asymptotes: −120◦; 120◦
3.
1
2
3
4
5
6
−1
−2
−3
−4
−5
−6
45◦ 90◦ 135◦ 180◦−45◦−90◦−135◦−180◦θ
f(θ)
Period: 90◦
Domain: [−180◦; 180◦]Range: [−∞;∞]x-intercepts: (−180◦; 0); (−90◦; 0); (0◦; 0);(90◦; 0); (180◦; 0)y-intercepts: (0◦; 0)Asymptotes: −135◦; −45◦; 45◦; 135◦
4.
1
2
3
4
5
6
−1
−2
−3
−4
−5
−6
45◦ 90◦ 135◦ 180◦−45◦−90◦−135◦−180◦θ
f(θ)
Period: 270◦
Domain: [−180◦; 180◦]Range: [−∞;∞]x-intercepts: (0◦; 0)y-intercepts: (0◦; 0)Asymptotes: −135◦; 135◦
501Chapter 12. Linear programming

Exercise 5 – 30: Tangent functions of the form y = tan(θ + p)
1.
1
2
3
4
5
6
−1
−2
−3
−4
−5
−6
45◦ 90◦ 135◦ 180◦ 225◦ 270◦ 315◦ 360◦−45◦−90◦−135◦−180◦−225◦−270◦−315◦−360◦θ
f(θ)
Period: 180◦
Domain: [−360◦; 360◦]Range: [−∞;∞]x-intercepts: (−225◦; 0); (−45◦; 0); (135◦; 0);(315◦; 0)y-intercepts: (0◦; 0)Asymptotes: −315◦; −135◦; 45◦; 225◦
2.
1
2
3
4
5
6
−1
−2
−3
−4
−5
−6
45◦ 90◦ 135◦ 180◦ 225◦ 270◦ 315◦ 360◦−45◦−90◦−135◦−180◦−225◦−270◦−315◦−360◦θ
f(θ)
Period: 180◦
Domain: [−360◦; 360◦]Range: [−∞;∞]x-intercepts: (−330◦; 0); (−150◦; 0); (30◦; 0);(210◦; 0)y-intercepts: (0◦;−0,58)Asymptotes: −315◦; −135◦; 45◦; 225◦
3.
1
2
3
4
5
6
−1
−2
−3
−4
−5
−6
45◦ 90◦ 135◦ 180◦ 225◦ 270◦ 315◦ 360◦−45◦−90◦−135◦−180◦−225◦−270◦−315◦−360◦θ
f(θ)
Period: 180◦
Domain: [−360◦; 360◦]Range: [−∞;∞]x-intercepts: (−240◦; 0); (−60◦; 0); (120◦; 0);(300◦; 0)y-intercepts: (0◦; 1.73)Asymptotes: −330◦; −150◦; 30◦; 210◦
Exercise 5 – 31: The tangent function
1. a)
1
2
3
4
5
6
−1
−2
−3
−4
−5
−6
45◦ 90◦−45◦−90◦θ
y
b)
1
2
3
4
5
6
−1
−2
−3
−4
−5
−6
45◦ 90◦θ
y
c)
1
2
3
4
5
6
−1
−2
−3
−4
−5
−6
45◦ 90◦ 135◦ 180◦ 225◦ 270◦ 315◦ 360◦θ
f(θ)
d)
1
2
3
4
5
6
−1
−2
−3
−4
−5
−6
45◦ 90◦ 135◦ 180◦−45◦−90◦−135◦−180◦θ
y
2. a = −1; k = 12
502 12.1. Introduction

Exercise 5 – 32: Mixed exercises
1. a) f(θ) = 32sin 2θ and g(θ) = − 3
2tan θ
b) f(θ) = −2 sin θ andg(θ) = 2 cos(θ + 360◦
c) y = 3 tan θ2
d) y = y = 2 cos θ + 2
2. a)
1
2
3
−1
−2
−3
90◦ 180◦ 270◦ 360◦θ
0
g
f
y
b
b
bb
(90◦; 2)
(270◦;−2)
b) 360◦
c) 1
d) At θ = 180◦
3. a) a = 2, b = −1 and c = 240◦
b) 180◦
c) θ = 60◦; 300◦
d) y = − tan(θ − 45◦)
4.
1
−1
90◦ 180◦ 270◦ 360◦θ
0
y1
y2
y
b b
Exercise 5 – 33: End of chapter exercises
2. a = −2; k = −1
4. a) y = x+ 22 + 2
b) y = x− 12 + 5
5. (−1; 0)
6.
y
x0
4
−4
4−4
y = 2x−3− 1
7. y = 1(x−1)
+ 2
9. a) a = −1
b) f(−15) = 0,99997
c) x = −1
d) h(x) = −2(x−2) + 1
10. a) a = 256
b) f(x) = 256(34
)xc) f(13) = 6,08
11. a)
1
−1
90◦ 180◦−90◦−180◦θ
0
y
b)
1
−1
90◦ 180◦θ
0
y
d)
1
−1
90◦ 180◦ 270◦ 360◦−90◦−180◦−270◦−360◦θ
0
y
e)
1
−1
90◦ 180◦ 270◦ 360◦θ
0
y
f)
1
2
3
4
5
6
−1
−2
−3
−4
−5
−6
45◦ 90◦ 135◦ 180◦ 225◦ 270◦ 315◦ 360◦θ
f(θ)
503Chapter 12. Linear programming

6 Trigonometry
Exercise 6 – 1: Revision
1. a) True
b) True
c) False
d) True
2. a) 50,2◦
b) 40,5◦
c) 26,6◦
d) 109,8◦
e) No solution
f) 17,7◦
g) 69,4◦
3. a) 17,3 cm
b) 10 cm
c) 64,8◦
4. a) 10 cm
b) 5,2 cm and 19,3 cm
c) 50 cm2
5. a) 2
b) 0
c) −1 12
d) 1
e) 1
6. a) 60◦
b) 12
c) 1
7. No
Exercise 6 – 2: Trigonometric identities
1. a) cosα
b) tan2 θ
c) cos2 θ
d) 0
Exercise 6 – 3: Reduction formulae for function values of 180◦ ± θ
1. a)√3
3
b) 18
c) 1
2. a) 1−cos2 θcos θ
b) −1
3. a) 2t
b) − 1t
Exercise 6 – 4: Using reduction formula
1. a) − tan θ
b) 1
c) 1
2. − cosβ
3. a) 1√3
b) 2
c) 2
d) − 32
e) − 4√3
5
5. a) −t
b) 1− t2
c) ± t√1−t2
Exercise 6 – 5: Co-functions
1. a) cos θ
b) 32
2. a) p
b)√
1− p2
c) − p√1−p2
d) p
504 12.1. Introduction

Exercise 6 – 6: Reduction formulae
1. a) sin2 θ
b) cos2 θ
c) i. 1
ii. tan2 θ
2. a) sin 17◦
b) cos 33◦
c) tan 68◦
d) − cos 33◦
3. a)√3
b)√3
2
c) 14
d) 1
Exercise 6 – 7: Solving trigonometric equations
1. a) α = 60◦; 300◦
b) α = 220,5◦; 319,5◦
c) α = 79,2◦; 259,2◦
d) α = 200,1◦; 339,9◦
e) α = 36,9◦; 143,1◦
f) α = 109,7◦; 289,7◦
2. a) θ = −323,1◦;−216,9◦; 36,9◦; 143,1◦
b) θ = −221,4◦;−138,6◦; 138,6◦; 221,4◦
c) θ = −278,5◦;−98,5◦; 81,5◦; 261,5◦
d) θ = −90◦; 270◦
e) θ = −293,6◦;−66,4◦; 66,4◦; 293,6◦
Exercise 6 – 8: General solution
1. a) θ = −128,36◦;−101,64◦; 51,64◦
b) θ = −80,45◦;−9,54◦; 99,55◦; 170,46◦
c) θ = −53,27◦; 126,73◦
d) α = 0◦
e) θ = −180◦; 0◦; 180◦
f) θ = −180◦; 180◦
g) θ = 84◦
h) θ = −120◦; 120◦
i) θ = −60◦;−30◦; 120◦; 150◦
2. a) θ = −20◦ + n . 360◦
b) α = 30◦ + n . 120◦
c) β = 10,25◦ + n . 45◦ orβ = 55,25◦ + n . 45◦
d) α = 70◦ + n . 360◦ orα = 340◦ + n . 360◦
e) θ = 140◦ + n . 240◦ orθ = 220◦ + n . 240◦
f) β = 15◦ + n . 180◦
Exercise 6 – 9: Solving trigonometric equations
1. a) θ = 45◦ + k . 180◦ orθ = 135◦ + k . 180◦
b) α = 50◦ + k . 360◦ orα = 110◦ + k . 360◦
c) θ = 60◦ + k . 720◦ orθ = 660◦ + k . 720◦
d) β = 146,6◦ + k . 180◦
e) θ = 110,27◦ + k . 360◦ orθ = 249,73◦ + k . 360◦
f) α = 210◦ + k . 360◦ orα = 330◦ + k . 360◦
g) β = 23,3◦ + k . 120◦
h) θ = 122◦ + k . 180◦
i) α = 21◦ + k . 180◦ orα = 39,5◦ + k . 90◦
j) β = 22,5◦ + k . 90◦
2. θ = 0◦, 180◦, 210◦, 330◦ or 360◦
3. a) θ = 120◦ + k . 360◦ orθ = 240◦ + k . 360◦
b) θ = 0◦ + k . 180◦ orθ = 146,3◦ + k . 180◦
c) α = 36,9◦ + k . 360◦ orα = 143,1◦ + k . 360◦ orα = 216,9◦ + k . 360◦ orα = 323,1◦ + k . 360◦
d) β = 15◦ + k . 120◦ orβ = 75◦ + k . 120◦
e) α = 48,4◦ + k . 180◦
f) θ = 63,4◦ + k . 180◦ orθ = 116,6◦ + k . 180◦
g) θ = 54,8◦ + k . 180◦ orθ = 95,25◦ + k . 180◦
4. β = −70,5◦ or β = 109,5◦
505Chapter 12. Linear programming

Exercise 6 – 10: The area rule
1. a)
P
Q
R
30◦
107
Area4PQR = 17,5 square units
b)
P
Q
R
110◦
9
8
Area4PQR = 33,8 square units
2. Area4XY Z = 645,6 square units
3. Area = 106,5 square units
4. C = 72,2◦ or C = 107,8◦
Exercise 6 – 11: Sine rule
1. a) P = 92◦, q = 6,6, p = 7,4
b) L = 87◦, l = 1,3, k = 0,89
c) B = 76,8◦, b = 94,3, c = 91,3
d) Y = 84◦, y = 60, z = 38,8
2. B = 32◦, AB = 23, BC = 39
3. ST = 78,1 km
4. m = 26,2
5. BC = 3,2
Exercise 6 – 12: The cosine rule
1. a) a = 8,5, C = 83,9◦, B = 26,1◦
b) R = 120◦, S = 32,2◦, T = 27,8◦
c) M = 27,7◦, L = 40,5◦, K = 111,8◦
d) h = 19,1, J = 18,2◦, K = 31,8◦
e) D = 34◦, E = 44,4◦, F = 101,6◦
2. a) x = 4,4 km
b) y = 63,5 cm
3. a) K = 117,3◦
b) Q = 78,5◦
Exercise 6 – 13: Area, sine and cosine rule
1. a) 7,78 km
b) 6 km
2. XZ = 1,73 km, XY = 0,87 km
3. a) 1053 km
b) 4,42◦
4. DC =x sin a sin(b+c)sin(a+c) sin b
5. b) 438,5 km
6. 9,38 m2
7. DC = x sinαsin β
506 12.1. Introduction

Exercise 6 – 14: End of chapter exercises
1. sin2 A
2. 1 14
3. cosα
4. 3
7. a) −1
b) θ = 135◦ or θ = 315◦
8. a)
b
x
y
0
θ
(−12;−5)
b) − 513
and 1213
c) θ = 202,62◦
9. a) a = 1 and b = −√3
b) −√
32
10. a) x = 50,9◦ or x = 309,1◦
b) x = 127,3◦ or x = 307,3◦
c) x = 26,6◦; 153,4◦206,6◦ or 333,4◦
11. a) x = 55◦ + k . 360◦ orx = 175◦ + k . 360◦
b) x = 180◦ + k . 360◦
12. a) x = 28,6◦ + k . 180◦ orx = 61,4◦ + k . 180◦
b)
1
−1
30◦ 60◦ 90◦ 120◦ 150◦ 180◦ 210◦ 240◦ 270◦ 300◦ 330◦ 360◦
b b b b
θ
0◦
y
y = sin 2α
c) 28,6◦; 61,4◦; 208,6◦; 241,4◦
13. a) AGN = α− β
b) A = 90◦ − α
d) H = 5 m
14. a) AC = 9,43 m
b) AD = 6,2 m
c) Area = 49,25 m2
d) Area = 49,23 m2
7 Measurement
Exercise 7 – 1: Area of a polygon
1. b) 240 cm
c) 0,6 m2
e) Wood: 233,2 cm and paper: 0,6 m2
2. a) 25π units2
b) 20π units2
3. a) 1,2 m2
b) Perimeter: 414,8 cm; Area 11 700 cm2
c) 108× 108cm2
Exercise 7 – 2: Calculating surface area
1. 273 cm2 2. Yes
Exercise 7 – 3: Calculating volume
1. a) 67,5 m2
b) 3,39 `
2. b) 13,86 cm
c) 554,24 m3
507Chapter 12. Linear programming

Exercise 7 – 4: Finding surface area and volume
1. a) 120 cm2
b) 124 cm3
c) 40
d) i. 120 mm
ii. 165 mm
iii. 589 mm
Exercise 7 – 5: The effects of k
1. a) Is halved
b) Approx. 50 times bigger
2. a) 0,5W 3
b) 0,93×W
Exercise 7 – 6: End of chapter exercises
2. a and d
3. a) Triangular prism
b) Triangular pyramid
c) Rhombic prism
4. a) i. 856 cm2
ii. Rectangularprism
iii. 960 cm3
b) 600 cm2
5.√5x2
6. a) 72 000 cm3
b) H = 54 cm andh = 60,2 cm
c) 12 732 cm2
7. No
8. a) 10 cm× 10 cm×10 cm
b) 12,6 cm
9. a) Volume triples
b) Surface area ×9
c) Volume ×27
8 Euclidean geometry
Exercise 8 – 1: Perpendicular line from center bisects chord
1. x =√41
2. x =√84
3. x = 10 units
4. TU = 2,66 units
5. x = 3,6 units
Exercise 8 – 2: Angle at the centre of circle is twice angle at circumference
1. b = 90◦
2. c = 22,5◦
3. d = 200◦
4. e = 55◦
5. f = 120◦
508 12.1. Introduction

Exercise 8 – 3: Subtended angles in the same segment
1. a) a = 21◦
b) c = 24◦ d = 78◦
c) d = 28◦
2. a) e = 85◦
3. f = 35◦
Exercise 8 – 4: Cyclic quadrilaterals
1. a) a = 93◦, b = 74◦
b) a = 114◦c) a = 29◦
Exercise 8 – 5: Tangents to a circle
1. d = 9,4 cm
2. e = 2,5 cm
3. f = 3 cm
Exercise 8 – 6: Tangent-chord theorem
1. a) a = 33◦, b = 33◦
b) c = 72◦, d = 54◦
c) f = 38◦, g = 47◦
d) l = 48◦
e) i = 40◦, j = 101◦,k = 40◦
f) m = 56◦, n = 34◦,o = 56◦
g) p = 38◦, q = 52◦,r = 90◦
2. a = 26◦, b = 64◦, c = 128◦
Exercise 8 – 7: End of chapter exercises
1. a) A = x
b) COD = 2x
c) D = 90◦ − x
2. a) D1 = 78◦
b) M1 = 39◦
c) F2 = 51◦
d) G = 58◦
e) E1 = 32◦
3. a) D2 = x
b) OAB = x
c) OBA = x
d) AOB = 180◦ − 2x
e) C = 90◦ − x
4. a) OM = 3 cm
b) AM = 8 cm
c) AB = 4√5cm
5. x = 35◦
6. a) RQS, QSO
b) POS = 2x
7. a) ODC = 35◦
b) COD = 110◦
c) CBD = 55◦
d) BAD = 90◦
e) ADB = 45◦
8. x = 4y
10. OQ = 17 mm
11. a) QRP,QSP,RST
b) SRT = 80◦, STR =30◦, P QS = 30◦
d) PMQ = 110◦
13. a) 90◦ − x2
b) x2
c) 90◦ − x2
14. c) 90◦ − 2x
d) AO = 13 cm
509Chapter 12. Linear programming

9 Finance, growth and decay
Exercise 9 – 1: Revision
1. R 13 630
2. R 10 246,59
3. a) R 2536
b) R 2468,27
4. 9,38%
5. 4,56%
Exercise 9 – 2: Simple decay
1. R 112 000
2. R 941,18
3. 11,66%
4. 7 years
Exercise 9 – 3: Compound depreciation
1. R 23 766,73
2. 2229 cormorants
3. R 131 072
4. 132 221
5. 7,62 kg
6. R 85 997,13
Exercise 9 – 4: Finding i
1. 14,9%
2. 16,4%
3. 12,0%
4. 9,4%
Exercise 9 – 5: Timelines
1. R 38 588,25
2. R 35 308,00
3. R 2600
4. R 19 950,62
5. R 1 149 283,50
6. R 7359,83
Exercise 9 – 6: Nominal and effect interest rates
1. a) 12,6%
b) 15,5%
c) 22,1%
2. a) 16,8%; 17,7%;17,5%
b) 17,7%
c) 16,8%
3. 9,1%
4. 9,4%
5. a) 9,42% is the betterrate.
b) 9,38%
c) 9,52%
510 12.1. Introduction

Exercise 9 – 7: End of chapter exercises
1. a) R 246 400
b) R 265 599,87
2. R 229,92
3. a) R 8800
b) 18,1%
4. R 238 191,17
5. a) 7,44%
b) R 148 826,15
c) R 135 968,69
6. a) R 8042,19
b) 26,82%
8. a) 11,3%
b) 11,1%
c) 11,0%
9. R 322 580,65
10. a) 4,7%
b) 4,8%
11. R 212 347,69
10 Probability
Exercise 10 – 1: Revision
1. yr+b+y
2. 512
3. 38
4. 3
6. 5
7. a) 16
b) 821
8. a) 49
b) 59
c) 19
d) 89
e) 59
f) 49
9. a) 24116≈ 0,21
b) 65116≈ 0,56
c) 0
d) 2129≈ 0,72
10. 0,28
Exercise 10 – 2: Venn diagram revision
1. 0,5 2. 0,7 3. 0,18
Exercise 10 – 3: Dependent and independent events
1. a) not mutuallyexclusive
b) dependent
2. a) 1730
b) 1130
c) Yes
d) No
3. independent and notmutually exclusive
511Chapter 12. Linear programming

Exercise 10 – 4: Venn diagrams
1. a) 940
b) 35
c) 110
d) dependent
2. P (Z and not (X or Y )) = 425
3. a)
2
M
8
14
H
164 G
29
6
b) 6
c) 29
d) 2
4.
A
B C
Exercise 10 – 5: Tree diagrams
1. 736
2. 6711296
3. a) 14
b) 516
4. a) 14
b) 516
Exercise 10 – 6: Contingency tables
1. a) 58
b) 823
c) 1223
d) dependent
2. The events are whether a bus leaves fromLocation A or not and whether a bus left late or
not.
The events are dependent.
3.
A not A TotalsB 14 6 20
not B 21 9 30Totals 35 15 50
512 12.1. Introduction
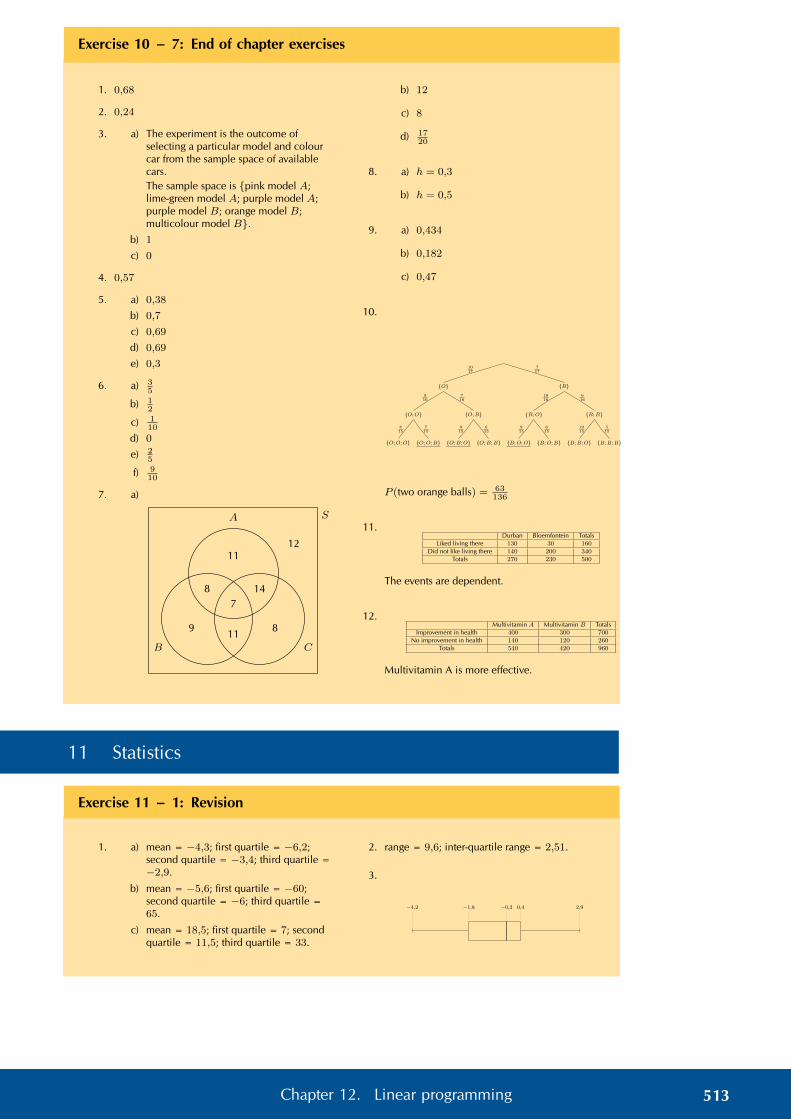
Exercise 10 – 7: End of chapter exercises
1. 0,68
2. 0,24
3. a) The experiment is the outcome ofselecting a particular model and colourcar from the sample space of availablecars.The sample space is {pink model A;lime-green model A; purple model A;purple model B; orange model B;multicolour model B}.
b) 1
c) 0
4. 0,57
5. a) 0,38
b) 0,7
c) 0,69
d) 0,69
e) 0,3
6. a) 35
b) 12
c) 110
d) 0
e) 25
f) 910
7. a)
SA
11
8
B
9 11C
8
147
12
b) 12
c) 8
d) 1720
8. a) h = 0,3
b) h = 0,5
9. a) 0,434
b) 0,182
c) 0,47
10.
815
{O;O;O}
715
{O;O;B}
915
{O;B;O}
615
{O;B;B}
915
{B;O;O}
615
{B;O;B}
1015
{B;B;O}
515
{B;B;B}
916
{O;O}
716
{O;B}
1016
{B;O}
616
{B;B}
1017
{O}
717
{B}
P (two orange balls) = 63136
11.Durban Bloemfontein Totals
Liked living there 130 30 160Did not like living there 140 200 340
Totals 270 230 500
The events are dependent.
12.Multivitamin A Multivitamin B Totals
Improvement in health 400 300 700No improvement in health 140 120 260
Totals 540 420 960
Multivitamin A is more effective.
11 Statistics
Exercise 11 – 1: Revision
1. a) mean = −4,3; first quartile = −6,2;second quartile = −3,4; third quartile =−2,9.
b) mean = −5,6; first quartile = −60;second quartile = −6; third quartile =65.
c) mean = 18,5; first quartile = 7; secondquartile = 11,5; third quartile = 33.
2. range = 9,6; inter-quartile range = 2,51.
3.
−4,2 −1,8 −0,2 0,4 2,9
513Chapter 12. Linear programming

Exercise 11 – 2: Histograms
1. a) 170 million
b) increasing
c) 3 million
2.
d
count
0
4
8
12
16
20
10 20 30 40 50
3.
year
prevalence
17,5%
17,6%
17,7%
17,8%
17,9%
18,0%
18,1%
18,2%
•
•
• • •
•
• •
2002 2003 2004 2005 2006 2007 2008 2009
Exercise 11 – 3: Ogives
1. a) 20
b) 15
c) 60%
2.
0
10
20
30
40
−25 −15 −5 5 15 25
3. a)
age (years)0
5
10
15
20
25
•
••
••
••
••
•
•
0 8 16 24 32 40 48 56 64 72 80
b) 11 people
c) 19 people
d) 34
e) 25,5
f)
age (years)0
1
2
3
4
5
6 •
•
•
•
•
•
•
•
•
•
0 8 16 24 32 40 48 56 64 72 80
4. e) 49,25
f) 49,7
Exercise 11 – 4: Variance and standard deviation
1. a) Cape Town: 3,84. Durban: 3,82.
b) Cape Town: 0,121. Durban: 0,184.
c) Cape Town
2. Mean = 270,7. Variance = 27 435,2.
3. Mean = −1,95. Variance = 127,5.
4. a) 10,4
b) 0,27
c) 3
5. 13 and 20
Exercise 11 – 5: Symmetric and skewed data
1. skewed left
2. a) skewed right
b) skewed right
c) skewed left
d) symmetric
514 12.1. Introduction

Exercise 11 – 6: Outliers
1. a)
21,1 33,8 39,429,1 30,0
There are two outliers on the left.
b)119 144,5 157 172,5 198
There are no outliers.
c)−11,7 −1,05 1,7 6,05 10
There is one outlier on the left.
2.
60 90 120 150 180
study time (minutes)
40
50
60
70
80
90
100
mar
k(p
erce
ntag
e)Exercise 11 – 7: End of chapter exercises
1.
0
1
2
3
4
5
6
0 1 2 3 4 5 6 7 8
0
1
2
3
4
5
6
•
•
•
•
•
•
•
•
0 1 2 3 4 5 6 7 8
0
5
10
15
20
••
•
•
••
• ••
0 1 2 3 4 5 6 7 8
2.
−4,6 −4,1 −3,3 −1,5 −0,8
Skewed right
3. a) Mean = 11 38
. Standard deviation = 6,69.
b) Mean = 5 38
. Standard deviation = 2,33.
c) There are no outliers.
4. a) Mean = R 12 497,50. Standard deviation= R 1768,55.
b) 4
c) Mean = R 12 997,50. Standard deviation= R 1768,55.
d) Mean = R 13 747,25. Standard deviation= R 1945,41.
e) 4
f) 10%
5. a) 14
b) approximately 88 kg.
c) 75
6. a) A. Mean = 23,83. Five number summary= [ 12 ; 16,5 ; 24 ; 26,5 ; 47 ].
B. Mean = 31,17. Five number summary= [ 16 ; 25 ; 32 ; 36,5 ; 47 ].
C. Mean = 41,83. Five number summary= [ 16 ; 42 ; 43 ; 45,5 ; 50 ].
b)
10 15 20 25 30 35 40 45 50
Set A
Set B
Set C
c) Set A: skewed left. Set B: slightly skewedleft. Set C: skewed right.
515Chapter 12. Linear programming

12 Linear programming
Exercise 12 – 2: Optimisation
1. a) x ≤ 10; y ≤ 10; x ≥ 4; 2x+ 3y ≤ 30
b) T = 5x+ 10y
2. a) x+ y ≤ 10 000; x ≥ 4000; y ≥ 2000;y ≤ 4000
c) I = 50x+ 30y
d) R 460 000
3. a) 150x+ 60y ≥ 30 000;50x+ 40y ≥ 13 000;(10)x+ (20)y ≥ 5000
d) E = (20 000)x+ (10 000)y
e) 140 Super X and 150 Super Y
f) R 4 300 000
4. a) x ≤ 300; y ≥ 0.5x; x+ y ≤ 500
b) P = (3)x+ (2)y
c) 300 hamburgers and 200 chicken burgers
5. a) x ≤ 150; y ≤ 120;x+ y ≤ 200;x ≥40; y ≥ 10
b)
50
100
150
200
250
50 100 150 200 250
x
y
A B
C
D
E
c) P = (5)x+ (10)y
d) 80 of card X and 120 of card Y
6. a) 4x+ 3y ≥ 15; 16x+ 24y ≥ 72;x+ y ≤ 5
b) 3 packets of Vuka and 1 packets of Molo
c) 0; 5 or 5; 0
516 12.1. Introduction