Embed Size (px)
Citation preview
THE JOURNAL OF RIOLOGICAL CHEMISTRY Vol. 248, No. 10,Issue of May 25, pp. 3-105-3410, 1973
Printed in U.S.A.
Size and Configuration of Glycoprotein Fragments Cleaved
from Tumor Cells by Broteolysis*
(Received for publication, August 25, 1972)
HENRY S. SLAYTER AND JOHN F. CODINGTON
From the Children’s Cancer Research Foundation and Department of Pathology, Harvard Medical School, Boston, Massachusetts 02115, and the Laboratory for Carbohydrate Research, Departments of Biological Chemistry and Medicine, Harvard Medical School and Massachusetts General Hospital, Boston, Massachusetts 02114
SUMMARY
Mucin-type glycoprotein material was fractionated by gel filtration after cleavage from viable TA3-Ha mouse mam- mary adenocarcinoma ascites cells by a modified trypsin. The macromolecular species present in each fraction were characterized by electron microscopy of metal-contrasted replicas as highly asymmetric rods. Investigation of one fraction gave close agreement for length by electron micro- scopic measurements and for a length calculated for a single polypeptide backbone model from a molecular weight value by short column sedimentation equilibrium, amino acid composition, and percentage of protein. This result supports a single, extended chain configuration for this fraction. With this value of molecular weight per unit length, ap- proximate molecular weights of particles of the other fractions were calculated. Lengths of polypeptide chains varied from 50 nm (55,000 daltons) to greater than 700 nm, suggest- ing an average molecular weight for one fraction of over 500,000.
The presence of carbohydrate-containing macromolecules at cell surfaces has been readily demonstrated by histochemical staining (I), and it has been concluded that all animal cells possess glycoproteins at their surfaces (2). Glycoproteins at the surfaces of mammalian cells have been implicated in diverse and vital cellular functions. These have been reported to include ektobiological activities of cells, such as contact inhibition of growth (3), cellular adhesion (4), transplantation rejection (5), tumor-specific antigenic activity (6), and suppression of anti- genie activity (7). Cell surface glycoproteins may also partici- pate in active transport (8) and contain blood-specific groupings
* This work was supported by Research Grants GM14237 from the National Institute of General Medical Sciences, FR-05526 from the Division of Research Facilities and Resources, National Institutes of Health, and by Research Grant CA-08418 from the National Cancer Institute, National Institutes of Health, United States Public Health Service. This publication is No. 595 of the Robert Lovett Memorial Group for the Study of Diseases Causing Deformities, Harvard Medical School and Massachusetts Generay Hospital. ’
(9) and recognition sites for viruses (10) and plant agglutinins (11). Despite the current interest in glycoproteins of the cell surface, however, little information has been reported regarding the structure, function, or configuration of any particular cell surface glycoprotein (12).
Gasic and Gasic (13) reported the presence, at the surface of the TA3 mammary adenocarcinoma ascites cell, of a heavy coat of sialic acid-containing material (13), which was later shown to be glycoprotein in character (14). Sanford (15) reported that neuraminidase treatment of this non-strain-specific subline TA3- Ha reduced its transplantability in the allogeneic C3H mouse (15). In vitro studies later demonstrated that C3H mouse serum possessed a factor toxic to neuraminidase-treated TA3-Ha cells, but non-toxic to cells which had not been incubated with the enzyme (16). Thus, at the TA3-Ha cell surface, glycopro- teins appear to be directly implicated in malignancy. In an investigation of the glycoproteins at the surface of this cell, Codington et al. (17) reported the isolation, after proteolysis of viable cells followed by gel filtration, of a glycoprotein fraction, glycoprotein Fraction I, in amounts as great as 0.5% of the cell dry weight. Fractionation of tritium-labeled material on a column of Bio-Gel A-5M suggested the presence of two com- ponents, a finding which was supported by sedimentation equilibrium studies (17). Chemical data suggested that these components possessed closely related structures.’
Although suggestions regarding the configuration and sizes of glycoproteins at the surfaces of mammalian cells have been made (18), the visualization by electron microscopy of individual surface macromolecules has not yet been reported (19). Further- more, to our knowledge, no work has yet been described regard- ing the configuration of any glycoprotein after isolation from the cell surface; information which might suggest its configuration on the living cells. Recent electron microscopic methods permit the gathering of meaningful statistical information regarding the absolute length and width of macromolecules in an extended configuration (20, 21)) including appropriate correction for small measurements such as width, due to the thickness of metal de- posited during shadow-casting contrast enhancement.z
This paper describes the configuration, as determined by elec- tron microscopy, of glycoprotein molecules of the TA3-Ha cell surface isolated after passage of glycoprotein Fraction I through
1 J. F. Codington, and R. W. Jeanloz, in preparation. 2 H. S. Slayter, in preparation.
3405
by guest on May 18, 2020
http://ww
w.jbc.org/
Dow
nloaded from
3406
a column of Sepharose 4B. It discusses the molecular weights of Plates were enlarged four times photographically using contact isolated fragments of the native molecules in relation to those intermediates to reverse contrast, so that the shadowing metal obtained by sedimentation equilibrium. would appear light. Solutions of glycoproteins, dialyzed ex-
haustively against appropriate ammonium acetate buffer, were METHODS sprayed through a high pressure spray gun at freshly cleaved
Isolation of Glycoprofein Fractions-TAS-Ha cells from strain mica at a concentration of about 0.1 mg per ml. Preparations A/Ha male mice were harvested and washed four to five times were shadow-cast with platinum by rotary shadow-casting as de- under sterile conditions, as previously described (17). Glyco- scribed previously (20, 21). protein material was removed from viable cells (2 to 4 x log In making measurements from the micrographs, a number of cells per batch) by five to six successive, 20-min incubations with entire fields were measured in order to reduce selectivity, and TPCK-trypsina (18 pg per ml) at 4”. Supernatant solutions sufficient total numbers were obtained in order to give smooth were lyophilized and stored in the cold. Material from 2 to distribution curves. From other similarly prepared samples of 5 x lOlo cells was pooled and fractionated on columns of Bio-Gels other molecules of known size and shape, we have determined2 P-4, P-30, and P-100, as described earlier (17). Material eluted that a correction of 2.5 nm must be applied to compensate for with the void volume of a Bio-Gel P-100 column was designated the thickness of t.he distortion in size of the original particles by “glycoprotein Fraction I.” The material utilized in this in. the replicating cap of metal. Thus, measurements of particle vestigation was derived from cells of later generations than the width performed in comparing the various fractions are corrected material previously described (17). by subtracting 2.5 nm of metal cap. This correction is empiri-
A sample of 8.04 mg of tritium-labeled (22) glycoprotein Frac- Cal, based on experience with other macromolecular species of tion I was eluted with 0.05 M pyridine acetate (pH 5.3) from a known width, but so long as it is applied uniformly to particles column (2.6 x 87 cm) of Sepharose 4B (Pharmacia, Uppsala, of about the same dimensions, it should not affect a comparative Sweden) at a rate of 2.5 ml per cm2 per hour. Fractions of 6.0 judgment of width. ml were collected, and appropriate aliquots (0.23 ml) were mixed Since molecular length, as determined by electron microscopy, with Aquasol (10 ml, New England Nuclear Corp., Boston, coupled with a sedimentation molecular weight value, has been Mass.) and counted for radioactivity in a Packard Tri-Carb used to determine a figure for molecular weight per unit length, scintillation counter. Fractions were pooled as follows: A, 144 which in turn has been used as a rough means of estimating to 192 ml; B, 193 to 258 ml; and C, 259 to 330 ml. Each sample approximate molecular weights of larger fragments, a discussion was lyophilized. of factors bearing on length measurement and the extrapolation
Analytical Determinations-Amino acid analyses were per- rationale is appropriate. In a typical measurement of a 2-cm- formed on a Technicon amino acid AutoAnalyzer or by gas-liquid long rod with a ruler, at a magnification of 100,000, the un- chromatography on a Perkin-Elmer gas chromatograph, model certainty in assigning end limits to the particle is estimated at 900, after hydrolysis of nitrogen-flushed samples in 5.7 M distilled 0.05 cm; the uncertainty in measurement is 0.02 cm. Although hydrochloric acid at 110” for 20 hours. Samples for gas-liquid uncertainty in magnification is about 50/,, all photos were re- chromatography were prepared by a modification of the method corded at virtually the same time, so that magnifications can be of Roach and Gehrke (23) and injected into a column of Tabsorb considered essentially identical. Thus, the uncert.ainty is 0.07 (Regis Chemical Co., Chicago, Ill.). cm or 7.0 nm, in the final measured length. For a 50.nm rod,
Carbohydrate components were determined by gas-liquid the maximum error is therefore 14%. For a 400.nm rod, the chromatography after methanolysis (1.0 M hydrogen chloride in maximum is 1.75%. A more important source of error is in the methanol at 80” for 20 hours) followed by conversion to the per assumption of uniform chemical composition of the rods. The trimethylsilylated methyl glycosides (17). Sialic acid was also data suggest similar amino acid compositions and approximately determined by the thiobarbituric acid procedure (24), following equal values for percentage of protein in the three fractions. acid hydrolysis. Width measurements do show close agreement among various
Molecular Weight by Sedimentation Equilibrium-A sample of fractions. Width measurements can be carried out with greater 150 pg of Fraction C in 200 ~1 of 6 M guanidine hydrochloride precision, because many widths on one particle can be measured (Heico, Inc.)-10 mM EDTA was dialyzed at 4” against the same and the average taken; assignment of limits may be based on a solution for 32 hours and analyzed on the model E analytical sight along the edge of the rod rather than on one grain at the end. ultraceutrifuge by the method of Yphantis (25)) at an equilibrium Although measurement is still subject to an uncertainty of 0.01 speed of 20,000 rpm and a temperature of 21.2”. The partial cm or 1.0 nm, subjectivity in this type of measurement is a more specific volume (V = 0.66) was calculated from published values important consideration. A substantial number of measure- for carbohydrate and amino acid components. An analysis of ments made by the same person on three fractions, when plotted Fraction A was run under similar conditions at a speed of 10,124 in a histogram and averaged, indicate the same figure within 1% rpm. for both the peak and number average for all three fractions.
Electron ililicroscopy-Electron microscopy was carried out on We feel that this means that there is no gross measurable differ- a Siemens 1A electron microscope at 80 kv with a 70+m objec- ence in width. While it is true that this type of data is by no tive aperture and a magnification of 27,000. Calibration was means rigorous as to primary composition, nothing in our chemi- based upon photographs of indanthrene olive crystals.4 Micro- cal or physical data leads us to suspect gross heterogeneity. graphs were recorded sufficiently close to focus to make metal Therefore, a tentative use of extrapolation for the purpose of grain at the 2.nm level clearly resolved on the original plates. estimating roughly the largest molecular weight to be expected
in this type of preparation seems justified to us as long as the 3 TPCK-trypsin in trypsin treated with L-1-tosylamido-2-
phenylethyl chloromethyl ketone in order to eliminate chymo- limitations are clear, which we think they are. In fact, the cor-
tryptic activity (14). rect,ness of this extrapolation is borne out by sedimentation
4 L. W. Labaw (1964) Proceedings of the 22nd Annual Meeting, equilibrium studies on Fraction -4, which check closely with the Electron Microscopy Society of America. value obtained by extrapolation (see “Discussion”).
by guest on May 18, 2020
http://ww
w.jbc.org/
Dow
nloaded from
I 1 I 1 I 1 I 1 I
F 2
400 -
300 -
200 -
100 -
120 150 100 210 240 270 300 330 360
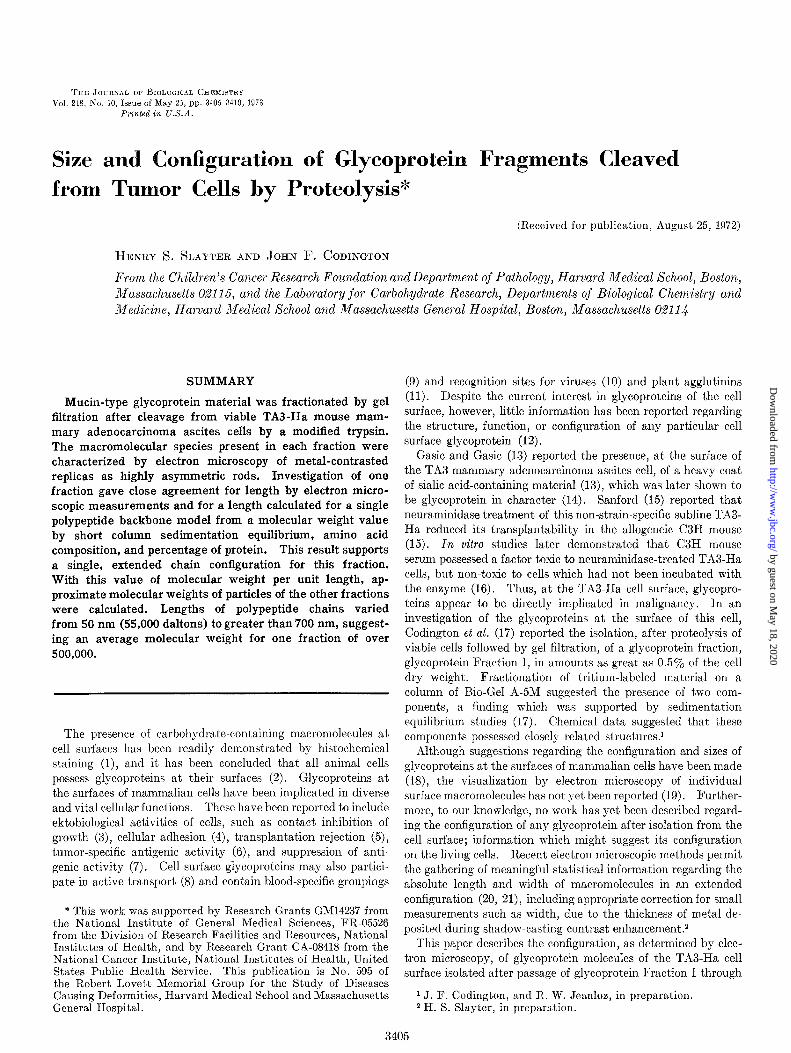
Ve /m/l FIG. 1. Fractionation at 4” of glycoprotein Fraction I from a
column of Sepharose 4B (2.6 X 87 cm). tiluent, pyridine acetate, 0.05 M, pH 5.3. Ve, efRuent volume.
Elution of 8.0 mg (dry wright) of glycoprotein Fraction I (17), from a column of Sepharosc 413 (Fig. I), gave a shoulder followed by a major peak. The effluent was cut into three fractions, A, 13, and C, as shown by the dotted lines. The three fractions exhibited no significant difference in amino acid composition. Fraction C (3.6 mg), present in larger quantity than Fraction A (1.1 rng), was chosen for cxtcnsive investigation.
A completely reliable figure for protein content based upon amino acid analysis was not l)ossible for Fraction C, since an accurate measure of the extent of degradation of the components by acid hydrolysis was not possible with the small amount of material available. More reliable values, based upon quantita- tion of carbohydrate components by gas-liquid chromatography and N-acetylneuraminic acid by the thiobarbituric acid pro- cedure, gave, by difference, an average value of 23 f 5% protein for Fraction C.
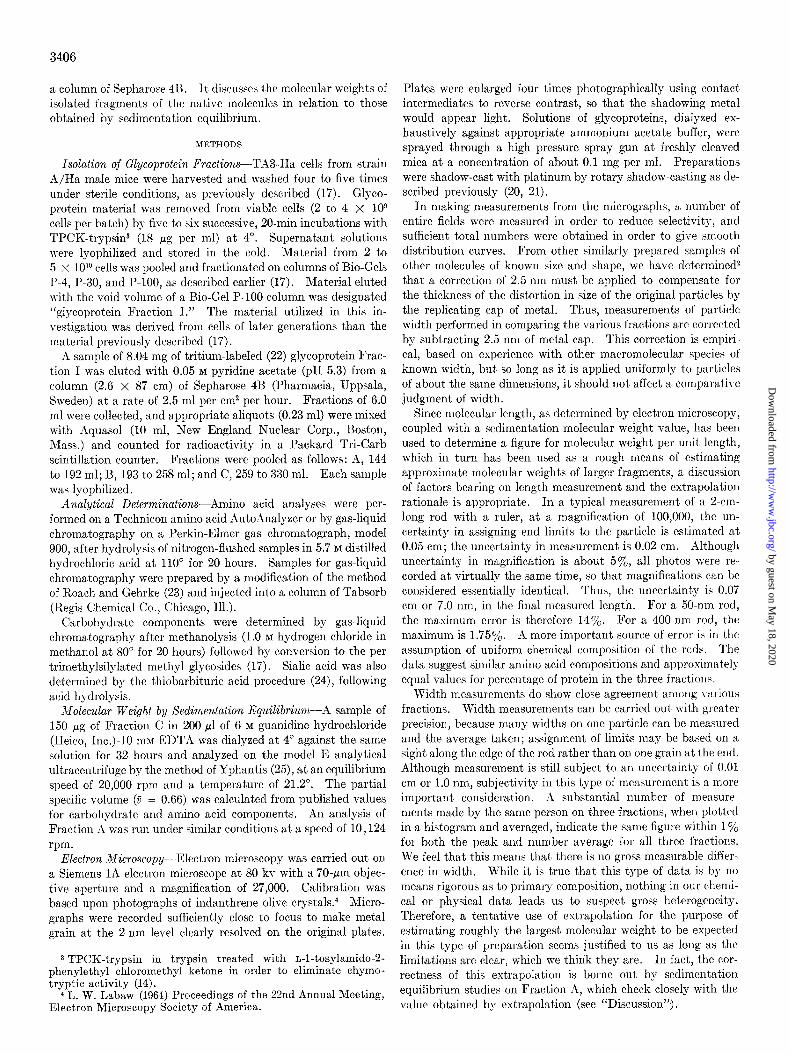
Sedimentation equilibrium analysis (25) of Fraction C in 6 M
guanidine hydrochloride-10 nlM EDTA suggested sample mono- dispersity based upon a straight lint plot of half the radius squared (+/2) versus the natural logarithm of the concentration (In C), as illustrated in Fig. 2. Extrapolation of apparent weight and number average molecular weights, nw and u~,~ to infinite dilution gave molecular wright values, respectively, of 99,700 and 101,500; and the value obtained from the slope of the curve (Fig. 2) was 107,000. A similar analysis of Fraction A indicated that the principal species has a molecular weight of 463,000. A second smaller, and minor, componerlt was found to have a molecular weight of 169,000, which rcprcscnts an average of the smaller species present (see “I Lscussion”).
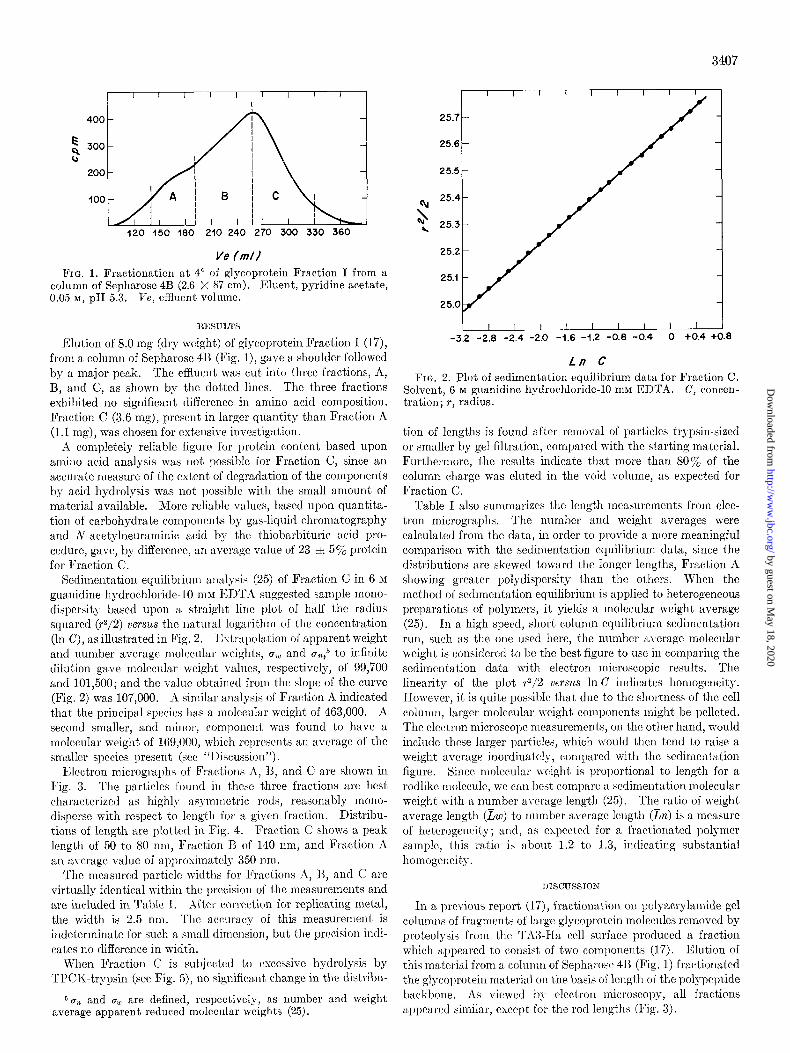
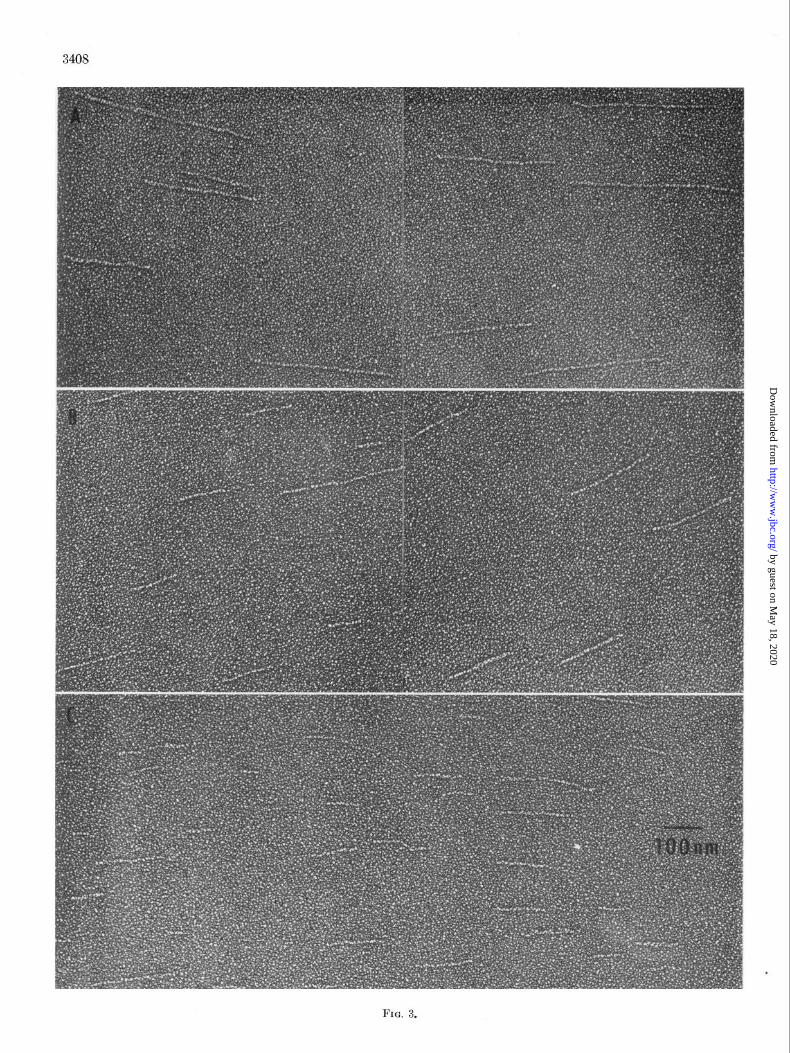
Electron micrographs of Fractions A, 13, and C are shown in Fig. 3. The particles found in thcsc three fractions arc best characterized as highl!- asynmletric rods, reasonably mono- disperse with respect to lcllgth for a given fraction. Distribu- tions of length are plott,ctl in Fig. 4. Fraction C shows a peak length of 50 to 80 nm, Fraction 12 of 140 rim, and Fraction A an average value of approxinlately 350 nm.
The measured particle widths for Fractions A, U, and C arc virtually identical within the precision of the mcasurcments and are included in Table I. Alter correction for replicating metal,
the width is 2.5 nm. The accuracy of this measurement is indeterminate for such a small dimension, but the precision indi- cates no difference in width.
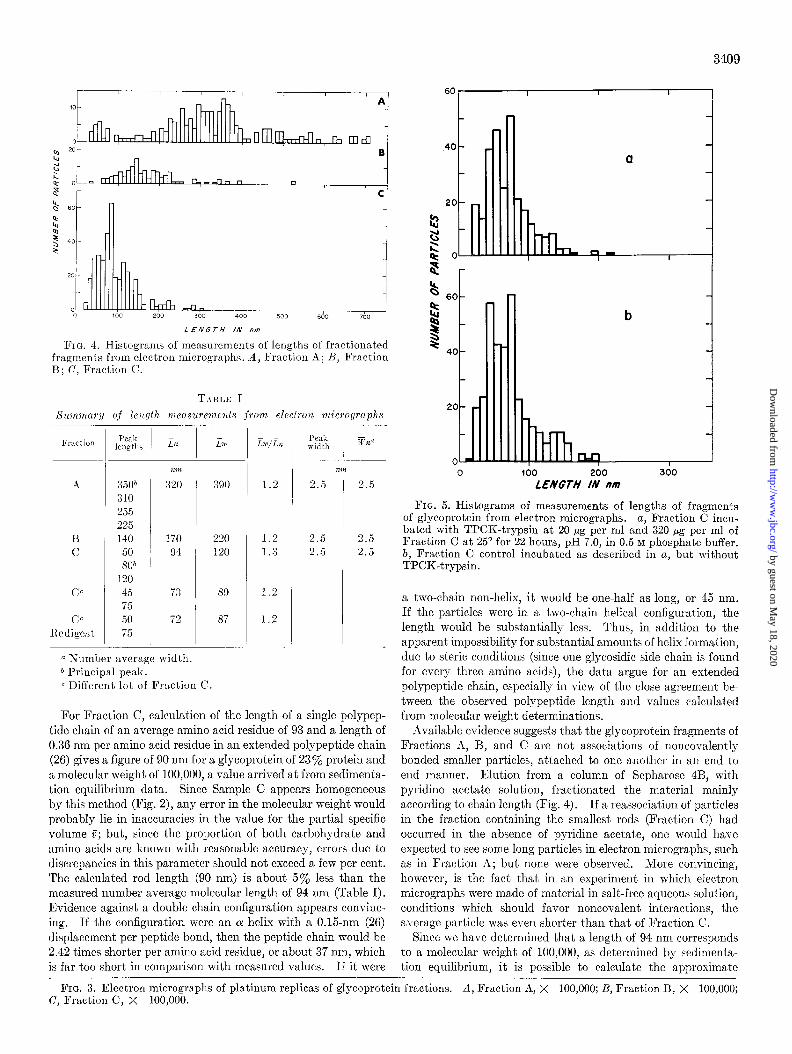
When Fraction C is subjected to excessive hydrolysis by TPCK-trypsin (see Fig. 5), no significant change in the distribu-
6~~ and cm are defined, respectively, as number and weight average apparent reduced molecular weights (25).
25.7
25.6
I I 1 I I I I I I I -3.2 -2.6 -2.4 -2.0 -1.6 -1.2 -0.0 -0.4 0 fO.4 +0.0
Ln c
FIG. 2. Plot of sedimentation equilibrium data for Fraction C. Solvent, 6 M guanidine hydrochloride-10 mM EDTA. C, concen- tration; T, radius.
tion of lengths is found after removal of particles trypsin-sized or smaller by gel filtration, compared with the starting material. Furthermore, the results indicate that more than 80% of the column charge was eluted in the void volume, as expected for Fraction C.
Table I also summarizes tbc length mcasurcments from elec- tron micrographs. The number and weight averages were calculated from the data, in order to provide a more meaningful comparison with the sedimentation equilibrium data, since t’he distributions are skewed toward the longer lengths, Fraction A showing greater polydispersity than the others. When the method of sedimentation equilibrium is applied to heterogeneous preparations of polymers, it yields a molecular weight average (25). In a high speed, short column equilibrium sedimentation run, such as the one used here, the number average molecular weight is considered to be the best figure to use in comparing the sedimentation data with electron microscopic results. The linearity of the plot +/2 versus In C indicates homogeneity. IIowever, it is quite possible that due to the shortness of the cell column, larger molecular weight components might be pelleted. The electron microscope measurements, on the other hand, would include these larger particles, which would then tend to raise a weight average inordinately, rompared with the sedimentation figure. Since molecular n-eight is proportional to length for a rodlikc molecule, we can bcvt compare a sedimentation molecular weight with a number average length (25). The ratio of weight average length (Lw) to number average length (&L) is a measure of hetcrogeneitg; and, as expcctcd for a fractionated polymer sample, this ratio is about 1.2 to 1.3, indicating substantial homogeneity.
l)ISCUSSION
In a previous report (17), fractionation on polyacrylamide gel columr~s of fragments of large glycoprotein molecules removed by proteolysis from the Th3-Ha cell surface produced a fraction which appeared to consist of two components (I 7). Elution of this material from a column of Sepharosc 413 (Fig. 1) fractionated the glycoprotein material on the basis of length of the polypeptide backbone. As viewed by electron microscopy, all fractions al)l)earcd similar, cxccljt for the rod lellgtlls (Fig. 3).
by guest on May 18, 2020
http://ww
w.jbc.org/
Dow
nloaded from
3409
FIG. 4. Histograms of measurements of lengths of fractionated fragments from electron micrographs. A, Fraction A; H, Fraction B; C, Fraction C.
TABLE I
Sutnw~ar?g oj leqdh measurewzenls from eleclron micrographs
I:raction
A
u c
Cp
CC Redigest
3506 310
255 225 140
50 8Oh
120
45 75 50
75
L7Z
.- n Number average width. b Principal peak.
c Different lot of Fraction C.
nm
320
170 04
i3
72
390
220 120
89
x7
LXl/Lr,
1.2
1.2
1.3
1.2
1.2
2.5 2.5
2.5 2.5 r
2.0 2.5
For Fraction C, calculation of the length of a single polypep- tide chain of an average amino acid residue of 93 and a length of 0.36 nm per amino acid residue in an extended polypeptide chain (26) gives a figure of 90 nm for a glycoprotein of 23% protein and a molecular weight of 100,000, a value arrived at from sedimenta- tion equilibrium data. Since Sample C appears homogeneous by this method (Fig. 2), any error in the molecular weight would probably lie in inaccuracies in the value for the partial specific volume B; but, since the proportion of both carbohydrate and amino acids are known with reasonable accuracy, errors due to discrepancies in this parameter should not exceed a few per cent. The calculated rod length (90 nm) is about 5% less than the measured number average molecular length of 94 nm (Table I). Evidence against a double chain configuration appears convinc- ing. If the configuration were an OL helix with a 0.15-nm (26) displacement per peptide bond, then the peptide chain would be 2.42 times shorter per amino acid residue, or about 37 nm, which is far too short in comparison with measured values. I f it were
a
b
lul I
100 200 300 LENGTH IN nm
FIG. 5. Histograms of measurements of lengths of fragments of glycoprotein from electron micrographs. a, Fraction C incu- bated with TPCK-trypsin at 20 pg per ml and 320 pg per ml of Fraction C at 25” for 22 hours, pH 7.0, in 0.5 M phosphate buffer. b, Fraction C control incubated as described in a, but without TPCK-trypsin.
a two-chain non-helix, it would he one-half as long, or 45 nm. If the particles were in a two-chain helical configuration, the length would be substantially less. Thus, in addition to the apparent impossibility for substantial amounts of helix formation, due to steric conditions (since one glycosidic side chain is found for every three amino acids), the data argue for an extended polypeptide chain, especially in view of the close agreement be- tween the observed polypeptide length and values calculated from molecular weight determinations.
Available evidence suggests that the glycoprotein fragments of Fractions A, B, and C are not associations of noncovalently bonded smaller particles, attached to one another in an end to end manner. Elution from a column of Sepharose 4B, with pyridine acetate solut’ion, fractionated the material mainly according to chain length (Fig. 4). I f a reassociation of particles in the fraction containing the smallest rods (Fraction C) had occurred in the absence of pyridine acetate, one would have expected to see some long particles in electron micrographs, such as in Fraction A; but none were observed. More convincing, however, is the fact that in an experiment in which electron micrographs were made of material in salt-free aqueous solution, conditions which should favor noncovalent interactions, the average particle was even shorter than that of Fraction C.
Since we have determined that a length of 94 nm corresponds to a molecular weight of 100,000, as determined by redimenta- tion equilibrium, it is possible to calculate the approximate
FIG. 3. Electron micrographs of platinum replicas of glycoprotein fractions. A, Fraction A, X 100,000; B, Fraction B, X 100,000; C, Fraction C, X 100,000.
by guest on May 18, 2020
http://ww
w.jbc.org/
Dow
nloaded from
3410
molecular weights of the other two glycoprotein fractions, A and B, from their measured lengths. The relative proportion of protein in the three fractions does not differ widely, and on the assumption that the gross composition of Fractions A and B is the same (23% protein) as that of Fraction C, the peak material of Fraction A, with an average length of 320 to 390 nm, would have a molecular weight between 300,000 and 500,000. Frac- tion B would have a molecular weight of 150,000 to 200,000. When Fraction A was subjected to sedimentation equilibrium measurement, a nonideal, two-component system was encoun- tered (27). The value for the principal high molecular weight component of this system obtained from a two species plot was 450,000. A second camponent of molecular weight 170,000 was found as well, which probably represents an average of the species present in the considerable spread seen in the electron micro- scope length distribution.
A comparison of the measured width of these particles, 2.5 nm, with that obtained previously for the rod of myosin (2.0 nm), which was shown to be double-stranded (20), suggests that carbohydrate chains are attached to amino acids along the length of the protein core. A width of only 2.5 nm suggests that the carbohydrate chains would be, on the average, not more than about 3-4 residues in length, if they were oriented perpendicular to the particle axis. These results are in agreement with chemi- cal data which indicate that carbohydrate chains, 2 to 5 residues in length, are, on the average, attached to every third amino acid along the length of the protein core (28).
Fraction C, subjected to excessive TPCK-trypsin degrada- tion, undergoes no further diminution in length below about 50 11111. Thus, it may be significant also that in a different prepara- tion purified on Bio-Gel l-‘-100, the glycoprotein Fraction I shows a principal peak at about 50 nm. It, therefore, appears that t,llere is a minimum length beyond which the bulk of this ma- terial, represented in Fraction C, cannot be degraded by TPCK- trypsin. Such a cleavage mode could conceivably be due to two factors, nameiy, the presence of linkages susceptible to cleavage by the enzyme (i.e. containing arginine), and the attachment of side chains containing sialic acid, which might block enzyme action (29). The trace amounts of arginine which could be de- tected in this material are consistent with breakage down to fragments of the size of Fraction C.
It seems probable that the intact molecule or molecules on the cell surface are of greater length than any of the fragments ob- tained by proteolysis. Measurements on the intact glycopro- t&n will no doubt soon allow formulation of a clearer picture of the way in which the fragments fit in. The work of Marchesi et al. (9), on the glycoprotein of the erythrocyte surface, indi- cated a more or less random breakage. However, the TA3 glycoprotein is much more highly saturated with glycosidic side chains, and so is not directly comparable. It is conceivable that a hydrophobic portion of the molecule(s) is not removed by TPCK-trypsin, but, as in the case of the major glycoprotein of the erythrocyte membrane (9), remains rooted in the TA3-Ha cell membrane.
The data presented here indicate that these isolated glyco- protein fragments are long rods, about 2.5 nm in diamet’er, with a single chaiu polypeptide backbone and a molecular weight range of approximately 55,000 to more than 500,000. It is probable that the molecular weight of the native molecules on the cell surface is in excess of 500,000. The biological function of these extended molecules at t’he cell periphery has not yet,
15.. SANFORD, B. H. (1967) Y'ransplantalion 6, 1273
16._SANFORD, B. H. & CODINGTON, J. F. (1071) Tissue Ar&gens 1, 1.53
17.
18.
CODINGTON, J. F., SANFORD, B. H. & JIXNLOZ,‘R.. W. (1972) Biochemistry 11, 2559
19.
WINZLER, 11. J. (1970) in Blood and Tissue Antigens, (AMINOFF, D., ed) p. 117, Academic Press, New York
PARSONS, D. F. & SUUJSCX, J. 11. (1972) Biochim. Biophys. Acta 265, 85
20. LOWEY, S., SLIIYTER, H. S., WEEDS, A. G. & BAICER, H. .J. (1969) J. Mol. Biol. 42, 1
21. SLAYTER, H. S. & Lowvsy, S. (1967) Proc. iTat. Acad. Sci. U. S. A. 68, 1611
22. 23. 24. 25. 26.
27.
28.
29.
30.
31. 32.
VAN LENTISN, L. & ASI-IWELL, G. (1971) J. Biol. Chem. 246, 1889 ROACH, D. & GEHRKE, C. (1969) J. Chromatogr. 44, 269 WARRI~N, L. (1959) J. Biol. Chem. 234, 1971 YPH~NTIS. D. A. (1964) Biochemistru 3. 297 PAULIXG, ‘L. (1951j Prdc. Nat. Acad.“Sci. lJ. S. A. 37, 205, 235,
729; (1952) Proc. Nat. Acad. Sci. U. S. A. 38, 86 RO.~RIC, 1~. E. & YPHANTIS, D. A. (1969) Ann. nr. Y. Acacl. Sci.
164, 245 CODINGTON, J. F., SANFORD, 13. H. & JUNLOZ, R. W. (1971)
Fed. Proc. 30, 1280 Abstr. GOTTSCHBLIC, A. & FAZEKAS DE ST. GROTH, S. (1960) Bio-
chim. Biophys. Acta 43, 513 CODINGTON, J. F., SANFORD, B. H. & JISINLOZ, 11. W. (1072)
Fed. Proc. 31, 465 Abstr. FRI~F;RG, S. (1972) J. Nat. Cancer Inst. 48, 1477 SANFORD,B. H., CODINGTON, J. F., J~ax~oz, l<. W. R: PALMI~R,
P. D. (1973) J. Immunol. in press
been determined. A plausible role, however, is suggested by the observation that, although the material was found in abundance on the surface of the non-strain specific subline, TA3-Ha, it was not detected under similar conditions on the cell surface of a subline of the same tumor, TA3-St, which had retained strain specificity (30). Since strain specificity in TA3 ascites tumor cells has been correlated with the degree of expression of histo- compatibility (H-2) antigens (31), it has been suggested (32) that this material may mask H-2 antigens on the TA3-Ha ccl1 surface. The presence of these rodlike molecules may thus contribute to the virulence of the TA3-Ha tumor.
Acknowledgments-We wish to acknowledge the assistance of Linda Warren in portions of this work and to express our ap- preciation to Donald S. O’Hara for sedimentation studios. We
thank Cyla Silber and Ann Heos for technical assistance.
REFERENCES
1. RAMBOURG, A. (1971) Int. Rev. Cytol. 31, 57 2. BENNETT, H. S. (1963) J. Hislochem. Cytochem. 11, 14 3. ABERCROMBIE, M. & AMBROSE, E. J. (1962) Cancer IZes. 22,
525 4. MBRTINEZ-PALOMO, A. (1970) Int. Rev. cytok 29, 29 5. SANDERSON, A. R., CRESS\VIGLL, P. & WELSH, K. I. (1971)
Nature New Biol. 230, 8 6. GOLD, P., GOLD, M. & FREEDMAN, S. 0. (1968) Cancer Res. 28,
1331 7. APFFEL, C. A. & PETERS, J. H. (1970) J. l’heor. Viol. 26, 47 8. HIGHLEY, D. R., Dawss, M. C. & ELLICNBOGEN, L. (1967)
J. Biol. Chem. 242, 1010 9. MARCHESI, V. T., TILL~CI~, T. W., JACI~SOX, It. L., SEGI~EST,
J. P. & SCOTT, R. E. (1972) Proc. Nat. Acad. Sci. U. S. A. 69, 1445
10. SPRINGER, G. F. (1970) n'aturwisse,zschaflen 57, 162 11. BERGISR, M. M. (1972) in Biomembranes, (MANSON, I,. A., ed)
Vol. 2, p. 247, Plenum Publishing Co., New York 12. KRA~MI~;R, P. M. (1971) in Biomembranes, (MANSON, I,. A.,
ed) Vol. 1, p. 67, Plenum Publishing Co., New York 13. Gasrc, G. 8-1 G.\sIc, T. (1962) Nalure 196, 170 14. CODINGTON, J. F., SANFORD, 1~. H. & JRANLOZ, R. W. (1970)
J. Xat. Cancer Inst. 46, 637
by guest on May 18, 2020
http://ww
w.jbc.org/
Dow
nloaded from
Henry S. Slayter and John F. CodingtonProteolysis
Size and Configuration of Glycoprotein Fragments Cleaved from Tumor Cells by
1973, 248:3405-3410.J. Biol. Chem.
http://www.jbc.org/content/248/10/3405Access the most updated version of this article at
Alerts:
When a correction for this article is posted•
When this article is cited•
to choose from all of JBC's e-mail alertsClick here
http://www.jbc.org/content/248/10/3405.full.html#ref-list-1
This article cites 0 references, 0 of which can be accessed free at
by guest on May 18, 2020
http://ww
w.jbc.org/
Dow
nloaded from


![Structure of protease-cleaved Escherichia coli [alpha]-2](https://img.pdfslide.net/doc/110x75/6254e603fdeb8a7b8416fee8/structure-of-protease-cleaved-escherichia-coli-alpha-2-.jpg)


