Embed Size (px)
Citation preview

Size Effect
Matthew BoyceHuibin Hu
Rajesh Raghunathan Lina Yang

Introduction• In this presentation we will review two
articles on how the size of market capitalization affects portfolio performance.
• The data sets given in both articles support the basic argument that smaller size results in a superior performance.

Size Effect
• A theory that holds that smaller firms, or those companies with a small market capitalization, outperform larger companies.
• The theory holds that smaller companies have a greater amount of growth opportunities than larger companies.
• An effect size is typically calculated by taking the difference in means between two groups and dividing that number by their combined (pooled) standard deviation.

Marc R. Reinganum
Abnormal Returns in Small Firm Portfolio

• E(R)=Rf+Beta*MRP• Beta o The most important term in the equationo A measure of the asset’s covariance with the
market as a wholeo COV (Ri,, Rm)/VAR(Rm), the risk of asset I relative
to the market portfolio • Implication: any two assets with the same beta
will have the same expected return. In particular, the model implies that firms will commend higher risk premiums only if they have higher betas.
Capital Asset Pricing Model (CAPM)
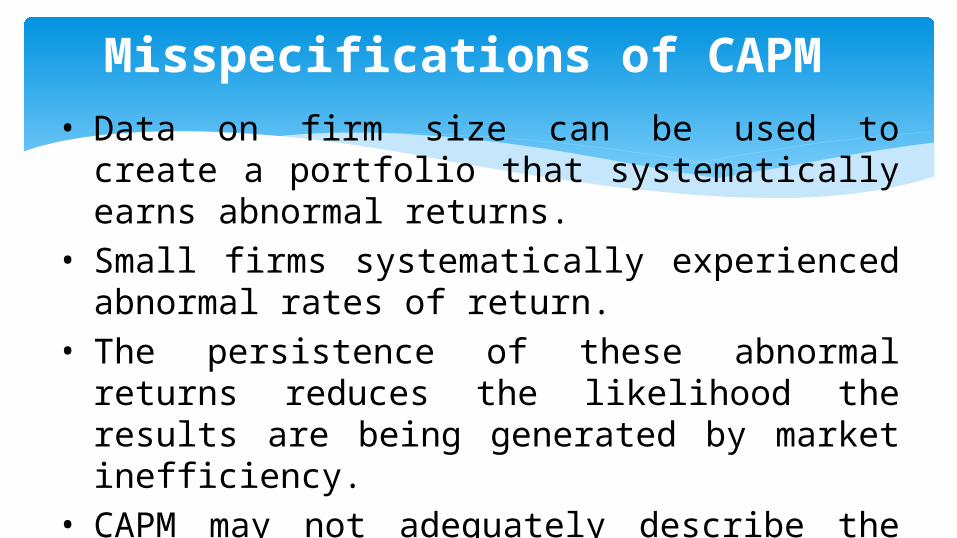
• Data on firm size can be used to create a portfolio that systematically earns abnormal returns.
• Small firms systematically experienced abnormal rates of return.
• The persistence of these abnormal returns reduces the likelihood the results are being generated by market inefficiency.
• CAPM may not adequately describe the behavior of the stock prices.
Misspecifications of CAPM
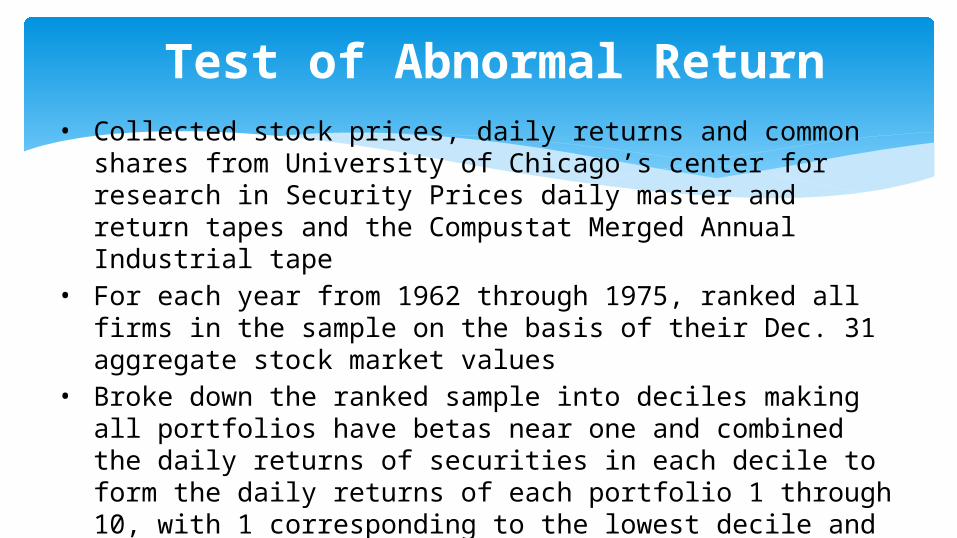
• Collected stock prices, daily returns and common shares from University of Chicago’s center for research in Security Prices daily master and return tapes and the Compustat Merged Annual Industrial tape
• For each year from 1962 through 1975, ranked all firms in the sample on the basis of their Dec. 31 aggregate stock market values
• Broke down the ranked sample into deciles making all portfolios have betas near one and combined the daily returns of securities in each decile to form the daily returns of each portfolio 1 through 10, with 1 corresponding to the lowest decile and 10 to the highest
• Equal weights were applied to all portfolio and equal weighted NYSE-AMEX market index serves as the control portfolio
Test of Abnormal Return


• Table 1 shows that the portfolio composed of small firms stand out. On average the smallest firms experience returns more than 20 percent per year higher than the returns for the largest firms. It is not only because of their positive abnormal returns, but also because each is heavily traded on the American Stock Exchange.
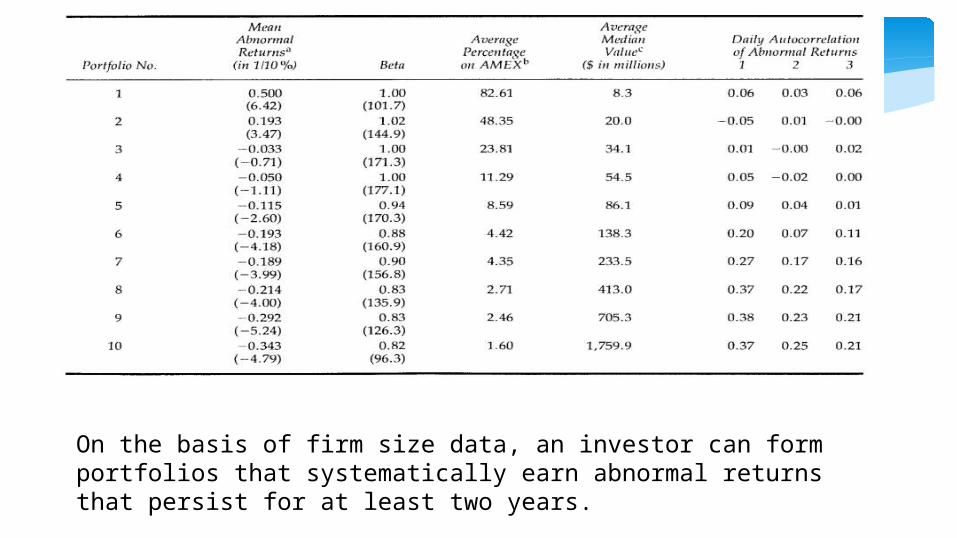
On the basis of firm size data, an investor can form portfolios that systematically earn abnormal returns that persist for at least two years.

Application
The fact that small firms have systematically experienced average rates of return significantly greater than those of larger firms with equivalent beta risk, and that these abnormal returns have persisted for at least two years from the portfolio formation dates, indicates that the simple one-period CAPM is an inadequate empirical representation of capital market equilibrium. Alternative models of capital market equilibrium should be seriously considered and tested.

Portfolio Strategies based on Market Capitalization*
No matter how you slice it, small caps win out
Marc R. Reinganum

This paper explores some simple portfolio strategies suggested by the empirical relationship between stock returns and market capitalization.
Overview of Method
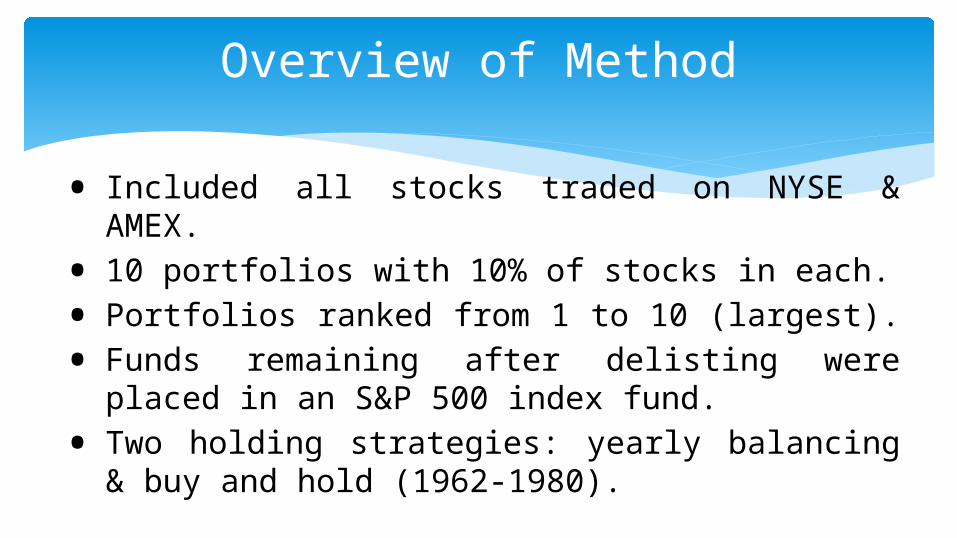
• Included all stocks traded on NYSE & AMEX.
• 10 portfolios with 10% of stocks in each.
• Portfolios ranked from 1 to 10 (largest).
• Funds remaining after delisting were placed in an S&P 500 index fund.
• Two holding strategies: yearly balancing & buy and hold (1962-1980).

Overview of Results: Yearly Balancing
• $1 invested in 1962 would equal $46 in smallest portfolio, $13 in intermediate, and $4 in large.
• MV1 averaged 32.77% annual return; mid-sized averaged about 18%; and, MV10 averaged 9.47%.
• Exception to rule found for the period of 1969 to 1973 (rule reversed).

Investment Characteristics of the Ten Market Value Portfolios

Portfolio Average Annual Return
Average Percent on AMEX
Average Median Value
Median Share Price
Estimated Portfolio Beta
1 32.77 92.19 4.6 5.24 1.58
2 23.51 77.33 10.8 9.52 1.57
3 22.98 52.09 19.3 12.89 1.50
4 20.24 34.05 30.7 16.19 1.46
5 19.08 21.33 47.2 19.22 1.43
6 18.30 12.73 74.2 22.59 1.36
7 15.64 8.37 119.1 26.44 1.28
8 14.24 4.73 209.7 30.83 1.22
9 13.00 3.39 434.6 34.43 1.11
10 9.47 2.25 1102.6 44.94 0.96

Measure of volatility of a portfolio in comparison to the market as a whole.
β = 1 security’s price will move with the market. β < 1 security will be less volatile than the market. β > 1 security will be more volatile than the market. E.g. If β = 1.2, theoretically that security is 20% more
volatile than the market.
Beta
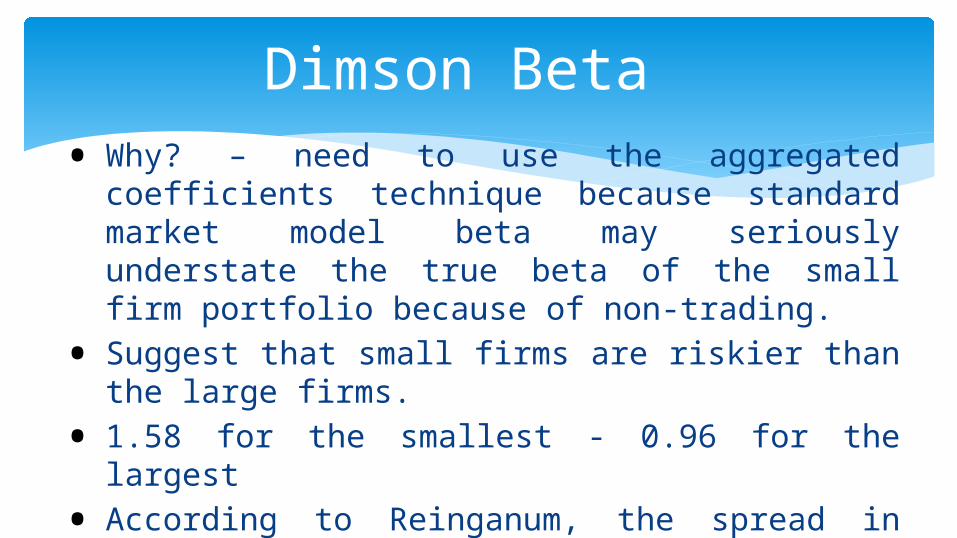
Dimson Beta• Why? – need to use the aggregated coefficients
technique because standard market model beta may seriously understate the true beta of the small firm portfolio because of non-trading.
• Suggest that small firms are riskier than the large firms.
• 1.58 for the smallest - 0.96 for the largest
• According to Reinganum, the spread in Dimson betas is not large enough to account for the observed difference in the average portfolio returns.

Important Observations
• Size effect vs. listing effect (AMEX).
• Dimson Beta unable to capture real beta of small firms.
• CAPM is an inadequate model for this study.
ΔE(R) = Δβ[E(RM) – Rf]
=23.3%/.62 = ΔE(R)/Δβ(Only if risk-free rate = 37.5%)

Take away lesson
Size effects exists even after beta adjustments.


MVP 1963
1964
1965
1966
1967
1968
1969
1970
1971
1972
1973
1974
1975
1976
1977
1978
1979
1980
1 17 40 120 110 511 1366
768 627 829 920 531 451 897 1465
1788
2421
3528
4528
2 15 42 104 93 315 599 384 336 433 447 231 156 322 541 696 921 1402
1850
3 22 51 128 104 289 472 353 307 392 414 236 177 390 650 839 1039
1515
2016
4 24 46 95 89 239 355 241 191 248 267 141 84 212 377 490 639 994 1395
5 17 38 83 71 200 303 212 197 249 278 147 94 213 375 463 548 867 1179
6 23 41 94 79 180 268 193 173 248 267 157 90 205 355 442 541 831 1168
7 15 35 74 63 141 200 146 134 179 197 115 59 146 260 308 369 563 782
8 17 39 74 63 122 166 124 117 167 201 126 61 162 271 295 336 479 650
9 19 40 74 65 112 152 124 125 164 187 118 64 155 246 250 280 402 570
10 20 37 54 42 68 89 71 73 99 139 108 53 107 157 141 155 219 312
Cumulative Returns with Annual Updating (Expressed in Percentages)

1 2 3 4 5 6 7 8 9 10
4528 1850 2016 1395 1179 1168 782 650 570 312
Cumulative Percent Return for Market Value Portfolios (1963-1980) with
Annual Updating

Portfolio 1963-1968 1969-1974 1975-1980
1 1166 -56 739
2 599 -63 661
3 472 -51 663
4 355 -59 712
5 303 -51 559
6 268 -48 567
7 200 -47 454
8 166 -39 365
9 152 -34 308
10 89 -19 169
Cumulative Returns: By Sub-Period with Annual Updating
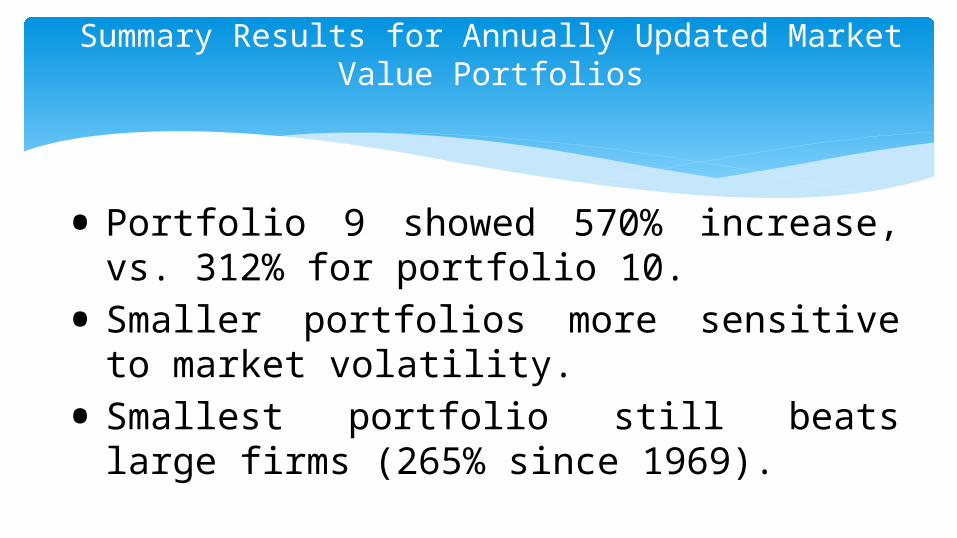
Summary Results for Annually Updated Market Value Portfolios
• Portfolio 9 showed 570% increase, vs. 312% for portfolio 10.
• Smaller portfolios more sensitive to market volatility.
• Smallest portfolio still beats large firms (265% since 1969).

Portfolio 1963 1964
1965
1966
1967
1968
1969
1970
1971
1972
1973
1974
1975
1976
1977
1978
1979
1980
1 17 48 120 115 346 628 433 355 426 478 300 196 339 499 528 603 807 1026
2 15 35 91 73 303 485 327 277 317 371 260 171 323 475 490 548 734 958
3 22 55 114 104 249 377 278 266 345 392 285 182 308 440 470 505 717 923
4 24 46 104 97 219 314 221 204 265 298 206 134 252 386 412 460 640 835
5 17 35 83 75 186 263 187 181 219 256 172 101 193 293 297 339 438 562
6 23 42 88 72 159 232 165 154 203 243 166 109 217 317 314 341 450 603
7 15 40 85 71 145 206 155 159 196 224 172 106 215 325 334 361 495 667
8 17 38 70 57 113 153 120 123 159 192 132 74 160 245 239 255 333 414
9 19 37 64 52 89 133 99 113 146 185 144 101 198 287 276 300 388 501
10 20 38 55 41 66 93 74 85 105 131 103 60 128 200 182 194 250 328
Cumulative Returns without Annual Updating (Expressed in Percentages)

Summary Results for Market Value Portfolios Without Annually Updating
• Portfolio 1 returns exceeded those of portfolio 10 by almost 700%.
• Active is better than passive. ($1 invested smallest in 1963 leads to $46 or $11 return.)
• Only the largest portfolio did not benefit from updating.

Portfolio Mean (%)Median
(%)Tenth
PercentileNinetieth Percentile
Skewness Kurtosis
1 31.77 10.94 -43.90 120.59 9.97 216.65
2 23.66 9.99 -42.95 98.64 4.25 44.92
3 23.52 11.85 -40.00 95.59 2.66 16.02
4 21.24 11.67 -38.45 89.40 1.92 8.43
5 19.77 11.53 -37.08 82.25 2.41 18.04
6 19.12 11.93 -35.48 76.48 3.21 35.50
7 16.45 9.99 -33.10 72.21 1.35 4.20
8 14.86 10.28 -29.23 62.53 1.43 7.06
9 13.42 8.94 -27.06 58.73 1.16 4.21
10 9.57 7.17 -25.44 44.46 0.88 2.82
Distribution of One-Year Holding Period Returns for Securities within Each Market Value Group

Overview of Kurtosis and Skewness

Critique of Article
• Lacking in data regarding the statistical significance of findings.
• Period is limited (18 years).
• Discussion of U.S. economic trends for the period is not discussed.
• Common size classifications used by investors are not included.

ConclusionInvest in small market cap portfolio over a longer period of time!