Embed Size (px)
Citation preview
Size homeostasis in adherent cells studied by syntheticphase microscopyYongjin Sunga,1, Amit Tzurb,c,1, Seungeun Ohb, Wonshik Choid, Victor Lib, Ramachandra R. Dasaria, Zahid Yaqooba,and Marc W. Kirschnerb,2
aG. R. Harrison Spectroscopy Laboratory, Massachusetts Institute of Technology, Cambridge, MA 02139; bDepartment of Systems Biology, Harvard MedicalSchool, Boston, MA 02115; cThe Mina and Everard Goodman Faculty of Life Sciences and the Institute for Nanotechnology and Advanced Materials,Bar-Ilan University, Ramat-Gan 52900, Israel; and dDepartment of Physics, Korea University, Seoul 136-701, Republic of Korea
Contributed by Marc W. Kirschner, August 29, 2013 (sent for review September 14, 2011)
The coupling of the rate of cell growth to the rate of cell divisiondetermines cell size, a defining characteristic that is central to cellfunction and, ultimately, to tissue architecture. The physiology ofsize homeostasis has fascinated generations of biologists, but themechanism, challenged by experimental limitations, remains largelyunknown. In this paper, we propose a unique optical method thatcan measure the dry mass of thick live cells as accurately as that forthin cells with high computational efficiency. With this technique,we quantify, with unprecedented accuracy, the asymmetry of di-vision in lymphoblasts and epithelial cells. We can then use theCollins–Richmond model of conservation to compute the relation-ship between growth rate and cell mass. In attached epithelialcells, we find that due to the asymmetry in cell division and size-dependent growth rate, there is active regulation of cell size. Thus,like nonadherent cells, size homeostasis requires feedback control.
cell division asymmetry | cell growth | cell dry mass | interferometry |synthetic phase microscopy
Size is an important phenotypic characteristic of any cell withconsequences for tissue and organ architecture. The process
by which cells regulate their size has fascinated generations ofbiologists, but the details have remained largely obscure, largelybecause accurate measurements at the single-cell level weredifficult to carry out (1). In proliferating cells, size is the result ofcell growth (which steadily increases the cell’s size) and cell di-vision (which roughly halves the cell size each generation). Cellsproliferating in constant conditions maintain a particular sizedistribution, suggesting that these two processes are coordinated(2). In yeast, there is evidence for intrinsic “size-sensing” mecha-nisms that coordinate their size-dependent (exponential) growthwith division in a way that limits size variation (e.g., refs. 3, 4). Inmetazoan cells, separate growth and mitogenic signals from theenvironment can independently regulate cell growth and division,and eventually cell size, in some circumstances, perhaps implyingthat cell-autonomous mechanisms linking cell growth with thedivision cycle may not exist in animal cells (5). This notion isfurther supported by the fact that early embryonic cell divisionsare decoupled from cell growth. The increase in cell number isbalanced by the decrease in cell size so that the embryo size re-mains constant. This classic debate has been revived recently, withstrong evidence both for linear (size-independent) growth kineticsin primary Schwann cells (5, 6) and for size-dependent growth inlymphoblast, osteoblast, and adenocarcinoma cells (7–10). In thecase of lymphoblasts, the division of volume among daughter cellshas also been observed to be uneven. This implies that these cellsat least actively coordinate cell growth with division to maintaina consistent size distribution in the population (10). The varyingevidence on growth coordination may result from the differentmethodologies used, but it also may suggest that different typesof animal cells have fundamental differences with regard to howthey grow and maintain their size. It has been challenging toresolve this issue due to the serious difficulty in determining theexact size of cells, particularly when they are asymmetrical or
irregularly shaped, which, in turn, makes it difficult to derive thegrowth kinetics of living cells and their size variation upon division.There is a confusion about what we should mean by “size” in
the context of growth. For most measurements, size refers togeometric size or cell volume. Light microscopy and impedance-based tools (Coulter principle) have long been used for volumemeasurements. Microscopy is, by nature, a single-cell measure-ment; however, calculating volume is not straightforward in ir-regularly shaped cells. Impedance measurement is relativelyinsensitive to shape but, typically, can only be used for cell pop-ulations in suspension (11). Several surrogates for size have beenused in the context of growth studies, including total (ribosomal)RNA and protein level or synthesis rate (e.g., refs. 12–14), themRNA level for constitutively expressed genes (e.g., ref. 15), andthe rate of uptake of nutrients/metabolites (e.g., ref. 16). It issimplest to consider growth as the creation of new biomass,mainly proteins, carbohydrates, and lipids. Cell mass is pro-portional to the volume if cell density remains constant, whichseems true for some cells [e.g., murine lymphoblasts (17)] but notfor others (18). Emerging technologies to weigh the mass (9) orthe buoyant mass (18) of cells over time have been developedand used for cell size and growth studies. Some of these havevery high precision (7) but are presently limited to unattachedcells, and therefore have been used primarily for cells of hema-topoietic origin. In contrast, optical methods are suitable formeasuring the dry mass (mass of nonaqueous content) of ad-herent cells with high accuracy and minimal perturbation. In thesimplest approach (8, 19), the retardation of light traversing thecell is related to the cumulative refractive index of the cellularconstituents along the optical axis. The validity of this “pro-jection” approach, however, is questionable for thick specimens,such as mitotic and other spherical cells. This is because the light
Significance
Accurate measurement of cell size is critical in studies of cellgrowth. Optical methods based on interferometry are knownto be suitable for attached cells, but the existing techniqueswere originally designed for thin samples and are not ideal forthick ones, such as mitotic cells. Synthetic phase microscopy(SPM), a new tomographic interferometric method, offers anelegant solution to this problem. This paper demonstrates theability of SPM to measure the growth of mammalian cells ac-curately, and it demonstrates a clear requirement for feedbackin the growth process.
Author contributions: Y.S., A.T., R.R.D., and M.W.K. designed research; Y.S., A.T., and S.O.performed research; Y.S., A.T., S.O., W.C., V.L., and M.W.K. analyzed data; and Y.S., A.T.,S.O., W.C., Z.Y., and M.W.K. wrote the paper.
The authors declare no conflict of interest.1Y.S. and A.T. contributed equally to this work.2To whom correspondence should be addressed. E-mail: [email protected].
This article contains supporting information online at www.pnas.org/lookup/suppl/doi:10.1073/pnas.1315290110/-/DCSupplemental.
www.pnas.org/cgi/doi/10.1073/pnas.1315290110 PNAS | October 8, 2013 | vol. 110 | no. 41 | 16687–16692
SYST
EMSBIOLO
GY
incident onto a cell is diffracted from the cell boundary and cell’sinternal organelles, and thus propagates within the sample likethe ripples in water rather than a straight ray. Thus, the scalardiffraction theory may be more appropriate for interpreting thescattered light field from biological samples (20).Here, we report a rigorous treatment of the light scattering by
heterogeneous 3D structures in a cell to measure the dry mass inliving cells accurately, regardless of their shape or optical depth.Our method measures the dry mass of thick samples as accuratelyas for thin samples; therefore, we can use it to study both sizevariation upon division and the growth kinetics of living cells.Specifically, we measure the dry mass of daughter cells immediatelyafter division in L1210 lymphoblastoid cells and two epithelial celltypes, HT-29 and RKO human colon cancer cells. We also measurethe mass distribution of these cells growing naturally in constantconditions. Then, using the Collins–Richmond conservation prin-ciple (21), we obtain the relationship between growth rate and cellmass. Our findings of the asymmetry of cell division and the massdependence of growth in epithelial cells demand an intrinsicmechanism for growth control like that proposed for bacteria (22),yeast (3, 4) erythroblasts (23), and lymphoblasts (7, 10).
ResultsSynthetic Phase Microscopy for Dry Mass Measurement. The lightfield scattered from a sample carries the information about thesample in the form of amplitude modulation, wavefront distor-tion, or both. The wavefront modulation or phase delay, whichcan simply be related to the sample’s refractive index in the visibleregime, can be measured by Shack–Hartmann sensors (24, 25),interferometry (26–29), or propagation-based methods (30, 31).The linear relationship between the refractive index and theconcentration of organic molecules is established well (32–35).Notably, for most of a cell’s chemical components, the specificrefraction increment α relating the refractive index and massconcentration remains constant regardless of the chemical iden-tity of the biomaterial (35). For instance, the mean proportion-ality coefficient for the entire set of human proteins is 0.190 mL/g,with an SD of only 0.003 mL/g (35).The scalar diffraction theory predicts that the scattered field for
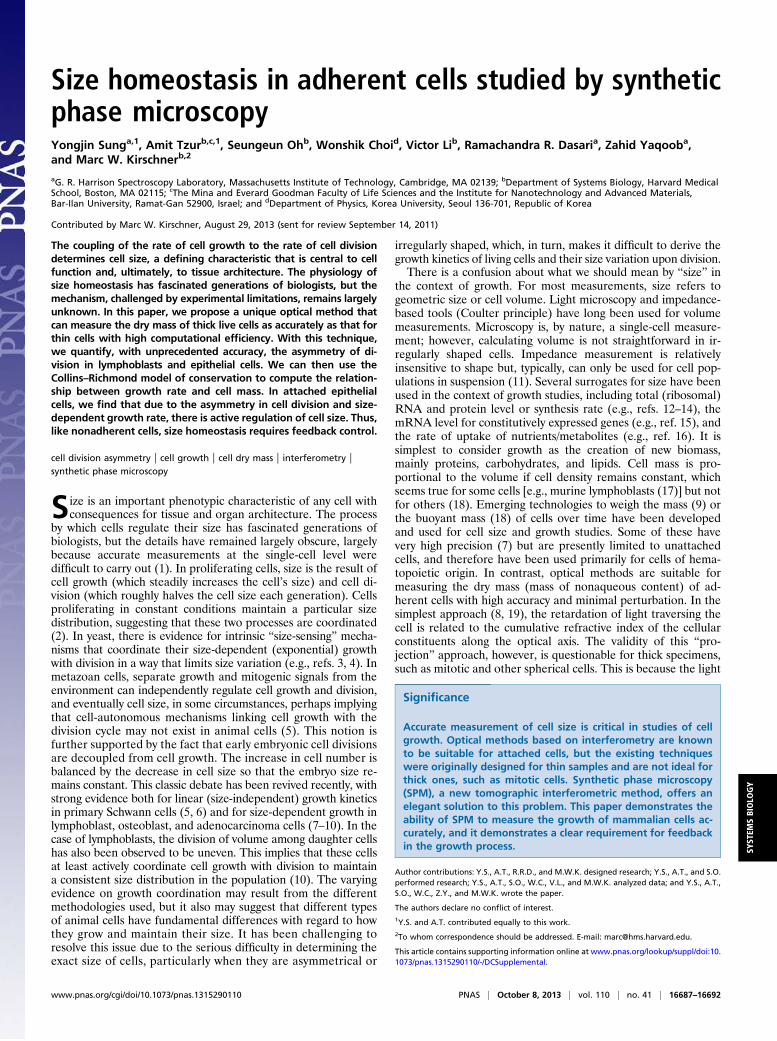
a specific angle of illumination onto an object provides a portionof the object spectrum in 3D spatial frequency space (36). Im-portantly, the information needed to calculate the dry mass ofa specimen is mostly contained in the W = 0 plane (SI Materialsand Methods), where W is the spatial frequency coordinate cor-responding to the optical axis Z (Fig. 1A). Under the Rytov ap-proximation (37), which is valid for most biological samples, thefollowing relationship holds in the Fourier plane between theareal dry mass density σðX ;Y Þ and the sample-induced phasedelay Φ~k0
ðX ;Y Þ recorded for a specific illumination angle (SIMaterials and Methods):
~σðU;V Þ=8<:
λ2w2πn0α
~Φ~k0ðU;V Þ; ðU;V Þ∈C;
0; otherwise;[1]
where ~σðU;V Þ and ~Φ~k0ðU;V Þ are the 2D Fourier transforms of
σðX ;Y Þ and Φ~k0ðX ;Y Þ, respectively. The subscript ~k0 indicates
the direction of the incident beam:~k0 = ðu0; v0;w0Þ. The set C isa collection of points (U,V) satisfying the following relationship:ðU+u0Þ2 + ðV+v0Þ2 = ðn0=λÞ2 −w2
0. The refractive index of thebackground medium is n0, and λ is the wavelength of the incidentlight. By varying the angle of illumination (Fig. 1B), differentportions of ~σ can be obtained using Eq. 1 (Fig. 1C). Conse-quently, the areal density σðX ;Y Þ of dry mass can be obtainedby taking the inverse Fourier transform of ~σðU;V Þ:
σðX ;Y Þ=ZZ
Ω
~σðU;V Þei2πðUX+VY ÞdUdV ; [2]
where Ω is the spatial frequency support determined by the N.A.of a synthetic phase microscopy (SPM) system. We note that theareal density image obtained with SPM (Fig. 1D) is free from thediffraction artifact that will be described more extensively below.In addition, the areal density in Eq. 2 is equivalent to the nu-merical projection of the 3D refractive index map obtained withoptical diffraction tomography (ODT) (38). Therefore, SPM pro-vides transverse resolution similar to that obtained with ODT,which is double the resolution available from single-shot phaseimaging. We note that the computational efficiency is much higherin SPM, because it maps the measured scattered fields onto a 2Dplane rather than a 3D spatial frequency space as in ODT. Fig. 1Dcompares areal density images of an RKO human colon cancercell obtained with SPM and single-shot phase imaging. It is clearthat the noise level in SPM is significantly lower than in single-shotphase imaging. For example, the dry mass value within the dottedregion in the SPM image amounts to only 2.5 fg, which is compa-rable to the measurement noise of 6 fg in a suspended microchan-nel resonator (7). The high measurement sensitivity of SPM isattributed to significantly reduced coherent speckles, as in partiallycoherent imaging (39). To test the measurement accuracy of SPM,we quantified the refractive index of polystyrene beads and com-pared it with the value measured using a refractometer for bulkmaterial (40). Note that we obtained the 2D phase images withSPM and calculated the refractive index of the beads using thespherical shape of the beads. The mean refractive index for the 20-μm polystyrene beads (n = 44) was measured to be 1.5857 with anSD of 2 × 10⁻⁴. This value matches very well with the refractiveindex of bulk polystyrene, which is 1.5872 at 633 nm.Fig. 2A shows how the diffraction from small organelles can
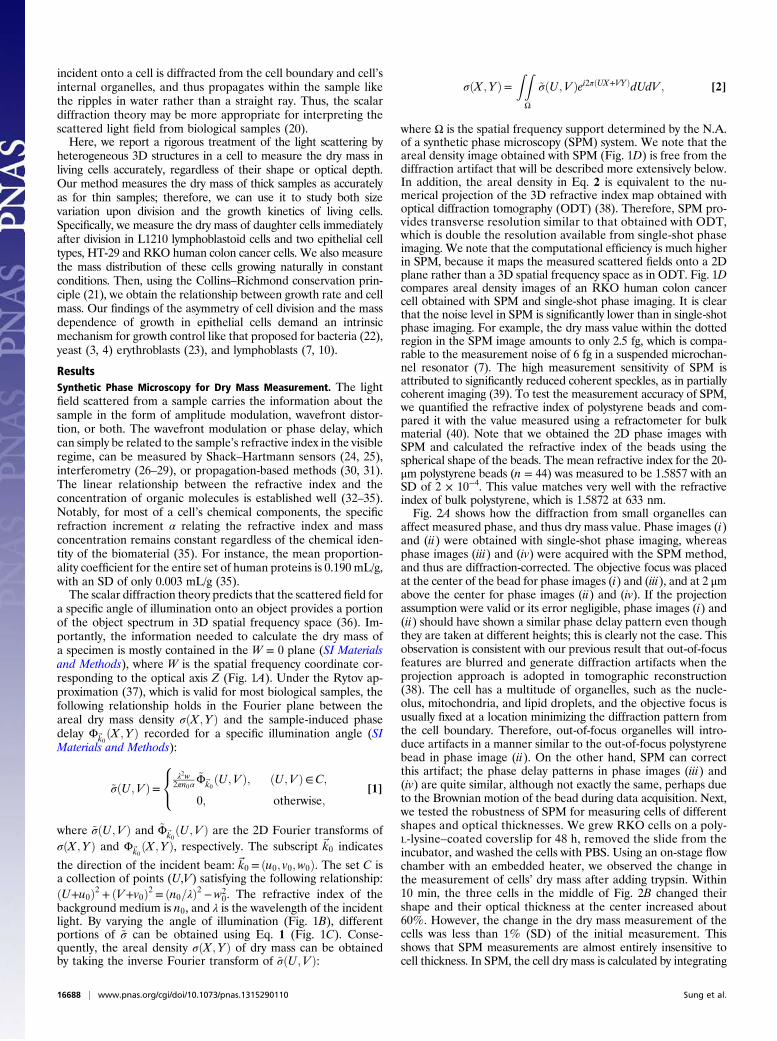
affect measured phase, and thus dry mass value. Phase images (i)and (ii) were obtained with single-shot phase imaging, whereasphase images (iii) and (iv) were acquired with the SPM method,and thus are diffraction-corrected. The objective focus was placedat the center of the bead for phase images (i) and (iii), and at 2 μmabove the center for phase images (ii) and (iv). If the projectionassumption were valid or its error negligible, phase images (i) and(ii) should have shown a similar phase delay pattern even thoughthey are taken at different heights; this is clearly not the case. Thisobservation is consistent with our previous result that out-of-focusfeatures are blurred and generate diffraction artifacts when theprojection approach is adopted in tomographic reconstruction(38). The cell has a multitude of organelles, such as the nucle-olus, mitochondria, and lipid droplets, and the objective focus isusually fixed at a location minimizing the diffraction pattern fromthe cell boundary. Therefore, out-of-focus organelles will intro-duce artifacts in a manner similar to the out-of-focus polystyrenebead in phase image (ii). On the other hand, SPM can correctthis artifact; the phase delay patterns in phase images (iii) and(iv) are quite similar, although not exactly the same, perhaps dueto the Brownian motion of the bead during data acquisition. Next,we tested the robustness of SPM for measuring cells of differentshapes and optical thicknesses. We grew RKO cells on a poly-L-lysine–coated coverslip for 48 h, removed the slide from theincubator, and washed the cells with PBS. Using an on-stage flowchamber with an embedded heater, we observed the change inthe measurement of cells’ dry mass after adding trypsin. Within10 min, the three cells in the middle of Fig. 2B changed theirshape and their optical thickness at the center increased about60%. However, the change in the dry mass measurement of thecells was less than 1% (SD) of the initial measurement. Thisshows that SPM measurements are almost entirely insensitive tocell thickness. In SPM, the cell dry mass is calculated by integrating
16688 | www.pnas.org/cgi/doi/10.1073/pnas.1315290110 Sung et al.
the measured areal density over the cell area. To determine thecell area, we use thresholding, which identifies the cells in theculture medium, together with manual selection, to separate onecell from another. Using two threshold levels (0.1 and 0.2 pg/μm2)and repeating the selection of cell boundary three times, we es-timated the uncertainty of SPM mass measurement due toboundary selection at less than 1 pg in cells of an average massof 348 pg, that is 0.3% (n = 18).
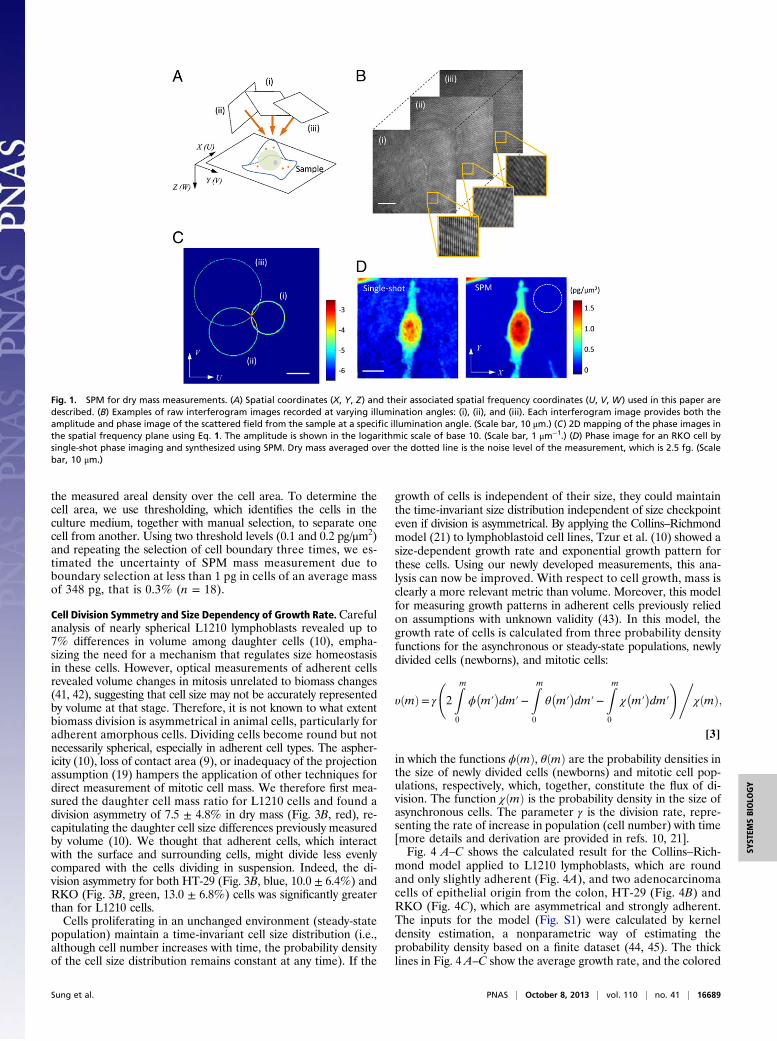
Cell Division Symmetry and Size Dependency of Growth Rate.Carefulanalysis of nearly spherical L1210 lymphoblasts revealed up to7% differences in volume among daughter cells (10), empha-sizing the need for a mechanism that regulates size homeostasisin these cells. However, optical measurements of adherent cellsrevealed volume changes in mitosis unrelated to biomass changes(41, 42), suggesting that cell size may not be accurately representedby volume at that stage. Therefore, it is not known to what extentbiomass division is asymmetrical in animal cells, particularly foradherent amorphous cells. Dividing cells become round but notnecessarily spherical, especially in adherent cell types. The aspher-icity (10), loss of contact area (9), or inadequacy of the projectionassumption (19) hampers the application of other techniques fordirect measurement of mitotic cell mass. We therefore first mea-sured the daughter cell mass ratio for L1210 cells and found adivision asymmetry of 7.5 ± 4.8% in dry mass (Fig. 3B, red), re-capitulating the daughter cell size differences previously measuredby volume (10). We thought that adherent cells, which interactwith the surface and surrounding cells, might divide less evenlycompared with the cells dividing in suspension. Indeed, the di-vision asymmetry for both HT-29 (Fig. 3B, blue, 10.0 ± 6.4%) andRKO (Fig. 3B, green, 13.0 ± 6.8%) cells was significantly greaterthan for L1210 cells.Cells proliferating in an unchanged environment (steady-state
population) maintain a time-invariant cell size distribution (i.e.,although cell number increases with time, the probability densityof the cell size distribution remains constant at any time). If the
growth of cells is independent of their size, they could maintainthe time-invariant size distribution independent of size checkpointeven if division is asymmetrical. By applying the Collins–Richmondmodel (21) to lymphoblastoid cell lines, Tzur et al. (10) showed asize-dependent growth rate and exponential growth pattern forthese cells. Using our newly developed measurements, this ana-lysis can now be improved. With respect to cell growth, mass isclearly a more relevant metric than volume. Moreover, this modelfor measuring growth patterns in adherent cells previously reliedon assumptions with unknown validity (43). In this model, thegrowth rate of cells is calculated from three probability densityfunctions for the asynchronous or steady-state populations, newlydivided cells (newborns), and mitotic cells:
υðmÞ= γ
2Zm0
ϕ�m′�dm′−
Zm0
θ�m′�dm′−
Zm0
χ�m′�dm′
!,χðmÞ;
[3]
in which the functions ϕðmÞ, θðmÞ are the probability densities inthe size of newly divided cells (newborns) and mitotic cell pop-ulations, respectively, which, together, constitute the flux of di-vision. The function χðmÞ is the probability density in the size ofasynchronous cells. The parameter γ is the division rate, repre-senting the rate of increase in population (cell number) with time[more details and derivation are provided in refs. 10, 21].Fig. 4 A–C shows the calculated result for the Collins–Rich-
mond model applied to L1210 lymphoblasts, which are roundand only slightly adherent (Fig. 4A), and two adenocarcinomacells of epithelial origin from the colon, HT-29 (Fig. 4B) andRKO (Fig. 4C), which are asymmetrical and strongly adherent.The inputs for the model (Fig. S1) were calculated by kerneldensity estimation, a nonparametric way of estimating theprobability density based on a finite dataset (44, 45). The thicklines in Fig. 4 A–C show the average growth rate, and the colored
Fig. 1. SPM for dry mass measurements. (A) Spatial coordinates (X, Y, Z) and their associated spatial frequency coordinates (U, V, W) used in this paper aredescribed. (B) Examples of raw interferogram images recorded at varying illumination angles: (i), (ii), and (iii). Each interferogram image provides both theamplitude and phase image of the scattered field from the sample at a specific illumination angle. (Scale bar, 10 μm.) (C) 2D mapping of the phase images inthe spatial frequency plane using Eq. 1. The amplitude is shown in the logarithmic scale of base 10. (Scale bar, 1 μm−1.) (D) Phase image for an RKO cell bysingle-shot phase imaging and synthesized using SPM. Dry mass averaged over the dotted line is the noise level of the measurement, which is 2.5 fg. (Scalebar, 10 μm.)
Sung et al. PNAS | October 8, 2013 | vol. 110 | no. 41 | 16689
SYST
EMSBIOLO
GY
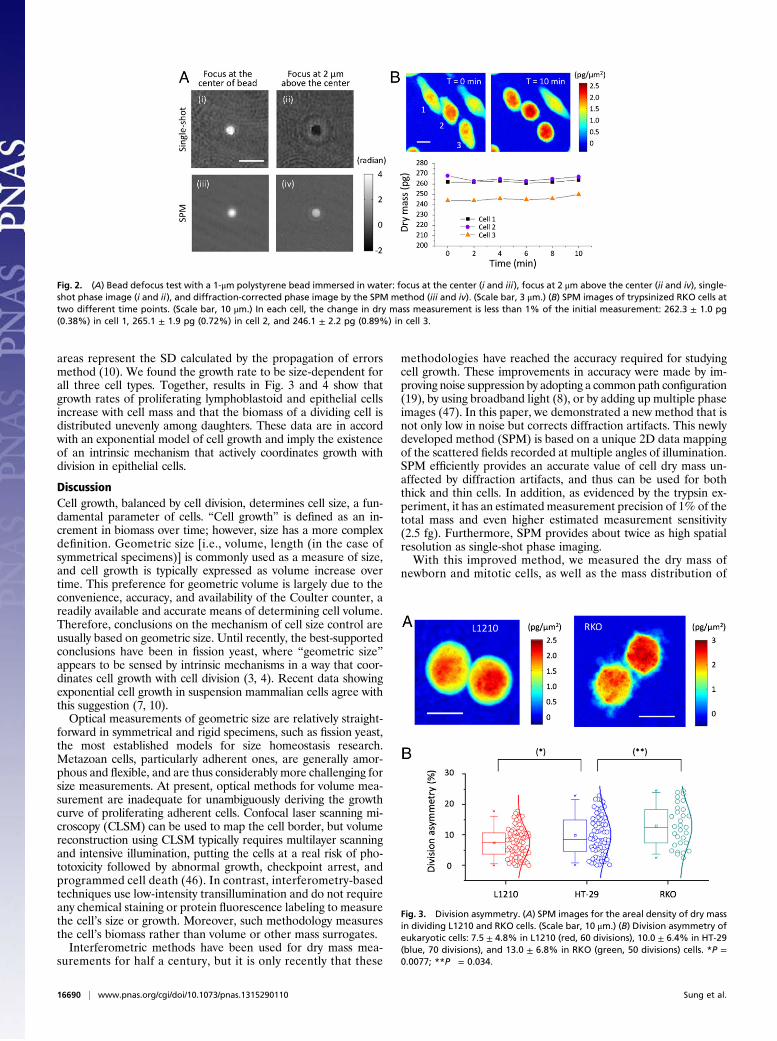
areas represent the SD calculated by the propagation of errorsmethod (10). We found the growth rate to be size-dependent forall three cell types. Together, results in Fig. 3 and 4 show thatgrowth rates of proliferating lymphoblastoid and epithelial cellsincrease with cell mass and that the biomass of a dividing cell isdistributed unevenly among daughters. These data are in accordwith an exponential model of cell growth and imply the existenceof an intrinsic mechanism that actively coordinates growth withdivision in epithelial cells.
DiscussionCell growth, balanced by cell division, determines cell size, a fun-damental parameter of cells. “Cell growth” is defined as an in-crement in biomass over time; however, size has a more complexdefinition. Geometric size [i.e., volume, length (in the case ofsymmetrical specimens)] is commonly used as a measure of size,and cell growth is typically expressed as volume increase overtime. This preference for geometric volume is largely due to theconvenience, accuracy, and availability of the Coulter counter, areadily available and accurate means of determining cell volume.Therefore, conclusions on the mechanism of cell size control areusually based on geometric size. Until recently, the best-supportedconclusions have been in fission yeast, where “geometric size”appears to be sensed by intrinsic mechanisms in a way that coor-dinates cell growth with cell division (3, 4). Recent data showingexponential cell growth in suspension mammalian cells agree withthis suggestion (7, 10).Optical measurements of geometric size are relatively straight-
forward in symmetrical and rigid specimens, such as fission yeast,the most established models for size homeostasis research.Metazoan cells, particularly adherent ones, are generally amor-phous and flexible, and are thus considerably more challenging forsize measurements. At present, optical methods for volume mea-surement are inadequate for unambiguously deriving the growthcurve of proliferating adherent cells. Confocal laser scanning mi-croscopy (CLSM) can be used to map the cell border, but volumereconstruction using CLSM typically requires multilayer scanningand intensive illumination, putting the cells at a real risk of pho-totoxicity followed by abnormal growth, checkpoint arrest, andprogrammed cell death (46). In contrast, interferometry-basedtechniques use low-intensity transillumination and do not requireany chemical staining or protein fluorescence labeling to measurethe cell’s size or growth. Moreover, such methodology measuresthe cell’s biomass rather than volume or other mass surrogates.Interferometric methods have been used for dry mass mea-
surements for half a century, but it is only recently that these
methodologies have reached the accuracy required for studyingcell growth. These improvements in accuracy were made by im-proving noise suppression by adopting a common path configuration(19), by using broadband light (8), or by adding up multiple phaseimages (47). In this paper, we demonstrated a new method that isnot only low in noise but corrects diffraction artifacts. This newlydeveloped method (SPM) is based on a unique 2D data mappingof the scattered fields recorded at multiple angles of illumination.SPM efficiently provides an accurate value of cell dry mass un-affected by diffraction artifacts, and thus can be used for boththick and thin cells. In addition, as evidenced by the trypsin ex-periment, it has an estimated measurement precision of 1% of thetotal mass and even higher estimated measurement sensitivity(2.5 fg). Furthermore, SPM provides about twice as high spatialresolution as single-shot phase imaging.With this improved method, we measured the dry mass of
newborn and mitotic cells, as well as the mass distribution of
Fig. 2. (A) Bead defocus test with a 1-μm polystyrene bead immersed in water: focus at the center (i and iii), focus at 2 μm above the center (ii and iv), single-shot phase image (i and ii), and diffraction-corrected phase image by the SPM method (iii and iv). (Scale bar, 3 μm.) (B) SPM images of trypsinized RKO cells attwo different time points. (Scale bar, 10 μm.) In each cell, the change in dry mass measurement is less than 1% of the initial measurement: 262.3 ± 1.0 pg(0.38%) in cell 1, 265.1 ± 1.9 pg (0.72%) in cell 2, and 246.1 ± 2.2 pg (0.89%) in cell 3.
Fig. 3. Division asymmetry. (A) SPM images for the areal density of dry massin dividing L1210 and RKO cells. (Scale bar, 10 μm.) (B) Division asymmetry ofeukaryotic cells: 7.5 ± 4.8% in L1210 (red, 60 divisions), 10.0 ± 6.4% in HT-29(blue, 70 divisions), and 13.0 ± 6.8% in RKO (green, 50 divisions) cells. *P =0.0077; **P = 0.034.
16690 | www.pnas.org/cgi/doi/10.1073/pnas.1315290110 Sung et al.
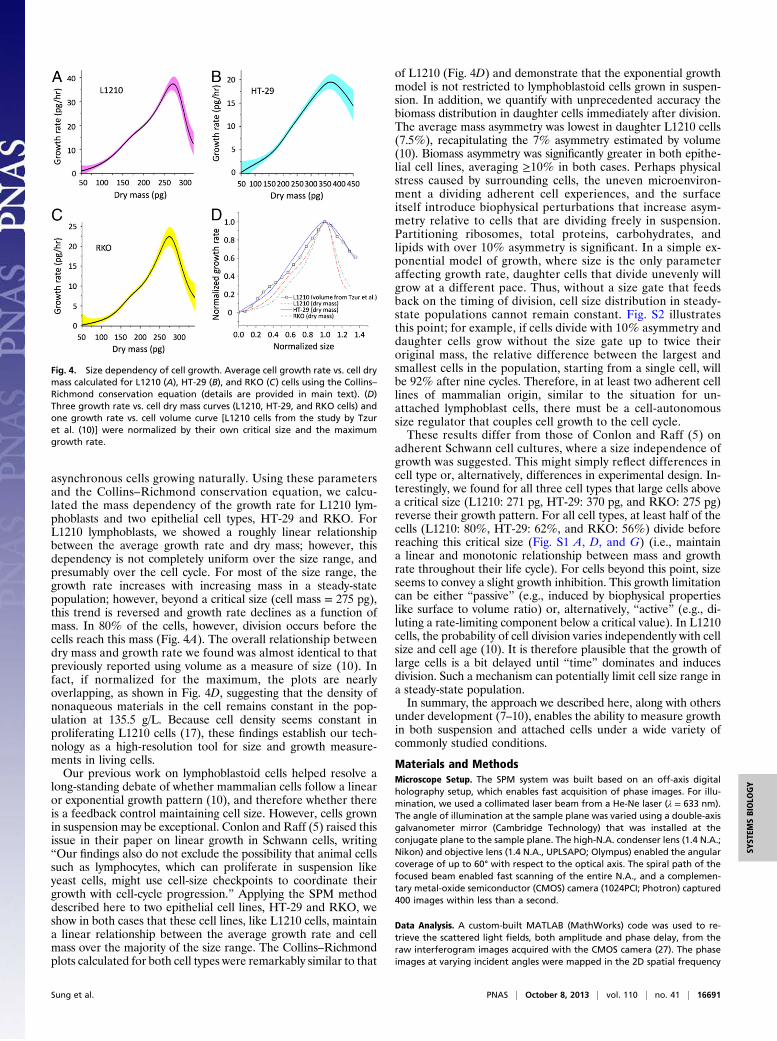
asynchronous cells growing naturally. Using these parametersand the Collins–Richmond conservation equation, we calcu-lated the mass dependency of the growth rate for L1210 lym-phoblasts and two epithelial cell types, HT-29 and RKO. ForL1210 lymphoblasts, we showed a roughly linear relationshipbetween the average growth rate and dry mass; however, thisdependency is not completely uniform over the size range, andpresumably over the cell cycle. For most of the size range, thegrowth rate increases with increasing mass in a steady-statepopulation; however, beyond a critical size (cell mass = 275 pg),this trend is reversed and growth rate declines as a function ofmass. In 80% of the cells, however, division occurs before thecells reach this mass (Fig. 4A). The overall relationship betweendry mass and growth rate we found was almost identical to thatpreviously reported using volume as a measure of size (10). Infact, if normalized for the maximum, the plots are nearlyoverlapping, as shown in Fig. 4D, suggesting that the density ofnonaqueous materials in the cell remains constant in the pop-ulation at 135.5 g/L. Because cell density seems constant inproliferating L1210 cells (17), these findings establish our tech-nology as a high-resolution tool for size and growth measure-ments in living cells.Our previous work on lymphoblastoid cells helped resolve a
long-standing debate of whether mammalian cells follow a linearor exponential growth pattern (10), and therefore whether thereis a feedback control maintaining cell size. However, cells grownin suspension may be exceptional. Conlon and Raff (5) raised thisissue in their paper on linear growth in Schwann cells, writing“Our findings also do not exclude the possibility that animal cellssuch as lymphocytes, which can proliferate in suspension likeyeast cells, might use cell-size checkpoints to coordinate theirgrowth with cell-cycle progression.” Applying the SPM methoddescribed here to two epithelial cell lines, HT-29 and RKO, weshow in both cases that these cell lines, like L1210 cells, maintaina linear relationship between the average growth rate and cellmass over the majority of the size range. The Collins–Richmondplots calculated for both cell types were remarkably similar to that
of L1210 (Fig. 4D) and demonstrate that the exponential growthmodel is not restricted to lymphoblastoid cells grown in suspen-sion. In addition, we quantify with unprecedented accuracy thebiomass distribution in daughter cells immediately after division.The average mass asymmetry was lowest in daughter L1210 cells(7.5%), recapitulating the 7% asymmetry estimated by volume(10). Biomass asymmetry was significantly greater in both epithe-lial cell lines, averaging ≥10% in both cases. Perhaps physicalstress caused by surrounding cells, the uneven microenviron-ment a dividing adherent cell experiences, and the surfaceitself introduce biophysical perturbations that increase asym-metry relative to cells that are dividing freely in suspension.Partitioning ribosomes, total proteins, carbohydrates, andlipids with over 10% asymmetry is significant. In a simple ex-ponential model of growth, where size is the only parameteraffecting growth rate, daughter cells that divide unevenly willgrow at a different pace. Thus, without a size gate that feedsback on the timing of division, cell size distribution in steady-state populations cannot remain constant. Fig. S2 illustratesthis point; for example, if cells divide with 10% asymmetry anddaughter cells grow without the size gate up to twice theiroriginal mass, the relative difference between the largest andsmallest cells in the population, starting from a single cell, willbe 92% after nine cycles. Therefore, in at least two adherent celllines of mammalian origin, similar to the situation for un-attached lymphoblast cells, there must be a cell-autonomoussize regulator that couples cell growth to the cell cycle.These results differ from those of Conlon and Raff (5) on
adherent Schwann cell cultures, where a size independence ofgrowth was suggested. This might simply reflect differences incell type or, alternatively, differences in experimental design. In-terestingly, we found for all three cell types that large cells abovea critical size (L1210: 271 pg, HT-29: 370 pg, and RKO: 275 pg)reverse their growth pattern. For all cell types, at least half of thecells (L1210: 80%, HT-29: 62%, and RKO: 56%) divide beforereaching this critical size (Fig. S1 A, D, and G) (i.e., maintaina linear and monotonic relationship between mass and growthrate throughout their life cycle). For cells beyond this point, sizeseems to convey a slight growth inhibition. This growth limitationcan be either “passive” (e.g., induced by biophysical propertieslike surface to volume ratio) or, alternatively, “active” (e.g., di-luting a rate-limiting component below a critical value). In L1210cells, the probability of cell division varies independently with cellsize and cell age (10). It is therefore plausible that the growth oflarge cells is a bit delayed until “time” dominates and inducesdivision. Such a mechanism can potentially limit cell size range ina steady-state population.In summary, the approach we described here, along with others
under development (7–10), enables the ability to measure growthin both suspension and attached cells under a wide variety ofcommonly studied conditions.
Materials and MethodsMicroscope Setup. The SPM system was built based on an off-axis digitalholography setup, which enables fast acquisition of phase images. For illu-mination, we used a collimated laser beam from a He-Ne laser (λ = 633 nm).The angle of illumination at the sample plane was varied using a double-axisgalvanometer mirror (Cambridge Technology) that was installed at theconjugate plane to the sample plane. The high-N.A. condenser lens (1.4 N.A.;Nikon) and objective lens (1.4 N.A., UPLSAPO; Olympus) enabled the angularcoverage of up to 60° with respect to the optical axis. The spiral path of thefocused beam enabled fast scanning of the entire N.A., and a complemen-tary metal-oxide semiconductor (CMOS) camera (1024PCI; Photron) captured400 images within less than a second.
Data Analysis. A custom-built MATLAB (MathWorks) code was used to re-trieve the scattered light fields, both amplitude and phase delay, from theraw interferogram images acquired with the CMOS camera (27). The phaseimages at varying incident angles were mapped in the 2D spatial frequency
Fig. 4. Size dependency of cell growth. Average cell growth rate vs. cell drymass calculated for L1210 (A), HT-29 (B), and RKO (C) cells using the Collins–Richmond conservation equation (details are provided in main text). (D)Three growth rate vs. cell dry mass curves (L1210, HT-29, and RKO cells) andone growth rate vs. cell volume curve [L1210 cells from the study by Tzuret al. (10)] were normalized by their own critical size and the maximumgrowth rate.
Sung et al. PNAS | October 8, 2013 | vol. 110 | no. 41 | 16691
SYST
EMSBIOLO
GY
plane using Eq. 1. The inverse Fourier transform of the 2D mapping (Eq. 2)provides the areal density of a sample, the integral of which provides cell drymass. The cell boundary was detected with thresholding and manual selection.The probability density and cumulative density functions of dry mass for eachgroup were obtained using a custom-built code for kernel density estimation.
Cell Culture and Sample Preparation. L1210 mouse lymphoblasts were grownin Leibovitz’s L-15 CO2 independent media (21083-027; Invitrogen) supple-mented with 10% FBS (10438026; Invitrogen), 1 g/L D-(+)-glucose solution(G8270; Sigma–Aldrich), and 1% (vol/vol) 100× penicillin/streptomycin solution(15140-122; Invitrogen). Before each measurement set, L1210 cells from anexponentially growing population were cultured on a 40-mm coverslipprecoated with poly-L-lysine (P8920; Sigma–Aldrich). HT-29 and RKO coloncancer cells were cultured in DMEM (21063-029; Invitrogen) supplementedwith 10% FBS and 1% 100× penicillin/streptomycin solution. At 70–80%confluency, cells were passaged and seeded on a coverslip and then in-cubated for 24 h. Polystyrene beads (1 μm) were purchased from Polysciences,Inc. (64030-15).
On-Stage Cell Culture System. Cells were observed while grown in a temper-ature-controlled flow chamber (RC-31; Warner Instruments). The oxygenconcentration and pH within the chamber were maintained by the contin-uous flow of conditioned media preequilibrated with air containing 5% CO2.
The flow rate of the media was determined to guarantee that the rate ofoxygen supply was twice as large as the rate of oxygen consumption by thecells inside the chamber. The flow speed inside the chamber was in-dependently controlled by changing the thickness of a spacer, which definesthe volume of the chamber. The flow speed was small enough not to disturbcell growth or division (shear stress at wall <1 mPa). A heater embedded inthe chamber maintained the temperature of the entire system at 37 °C. Lineheaters (MTC-HLS-1; Bioscience Tools) were wrapped around the condenserand objective lenses to minimize heat loss through the immersion oil that isin direct contact with the lenses.
ACKNOWLEDGMENTS. We thank Dr. Ana Hernandez for the RKO cells andDrs. Dan Fu and Ran Kafri for helpful discussions. This work was fundedby Grant P41-RR02594-18 of the National Center for Research Resourcesof the National Institutes of Health (to Y.S., R.R.D., and Z.Y.), Grant DBI-0754339 of the National Science Foundation (to Y.S., R.R.D., and Z.Y.), theHamamatsu Corporation (Y.S., R.R.D., Z.Y.), Marie Curie International Re-integration Grant PIRG-GA-2010-277062 (to A.T.), and the Israeli Centersof Research Excellence program [center no. 41/11 (A.T.)]. Y.S. was sup-ported by a fellowship from the Kwanjeong Educational Foundation. Theresearch conducted by Y.S. has been included in his PhD dissertationsubmitted to the Massachusetts Institute of Technology. Further supportwas provided by National Institute of General Medical Sciences GrantGM26875 (to M.W.K.).
1. Jorgensen P, Tyers M (2004) How cells coordinate growth and division. Curr Biol14(23):R1014–R1027.
2. Edgar BA, Kim KJ (2009) Cell biology. Sizing up the cell. Science 325(5937):158–159.3. Martin SG, Berthelot-Grosjean M (2009) Polar gradients of the DYRK-family kinase
Pom1 couple cell length with the cell cycle. Nature 459(7248):852–856.4. Moseley JB, Mayeux A, Paoletti A, Nurse P (2009) A spatial gradient coordinates cell
size and mitotic entry in fission yeast. Nature 459(7248):857–860.5. Conlon I, Raff M (2003) Differences in the way a mammalian cell and yeast cells co-
ordinate cell growth and cell-cycle progression. J Biol 2(1):7.6. Echave P, Conlon IJ, Lloyd AC (2007) Cell size regulation in mammalian cells. Cell Cycle
6(2):218–224.7. Godin M, et al. (2010) Using buoyant mass to measure the growth of single cells. Nat
Methods 7(5):387–390.8. Mir M, et al. (2011) Optical measurement of cycle-dependent cell growth. Proc Natl
Acad Sci USA 108(32):13124–13129.9. Park K, et al. (2010) Measurement of adherent cell mass and growth. Proc Natl Acad
Sci USA 107(48):20691–20696.10. Tzur A, Kafri R, LeBleu VS, Lahav G, Kirschner MW (2009) Cell growth and size ho-
meostasis in proliferating animal cells. Science 325(5937):167–171.11. Deblois RW, Bean CP (1970) Counting and sizing of submicron particles by resistive
pulse technique. Rev Sci Instrum 41(7):909–916.12. Elliott SG, McLaughlin CS (1978) Rate of macromolecular synthesis through the cell
cycle of the yeast Saccharomyces cerevisiae. Proc Natl Acad Sci USA 75(9):4384–4388.13. Killander D, Zetterberg A (1965) Quantitative cytochemical studies on interphase
growth. I. Determination of DNA, RNA and mass content of age determined mousefibroblasts in vitro and of intercellular variation in generation time. Exp Cell Res 38:272–284.
14. Zetterberg A, Killander D (1965) Quantitative cytochemical studies on interphasegrowth. II. Derivation of synthesis curves from the distribution of DNA, RNA and massvalues of individual mouse fibroblasts in vitro. Exp Cell Res 39(1):22–32.
15. Di Talia S, Skotheim JM, Bean JM, Siggia ED, Cross FR (2007) The effects of molecularnoise and size control on variability in the budding yeast cell cycle. Nature 448(7156):947–951.
16. Kubitschek HE (1968) Constancy of uptake during the cell cycle in Escherichia coli.Biophys J 8(12):1401–1412.
17. Loken MR, Kubitschek HE (1984) Constancy of cell buoyant density for cultured mu-rine cells. J Cell Physiol 118(1):22–26.
18. Bryan AK, Goranov A, Amon A, Manalis SR (2010) Measurement of mass, density, andvolume during the cell cycle of yeast. Proc Natl Acad Sci USA 107(3):999–1004.
19. Popescu G, et al. (2008) Optical imaging of cell mass and growth dynamics. AmJ Physiol Cell Physiol 295(2):C538–C544.
20. Kak AC, Slaney M (1988) Principles of Computerized Tomographic Imaging (IEEEPress, New York).
21. Collins JF, Richmond MH (1962) Rate of growth of Bacillus cereus between divisions.J Gen Microbiol 28:15–33.
22. Donachie WD, Blakely GW (2003) Coupling the initiation of chromosome replicationto cell size in Escherichia coli. Curr Opin Microbiol 6(2):146–150.
23. Dolznig H, Grebien F, Sauer T, Beug H, Müllner EW (2004) Evidence for a size-sensingmechanism in animal cells. Nat Cell Biol 6(9):899–905.
24. Liang J, Grimm B, Goelz S, Bille JF (1994) Objective measurement of wave aberrationsof the human eye with the use of a Hartmann-Shack wave-front sensor. J Opt Soc AmA Opt Image Sci Vis 11(7):1949–1957.
25. Bon P, Maucort G, Wattellier B, Monneret S (2009) Quadriwave lateral shearing in-terferometry for quantitative phase microscopy of living cells. Opt Express 17(15):13080–13094.
26. Creath K (1988) Phase-measurement interferometry techniques. Prog Optics 26(26):349–393.
27. Ikeda T, Popescu G, Dasari RR, Feld MS (2005) Hilbert phase microscopy for in-vestigating fast dynamics in transparent systems. Opt Lett 30(10):1165–1167.
28. Iwai H, et al. (2004) Quantitative phase imaging using actively stabilized phase-shifting low-coherence interferometry. Opt Lett 29(20):2399–2401.
29. Wang Z, et al. (2011) Spatial light interference microscopy (SLIM). Opt Express 19(2):1016–1026.
30. Reed Teague M (1983) Deterministic phase retrieval: A Green’s function solution.J Opt Soc Am A 73(11):1434–1441.
31. Streibl N (1984) Phase imaging by the transport equation of intensity. Opt Commun49(1):6–10.
32. Barer R (1952) Interference microscopy and mass determination. Nature 169(4296):366–367.
33. Barer R (1957) Refractometry and interferometry of living cells. J Opt Soc Am 47(6):545–556.
34. Barer R, Tkaczyk S (1954) Refractive index of concentrated protein solutions. Nature173(4409):821–822.
35. Zhao H, Brown PH, Schuck P (2011) On the distribution of protein refractive indexincrements. Biophys J 100(9):2309–2317.
36. Wolf E (1969) Three-dimensional structure determination of semi-transparent objectsfrom holographic data. Opt Commun 1(4):153–156.
37. Devaney AJ (1981) Inverse-scattering theory within the Rytov approximation.Opt Lett6(8):374–376.
38. Sung Y, et al. (2009) Optical diffraction tomography for high resolution live cell im-aging. Opt Express 17(1):266–277.
39. Paganin D, Nugent K (1998) Noninterferometric phase imaging with partially co-herent light. Phys Rev Lett 80(12):2586–2589.
40. Kasarova SN, Sultanova NG, Ivanov CD, Nikolov ID (2007) Analysis of the dispersion ofoptical plastic materials. Opt Mater (Amst) 29:1481–1490.
41. Boucrot E, Kirchhausen T (2008) Mammalian cells change volume during mitosis. PLoSONE 3(1):e1477.
42. Habela CW, Sontheimer H (2007) Cytoplasmic volume condensation is an integral partof mitosis. Cell Cycle 6(13):1613–1620.
43. Anderson EC, Bell GI, Petersen DF, Tobey RA (1969) Cell growth and division. IV. De-termination of volume growth rate and division probability. Biophys J 9(2):246–263.
44. Parzen E (1962) On estimation of a probability density function and mode. Ann MathStat 33(3):1065–1076.
45. Rosenblatt M (1956) Remarks on some nonparametric estimates of a density function.Ann Math Stat 27(3):832–837.
46. Hoebe RA, et al. (2007) Controlled light-exposure microscopy reduces photobleachingand phototoxicity in fluorescence live-cell imaging. Nat Biotechnol 25(2):249–253.
47. Kim M, et al. (2011) High-speed synthetic aperture microscopy for live cell imaging.Opt Lett 36(2):148–150.
16692 | www.pnas.org/cgi/doi/10.1073/pnas.1315290110 Sung et al.