Embed Size (px)
Citation preview
APPENDIX B B-1
Sizing Criteria Worksheets and Examples This Appendix provides sizing criteria worksheets and examples to illustrate the correct procedures for determining the water quality design flow and volume for sizing stormwater treatment measures, and for sizing based on a combination of flow and volume. Additional resources provided to assist with sizing treatment measures include: local rainfall data; stormwater treatment measure volume-based sizing curves; runoff coefficients; and a map showing mean annual precipitation and soil types for Santa Clara Valley.
TABLE OF CONTENTS B.1 SCVURPPP Sizing Criteria Worksheets:
Section I. Selecting Sizing Approach Based on Type of Treatment Measure
Section II. Sizing for Volume-Based Treatment Measures
Section III. Sizing for Flow-Based Treatment Measures
Section IV. Sizing for Flow- and Volume-Based Treatment Measures (Combination Flow and Volume Approach)
TABLES IN WORKSHEETS
Table B-1: Examples of Volume-Based and Flow-Based Controls
Table B-2a, b, c: Precipitation Data for Three Reference Gages
Table B-3: Estimated Runoff Coefficients for Various Surfaces During Small Storms
Appendix
BB
SANTA CLARA VALLEY URBAN RUNOFF POLLUTION PRVENTION PROGRAM
B-2 APPENDIX B
B.2 Treatment Measure Sizing Examples:
Example 1: Single Family Home Subdivision
Volume-based sizing for an infiltration trench
Example 2: High Density Residential Development
Flow-based sizing method for a media filter Volume-based sizing method and combination flow and volume method for a flow-
through planter
Example 3: Parking Lot
Simplified sizing method (4 percent method) for a bioretention facility
FIGURES
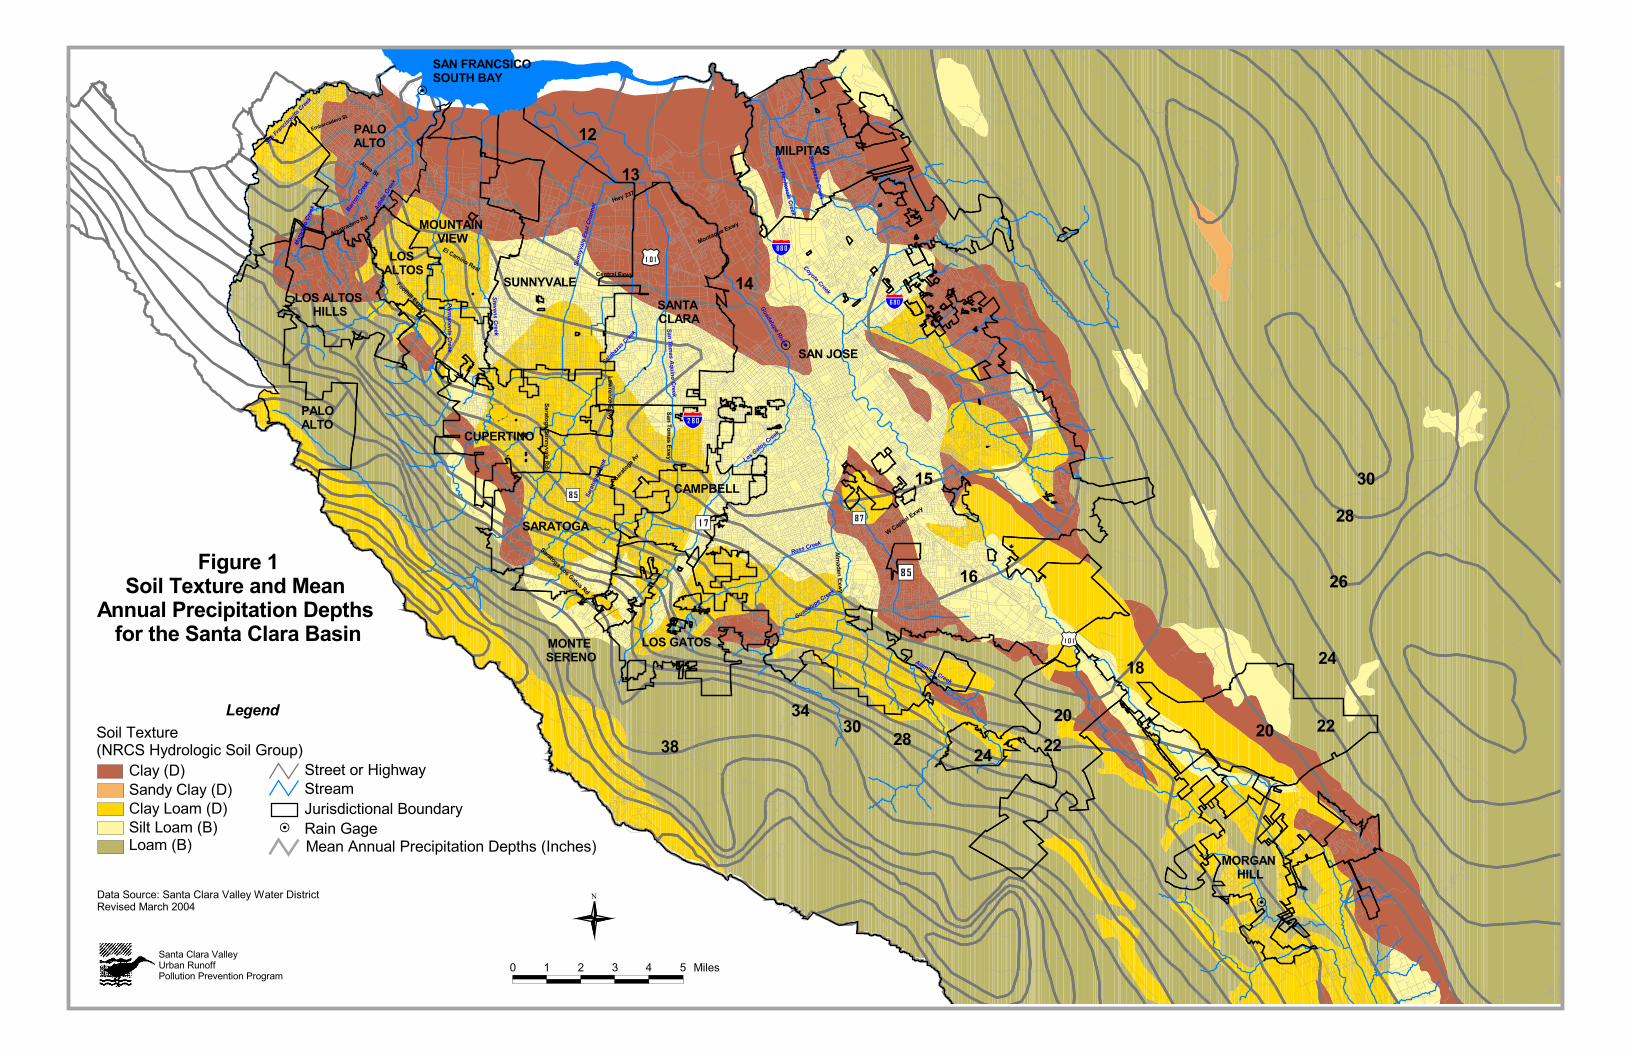
Figure B-1: Mean Annual Precipitation Depths and Soil Texture for the Santa Clara Basin
Figure B-2: Unit Basin Volume for 80% Capture, Assumed slope = 1%, San Jose Airport Rain Gage
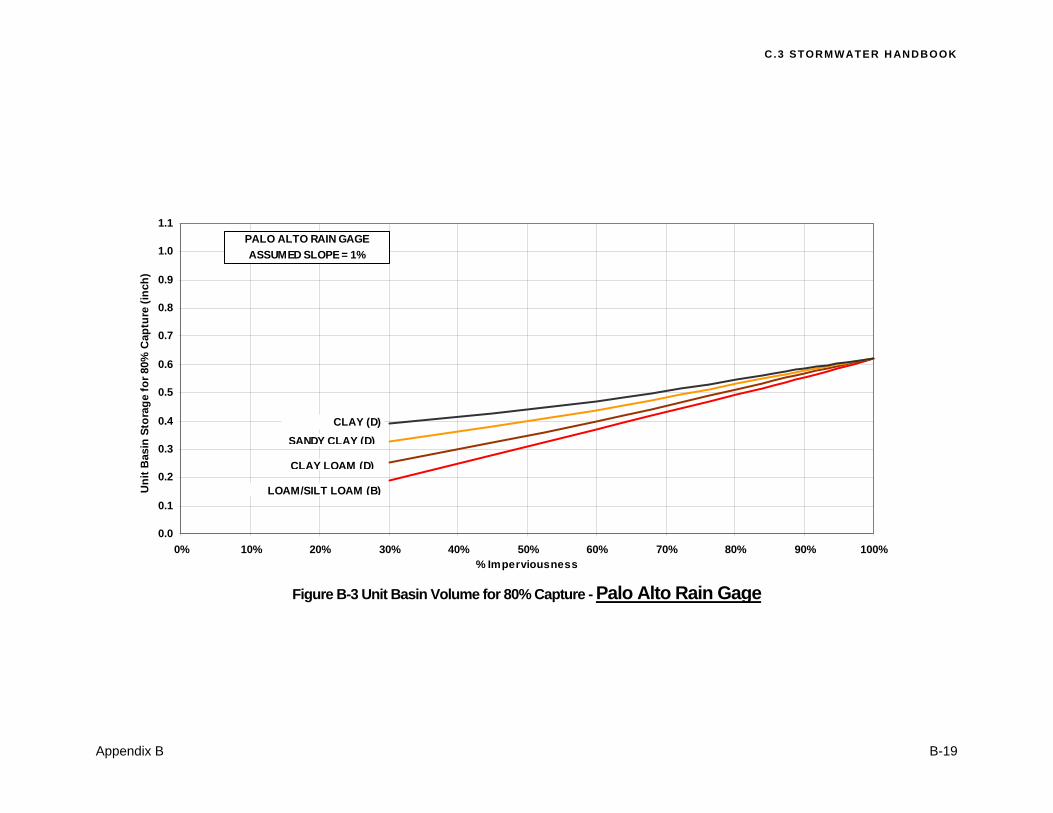
Figure B-3: Unit Basin Volume for 80% Capture, Assumed slope = 1%, Palo Alto Rain Gage
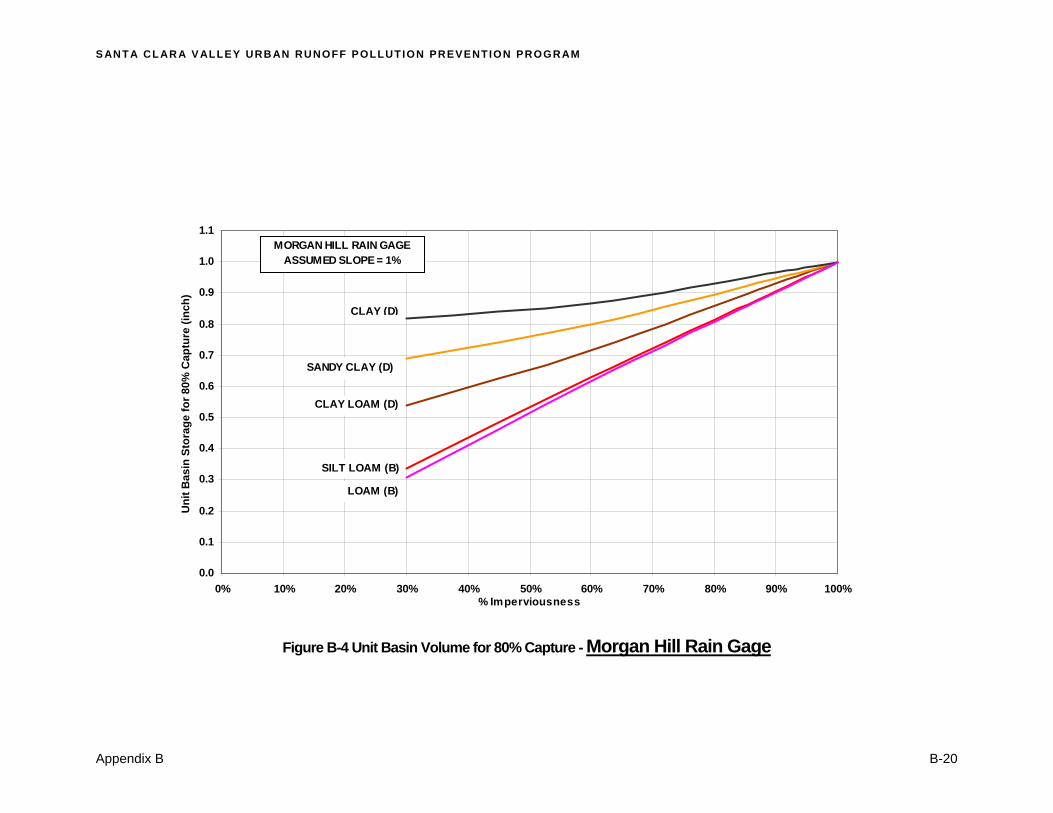
Figure B-4: Unit Basin Volume for 80% Capture, Assumed slope = 1%, Morgan Hill Rain Gage
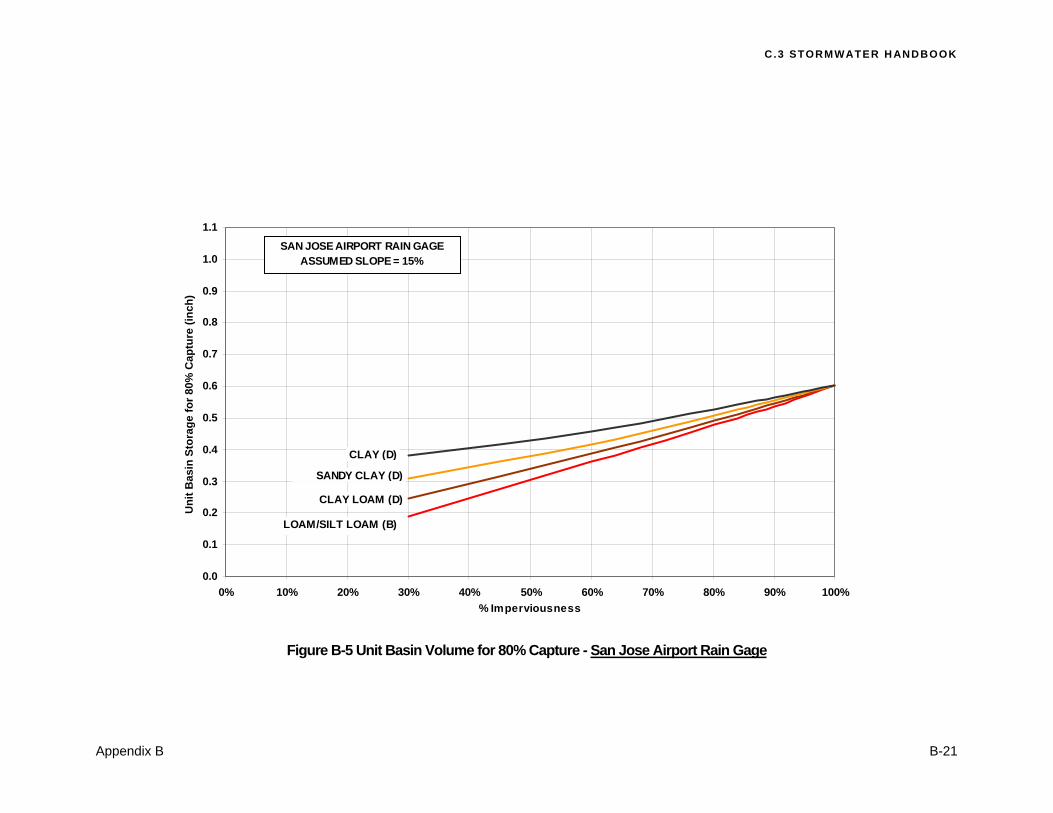
Figure B-5: Unit Basin Volume for 80% Capture, Assumed slope = 15%, San Jose Airport Rain Gage
Figure B-6: Unit Basin Volume for 80% Capture, Assumed slope = 15%, Palo Alto Rain Gage
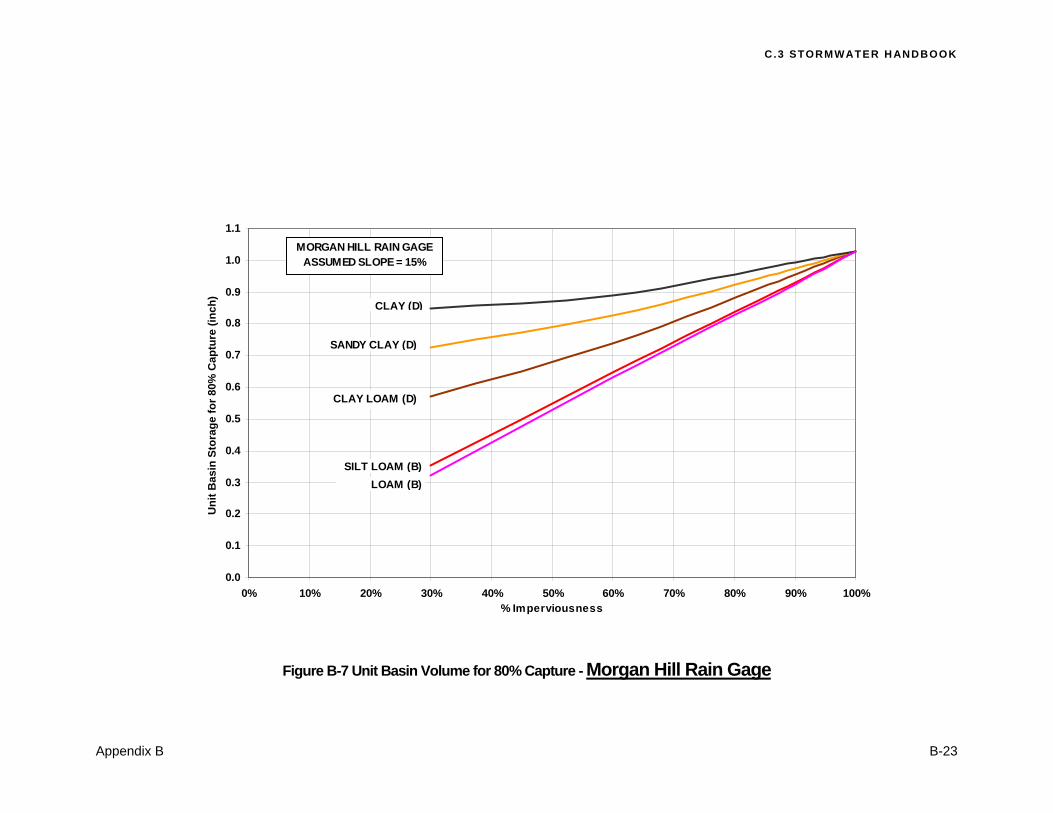
Figure B-7: Unit Basin Volume for 80% Capture, Assumed slope = 15%, Morgan Hill Rain Gage
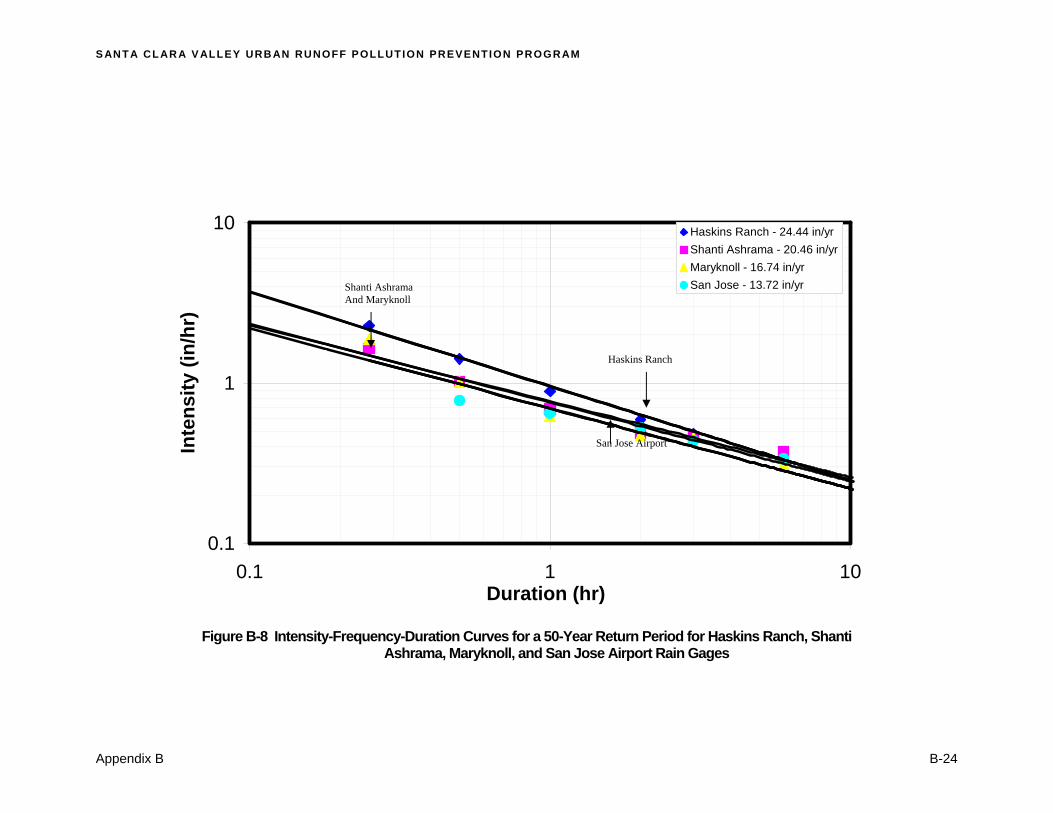
Figure B-8: Intensity-Frequency-Duration Curves for a 50-Year Return Period for Haskins Ranch, Shanti Ashrama, Maryknoll, and San Jose Airport Rain Gages

S ANT A CL AR A V ALLEY URB AN RUNOFF POLLUTION PREVENTION PROGRAM
Appendix B B-3
B.1 SCVURPPP Sizing Criteria Worksheets These worksheets are designed to assist municipal staff and development project proponents in sizing stormwater treatment measures. Figures referenced in the computations can be found at the end of this Appendix B. Section I. Selecting Sizing Approach Based on Type of Treatment Measure 1. Does the treatment measure operate by detaining a volume of runoff for a certain amount of time for
pollutant removal (i.e., is it a volume-based treatment measure)? See Table B-1 for examples.
___ Yes ____ No If Yes, continue to Section II. Sizing for Volume-Based Treatment Measures. If No, continue to next question.
2. Does the treatment measure operate based on the flow of runoff through the device (i.e, is it a flow-based
treatment measure)? See Table B-1 for examples.
___ Yes ____ No If Yes, continue to Section III. Sizing for Flow-Based Treatment Measures.
Table B-1. Flow and Volume Based Treatment Measure Sizing Criteria
Type of Treatment Measure LID? Hydraulic Sizing Criteria Bioretention area Yes Flow- or volume-based or combination
Flow-through planter box Yes Flow- or volume-based or combination
Tree well filter Yes1 Flow-based
Infiltration trench Yes Volume-based
Subsurface infiltration system Yes Volume-based
Rainwater harvesting and reuse Yes Volume-based
Media filter No Flow-based
Extended detention basin No Volume-based
1 A tree well filter is considered LID treatment if biotreatment soil is used as the filter media and the unit is sized based on a 5 in/hr surface loading rate.
S ANT A CL AR A V ALLEY URB AN RUNOFF POLLUTION PREVENTION PROGRAM
B-4 Appendix B
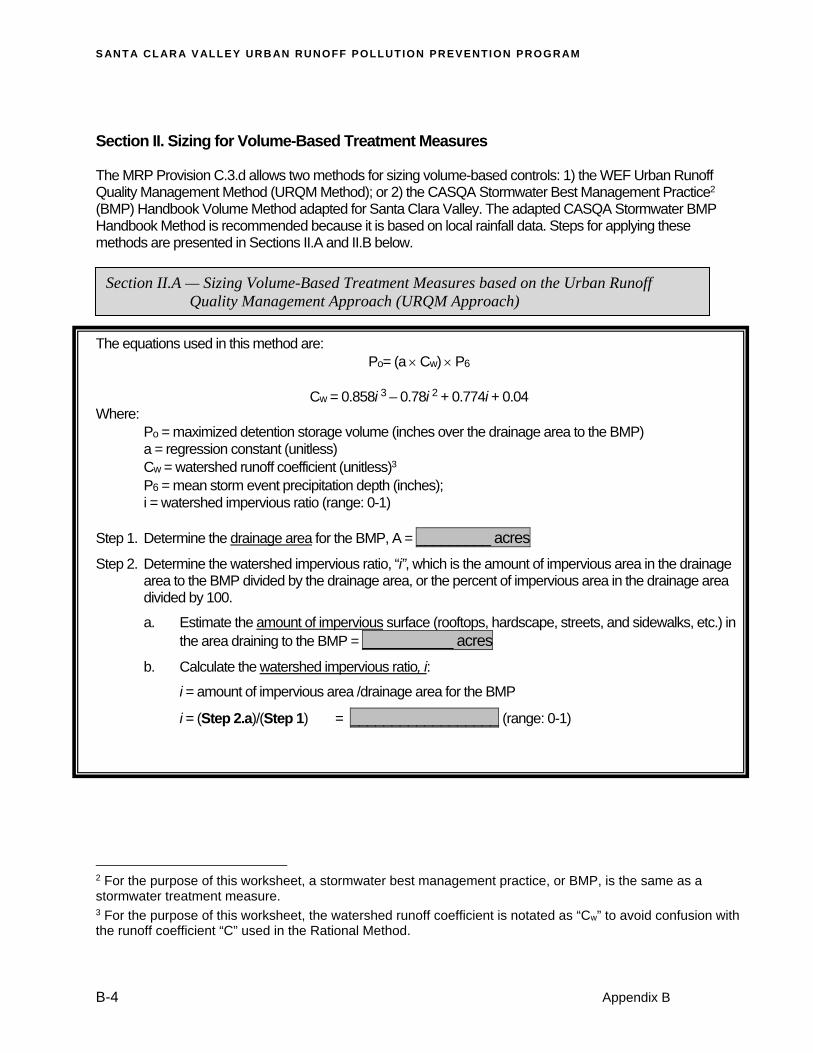
Section II. Sizing for Volume-Based Treatment Measures The MRP Provision C.3.d allows two methods for sizing volume-based controls: 1) the WEF Urban Runoff Quality Management Method (URQM Method); or 2) the CASQA Stormwater Best Management Practice2 (BMP) Handbook Volume Method adapted for Santa Clara Valley. The adapted CASQA Stormwater BMP Handbook Method is recommended because it is based on local rainfall data. Steps for applying these methods are presented in Sections II.A and II.B below. The equations used in this method are:
Po= (a Cw) P6
Cw = 0.858i 3 – 0.78i 2 + 0.774i + 0.04
Where: Po = maximized detention storage volume (inches over the drainage area to the BMP) a = regression constant (unitless) Cw = watershed runoff coefficient (unitless)3
P6 = mean storm event precipitation depth (inches); i = watershed impervious ratio (range: 0-1) Step 1. Determine the drainage area for the BMP, A = _________ acres
Step 2. Determine the watershed impervious ratio, “i”, which is the amount of impervious area in the drainage area to the BMP divided by the drainage area, or the percent of impervious area in the drainage area divided by 100.
a. Estimate the amount of impervious surface (rooftops, hardscape, streets, and sidewalks, etc.) in the area draining to the BMP = ___________ acres
b. Calculate the watershed impervious ratio, i:
i = amount of impervious area /drainage area for the BMP
i = (Step 2.a)/(Step 1) = __________________ (range: 0-1)
2 For the purpose of this worksheet, a stormwater best management practice, or BMP, is the same as a stormwater treatment measure. 3 For the purpose of this worksheet, the watershed runoff coefficient is notated as “Cw” to avoid confusion with the runoff coefficient “C” used in the Rational Method.
Section II.A — Sizing Volume-Based Treatment Measures based on the Urban Runoff Quality Management Approach (URQM Approach)
C .3 STORMWATER H ANDBOOK
Appendix B B-5
Section II. Sizing for Volume-Based Treatment Measures (continued)
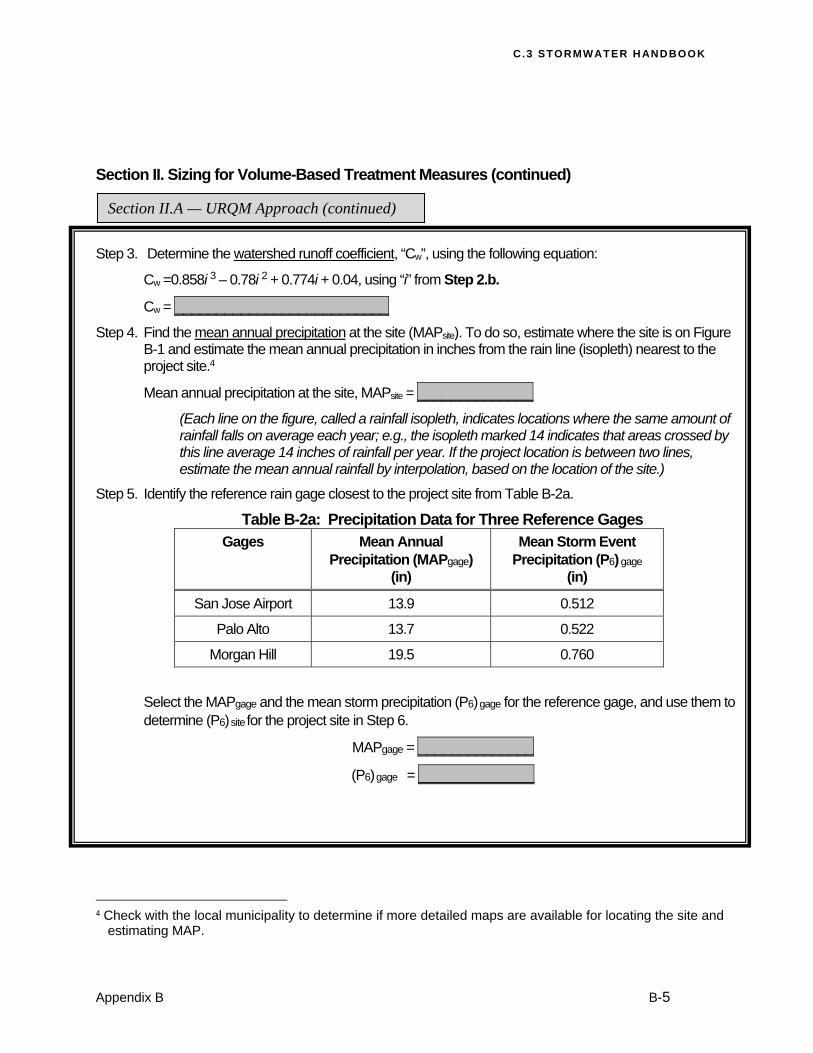
Step 3. Determine the watershed runoff coefficient, “Cw”, using the following equation:
Cw =0.858i 3 – 0.78i 2 + 0.774i + 0.04, using “i” from Step 2.b.
Cw = __________________________
Step 4. Find the mean annual precipitation at the site (MAPsite). To do so, estimate where the site is on Figure B-1 and estimate the mean annual precipitation in inches from the rain line (isopleth) nearest to the project site.4
Mean annual precipitation at the site, MAPsite = ______________
(Each line on the figure, called a rainfall isopleth, indicates locations where the same amount of rainfall falls on average each year; e.g., the isopleth marked 14 indicates that areas crossed by this line average 14 inches of rainfall per year. If the project location is between two lines, estimate the mean annual rainfall by interpolation, based on the location of the site.)
Step 5. Identify the reference rain gage closest to the project site from Table B-2a.
Table B-2a: Precipitation Data for Three Reference Gages Gages Mean Annual
Precipitation (MAPgage) (in)
Mean Storm Event Precipitation (P6) gage
(in)
San Jose Airport 13.9 0.512
Palo Alto 13.7 0.522
Morgan Hill 19.5 0.760
Select the MAPgage and the mean storm precipitation (P6) gage for the reference gage, and use them to determine (P6) site for the project site in Step 6.
MAPgage = ______________
(P6) gage = ______________
4 Check with the local municipality to determine if more detailed maps are available for locating the site and
estimating MAP.
Section II.A — URQM Approach (continued)
S ANT A CL AR A V ALLEY URB AN RUNOFF POLLUTION PREVENTION PROGRAM
B-6 Appendix B
Section II. Sizing for Volume-Based Treatment Measures, continued
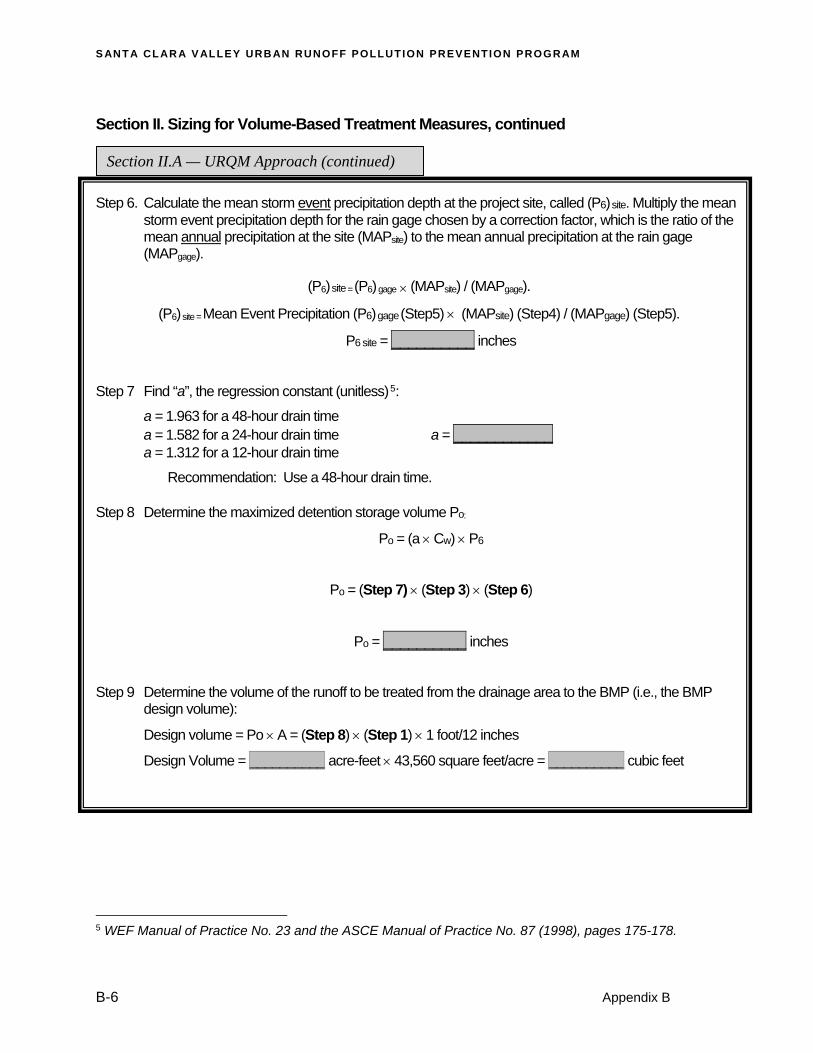
Step 6. Calculate the mean storm event precipitation depth at the project site, called (P6) site. Multiply the mean storm event precipitation depth for the rain gage chosen by a correction factor, which is the ratio of the mean annual precipitation at the site (MAPsite) to the mean annual precipitation at the rain gage (MAPgage).
(P6) site = (P6) gage (MAPsite) / (MAPgage).
(P6) site = Mean Event Precipitation (P6) gage (Step5) (MAPsite) (Step4) / (MAPgage) (Step5).
P6 site = __________ inches
Step 7 Find “a”, the regression constant (unitless) 5:
a = 1.963 for a 48-hour drain time a = 1.582 for a 24-hour drain time a = ____________ a = 1.312 for a 12-hour drain time
Recommendation: Use a 48-hour drain time.
Step 8 Determine the maximized detention storage volume Po:
Po = (a Cw) P6
Po = (Step 7) (Step 3) (Step 6)
Po = __________ inches
Step 9 Determine the volume of the runoff to be treated from the drainage area to the BMP (i.e., the BMP design volume):
Design volume = Po A = (Step 8) (Step 1) 1 foot/12 inches
Design Volume = __________ acre-feet 43,560 square feet/acre = __________ cubic feet
5 WEF Manual of Practice No. 23 and the ASCE Manual of Practice No. 87 (1998), pages 175-178.
Section II.A — URQM Approach (continued)
C .3 STORMWATER H ANDBOOK
Appendix B B-7
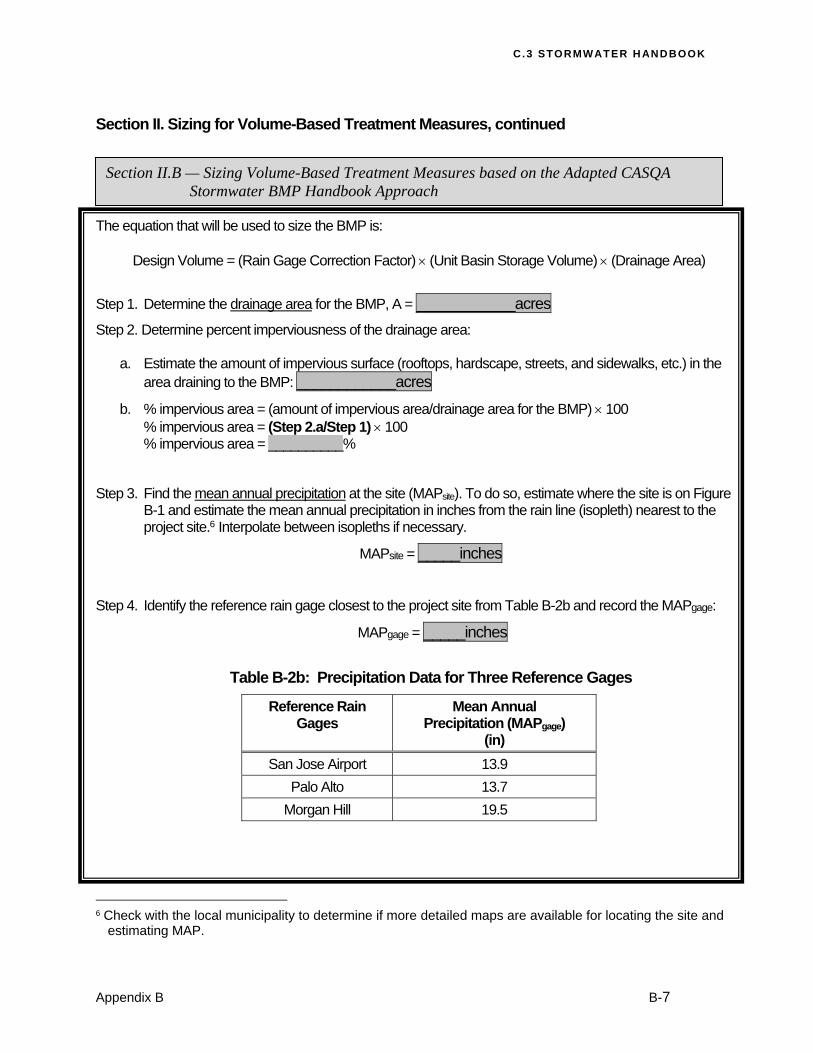
Section II. Sizing for Volume-Based Treatment Measures, continued The equation that will be used to size the BMP is:
Design Volume = (Rain Gage Correction Factor) (Unit Basin Storage Volume) (Drainage Area)
Step 1. Determine the drainage area for the BMP, A = ____________acres
Step 2. Determine percent imperviousness of the drainage area: a. Estimate the amount of impervious surface (rooftops, hardscape, streets, and sidewalks, etc.) in the
area draining to the BMP: ____________acres
b. % impervious area = (amount of impervious area/drainage area for the BMP) 100 % impervious area = (Step 2.a/Step 1) 100
% impervious area = __________%
Step 3. Find the mean annual precipitation at the site (MAPsite). To do so, estimate where the site is on Figure B-1 and estimate the mean annual precipitation in inches from the rain line (isopleth) nearest to the project site.6 Interpolate between isopleths if necessary.
MAPsite = _____inches
Step 4. Identify the reference rain gage closest to the project site from Table B-2b and record the MAPgage:
MAPgage = _____inches
Table B-2b: Precipitation Data for Three Reference Gages
Reference Rain Gages
Mean Annual Precipitation (MAPgage)
(in)
San Jose Airport 13.9
Palo Alto 13.7
Morgan Hill 19.5
6 Check with the local municipality to determine if more detailed maps are available for locating the site and
estimating MAP.
Section II.B — Sizing Volume-Based Treatment Measures based on the Adapted CASQA Stormwater BMP Handbook Approach
S ANT A CL AR A V ALLEY URB AN RUNOFF POLLUTION PREVENTION PROGRAM
B-8 Appendix B
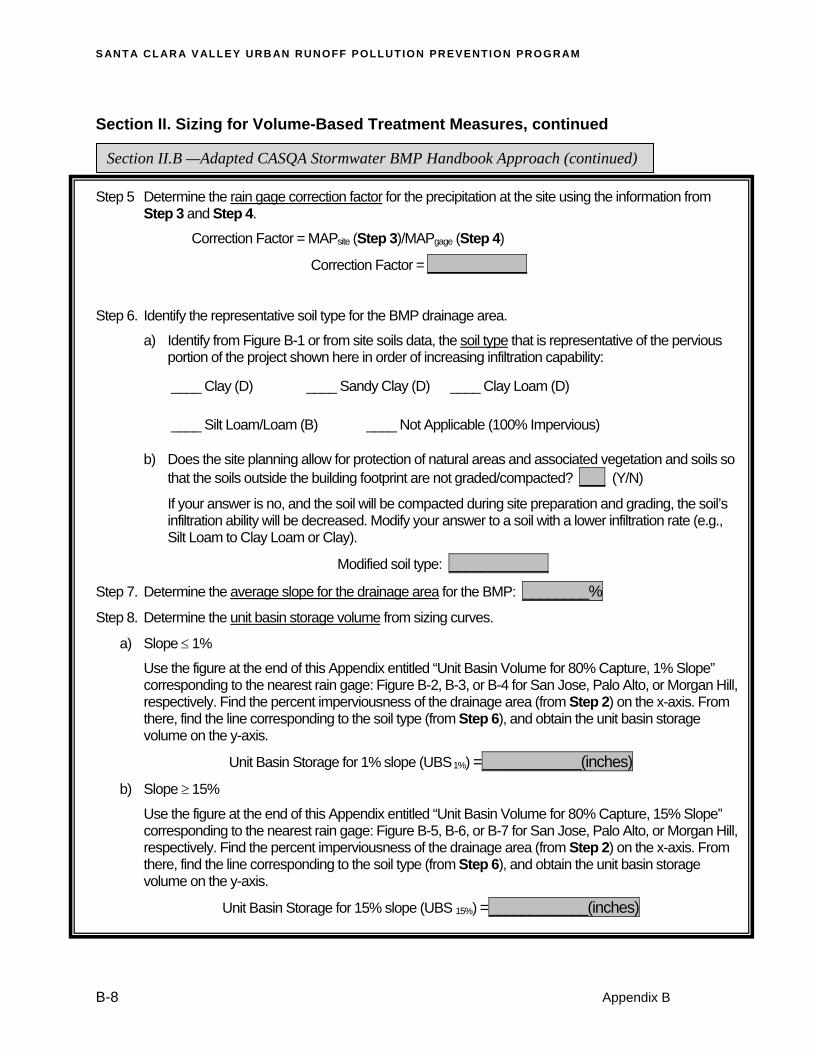
Section II. Sizing for Volume-Based Treatment Measures, continued Step 5 Determine the rain gage correction factor for the precipitation at the site using the information from
Step 3 and Step 4.
Correction Factor = MAPsite (Step 3)/MAPgage (Step 4)
Correction Factor = ____________
Step 6. Identify the representative soil type for the BMP drainage area.
a) Identify from Figure B-1 or from site soils data, the soil type that is representative of the pervious portion of the project shown here in order of increasing infiltration capability:
____ Clay (D) ____ Sandy Clay (D) ____ Clay Loam (D)
____ Silt Loam/Loam (B) ____ Not Applicable (100% Impervious)
b) Does the site planning allow for protection of natural areas and associated vegetation and soils so that the soils outside the building footprint are not graded/compacted? ___ (Y/N)
If your answer is no, and the soil will be compacted during site preparation and grading, the soil’s infiltration ability will be decreased. Modify your answer to a soil with a lower infiltration rate (e.g., Silt Loam to Clay Loam or Clay).
Modified soil type: ____________
Step 7. Determine the average slope for the drainage area for the BMP: ________%
Step 8. Determine the unit basin storage volume from sizing curves.
a) Slope 1%
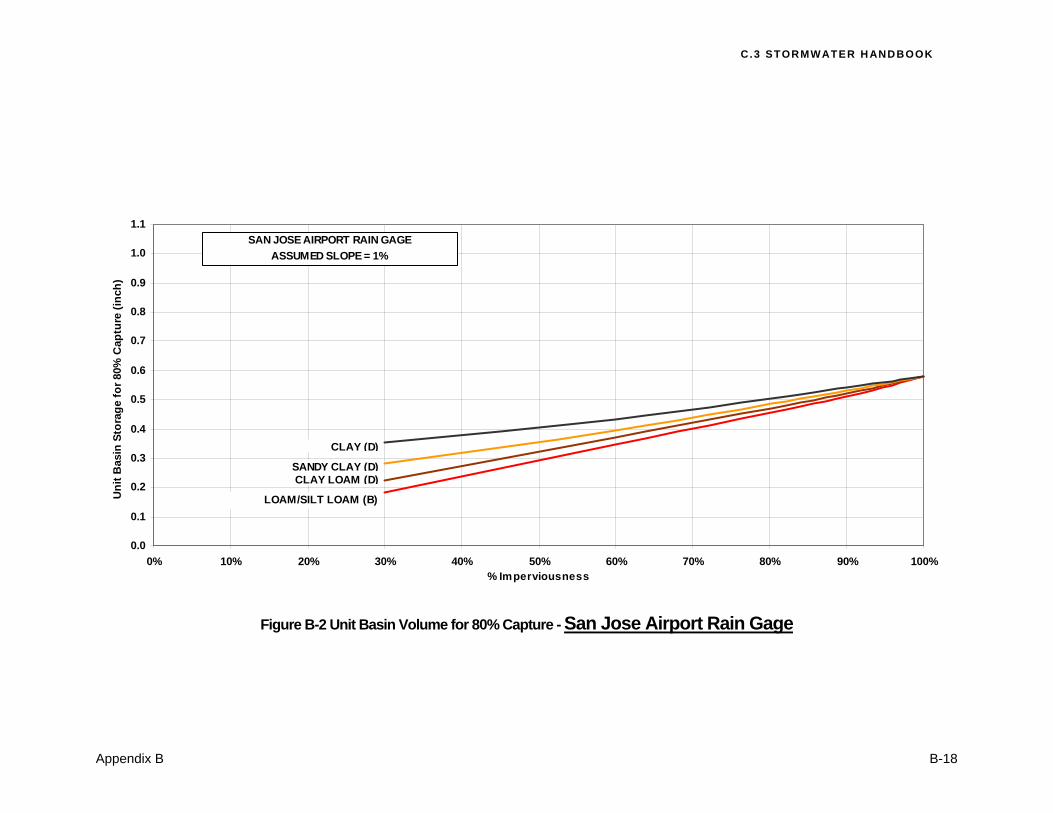
Use the figure at the end of this Appendix entitled “Unit Basin Volume for 80% Capture, 1% Slope” corresponding to the nearest rain gage: Figure B-2, B-3, or B-4 for San Jose, Palo Alto, or Morgan Hill, respectively. Find the percent imperviousness of the drainage area (from Step 2) on the x-axis. From there, find the line corresponding to the soil type (from Step 6), and obtain the unit basin storage volume on the y-axis.
Unit Basin Storage for 1% slope (UBS 1%) =____________(inches)
b) Slope 15%
Use the figure at the end of this Appendix entitled “Unit Basin Volume for 80% Capture, 15% Slope” corresponding to the nearest rain gage: Figure B-5, B-6, or B-7 for San Jose, Palo Alto, or Morgan Hill, respectively. Find the percent imperviousness of the drainage area (from Step 2) on the x-axis. From there, find the line corresponding to the soil type (from Step 6), and obtain the unit basin storage volume on the y-axis.
Unit Basin Storage for 15% slope (UBS 15%) =____________(inches)
Section II.B —Adapted CASQA Stormwater BMP Handbook Approach (continued)
C .3 STORMWATER H ANDBOOK
Appendix B B-9
Section II. Sizing for Volume-Based Treatment Measures, continued
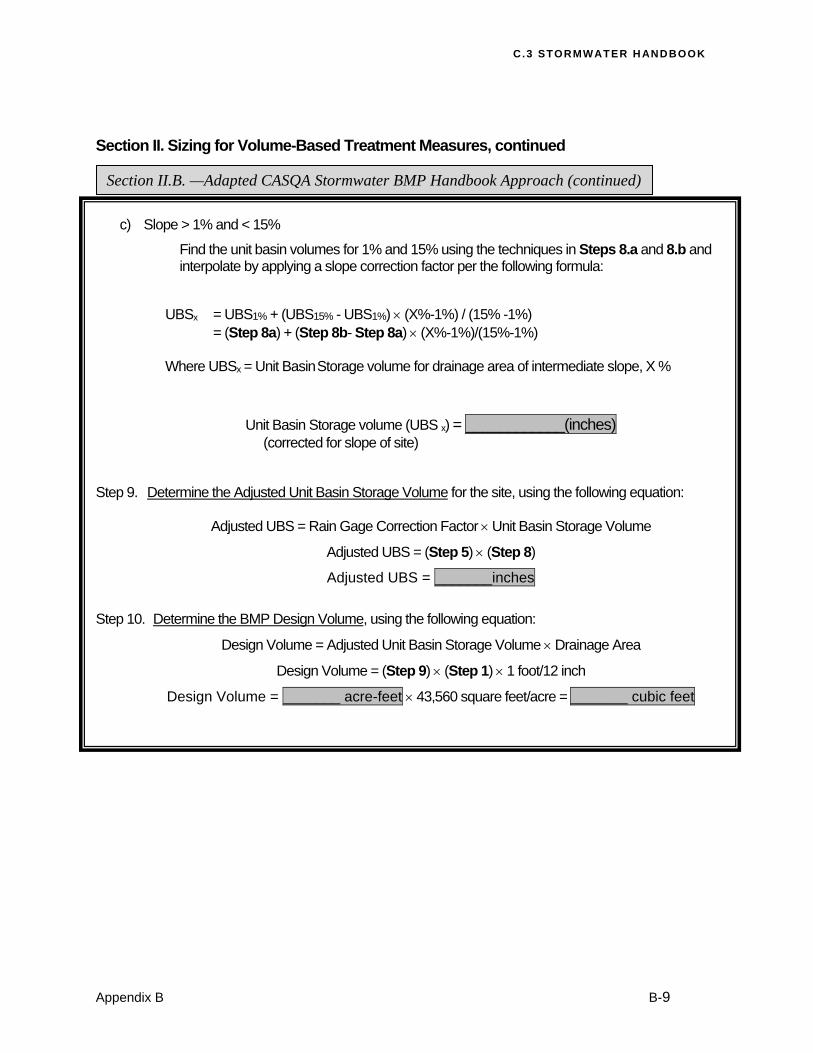
c) Slope > 1% and < 15%
Find the unit basin volumes for 1% and 15% using the techniques in Steps 8.a and 8.b and interpolate by applying a slope correction factor per the following formula:
Unit Basin Storage volume (UBS x) = ____________(inches) (corrected for slope of site)
Step 9. Determine the Adjusted Unit Basin Storage Volume for the site, using the following equation:
Adjusted UBS = Rain Gage Correction Factor Unit Basin Storage Volume
Adjusted UBS = (Step 5) (Step 8)
Adjusted UBS = _______inches
Step 10. Determine the BMP Design Volume, using the following equation:
Design Volume = Adjusted Unit Basin Storage Volume Drainage Area
Design Volume = (Step 9) (Step 1) 1 foot/12 inch
Design Volume = _______ acre-feet 43,560 square feet/acre = _______ cubic feet
UBSx = UBS1% + (UBS15% - UBS1%) (X%-1%) / (15% -1%) = (Step 8a) + (Step 8b- Step 8a) (X%-1%)/(15%-1%)
Where UBSx = Unit Basin Storage volume for drainage area of intermediate slope, X %
Section II.B. —Adapted CASQA Stormwater BMP Handbook Approach (continued)
S ANT A CL AR A V ALLEY URB AN RUNOFF POLLUTION PREVENTION PROGRAM
B-10 Appendix B
III. Sizing for Flow-based Treatment Measures
The MRP Provision C.3.d allows three methods for sizing flow-based treatment measures: 1) the Factored Flood Flow Method (10% of the 50-year peak flow rate); 2) the CASQA Stormwater BMP Handbook Method (the flow produced by a rain event equal to at least 2 times the 85th percentile hourly rainfall intensity); or 3) the Uniform Intensity Method (the flow produced by a rain event equal to at least 0.2 inches/hour intensity). Use of Method 2 or 3 is recommended. Steps for applying these methods are presented in Sections III.A, III.B, and III.C below.
Each of the three methods will require estimating a runoff coefficient for the area draining to the BMP. Recommended coefficients are provided in Table B-3.
Table B-3 – Estimated Runoff Coefficients for Various Surfaces During Small Storms
Type of Surface Runoff Coefficients “C” factor
Roofs 0.90
Concrete 0.90
Stone, brick, or concrete pavers with mortared joints and bedding 0.90
Asphalt 0.90
Stone, brick, or concrete pavers with sand joints and bedding 0.90
Pervious concrete 0.10
Porous asphalt 0.10
Permeable interlocking concrete pavement 0.10
Grid pavements with grass or aggregate surface 0.10
Crushed aggregate 0.10
Grass 0.10
Notes: These C-factors are only appropriate for small storm treatment BMP design, and should not be used for flood control sizing. Where available, locally developed small storm C-factors for various surfaces should be used. Sources: BASMAA, 2003; Lindeburg, 2003; Hade and Smith, 1988; Smith, 2012.
C .3 STORMWATER H ANDBOOK
Appendix B B-11
III. Sizing for Flow-based Treatment Measures, continued
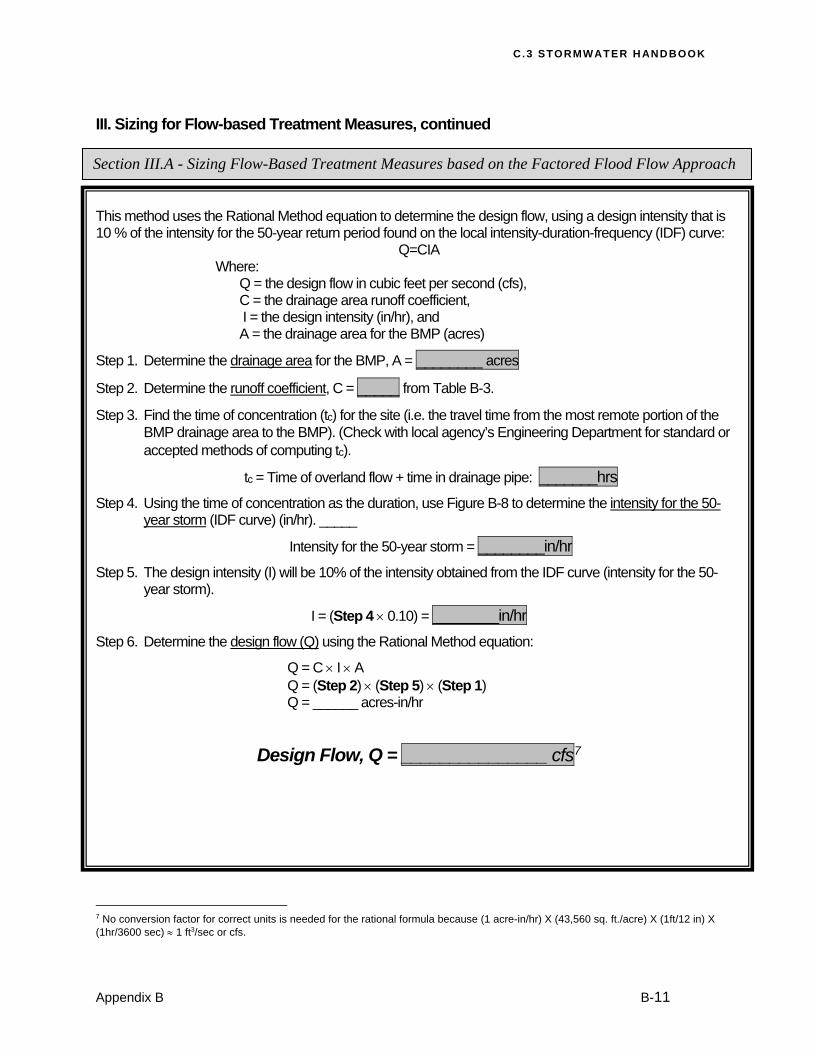
This method uses the Rational Method equation to determine the design flow, using a design intensity that is 10 % of the intensity for the 50-year return period found on the local intensity-duration-frequency (IDF) curve:
Q=CIA Where:
Q = the design flow in cubic feet per second (cfs), C = the drainage area runoff coefficient, I = the design intensity (in/hr), and A = the drainage area for the BMP (acres)
Step 1. Determine the drainage area for the BMP, A = ________ acres
Step 2. Determine the runoff coefficient, C = _____ from Table B-3.
Step 3. Find the time of concentration (tc) for the site (i.e. the travel time from the most remote portion of the BMP drainage area to the BMP). (Check with local agency’s Engineering Department for standard or accepted methods of computing tc).
tc = Time of overland flow + time in drainage pipe: _______hrs
Step 4. Using the time of concentration as the duration, use Figure B-8 to determine the intensity for the 50-year storm (IDF curve) (in/hr). _____
Intensity for the 50-year storm = ________in/hr
Step 5. The design intensity (I) will be 10% of the intensity obtained from the IDF curve (intensity for the 50-year storm).
I = (Step 4 0.10) = ________in/hr
Step 6. Determine the design flow (Q) using the Rational Method equation:
Q = C I A Q = (Step 2) (Step 5) (Step 1) Q = ______ acres-in/hr
Design Flow, Q = _______________ cfs7
7 No conversion factor for correct units is needed for the rational formula because (1 acre-in/hr) X (43,560 sq. ft./acre) X (1ft/12 in) X (1hr/3600 sec) 1 ft3/sec or cfs.
Section III.A - Sizing Flow-Based Treatment Measures based on the Factored Flood Flow Approach
S ANT A CL AR A V ALLEY URB AN RUNOFF POLLUTION PREVENTION PROGRAM
B-12 Appendix B
III. Sizing for Flow-based Treatment Measures, continued
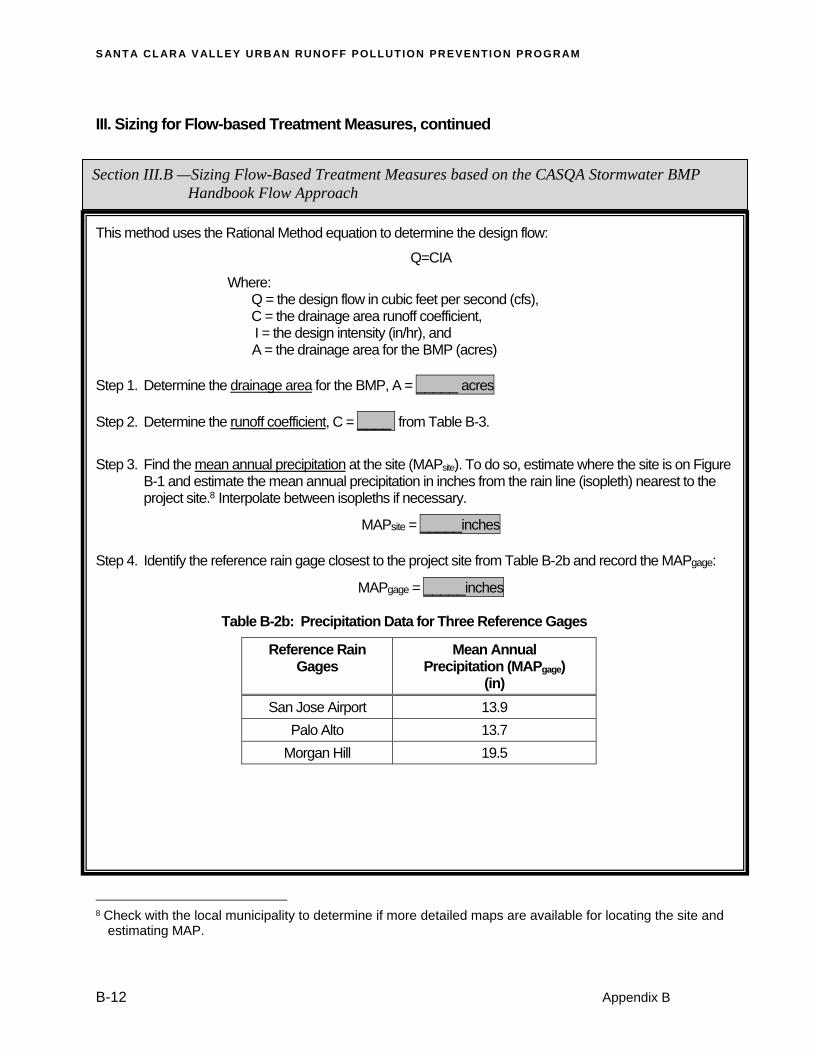
This method uses the Rational Method equation to determine the design flow:
Q=CIA
Where: Q = the design flow in cubic feet per second (cfs), C = the drainage area runoff coefficient, I = the design intensity (in/hr), and A = the drainage area for the BMP (acres)
Step 1. Determine the drainage area for the BMP, A = _____ acres Step 2. Determine the runoff coefficient, C = ____ from Table B-3.
Step 3. Find the mean annual precipitation at the site (MAPsite). To do so, estimate where the site is on Figure
B-1 and estimate the mean annual precipitation in inches from the rain line (isopleth) nearest to the project site.8 Interpolate between isopleths if necessary.
MAPsite = _____inches Step 4. Identify the reference rain gage closest to the project site from Table B-2b and record the MAPgage:
MAPgage = _____inches
Table B-2b: Precipitation Data for Three Reference Gages
Reference Rain Gages
Mean Annual Precipitation (MAPgage)
(in)
San Jose Airport 13.9
Palo Alto 13.7
Morgan Hill 19.5
8 Check with the local municipality to determine if more detailed maps are available for locating the site and
estimating MAP.
Section III.B —Sizing Flow-Based Treatment Measures based on the CASQA Stormwater BMP Handbook Flow Approach
C .3 STORMWATER H ANDBOOK
Appendix B B-13
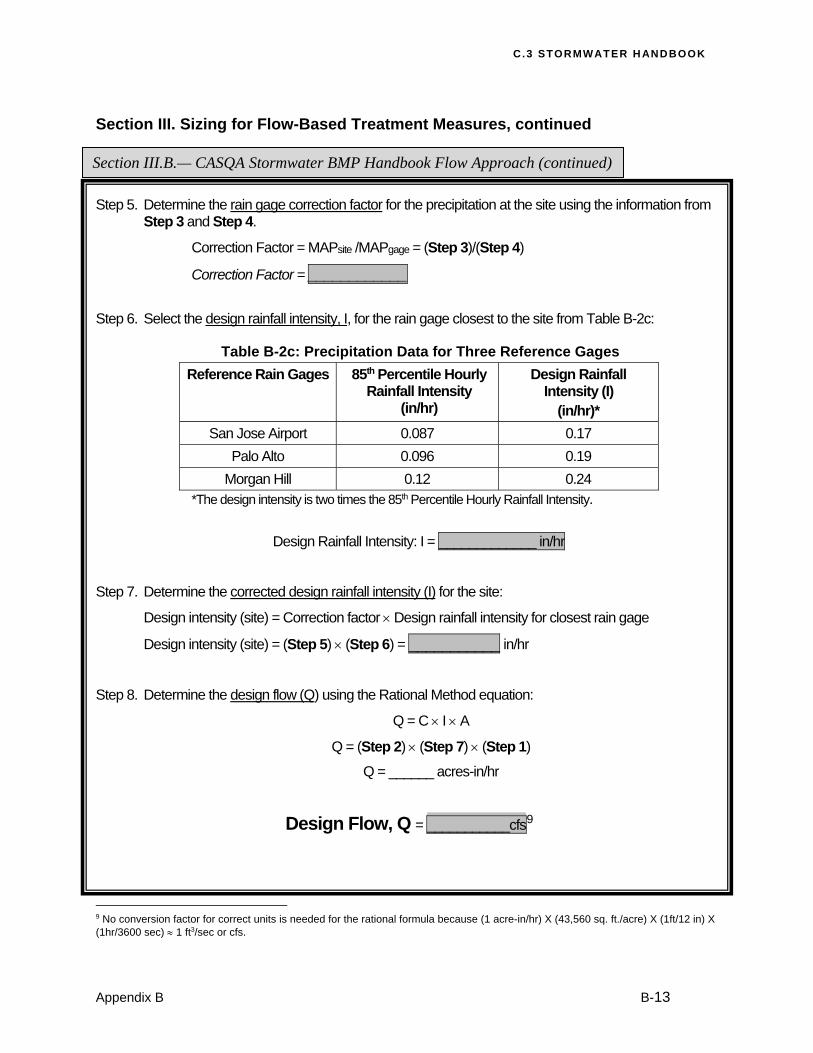
Section III. Sizing for Flow-Based Treatment Measures, continued
Step 5. Determine the rain gage correction factor for the precipitation at the site using the information from Step 3 and Step 4.
Correction Factor = MAPsite /MAPgage = (Step 3)/(Step 4)
Correction Factor = ____________
Step 6. Select the design rainfall intensity, I, for the rain gage closest to the site from Table B-2c:
Table B-2c: Precipitation Data for Three Reference Gages
Reference Rain Gages 85th Percentile Hourly Rainfall Intensity
(in/hr)
Design Rainfall Intensity (I)
(in/hr)*
San Jose Airport 0.087 0.17
Palo Alto 0.096 0.19
Morgan Hill 0.12 0.24 *The design intensity is two times the 85th Percentile Hourly Rainfall Intensity.
Design Rainfall Intensity: I = _____________ in/hr
Step 7. Determine the corrected design rainfall intensity (I) for the site:
Design intensity (site) = Correction factor Design rainfall intensity for closest rain gage
Design intensity (site) = (Step 5) (Step 6) = ___________ in/hr
Step 8. Determine the design flow (Q) using the Rational Method equation:
Q = C I A
Q = (Step 2) (Step 7) (Step 1)
Q = ______ acres-in/hr
Design Flow, Q = ___________cfs9
9 No conversion factor for correct units is needed for the rational formula because (1 acre-in/hr) X (43,560 sq. ft./acre) X (1ft/12 in) X (1hr/3600 sec) 1 ft3/sec or cfs.
Section III.B.— CASQA Stormwater BMP Handbook Flow Approach (continued)
S ANT A CL AR A V ALLEY URB AN RUNOFF POLLUTION PREVENTION PROGRAM
B-14 Appendix B
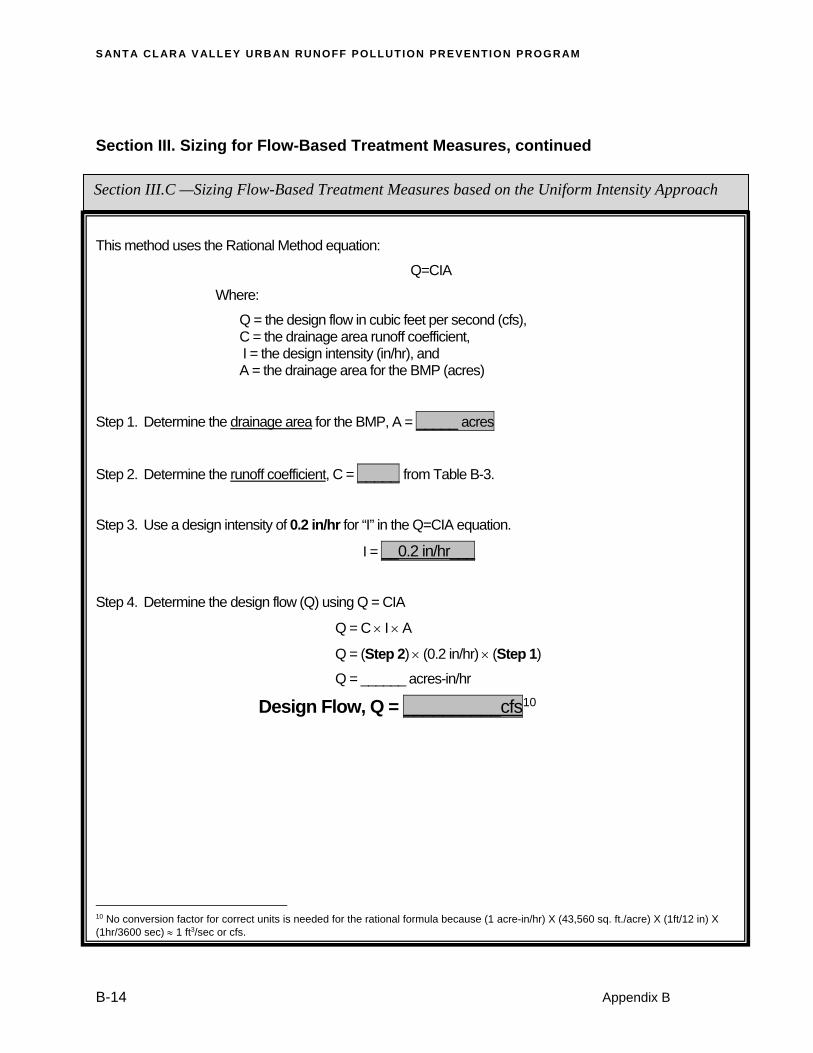
Section III. Sizing for Flow-Based Treatment Measures, continued
This method uses the Rational Method equation:
Q=CIA
Where:
Q = the design flow in cubic feet per second (cfs), C = the drainage area runoff coefficient, I = the design intensity (in/hr), and A = the drainage area for the BMP (acres)
Step 1. Determine the drainage area for the BMP, A = _____ acres
Step 2. Determine the runoff coefficient, C = _____ from Table B-3.
Step 3. Use a design intensity of 0.2 in/hr for “I” in the Q=CIA equation.
I = __0.2 in/hr___
Step 4. Determine the design flow (Q) using Q = CIA
Q = C I A
Q = (Step 2) (0.2 in/hr) (Step 1)
Q = ______ acres-in/hr
Design Flow, Q = __________cfs10
10 No conversion factor for correct units is needed for the rational formula because (1 acre-in/hr) X (43,560 sq. ft./acre) X (1ft/12 in) X (1hr/3600 sec) 1 ft3/sec or cfs.
Section III.C —Sizing Flow-Based Treatment Measures based on the Uniform Intensity Approach
C .3 STORMWATER H ANDBOOK
Appendix B B-15
Section IV. Sizing for Flow- and Volume- Based Treatment Measures (Combination Flow and Volume Approach)
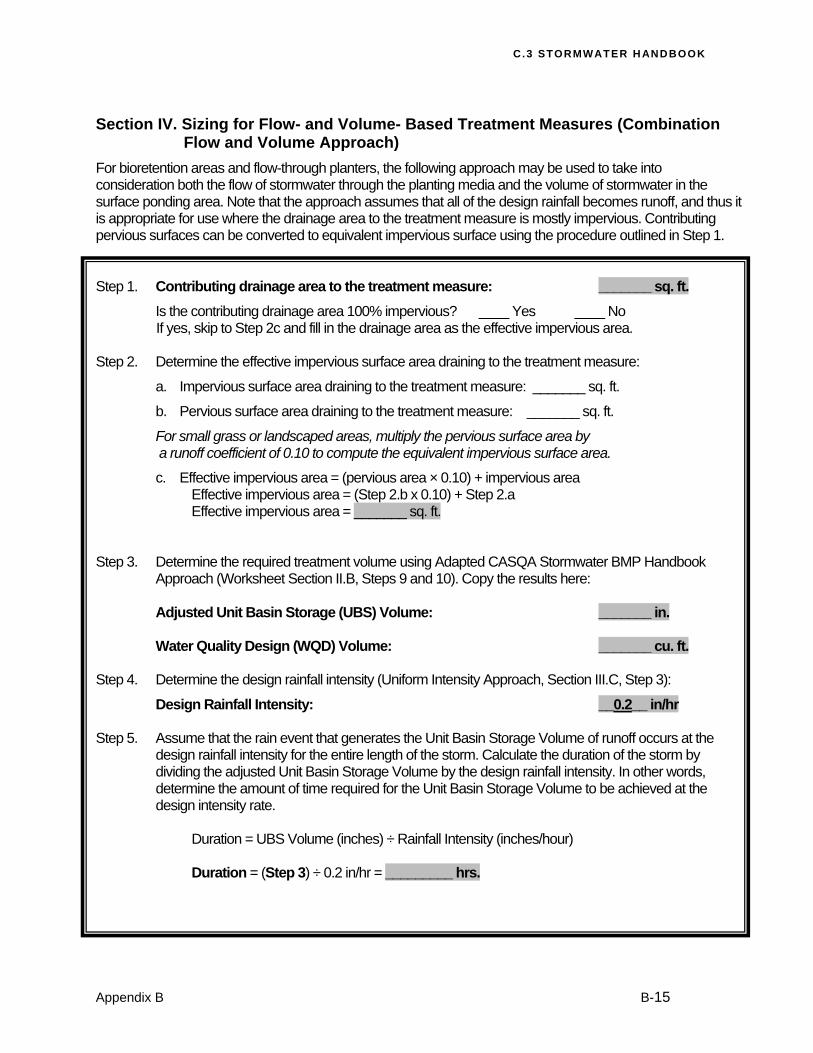
For bioretention areas and flow-through planters, the following approach may be used to take into consideration both the flow of stormwater through the planting media and the volume of stormwater in the surface ponding area. Note that the approach assumes that all of the design rainfall becomes runoff, and thus it is appropriate for use where the drainage area to the treatment measure is mostly impervious. Contributing pervious surfaces can be converted to equivalent impervious surface using the procedure outlined in Step 1.
Step 1. Contributing drainage area to the treatment measure: _______ sq. ft.
Is the contributing drainage area 100% impervious? ____ Yes ____ No If yes, skip to Step 2c and fill in the drainage area as the effective impervious area.
Step 2. Determine the effective impervious surface area draining to the treatment measure:
a. Impervious surface area draining to the treatment measure: _______ sq. ft.
b. Pervious surface area draining to the treatment measure: _______ sq. ft.
For small grass or landscaped areas, multiply the pervious surface area by a runoff coefficient of 0.10 to compute the equivalent impervious surface area.
c. Effective impervious area = (pervious area × 0.10) + impervious area Effective impervious area = (Step 2.b x 0.10) + Step 2.a Effective impervious area = _______ sq. ft. Step 3. Determine the required treatment volume using Adapted CASQA Stormwater BMP Handbook
Approach (Worksheet Section II.B, Steps 9 and 10). Copy the results here: Adjusted Unit Basin Storage (UBS) Volume: _______ in. Water Quality Design (WQD) Volume: _______ cu. ft. Step 4. Determine the design rainfall intensity (Uniform Intensity Approach, Section III.C, Step 3):
Design Rainfall Intensity: __0.2__ in/hr Step 5. Assume that the rain event that generates the Unit Basin Storage Volume of runoff occurs at the
design rainfall intensity for the entire length of the storm. Calculate the duration of the storm by dividing the adjusted Unit Basin Storage Volume by the design rainfall intensity. In other words, determine the amount of time required for the Unit Basin Storage Volume to be achieved at the design intensity rate.
Duration = UBS Volume (inches) ÷ Rainfall Intensity (inches/hour) Duration = (Step 3) ÷ 0.2 in/hr = _________ hrs.
S ANT A CL AR A V ALLEY URB AN RUNOFF POLLUTION PREVENTION PROGRAM
B-16 Appendix B
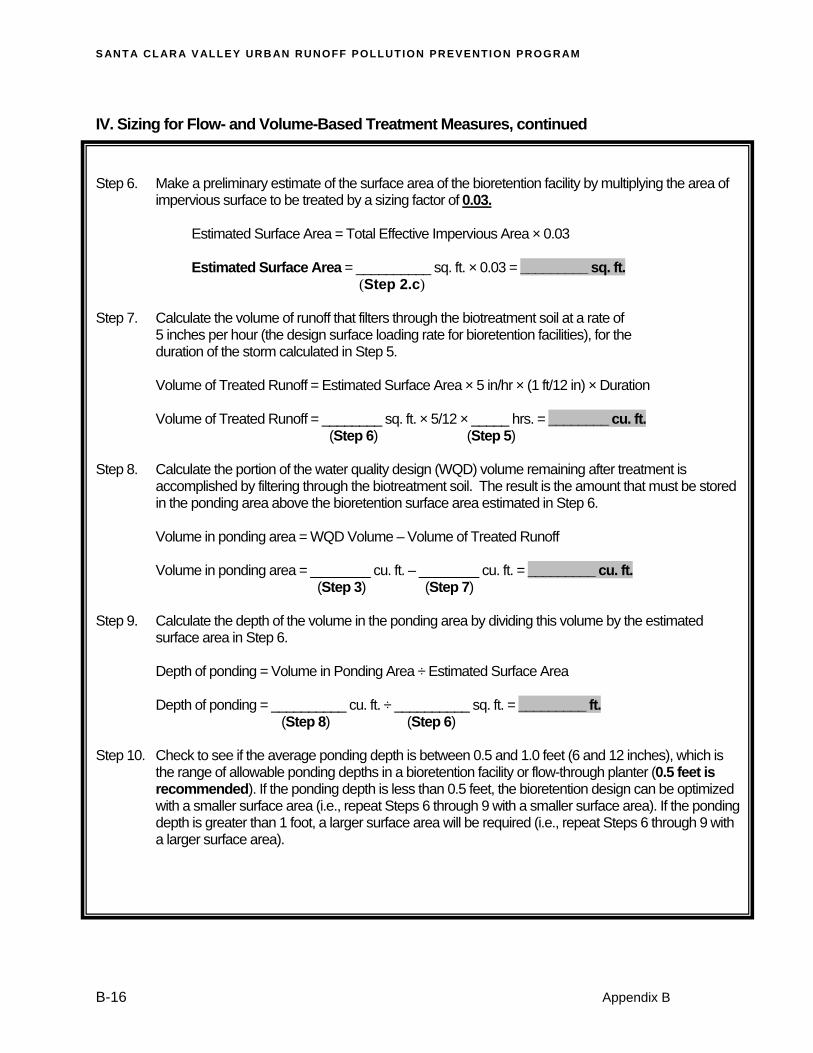
IV. Sizing for Flow- and Volume-Based Treatment Measures, continued
Step 6. Make a preliminary estimate of the surface area of the bioretention facility by multiplying the area of
impervious surface to be treated by a sizing factor of 0.03. Estimated Surface Area = Total Effective Impervious Area × 0.03 Estimated Surface Area = __________ sq. ft. × 0.03 = _________ sq. ft. (Step 2.c) Step 7. Calculate the volume of runoff that filters through the biotreatment soil at a rate of
5 inches per hour (the design surface loading rate for bioretention facilities), for the duration of the storm calculated in Step 5.
Volume of Treated Runoff = Estimated Surface Area × 5 in/hr × (1 ft/12 in) × Duration Volume of Treated Runoff = ________ sq. ft. × 5/12 × _____ hrs. = ________ cu. ft.
(Step 6) (Step 5) Step 8. Calculate the portion of the water quality design (WQD) volume remaining after treatment is
accomplished by filtering through the biotreatment soil. The result is the amount that must be stored in the ponding area above the bioretention surface area estimated in Step 6.
Volume in ponding area = WQD Volume – Volume of Treated Runoff Volume in ponding area = ________ cu. ft. – ________ cu. ft. = _________ cu. ft. (Step 3) (Step 7) Step 9. Calculate the depth of the volume in the ponding area by dividing this volume by the estimated
surface area in Step 6. Depth of ponding = Volume in Ponding Area ÷ Estimated Surface Area Depth of ponding = __________ cu. ft. ÷ __________ sq. ft. = _________ ft. (Step 8) (Step 6) Step 10. Check to see if the average ponding depth is between 0.5 and 1.0 feet (6 and 12 inches), which is
the range of allowable ponding depths in a bioretention facility or flow-through planter (0.5 feet is recommended). If the ponding depth is less than 0.5 feet, the bioretention design can be optimized with a smaller surface area (i.e., repeat Steps 6 through 9 with a smaller surface area). If the ponding depth is greater than 1 foot, a larger surface area will be required (i.e., repeat Steps 6 through 9 with a larger surface area).
�
�
�
���������
���������������
��������� �
�������
���������
�� �����
�����������
�������
��������
������������ �� � ��
���� ��
�������
����������
��
��
��
��
����
��
��
��
��
��
��
������
������
��
���������������������
������������
��� ����������������������������
��������������
���� � �
���� ��
��� � �
���� � �
��� � ��� �
��� �
��� �
��� � �
�������������������
���
����
����
�������
������
����
�������������
����!��
����
���������������
�����
���������
����������
���
�������
�������������
�������
����
�������
����
"��
�����
����
���#�
�����
������
���
���������
��� !"#!� $�% ��"��&'�(� $�%
�!") �*� $�%
&")�+,!�
$�%
�*'�-!"� $�%
����./)&*�
$�%
�� �)
&+���
0
�� �)&+���&(���)&(��-
�� �)&+���,""%0�*!��-
��%���1
�&&)2/**� $.�%
�*'���)
*���'/"&��!�*
'3� #�-! &��
)
� �() �-!
&��-
���������������������� �������������������������������
�������������������������������������
����!���������"���!�������
��!���
#�����"������#�����"�����#����������!���������������
�����$%�����& ���'!�������������(�����
��������'���)�
����(���
����������*������������������+������������ ���!�������,--.
- / , 0 . 1 ����
�
�/+, !���&/*��!$), !��"-�!�"�
�"",�*�� !#/./)�)/&"�4!.)2(�5& �)2!���")���*� ����(/"
C .3 STORMWATER H ANDBOOK
Appendix B B-18
0.0
0.1
0.2
0.3
0.4
0.5
0.6
0.7
0.8
0.9
1.0
1.1
0% 10% 20% 30% 40% 50% 60% 70% 80% 90% 100%% Imperviousness
Un
it B
asin
Sto
rag
e fo
r 80
% C
aptu
re (
inch
)
SAN JOSE AIRPORT RAIN GAGE
ASSUMED SLOPE = 1%
LOAM/SILT LOAM (B)
CLAY (D)
CLAY LOAM (D)SANDY CLAY (D)
Figure B-2 Unit Basin Volume for 80% Capture - San Jose Airport Rain Gage
C.3 STORMWATER H ANDBOOK
Appendix B B-19
0.0
0.1
0.2
0.3
0.4
0.5
0.6
0.7
0.8
0.9
1.0
1.1
0% 10% 20% 30% 40% 50% 60% 70% 80% 90% 100%% Imperviousness
Un
it B
asin
Sto
rag
e fo
r 80
% C
aptu
re (
inch
)
PALO ALTO RAIN GAGE
ASSUMED SLOPE = 1%
LOAM/SILT LOAM (B)
CLAY (D)
CLAY LOAM (D)
SANDY CLAY (D)
Figure B-3 Unit Basin Volume for 80% Capture - Palo Alto Rain Gage
S ANT A CL AR A V ALLEY URB AN RUNOFF POLLUTION PREVENTION PROGRAM
Appendix B B-20
0.0
0.1
0.2
0.3
0.4
0.5
0.6
0.7
0.8
0.9
1.0
1.1
0% 10% 20% 30% 40% 50% 60% 70% 80% 90% 100%% Imperviousness
Un
it B
asin
Sto
rag
e fo
r 80
% C
ap
ture
(in
ch)
MORGAN HILL RAIN GAGEASSUMED SLOPE = 1%
SILT LOAM (B)
CLAY (D)
CLAY LOAM (D)
SANDY CLAY (D)
LOAM (B)
Figure B-4 Unit Basin Volume for 80% Capture - Morgan Hill Rain Gage
C.3 STORMWATER H ANDBOOK
Appendix B B-21
0.0
0.1
0.2
0.3
0.4
0.5
0.6
0.7
0.8
0.9
1.0
1.1
0% 10% 20% 30% 40% 50% 60% 70% 80% 90% 100%
% Imperviousness
Un
it B
as
in S
tora
ge
fo
r 8
0%
Ca
ptu
re (
inc
h)
SAN JOSE AIRPORT RAIN GAGEASSUMED SLOPE = 15%
LOAM/SILT LOAM (B)
CLAY (D)
CLAY LOAM (D)
SANDY CLAY (D)
Figure B-5 Unit Basin Volume for 80% Capture - San Jose Airport Rain Gage
S ANT A CL AR A V ALLEY URB AN RUNOFF POLLUTION PREVENTION PROGRAM
Appendix B B-22
0.0
0.1
0.2
0.3
0.4
0.5
0.6
0.7
0.8
0.9
1.0
1.1
0% 10% 20% 30% 40% 50% 60% 70% 80% 90% 100%% Imperviousness
Un
it B
as
in S
tora
ge
fo
r 8
0%
Ca
ptu
re (
inc
h)
PALO ALTO RAIN GAGEASSUMED SLOPE = 15%
LOAM/SILT LOAM (B)
CLAY (D)
CLAY LOAM (D)
SANDY CLAY (D)
Figure B-6 Unit Basin Volume for 80% Capture - Palo Alto Rain Gage
C.3 STORMWATER H ANDBOOK
Appendix B B-23
0.0
0.1
0.2
0.3
0.4
0.5
0.6
0.7
0.8
0.9
1.0
1.1
0% 10% 20% 30% 40% 50% 60% 70% 80% 90% 100%% Imperviousness
Un
it B
as
in S
tora
ge
fo
r 8
0%
Ca
ptu
re (
inc
h)
MORGAN HILL RAIN GAGEASSUMED SLOPE = 15%
SILT LOAM (B)
CLAY (D)
CLAY LOAM (D)
SANDY CLAY (D)
LOAM (B)
Figure B-7 Unit Basin Volume for 80% Capture - Morgan Hill Rain Gage
S ANT A CL AR A V ALLEY URB AN RUNOFF POLLUTION PREVENTION PROGRAM
Appendix B B-24
0.1
1
10
0.1 1 10Duration (hr)
Inte
nsi
ty (
in/h
r)
Haskins Ranch - 24.44 in/yr
Shanti Ashrama - 20.46 in/yr
Maryknoll - 16.74 in/yr
San Jose - 13.72 in/yr
Figure B-8 Intensity-Frequency-Duration Curves for a 50-Year Return Period for Haskins Ranch, Shanti
Ashrama, Maryknoll, and San Jose Airport Rain Gages
Haskins Ranch
San Jose Airport
Shanti Ashrama And Maryknoll
C .3 STORMWATER H ANDBOOK
Appendix B B-25
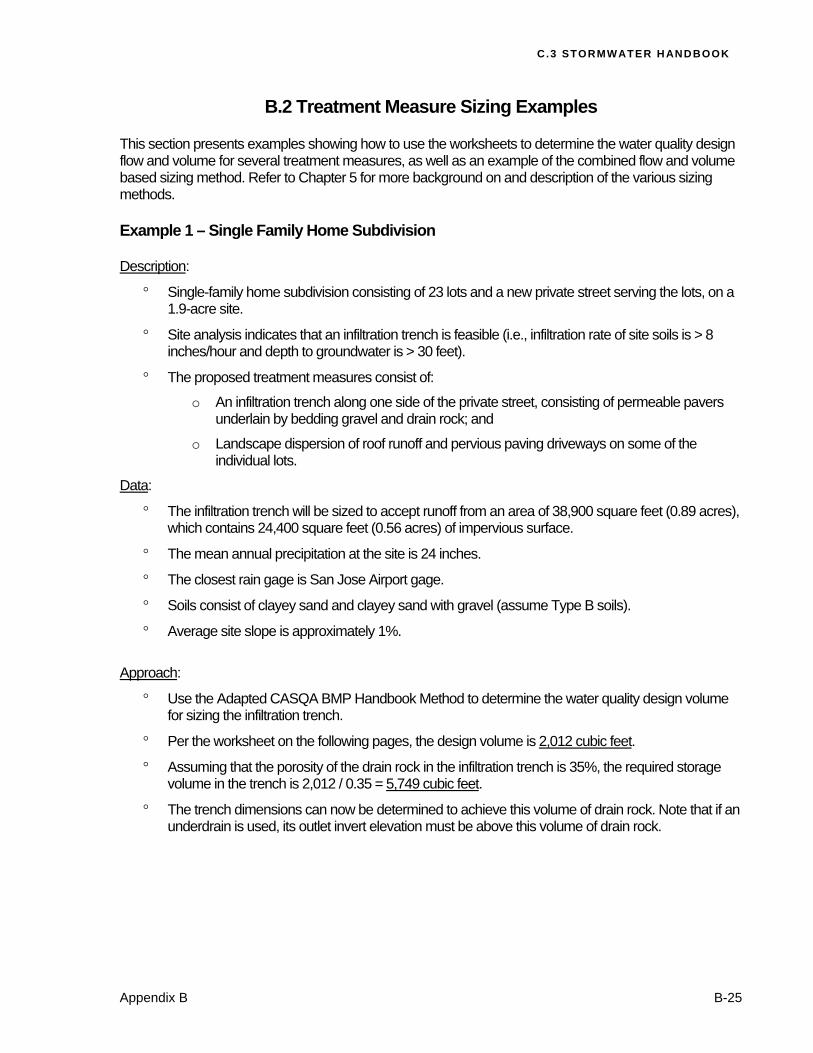
B.2 Treatment Measure Sizing Examples This section presents examples showing how to use the worksheets to determine the water quality design flow and volume for several treatment measures, as well as an example of the combined flow and volume based sizing method. Refer to Chapter 5 for more background on and description of the various sizing methods. Example 1 – Single Family Home Subdivision Description:
Single-family home subdivision consisting of 23 lots and a new private street serving the lots, on a 1.9-acre site.
Site analysis indicates that an infiltration trench is feasible (i.e., infiltration rate of site soils is > 8 inches/hour and depth to groundwater is > 30 feet).
The proposed treatment measures consist of:
o An infiltration trench along one side of the private street, consisting of permeable pavers underlain by bedding gravel and drain rock; and
o Landscape dispersion of roof runoff and pervious paving driveways on some of the individual lots.
Data:
The infiltration trench will be sized to accept runoff from an area of 38,900 square feet (0.89 acres), which contains 24,400 square feet (0.56 acres) of impervious surface.
The mean annual precipitation at the site is 24 inches.
The closest rain gage is San Jose Airport gage.
Soils consist of clayey sand and clayey sand with gravel (assume Type B soils).
Average site slope is approximately 1%.
Approach:
Use the Adapted CASQA BMP Handbook Method to determine the water quality design volume for sizing the infiltration trench.
Per the worksheet on the following pages, the design volume is 2,012 cubic feet.
Assuming that the porosity of the drain rock in the infiltration trench is 35%, the required storage volume in the trench is 2,012 / 0.35 = 5,749 cubic feet.
The trench dimensions can now be determined to achieve this volume of drain rock. Note that if an underdrain is used, its outlet invert elevation must be above this volume of drain rock.
S ANT A CL AR A V ALLEY URB AN RUNOFF POLLUTION PREVENTION PROGRAM
B-26 Appendix B
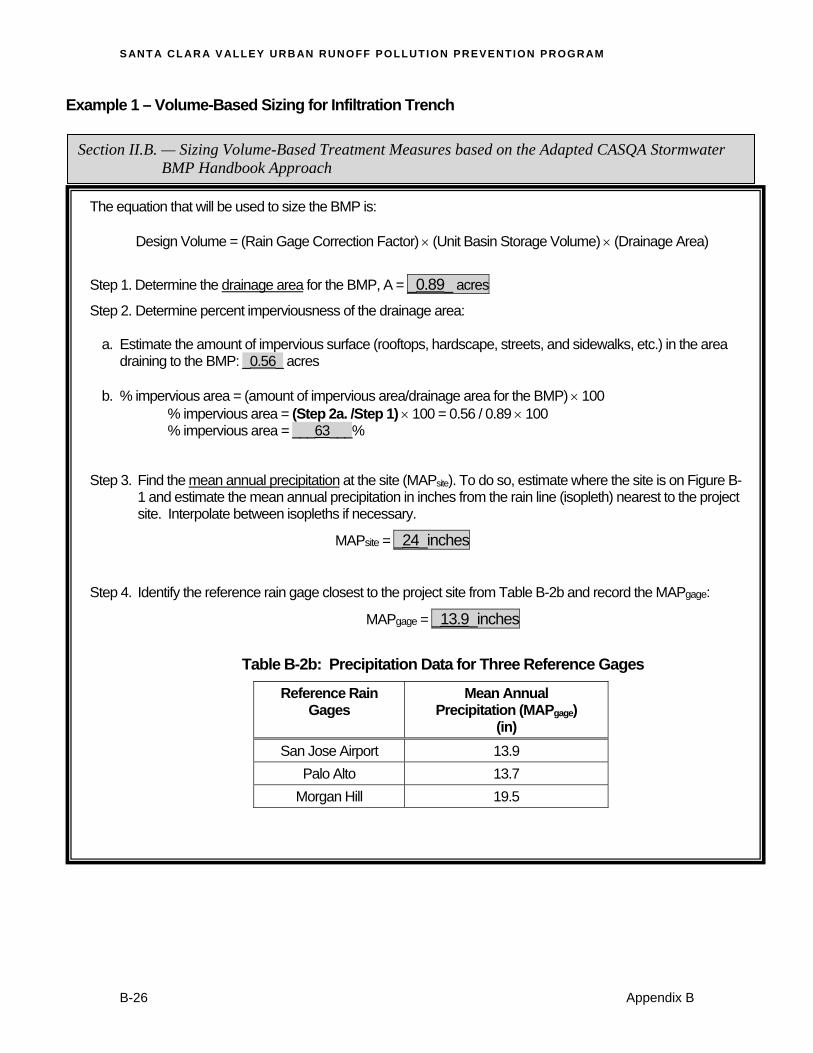
Example 1 – Volume-Based Sizing for Infiltration Trench
The equation that will be used to size the BMP is:
Design Volume = (Rain Gage Correction Factor) (Unit Basin Storage Volume) (Drainage Area)
Step 1. Determine the drainage area for the BMP, A = _0.89_ acres
Step 2. Determine percent imperviousness of the drainage area:
a. Estimate the amount of impervious surface (rooftops, hardscape, streets, and sidewalks, etc.) in the area draining to the BMP: _0.56_ acres
b. % impervious area = (amount of impervious area/drainage area for the BMP) 100
% impervious area = (Step 2a. /Step 1) 100 = 0.56 / 0.89 100 % impervious area = ___63___%
Step 3. Find the mean annual precipitation at the site (MAPsite). To do so, estimate where the site is on Figure B-1 and estimate the mean annual precipitation in inches from the rain line (isopleth) nearest to the project site. Interpolate between isopleths if necessary.
MAPsite = _24_inches
Step 4. Identify the reference rain gage closest to the project site from Table B-2b and record the MAPgage:
MAPgage = _13.9_inches
Table B-2b: Precipitation Data for Three Reference Gages
Reference Rain Gages
Mean Annual Precipitation (MAPgage)
(in)
San Jose Airport 13.9
Palo Alto 13.7
Morgan Hill 19.5
Section II.B. — Sizing Volume-Based Treatment Measures based on the Adapted CASQA Stormwater BMP Handbook Approach
C .3 STORMWATER H ANDBOOK
Appendix B B-27
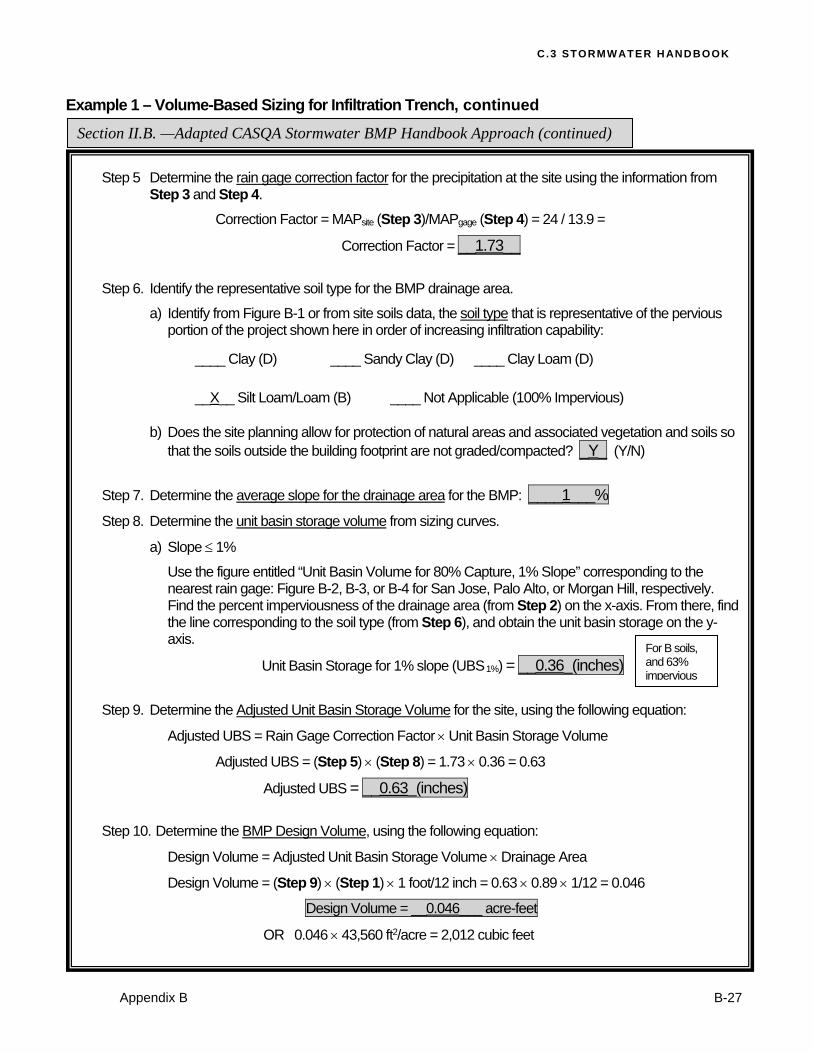
Example 1 – Volume-Based Sizing for Infiltration Trench, continued Step 5 Determine the rain gage correction factor for the precipitation at the site using the information from
Step 3 and Step 4.
Correction Factor = MAPsite (Step 3)/MAPgage (Step 4) = 24 / 13.9 =
Correction Factor = __1.73__
Step 6. Identify the representative soil type for the BMP drainage area.
a) Identify from Figure B-1 or from site soils data, the soil type that is representative of the pervious portion of the project shown here in order of increasing infiltration capability:
____ Clay (D) ____ Sandy Clay (D) ____ Clay Loam (D)
__X__ Silt Loam/Loam (B) ____ Not Applicable (100% Impervious)
b) Does the site planning allow for protection of natural areas and associated vegetation and soils so that the soils outside the building footprint are not graded/compacted? _Y_ (Y/N)
Step 7. Determine the average slope for the drainage area for the BMP: ____1___%
Step 8. Determine the unit basin storage volume from sizing curves.
a) Slope 1%
Use the figure entitled “Unit Basin Volume for 80% Capture, 1% Slope” corresponding to the nearest rain gage: Figure B-2, B-3, or B-4 for San Jose, Palo Alto, or Morgan Hill, respectively. Find the percent imperviousness of the drainage area (from Step 2) on the x-axis. From there, find the line corresponding to the soil type (from Step 6), and obtain the unit basin storage on the y-axis.
Unit Basin Storage for 1% slope (UBS 1%) = __0.36_(inches)
Step 9. Determine the Adjusted Unit Basin Storage Volume for the site, using the following equation:
Adjusted UBS = Rain Gage Correction Factor Unit Basin Storage Volume
Adjusted UBS = (Step 5) (Step 8) = 1.73 0.36 = 0.63
Adjusted UBS = __0.63_(inches)
Step 10. Determine the BMP Design Volume, using the following equation:
Design Volume = Adjusted Unit Basin Storage Volume Drainage Area
Design Volume = (Step 9) (Step 1) 1 foot/12 inch = 0.63 0.89 1/12 = 0.046
Design Volume = __0.046___ acre-feet
OR 0.046 43,560 ft2/acre = 2,012 cubic feet
Section II.B. —Adapted CASQA Stormwater BMP Handbook Approach (continued)
For B soils, and 63% impervious
S ANT A CL AR A V ALLEY URB AN RUNOFF POLLUTION PREVENTION PROGRAM
B-28 Appendix B
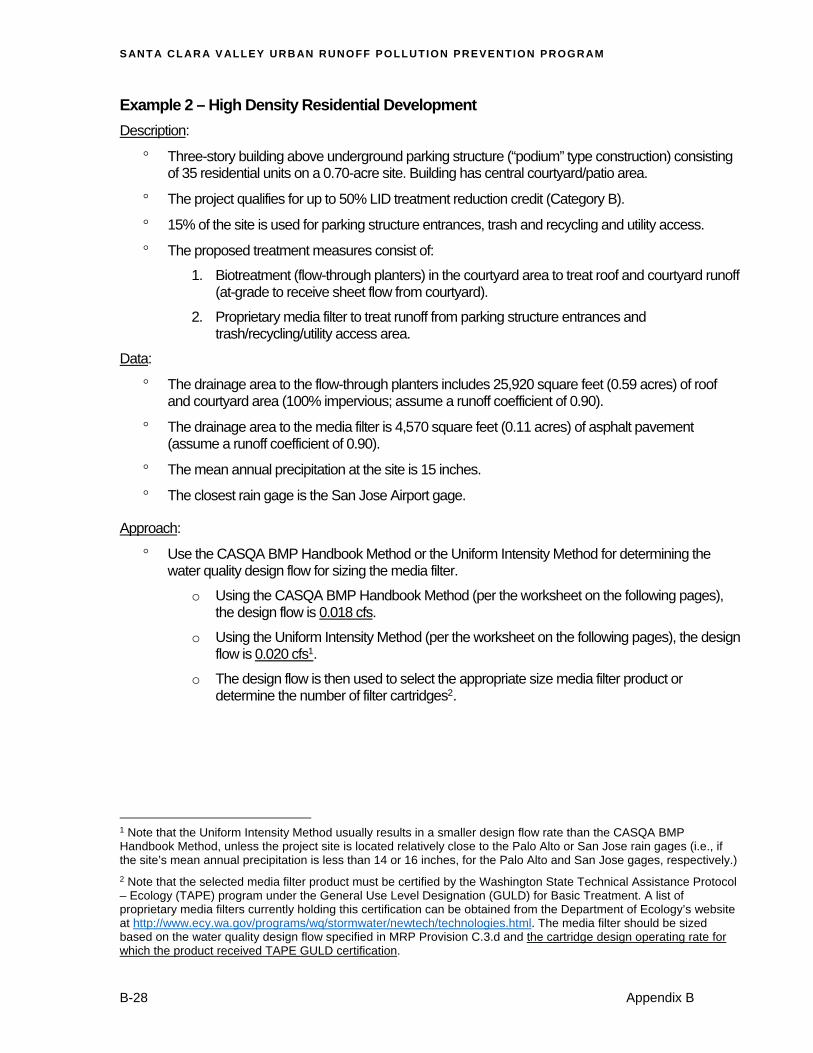
Example 2 – High Density Residential Development
Description:
Three-story building above underground parking structure (“podium” type construction) consisting of 35 residential units on a 0.70-acre site. Building has central courtyard/patio area.
The project qualifies for up to 50% LID treatment reduction credit (Category B).
15% of the site is used for parking structure entrances, trash and recycling and utility access.
The proposed treatment measures consist of:
1. Biotreatment (flow-through planters) in the courtyard area to treat roof and courtyard runoff (at-grade to receive sheet flow from courtyard).
2. Proprietary media filter to treat runoff from parking structure entrances and trash/recycling/utility access area.
Data:
The drainage area to the flow-through planters includes 25,920 square feet (0.59 acres) of roof and courtyard area (100% impervious; assume a runoff coefficient of 0.90).
The drainage area to the media filter is 4,570 square feet (0.11 acres) of asphalt pavement (assume a runoff coefficient of 0.90).
The mean annual precipitation at the site is 15 inches.
The closest rain gage is the San Jose Airport gage.
Approach:
Use the CASQA BMP Handbook Method or the Uniform Intensity Method for determining the water quality design flow for sizing the media filter.
o Using the CASQA BMP Handbook Method (per the worksheet on the following pages), the design flow is 0.018 cfs.
o Using the Uniform Intensity Method (per the worksheet on the following pages), the design flow is 0.020 cfs1.
o The design flow is then used to select the appropriate size media filter product or determine the number of filter cartridges2.
1 Note that the Uniform Intensity Method usually results in a smaller design flow rate than the CASQA BMP Handbook Method, unless the project site is located relatively close to the Palo Alto or San Jose rain gages (i.e., if the site’s mean annual precipitation is less than 14 or 16 inches, for the Palo Alto and San Jose gages, respectively.)
2 Note that the selected media filter product must be certified by the Washington State Technical Assistance Protocol – Ecology (TAPE) program under the General Use Level Designation (GULD) for Basic Treatment. A list of proprietary media filters currently holding this certification can be obtained from the Department of Ecology’s website at http://www.ecy.wa.gov/programs/wq/stormwater/newtech/technologies.html. The media filter should be sized based on the water quality design flow specified in MRP Provision C.3.d and the cartridge design operating rate for which the product received TAPE GULD certification.
C .3 STORMWATER H ANDBOOK
Appendix B B-29
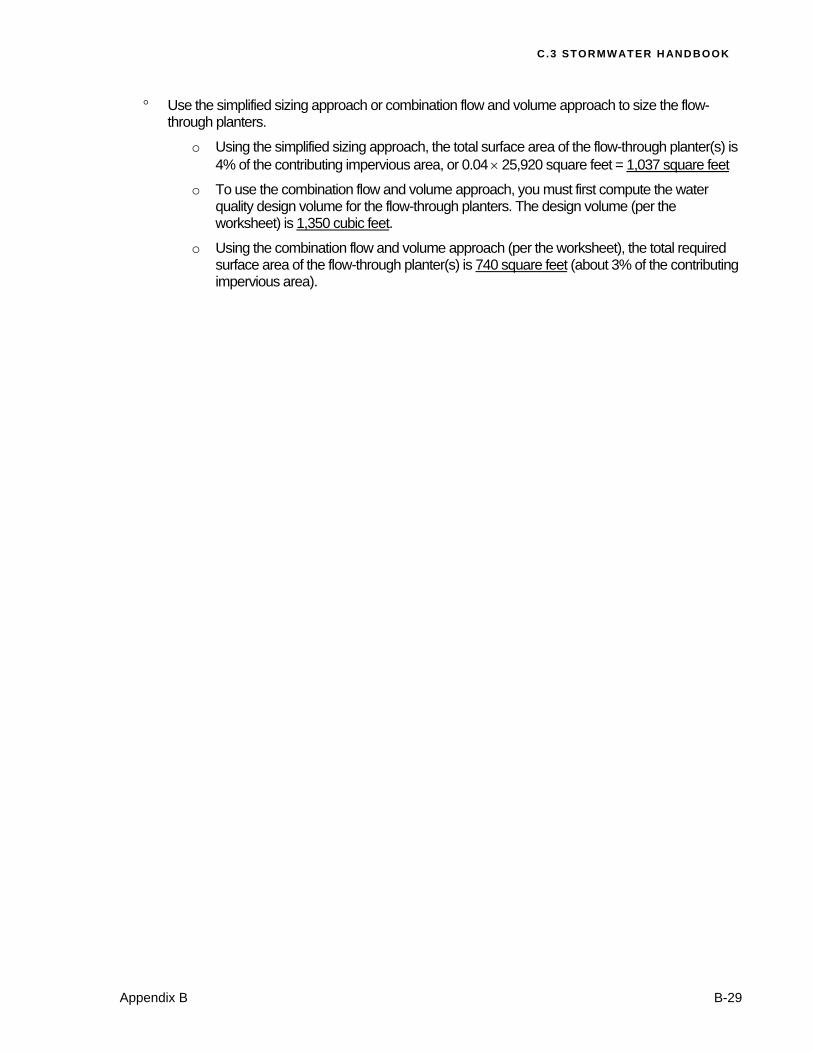
Use the simplified sizing approach or combination flow and volume approach to size the flow-through planters.
o Using the simplified sizing approach, the total surface area of the flow-through planter(s) is 4% of the contributing impervious area, or 0.04 25,920 square feet = 1,037 square feet
o To use the combination flow and volume approach, you must first compute the water quality design volume for the flow-through planters. The design volume (per the worksheet) is 1,350 cubic feet.
o Using the combination flow and volume approach (per the worksheet), the total required surface area of the flow-through planter(s) is 740 square feet (about 3% of the contributing impervious area).
S ANT A CL AR A V ALLEY URB AN RUNOFF POLLUTION PREVENTION PROGRAM
B-30 Appendix B
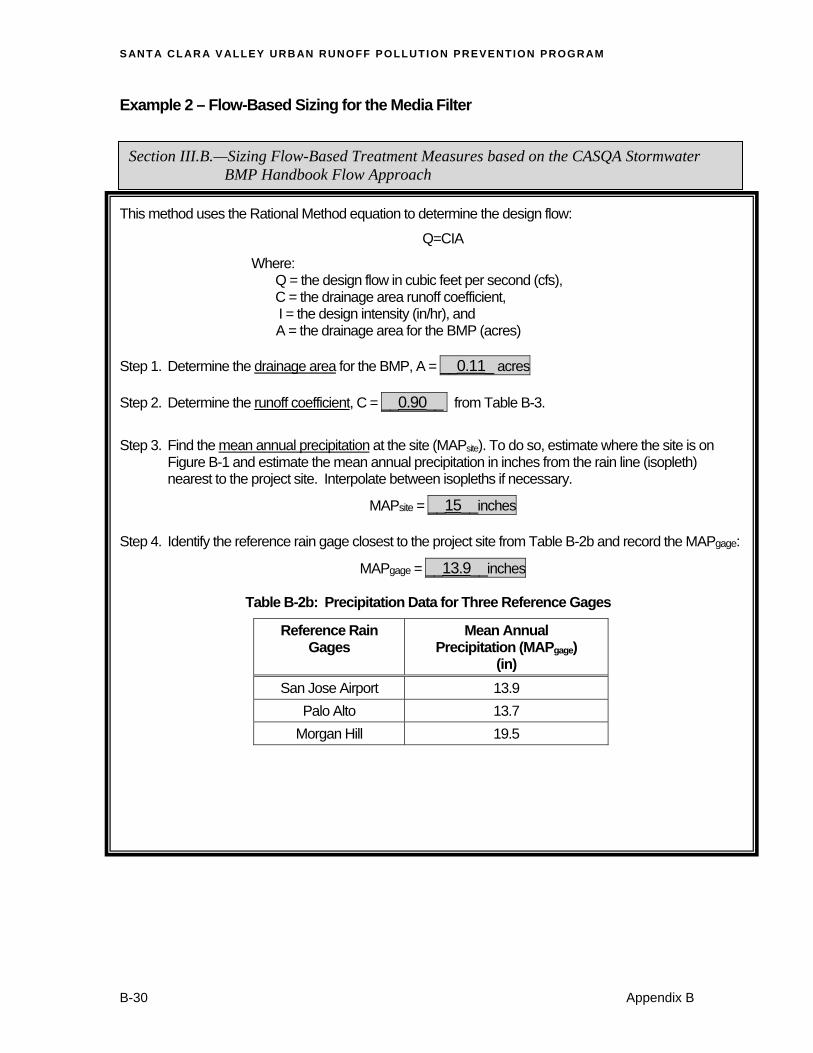
Example 2 – Flow-Based Sizing for the Media Filter
This method uses the Rational Method equation to determine the design flow:
Q=CIA
Where: Q = the design flow in cubic feet per second (cfs), C = the drainage area runoff coefficient, I = the design intensity (in/hr), and A = the drainage area for the BMP (acres)
Step 1. Determine the drainage area for the BMP, A = __0.11_ acres Step 2. Determine the runoff coefficient, C = __0.90__ from Table B-3.
Step 3. Find the mean annual precipitation at the site (MAPsite). To do so, estimate where the site is on
Figure B-1 and estimate the mean annual precipitation in inches from the rain line (isopleth) nearest to the project site. Interpolate between isopleths if necessary.
MAPsite = __15__inches Step 4. Identify the reference rain gage closest to the project site from Table B-2b and record the MAPgage:
MAPgage = __13.9__inches
Table B-2b: Precipitation Data for Three Reference Gages
Reference Rain Gages
Mean Annual Precipitation (MAPgage)
(in)
San Jose Airport 13.9
Palo Alto 13.7
Morgan Hill 19.5
Section III.B.—Sizing Flow-Based Treatment Measures based on the CASQA Stormwater BMP Handbook Flow Approach
C .3 STORMWATER H ANDBOOK
Appendix B B-31
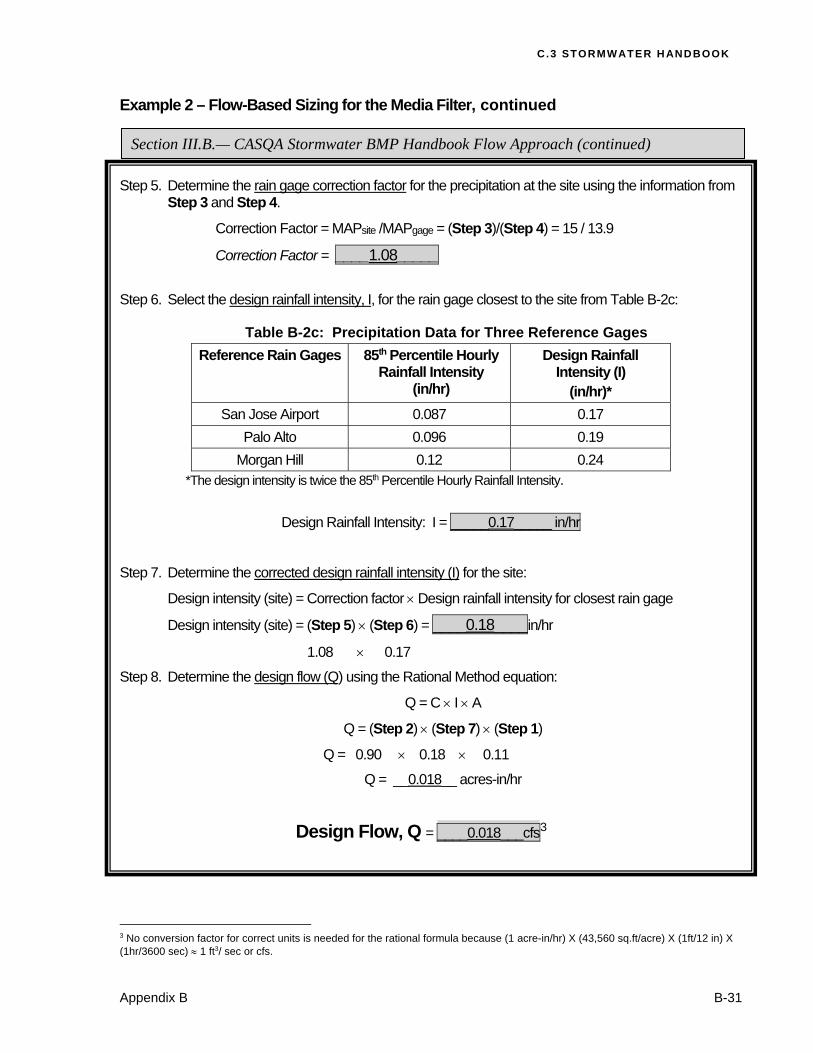
Example 2 – Flow-Based Sizing for the Media Filter, continued
Step 5. Determine the rain gage correction factor for the precipitation at the site using the information from Step 3 and Step 4.
Correction Factor = MAPsite /MAPgage = (Step 3)/(Step 4) = 15 / 13.9
Correction Factor = ____1.08_____
Step 6. Select the design rainfall intensity, I, for the rain gage closest to the site from Table B-2c:
Table B-2c: Precipitation Data for Three Reference Gages
Reference Rain Gages 85th Percentile Hourly Rainfall Intensity
(in/hr)
Design Rainfall Intensity (I)
(in/hr)*
San Jose Airport 0.087 0.17
Palo Alto 0.096 0.19
Morgan Hill 0.12 0.24 *The design intensity is twice the 85th Percentile Hourly Rainfall Intensity.
Design Rainfall Intensity: I = _____0.17_____ in/hr
Step 7. Determine the corrected design rainfall intensity (I) for the site:
Design intensity (site) = Correction factor Design rainfall intensity for closest rain gage
Design intensity (site) = (Step 5) (Step 6) = ____0.18____in/hr
1.08 0.17
Step 8. Determine the design flow (Q) using the Rational Method equation:
Q = C I A
Q = (Step 2) (Step 7) (Step 1)
Q = 0.90 0.18 0.11
Q = __0.018__ acres-in/hr
Design Flow, Q = ____0.018___cfs3
3 No conversion factor for correct units is needed for the rational formula because (1 acre-in/hr) X (43,560 sq.ft/acre) X (1ft/12 in) X (1hr/3600 sec) 1 ft3/ sec or cfs.
Section III.B.— CASQA Stormwater BMP Handbook Flow Approach (continued)
S ANT A CL AR A V ALLEY URB AN RUNOFF POLLUTION PREVENTION PROGRAM
B-32 Appendix B
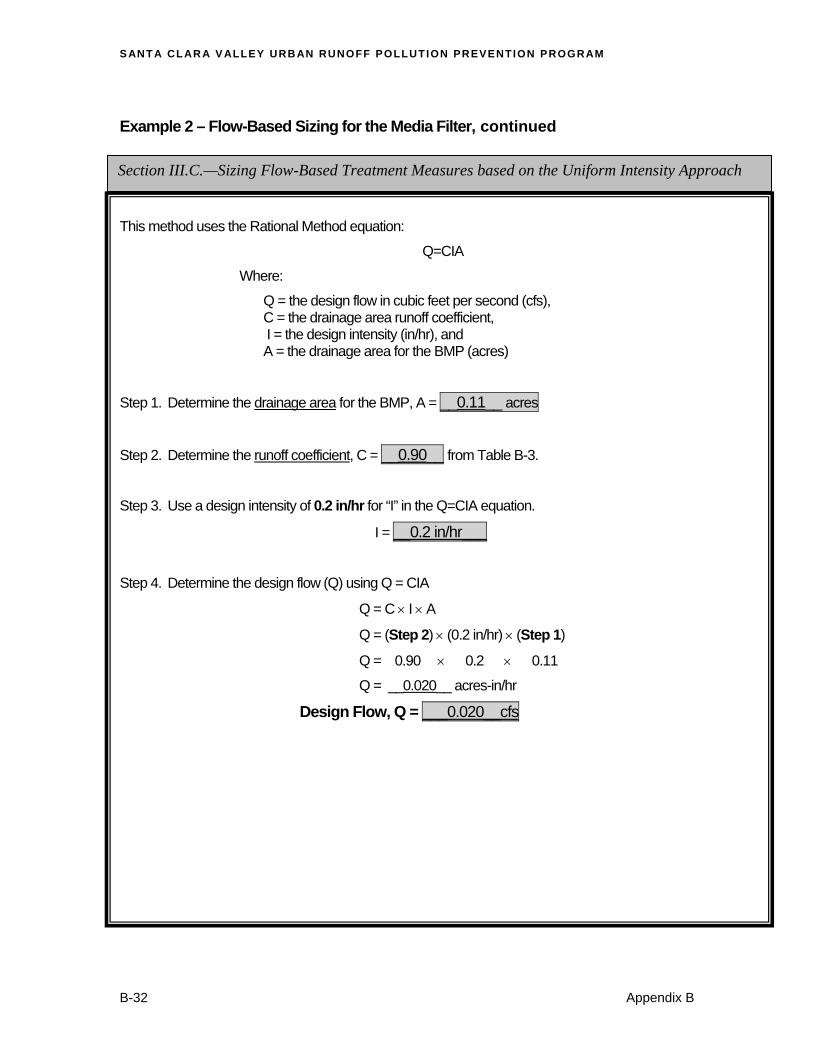
Example 2 – Flow-Based Sizing for the Media Filter, continued
This method uses the Rational Method equation:
Q=CIA
Where:
Q = the design flow in cubic feet per second (cfs), C = the drainage area runoff coefficient, I = the design intensity (in/hr), and A = the drainage area for the BMP (acres)
Step 1. Determine the drainage area for the BMP, A = __0.11__ acres
Step 2. Determine the runoff coefficient, C = __0.90__ from Table B-3.
Step 3. Use a design intensity of 0.2 in/hr for “I” in the Q=CIA equation.
I = __0.2 in/hr___
Step 4. Determine the design flow (Q) using Q = CIA
Q = C I A
Q = (Step 2) (0.2 in/hr) (Step 1)
Q = 0.90 0.2 0.11
Q = __0.020__ acres-in/hr
Design Flow, Q = ___0.020__cfs
Section III.C.—Sizing Flow-Based Treatment Measures based on the Uniform Intensity Approach
C .3 STORMWATER H ANDBOOK
Appendix B B-33
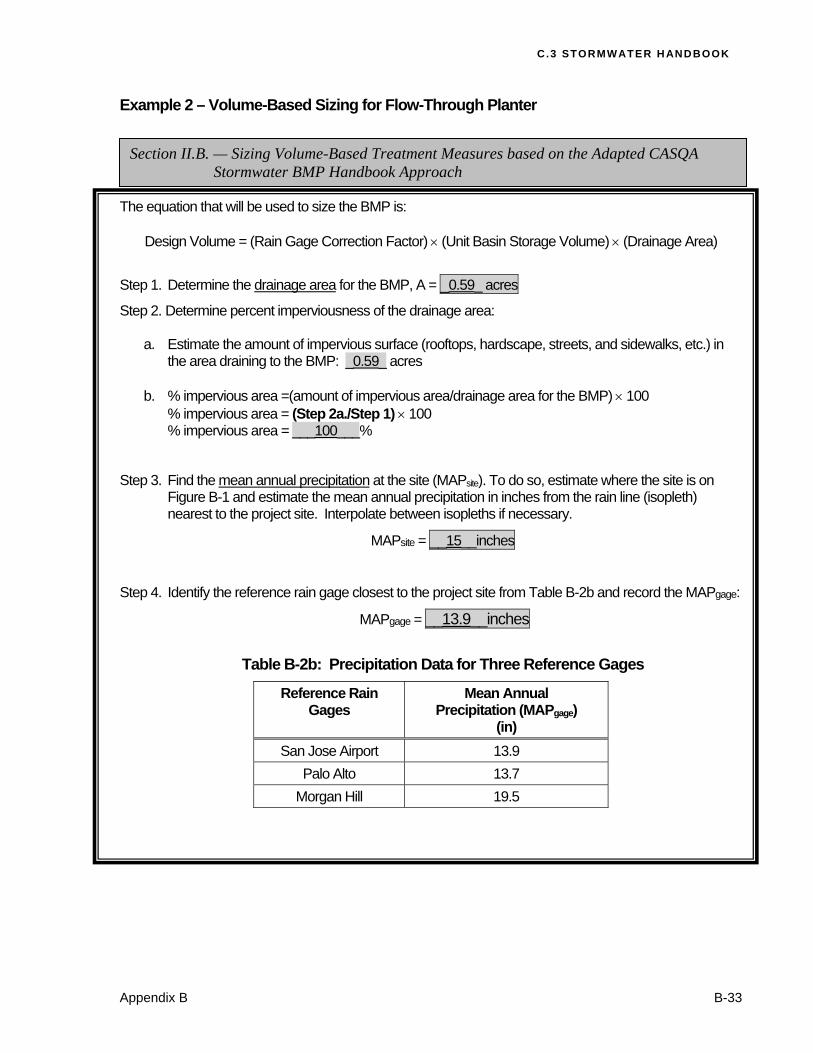
Example 2 – Volume-Based Sizing for Flow-Through Planter The equation that will be used to size the BMP is:
Design Volume = (Rain Gage Correction Factor) (Unit Basin Storage Volume) (Drainage Area)
Step 1. Determine the drainage area for the BMP, A = _0.59_ acres Step 2. Determine percent imperviousness of the drainage area:
a. Estimate the amount of impervious surface (rooftops, hardscape, streets, and sidewalks, etc.) in
the area draining to the BMP: _0.59_ acres b. % impervious area =(amount of impervious area/drainage area for the BMP) 100
% impervious area = (Step 2a./Step 1) 100 % impervious area = ___100___%
Step 3. Find the mean annual precipitation at the site (MAPsite). To do so, estimate where the site is on Figure B-1 and estimate the mean annual precipitation in inches from the rain line (isopleth) nearest to the project site. Interpolate between isopleths if necessary.
MAPsite = __15__inches
Step 4. Identify the reference rain gage closest to the project site from Table B-2b and record the MAPgage:
MAPgage = __13.9__inches
Table B-2b: Precipitation Data for Three Reference Gages
Reference Rain Gages
Mean Annual Precipitation (MAPgage)
(in)
San Jose Airport 13.9
Palo Alto 13.7
Morgan Hill 19.5
Section II.B. — Sizing Volume-Based Treatment Measures based on the Adapted CASQA Stormwater BMP Handbook Approach
S ANT A CL AR A V ALLEY URB AN RUNOFF POLLUTION PREVENTION PROGRAM
B-34 Appendix B
Example 2 – Volume-Based Sizing for Flow-Through Planter, continued Step 5 Determine the rain gage correction factor for the precipitation at the site using the information from
Step 3 and Step 4.
Correction Factor = MAPsite (Step 3)/MAPgage (Step 4) = 15 / 13.9 =
Correction Factor = ____1.08____
Step 6. Identify the representative soil type for the BMP drainage area.
c) Identify from Figure B-1 or from site soils data, the soil type that is representative of the pervious portion of the project shown here in order of increasing infiltration capability:
____ Clay (D) ____ Sandy Clay (D) ____ Clay Loam (D)
____ Silt Loam/Loam (B) __X__ Not Applicable (100% Impervious)
d) Does the site planning allow for protection of natural areas and associated vegetation and soils so that the soils outside the building footprint are not graded/compacted? __ (Y/N)
Step 7. Determine the average slope for the drainage area for the BMP: ____1___%
Step 8. Determine the unit basin storage volume from sizing curves.
b) Slope 1%
Use the figure entitled “Unit Basin Volume for 80% Capture, 1% Slope” corresponding to the nearest rain gage: Figure B-2, B-3, or B-4 for San Jose, Palo Alto, or Morgan Hill, respectively. Find the percent imperviousness of the drainage area (see answer to Step 2, above) on the x-axis. From there, find the line corresponding to the soil type (from Step 6), and obtain the unit basin storage on the y-axis.
Unit Basin Storage for 1% slope (UBS 1% ) =____0.58___(inches)
Step 9. Determine the Adjusted Unit Basin Storage Volume, using the following equation:
Adjusted UBS = Rain Gage Correction Factor Unit Basin Storage Volume
Adjusted UBS = (Step 5) (Step 8) = 1.08 0.58 = 0.63
Adjusted UBS = __0.63_(inches)
Step 10. Determine the BMP Design Volume, using the following equation:
Design Volume = Adjusted Unit Basin Storage Volume Drainage Area
Design Volume = (Step 9) (Step 1) 1 foot/12 inch = 0.63 0.59 1/12 =
Design Volume = __0.031___ acre-feet
OR 0.031 43,560 ft2/acre = 1,350 cubic feet
Section II.B. —Adapted CASQA Stormwater BMP Handbook Approach (continued)
C .3 STORMWATER H ANDBOOK
Appendix B B-35
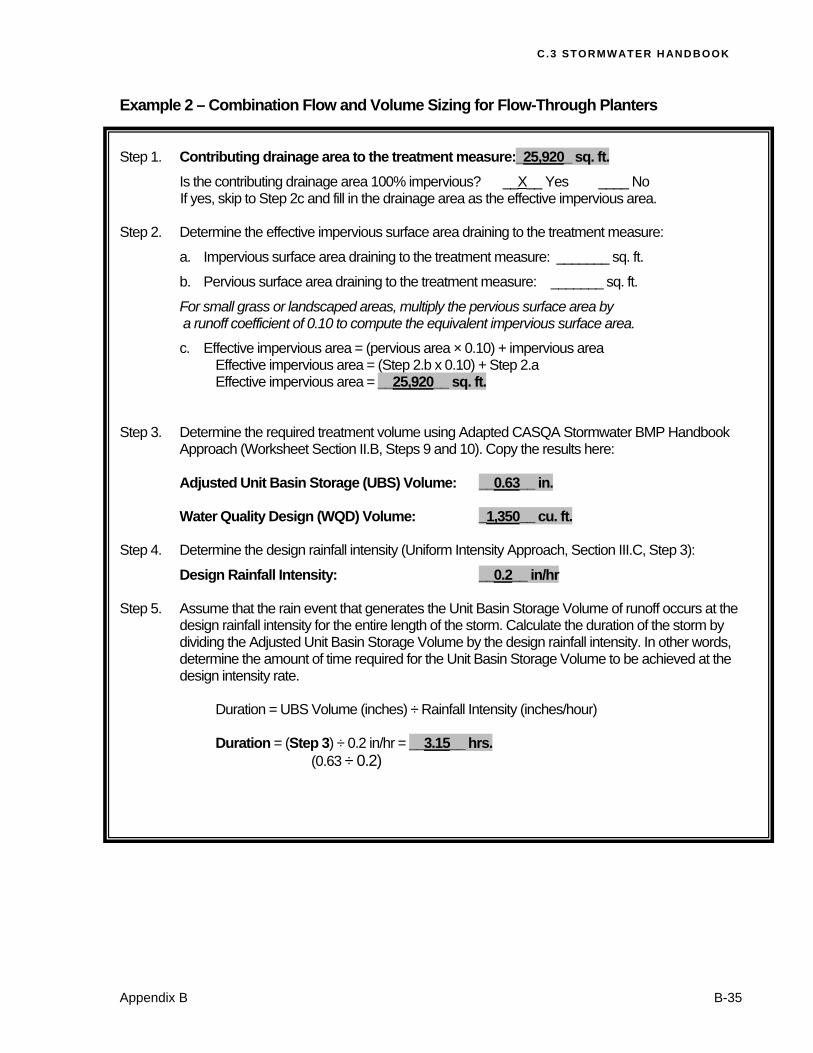
Example 2 – Combination Flow and Volume Sizing for Flow-Through Planters
Step 1. Contributing drainage area to the treatment measure:_25,920_ sq. ft.
Is the contributing drainage area 100% impervious? __X__ Yes ____ No If yes, skip to Step 2c and fill in the drainage area as the effective impervious area.
Step 2. Determine the effective impervious surface area draining to the treatment measure:
a. Impervious surface area draining to the treatment measure: _______ sq. ft.
b. Pervious surface area draining to the treatment measure: _______ sq. ft.
For small grass or landscaped areas, multiply the pervious surface area by a runoff coefficient of 0.10 to compute the equivalent impervious surface area.
c. Effective impervious area = (pervious area × 0.10) + impervious area Effective impervious area = (Step 2.b x 0.10) + Step 2.a Effective impervious area = __25,920__ sq. ft. Step 3. Determine the required treatment volume using Adapted CASQA Stormwater BMP Handbook
Approach (Worksheet Section II.B, Steps 9 and 10). Copy the results here: Adjusted Unit Basin Storage (UBS) Volume: __0.63__ in. Water Quality Design (WQD) Volume: _1,350__ cu. ft. Step 4. Determine the design rainfall intensity (Uniform Intensity Approach, Section III.C, Step 3):
Design Rainfall Intensity: __0.2__ in/hr Step 5. Assume that the rain event that generates the Unit Basin Storage Volume of runoff occurs at the
design rainfall intensity for the entire length of the storm. Calculate the duration of the storm by dividing the Adjusted Unit Basin Storage Volume by the design rainfall intensity. In other words, determine the amount of time required for the Unit Basin Storage Volume to be achieved at the design intensity rate.
Duration = UBS Volume (inches) ÷ Rainfall Intensity (inches/hour) Duration = (Step 3) ÷ 0.2 in/hr = __3.15__ hrs. (0.63 ÷ 0.2)
S ANT A CL AR A V ALLEY URB AN RUNOFF POLLUTION PREVENTION PROGRAM
B-36 Appendix B
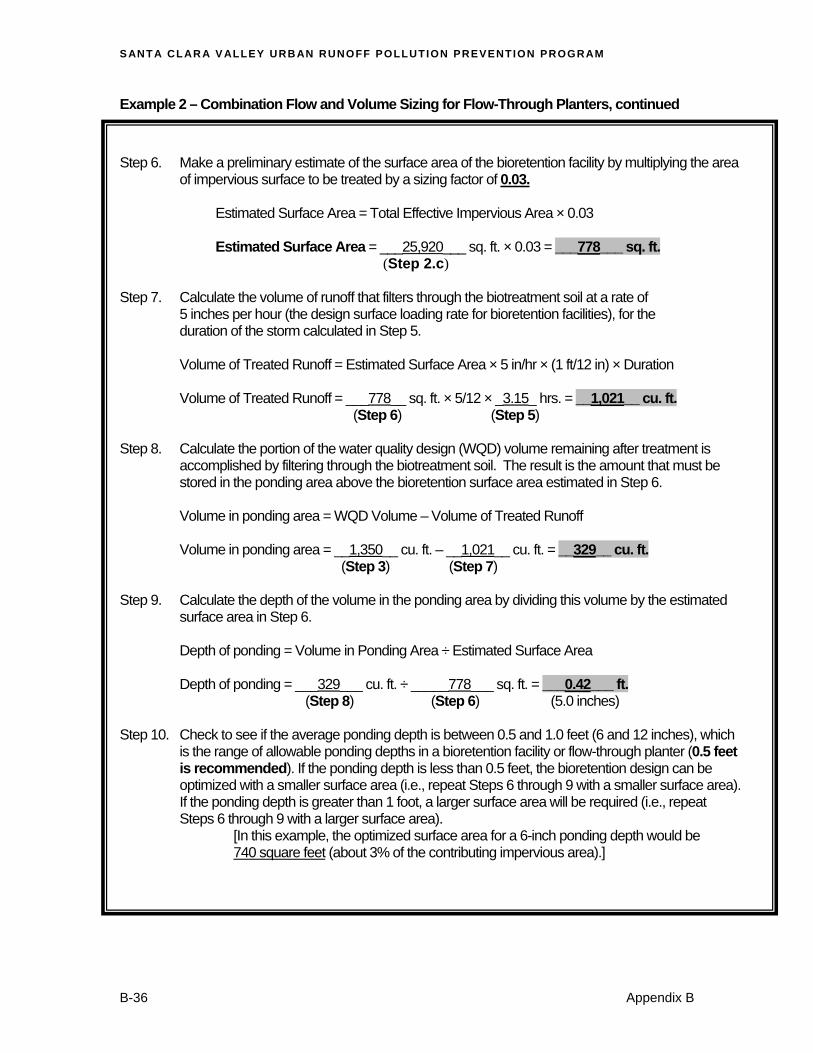
Example 2 – Combination Flow and Volume Sizing for Flow-Through Planters, continued
Step 6. Make a preliminary estimate of the surface area of the bioretention facility by multiplying the area
of impervious surface to be treated by a sizing factor of 0.03. Estimated Surface Area = Total Effective Impervious Area × 0.03 Estimated Surface Area = ___25,920___ sq. ft. × 0.03 = ___778___ sq. ft. (Step 2.c) Step 7. Calculate the volume of runoff that filters through the biotreatment soil at a rate of
5 inches per hour (the design surface loading rate for bioretention facilities), for the duration of the storm calculated in Step 5.
Volume of Treated Runoff = Estimated Surface Area × 5 in/hr × (1 ft/12 in) × Duration Volume of Treated Runoff = ___778__ sq. ft. × 5/12 × _3.15_ hrs. = __1,021__ cu. ft.
(Step 6) (Step 5) Step 8. Calculate the portion of the water quality design (WQD) volume remaining after treatment is
accomplished by filtering through the biotreatment soil. The result is the amount that must be stored in the ponding area above the bioretention surface area estimated in Step 6.
Volume in ponding area = WQD Volume – Volume of Treated Runoff Volume in ponding area = __1,350__ cu. ft. – __1,021__ cu. ft. = __329__ cu. ft. (Step 3) (Step 7) Step 9. Calculate the depth of the volume in the ponding area by dividing this volume by the estimated
surface area in Step 6. Depth of ponding = Volume in Ponding Area ÷ Estimated Surface Area Depth of ponding = ___329___ cu. ft. ÷ _____778___ sq. ft. = ___0.42___ ft. (Step 8) (Step 6) (5.0 inches) Step 10. Check to see if the average ponding depth is between 0.5 and 1.0 feet (6 and 12 inches), which
is the range of allowable ponding depths in a bioretention facility or flow-through planter (0.5 feet is recommended). If the ponding depth is less than 0.5 feet, the bioretention design can be optimized with a smaller surface area (i.e., repeat Steps 6 through 9 with a smaller surface area). If the ponding depth is greater than 1 foot, a larger surface area will be required (i.e., repeat Steps 6 through 9 with a larger surface area).
[In this example, the optimized surface area for a 6-inch ponding depth would be 740 square feet (about 3% of the contributing impervious area).]
C .3 STORMWATER H ANDBOOK
Appendix B B-37
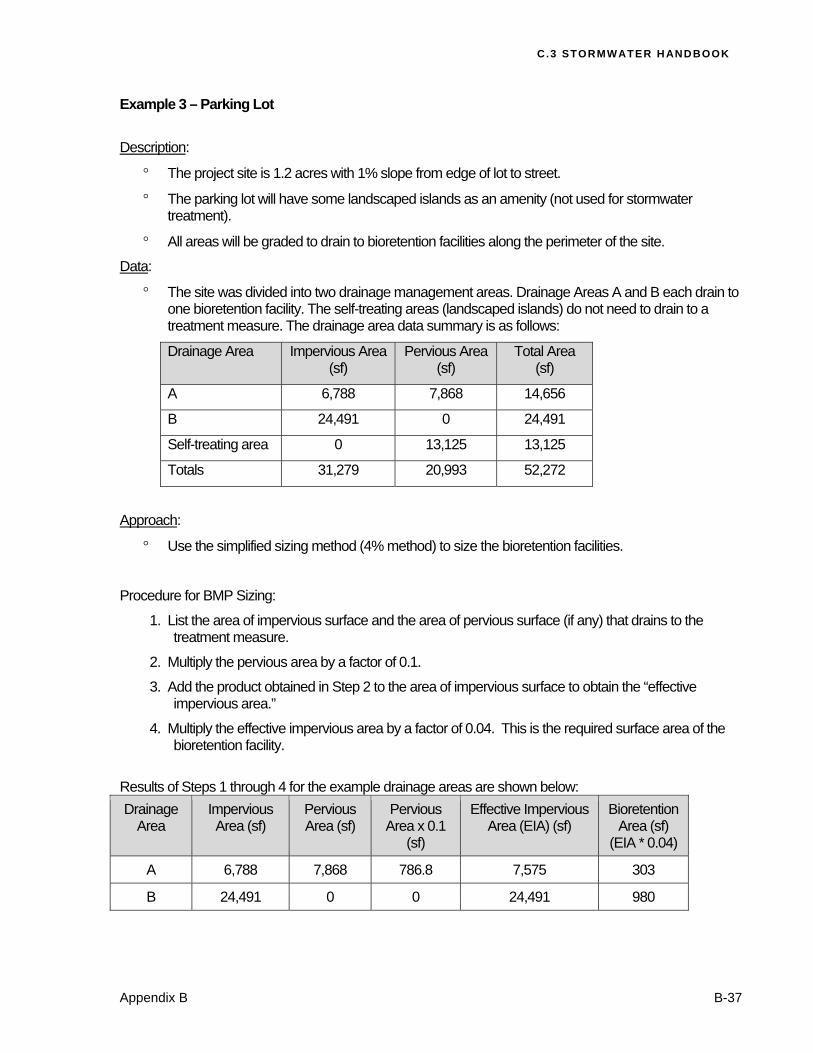
Example 3 – Parking Lot
Description:
The project site is 1.2 acres with 1% slope from edge of lot to street.
The parking lot will have some landscaped islands as an amenity (not used for stormwater treatment).
All areas will be graded to drain to bioretention facilities along the perimeter of the site.
Data:
The site was divided into two drainage management areas. Drainage Areas A and B each drain to one bioretention facility. The self-treating areas (landscaped islands) do not need to drain to a treatment measure. The drainage area data summary is as follows:
Drainage Area Impervious Area (sf)
Pervious Area (sf)
Total Area (sf)
A 6,788 7,868 14,656
B 24,491 0 24,491
Self-treating area 0 13,125 13,125
Totals 31,279 20,993 52,272
Approach:
Use the simplified sizing method (4% method) to size the bioretention facilities.
Procedure for BMP Sizing:
1. List the area of impervious surface and the area of pervious surface (if any) that drains to the treatment measure.
2. Multiply the pervious area by a factor of 0.1.
3. Add the product obtained in Step 2 to the area of impervious surface to obtain the “effective impervious area.”
4. Multiply the effective impervious area by a factor of 0.04. This is the required surface area of the bioretention facility.
Results of Steps 1 through 4 for the example drainage areas are shown below:
Drainage Area
Impervious Area (sf)
Pervious Area (sf)
Pervious Area x 0.1
(sf)
Effective Impervious Area (EIA) (sf)
Bioretention Area (sf)
(EIA * 0.04)
A 6,788 7,868 786.8 7,575 303
B 24,491 0 0 24,491 980


![[XLS]thesolarplanner.comthesolarplanner.com/worksheets/wire_sizing.xls · Web viewWire Sizing & Voltage Drop For an inverter 3800 watts or less, your breakers will be 15-20 amps on](https://img.pdfslide.net/doc/110x75/5aed98ce7f8b9ab24d91ba7b/xls-viewwire-sizing-voltage-drop-for-an-inverter-3800-watts-or-less-your-breakers.jpg)