Embed Size (px)
Citation preview

Sizing of partially closed surface-breaking microcracks with broadbandRayleigh waves
Alexey M. Lomonosov,1,2 Peter V. Grigoriev,2 and Peter Hess1,a�
1Institute of Physical Chemistry, University of Heidelberg, Im Neuenheimer Feld 253, D-69120 Heidelberg,Germany2General Physics Institute, 38, Vavilov Street, 119991 Moscow, Russia
�Received 7 August 2008; accepted 1 March 2009; published online 23 April 2009�
Sizing of cracks in the range of tens of micrometers by laser-generated surface acoustic wave �SAW�pulses with a bandwidth of up to 200 MHz is reported. The radius of a semicircular surface-breakingcrack was evaluated using two methods, one based on the experimentally measured reflectioncoefficient and the other on the frequency dependence of the phase lag of the transmitted wave.These quantities were also simulated numerically by means of the finite differences method andfitted to the experimental ones by varying the assumed size of the crack. In both cases the interactionbetween crack faces was taken into account by an effective interfacial stiffness parameter and thecrack sizes obtained acoustically were compared with those measured by optical microscopy.Nondestructive evaluation was extended to the characterization of real microcracks in the range oftens of micrometers with the laser-based pump-probe technique. The microcracks studied weregenerated in fused silica by strongly nonlinear SAW pulses with shocks in a separate experiment.© 2009 American Institute of Physics. �DOI: 10.1063/1.3110885�
I. INTRODUCTION
Since their invention in 1960, lasers emerged as versatiletools for the generation and detection of ultrasonic bulk andsurface waves, opening the way to widespread technicalapplications.1–3 Linear laser ultrasound has been already ap-plied for several decades in various technological fields, in-cluding nondestructive evaluation and medical imaging.
Surface acoustic waves �SAWs� offer substantial advan-tages in the investigation of surface cracks due to their pro-nounced inhomogeneity in depth. This feature results in afrequency dependence of scattering characteristics, whichhas been widely used for the evaluation of crack sizes.4–15
Reflections of short SAW pulses from crack edges possesstime delays depending on the crack depth. This effect hasbeen used for the evaluation of machined notches with adepth in the millimeter range.9 Another approach employedexcitation of cracks at resonant frequencies and providedgood estimates of both their depth and extension along thesurface.15 In this case the reflection of SAWs from variousnotches has been measured in the range of 3–6.5 MHz andthe frequency dependence exhibited multiple peaks associ-ated with length and depth resonances. In these experimentsthe length of the artificial notches has been varied between6.6 and 23 mm and the depth between 2 and 6 mm.15
In real cracks the faces are often in �partial� contact witheach other or even subjected to closure stress within the plas-tically deformed zone.16 Reflection of sound from such acrack is significantly diminished. Therefore, external tensilestress has been applied �dynamic16 or static17� to the crack tomake it detectable. Dynamic load could be implemented bymeans of low-frequency stress variations, which modulatethe crack opening and hence its reflectivity and transmit-
tance. The nonlinear character of the contact between crackfaces accounts for the nonlinear interaction between twosound waves with different frequencies and the generation ofsound at mixed frequencies.18
In this work we evaluate real cracks with contacting sur-faces, but without applying an external load for opening thecrack. The crack was probed by small-amplitude short SAWpulses with a maximum strain in the probe pulse of �10−4,generated in the thermoelastic regime by laser irradiation.The typical stress associated with such a probe pulse is con-fined to several megapascals, which is far below the stress ofseveral hundred megapascals, normally used to modify crackproperties.16
Most of the reported reflectance and transmittance ex-periments have been performed on artificial cracks, i.e., ma-chined slots. The high-frequency limit of the probing SAWpulse determines the minimal size of a crack that can bestudied by the detection method. In recent state-of-the-artscattering and diffraction experiments with SAWs, per-formed with a central frequency of 5 MHz and bandwidth upto 15 MHz, artificial slots with sizes in the millimeter rangehave been gauged, using the arrival times of the transmittedand reflected pulses.9
All-optical laser-based scattering experiments of linearSAWs by surface-breaking cracks, using pulsed lasers forSAW excitation and laser interferometry as probe for thepropagating SAW pulse, have a long tradition.1,6,8,9,19,20 Thebroadband SAW pulses launched with short laser pulses canbe monitored by several optical techniques.21
Detectability and spatial resolution of crack detection aredetermined by the characteristic wavelength range of theprobing SAW pulse. In the work described here the fre-quency range of the gauging Rayleigh wave pulses was ex-tended to about 200 MHz, which allows the evaluation ofa�Electronic mail: [email protected].
JOURNAL OF APPLIED PHYSICS 105, 084906 �2009�
0021-8979/2009/105�8�/084906/7/$25.00 © 2009 American Institute of Physics105, 084906-1
Downloaded 15 Feb 2010 to 147.142.186.54. Redistribution subject to AIP license or copyright; see http://jap.aip.org/jap/copyright.jsp

cracks in the region of tens of micrometers. The presentanalysis was applied to intrinsic microcracks introducedseparately into the silica specimen by launching a nonlinearSAW pulse with a strain of 10−3–10−2, reaching the criticalstrength of the material. To some extent, such microcracksare similar to those generated by fatigue loading or by ther-mal gradients. In contrast with machined slots, widely stud-ied in the literature, the faces of such cracks may not becompletely separated and considerable transient interactionsmay occur between the partially contacting faces during thepassage of the SAW pulse, especially near the tip region. Ofcourse, such a situation changes the reflection and transmis-sion of SAW pulses by the crack significantly. In the follow-ing, the mutual interaction of touching crack faces is takeninto account by a single-parameter model. This model intro-duces an effective interfacial stiffness into the simulation ofSAW scattering and the evaluation of the crack size.
II. EXPERIMENTAL
The investigated microcrack was generated by exciting ashort nonlinear SAW pulse in isotropic fused silica by ab-sorbing a nanosecond laser pulse in a thin, highly absorbingink layer deposited on the silica surface at the excitationregion, as previously described in detail.22,23 Owing to theelastic nonlinearity of silica the stress of the propagatingSAW pulse increased with propagation distance until the ma-terial broke. The tensile portion of the pulse had a duration of��10 ns with a peak stress in the gigapascal range. In thesimplest case, dynamic fracture is nucleated at a single pointat the surface with a peak stress in the gigapascal range andpropagates radially with isotropic velocity agreeing roughlywith the Rayleigh velocity CR of the material. Therefore, acrack of semicircular shape �a so-called halfpenny crack�with a radius of several tens of micrometers �r��CR� isexpected to be formed. In reality, cracks often have a moresophisticated shape, especially close to the source of the non-linear SAW pulse.23 This is due to the strong inhomogene-ities of the stress field in depth and the transient nature ofSAWs, propagating with high speed. At larger distances fromthe source, however, where the shock fronts become nar-rower, cracks take a halfpenny shape. Such a crack orientednormal to the surface of the sample was studied here �seeFig. 1�.
The process of crack formation in isotropic matter in-volves two antisymmetric periods, with tensile loading com-ing first, followed by a compression part, both with compa-rable magnitude and duration.23 Consequently, the nucleatedcrack is first opened for a few nanoseconds and then closedby intense compression forces, so that the two faces of thecrack match one another quite well. As a result, certain heal-ing effects occur and the interaction between the fracturefaces may be restored to some extent. Fatigue microcracks orcracks generated by temperature gradients in brittle solids areexpected to exhibit such a behavior if their faces are notcompletely separated. The appearance of interaction affectsthe scattering characteristics, in particular, the shapes of re-flected and transmitted SAW pulses, as was clearly observedin the results presented here.
Scattering of a linear broadband SAW pulse by an iso-lated real crack was investigated. The probe SAW pulse wasexcited with the 1 ns pulse of a neodymium-doped yttriumaluminum garnet �Nd:YAG� laser at 1064 nm in the ther-moelastic regime. The strain in thermoelastically generatedSAWs does not exceed 10−4, which is insufficient to observeany noticeable nonlinear effects in real microcracks. As aresult of the special experimental configuration selected,wave propagation could be considered a two-dimensional�2D� process �see Fig. 2�. The plane SAW had a wave frontparallel to the crack and both the transmitted and reflectedsurface waves were measured on the axis of mirror symme-try. All displacement components and their gradients parallelto the x2-axis vanish in this case.
For SAW detection we used the probe-beam-deflection�PBD� method, employing a cw Nd:YAG laser with�40 mW power operating at 532 nm. The overall frequencyrange of 10–200 MHz of the setup corresponds to SAWwavelengths of about 17–340 �m. The position and dis-tance between source line and probe spot were kept constantat 380 �m, while the sample with the crack was scannedalong the x1-axis. Initially, the crack was outside the pump-probe area, then it was moved toward the probe spot, acrossit, and on until it reached the source line, and finally furtheron by �300 �m. Altogether the sample was translated in200 steps, each of 5 �m length. The waveform was aver-aged over 200 laser shots at each step. The amorphous silicasample with the microcrack was coated with a 200 nm alu-minum film to enhance both the reflectivity of the probe-laser beam and the absorption of the pump-laser radiation.Introducing a coating usually results in frequency dispersionof surface waves, but this effect was infinitesimally small inthis case due to the short source-to-probe distance of
FIG. 1. �Color online� Microscopic top-view image of the microcrack gen-erated on the sample surface with a strongly nonlinear SAW pulse withshocks.
laser source
probecrack
sample s
can
x3
x1
x2
FIG. 2. Experimental arrangement of SAW source, probe spot, and crack.Other configurations were realized by moving the sample with respect to thefixed optical pump-probe setup until the crack passed the source.
084906-2 Lomonosov, Grigoriev, and Hess J. Appl. Phys. 105, 084906 �2009�
Downloaded 15 Feb 2010 to 147.142.186.54. Redistribution subject to AIP license or copyright; see http://jap.aip.org/jap/copyright.jsp

380 �m. Moreover, dimensionless frequency-dependent re-flection or transmission coefficients are independent of anykind of linear distortions such as dispersion.
III. RESULTS AND DISCUSSION
A. Overview: Scattering and mode conversion ofsurface and bulk waves
Figure 3 displays the outcome of a complete scan acrossa selected microcrack in which the sample was moved withrespect to the optical pump-probe arrangement with fixeddistance between the pulsed-pump and continuous-wave-probe lasers. The abscissa denotes the crack location withrespect to the starting point. At x1=300 �m the crack over-lapped with the probe spot and at �680 �m it reached thesource of the SAW pulses. The grayscale denotes the detectorsignal, which is proportional to the surface slope parallel tothe x1-axis. Each vertical cross section in Fig. 3 is a regis-tered waveform. Every wave traveling directly from thesource to the probe is represented by a horizontal trace in thetime-distance plot, due to the fixed separation of the sourceand probe. On the other hand, surface waves reflected ormode-converted to bulk waves at the crack are depicted byinclined signal traces, since their propagation time ischanged with the movement of the sample.
According to the actual position of the crack with re-spect to the source and probe with fixed separation, threezones or configurations can be distinguished. In the first one,0�x1�300 �m, the crack was situated outside the pump-probe area approaching the probe spot, so that directly trans-mitted undistorted Rayleigh waves were recorded, whichwere not influenced by the crack and movement of thesample. First the longitudinal wave arrived after �12 ns,followed by the Rayleigh wave after �60 ns. Aside fromthese two, various waves reflected backward from the crackcould be observed, the reflected longitudinal wave �L�, themode-converted longitudinal-to-shear wave �S�, and the re-flected Rayleigh wave �R�. In the second zone, with300 �m�x1�680 �m, the crack was located between the
source line and probe spot. Here the two horizontal traces ofthe transmitted longitudinal and Rayleigh waves were de-tected, and in addition, two waves generated at the crack as aresult of conversion of a longitudinal wave into a Rayleighwave �L→R� and into a shear wave �L→S�. In the thirdzone, defined by x1�680 �m, the crack was again outsidethe pump-probe area but this time on the side of the source,so undisturbed longitudinal and Rayleigh waves, back-reflected longitudinal and Rayleigh waves, and shear waves�S� resulting from mode conversion of the SAW at the crackwere registered. The two vague horizontal traces at 80 and130 ns are reflections of the longitudinal wave from the bot-tom surface of the sample.
In the following, two particular waves affected by thecrack are considered in more detail: the Rayleigh wave re-flected from the crack, as observed in the first zone, and theRayleigh wave transmitted through the crack and detected inthe second zone, as shown in Fig. 4 in a three-dimensional�3D� plot. The goal was to estimate the crack size �radius ofsemicircular crack� by analyzing the reflection and transmis-sion function of the SAW in the frequency domain. The firstzone is preferable for the reflection analysis, since the initialundisturbed Rayleigh wave and its single reflection by thecrack can be monitored and compared directly. Transmit-tance was analyzed by relating the waveform detected in thesecond zone to the incident one, recorded in the first zone.
Figure 4 presents the surface motion in the vicinity ofthe crack. Here the incident Rayleigh wave enters from theleft side and hits the crack situated at 60 �m. At the frontedge of the crack the positive portion of the incident wave isenhanced by about 20%, whereas the negative part does notexperience any considerable magnification. Such an asym-metry points to nonlinear interaction of the clapping type,with a lower stiffness for tensile load than for crack closure.Motion of the rear edge occurs when the crack is open and
FIG. 3. Experimental results of a complete scan of the sample against thepump-probe setup. The abscissa shows the distance to the first measurementlocation, the ordinate the propagation time of the wave, and the grayscalethe velocity waveform measured in the propagation direction.
Crackpositio
n (µm)
50100
150
Time (ns)1020
3040
0
0
Surfac
eslop
e(a.u.)
FIG. 4. �Color online� The 3D picture represents the complete scatteredacoustic field in the vicinity of the crack, including the incoming, transmit-ted, and reflected Rayleigh waves.
084906-3 Lomonosov, Grigoriev, and Hess J. Appl. Phys. 105, 084906 �2009�
Downloaded 15 Feb 2010 to 147.142.186.54. Redistribution subject to AIP license or copyright; see http://jap.aip.org/jap/copyright.jsp

both parts are amplified to the same degree with a strongnegative and second positive peak, as can be seen in Fig. 4.These three peaks, which represent oscillations of the crackedges, form the reflected Rayleigh pulse. The pulse shapeconsists of two positive parts emitted from the positive peaksand the trough associated with the negative peak. The factthat the motion of the rear edge affects the shape of thereflected pulse to a comparable extent as the front edge canbe understood as a consequence of a substantial transientinteraction between the crack faces. Besides the emission ofthe reflected surface wave, the rear edge suffers damped os-cillations, which are indicated in Fig. 4 by the solid line.
Behind the crack the wave is first diminished and thenstarts to grow gradually with propagation distance, with agrowth rate depending on the crack size. This effect has beenutilized for crack size evaluation.24
B. Finite differences simulation
Scattering of plane Rayleigh waves by a microcrack wasmodeled by the finite differences method �FDM�. The pro-cess was treated as a 2D problem, i.e., the crack was as-sumed to be of infinite extension along the x2-axis, with con-stant depth, oriented normal to the sample surface, andparallel to the infinitely long plane wave front. The FDMscheme consisted of two meshes, one for displacements Ui
and another one for the stress components �ik, which aredepicted as gray circles and dashed lines in Fig. 5, respec-tively. At each time step the stress was calculated on thebasis of the displacement gradients Uik=�Ui /�xk, taken at thefour surrounding points, such that �ij�x1 ,x3�=CijklUkl
i �x1 ,x3�. The interpolated quantities Ukli �x1 ,x3� were
calculated as follows:
Uk1i �x1,x3� =
1
2h�Uk�x1 + h/2,x3 − h/2� + Uk�x1 + h/2,x3
+ h/2� − Uk�x1 − h/2,x3 − h/2� − Uk�x1
− h/2,x3 + h/2�� ,
Uk3i �x1,x3� =
1
2h�Uk�x1 − h/2,x3 + h/2� + Uk�x1 + h/2,x3
+ h/2� − Uk�x1 − h/2,x3 − h/2� − Uk�x1
+ h/2,x3 − h/2�� . �1�
With these implementations of the FDM representationsthe spatial derivatives are symmetrically centered in both di-rections and have second-order accuracy with respect to thespatial increment h. The boundary conditions at the free sur-face and crack faces cannot be expressed in entirely centeredform and require a quadratic extrapolation, resulting in thefollowing formulas for the surface x3=0:
Ui1�x1,0� =1
8h�15Ui�x1 + h/2,h/2� − 10Ui�x1 + h/2,h�
+ 3Ui�x1 + h/2,3h/2� − 15Ui�x1 − h/2,h/2�
+ 10Ui�x1 − h/2,h� − 3Ui�x1 − h/2,3h/2�� ,
Ui3�x1,0� =1
2h�− 2Ui�x1 − h/2,h/2� + 3Ui�x1 − h/2,h�
− Ui�x1 − h/2,3h/2� − 2Ui�x1 + h/2,h/2�
+ 3Ui�x1 + h/2,h� − Ui�x1 + h/2,3h/2�� . �2�
The traction-free boundary conditions at the surface x3
=0 imply that the only nonzero stress component is �11
=C11klUkl�x1 ,0� with Ukl given by the Eq. �2�. If the crackfaces are considered as traction-free, the interpolation shouldbe done in an analogous way for the boundary conditions atthese surfaces. Interaction between the faces of the crack wasmodeled as local softening of the material within a thin layerat the crack in a quasistatic approximation, as describedpreviously.25,26
The equation of motion was used in its conventionalform,
�Ui =��ij
�xj, �3�
with � denoting the mass density. For the time step the fol-lowing procedure was used. Displacements Ui
k+1 at the timeinstant k+1 were calculated in two stages. The first approxi-
mation �or “prediction”� Uik+1 is given by
Uik+1 = 2Ui
k − Uik−1 + ai
k�2, �4�
where aik= �1 /�����ij /�xj� has the physical meaning of an
acceleration of the mass element taken at the kth instant and� denotes the time increment. This approximation impliesthat the acceleration or force applied to a mass element re-mains constant within the time period �. The second stage�“correction”� admits a linear dependence on time,
Uik+1 = 2Ui
k − Uik−1 + �2� 1
6aik−1 + 1
3aik + 1
2aik+1� . �5�
Here the value aik+1 should be calculated for the “predicted”
displacement field Uik+1 defined by Eq. �4�. Such a predictor-
corrector method shows better propagation characteristicsand stability with respect to the digital perturbations than theconventional one,13,27 which utilizes the prediction only,given by Eq. �4�.
The thermoelastic excitation of a short SAW pulse wasmodeled as a boundary condition at the surface �x3=0� in theform of a dipole stress component �13, applied to the surfacewith temporal and spatial parameters similar to those em-ployed in the experiment, e.g., 1 ns laser pulse duration and
hh
x1
x3
Uij meshσij mesh crack
FIG. 5. FDM scheme consisting of two meshes, one for displacements Ui
and the other for stress components �ik, which are depicted as gray circlesand dashed lines, respectively.
084906-4 Lomonosov, Grigoriev, and Hess J. Appl. Phys. 105, 084906 �2009�
Downloaded 15 Feb 2010 to 147.142.186.54. Redistribution subject to AIP license or copyright; see http://jap.aip.org/jap/copyright.jsp
5 �m half-width of the line source. Such a source delivers aGaussian waveform in terms of the vertical displacement U3
and an antisymmetric bipolar pulse for the surface slope U31,as actually measured by the PBD setup. Besides the Rayleighwave, the simulation with such a source describes all pos-sible acoustic modes, as the longitudinal and shear bulkwaves, observed experimentally. In addition, bulk modes aregenerated as a result of interaction of the Rayleigh wave withthe crack. Spatial divergence accounts for the attenuation ofbulk waves with distance r from the laser source or crack asr−1/2. Since here only distant locations will be considered, theinfluence of bulk modes could be reduced.
C. Model of crack-face interaction
In this section a model is introduced that takes into ac-count the effect of a partial dynamic contact between the twofractured faces during interaction with the SAW pulse. Totake such an effect into consideration, the cracked samplewas modeled as a continuous solid with all stress compo-nents reduced along the crack �x1=x1crack, 0�x3�d�. For thesake of simplicity the stiffness reduction was described byintroducing a single scalar parameter 0��1, so that �ij
C
=��ij at the crack. Within the frame of a mass-spring repre-sentation, this corresponds to a reduction in the spring’s stiff-ness between the masses situated on each side of the crackby a factor of �. The interfacial stiffness, defined as K=� /I,
25,26 where I is the additional displacement of thecrack faces caused by the reduction in stiffness, takes theform
KN = �C11/h and KT = �C44/h
for the normal KN and tangential KT components, respec-tively. Here h stands for the spatial step in the FD schemeand C11 and C44 are the stiffness components in Voigt’s ab-breviated notation. For the elastic constants of fused silica�C11=78 GPa, C44=31 GPa�, h=0.5 �m, and taking �=0.08 the mean values of the interfacial stiffnesses are KN
=1.2�1016 N m−3 and KT=5�1015 N m−3, with KT /KN
�0.4. Variations in the mass density in the vicinity of thecrack have a relatively small effect on wave scattering andtherefore have not been taken into account.28 The thicknessof the interfacial layer, which within this model correspondsjust to the spatial step of 0.5 �m, is large compared to thedisplacements caused by the surface wave. On the otherhand, it is much smaller than the characteristic acousticalwavelengths of the SAW pulse. Under these conditions theresponse of the crack to the passing Rayleigh wave remainslinear, and is independent of the arbitrarily introduced thick-ness of the interfacial layer. Thus, this simplified model as-sumes all relevant stress-tensor components to be modifiedby the same factor. A more realistic interaction model, suchas a sliding contact,29 for example, would require an interac-tion parameter in tensorial form with two or more nonzerocomponents. Correspondingly, for such an analysis, more de-tailed information on the nature of the crack would beneeded, which is difficult to extract from the current experi-ments.
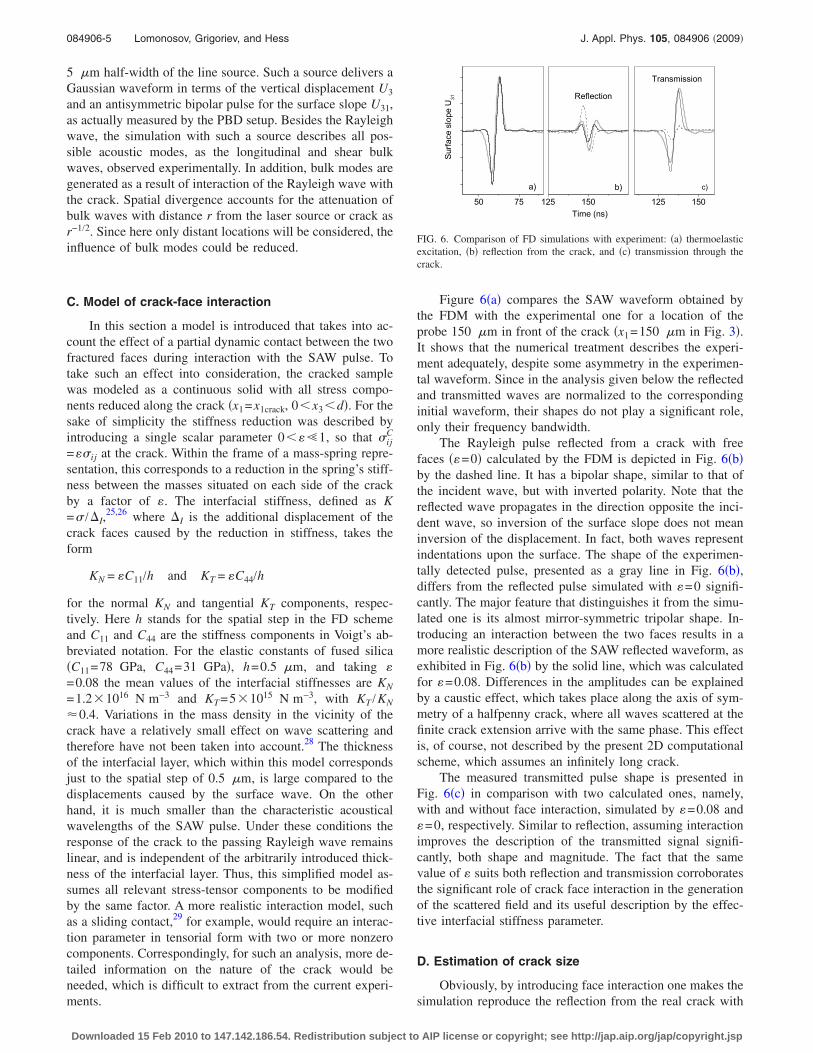
Figure 6�a� compares the SAW waveform obtained bythe FDM with the experimental one for a location of theprobe 150 �m in front of the crack �x1=150 �m in Fig. 3�.It shows that the numerical treatment describes the experi-ment adequately, despite some asymmetry in the experimen-tal waveform. Since in the analysis given below the reflectedand transmitted waves are normalized to the correspondinginitial waveform, their shapes do not play a significant role,only their frequency bandwidth.
The Rayleigh pulse reflected from a crack with freefaces ��=0� calculated by the FDM is depicted in Fig. 6�b�by the dashed line. It has a bipolar shape, similar to that ofthe incident wave, but with inverted polarity. Note that thereflected wave propagates in the direction opposite the inci-dent wave, so inversion of the surface slope does not meaninversion of the displacement. In fact, both waves representindentations upon the surface. The shape of the experimen-tally detected pulse, presented as a gray line in Fig. 6�b�,differs from the reflected pulse simulated with �=0 signifi-cantly. The major feature that distinguishes it from the simu-lated one is its almost mirror-symmetric tripolar shape. In-troducing an interaction between the two faces results in amore realistic description of the SAW reflected waveform, asexhibited in Fig. 6�b� by the solid line, which was calculatedfor �=0.08. Differences in the amplitudes can be explainedby a caustic effect, which takes place along the axis of sym-metry of a halfpenny crack, where all waves scattered at thefinite crack extension arrive with the same phase. This effectis, of course, not described by the present 2D computationalscheme, which assumes an infinitely long crack.
The measured transmitted pulse shape is presented inFig. 6�c� in comparison with two calculated ones, namely,with and without face interaction, simulated by �=0.08 and�=0, respectively. Similar to reflection, assuming interactionimproves the description of the transmitted signal signifi-cantly, both shape and magnitude. The fact that the samevalue of � suits both reflection and transmission corroboratesthe significant role of crack face interaction in the generationof the scattered field and its useful description by the effec-tive interfacial stiffness parameter.
D. Estimation of crack size
Obviously, by introducing face interaction one makes thesimulation reproduce the reflection from the real crack with
FIG. 6. Comparison of FD simulations with experiment: �a� thermoelasticexcitation, �b� reflection from the crack, and �c� transmission through thecrack.
084906-5 Lomonosov, Grigoriev, and Hess J. Appl. Phys. 105, 084906 �2009�
Downloaded 15 Feb 2010 to 147.142.186.54. Redistribution subject to AIP license or copyright; see http://jap.aip.org/jap/copyright.jsp

significantly better agreement with experiment; consequentlythis can be employed to solve the inverse problem, i.e., theevaluation of the crack size. First let us consider the reflec-tion coefficient, which depends on the crack size d normal-ized by the wavelength �, that is R=R�d /��. This coefficientwas calculated for both the simulated waveforms and themeasured ones as the ratio of the spectral amplitudes of thereflected and incident waves. Note that the reflected wave-forms are superpositions of several acoustic modes, gener-ated at both edges of the crack and its tip. Aside from theRayleigh waves reflected from these locations, there are alsomode-converted shear and longitudinal waves. All theseacoustic modes propagate with different velocities. Conse-quently, the shape of the reflected pulse changes with dis-tance from the crack. This imposes restrictions on the dis-tance and time interval selected for calculating the reflectioncoefficient. Here the reflection coefficient was calculated onthe basis of the waveforms recorded 75 �m from the crack.At this point, the longitudinal wave is well separated fromthe still overlapping Rayleigh and shear waves. Note that thefinite differences simulation takes into account all acousticmodes and therefore it describes the reflection process ad-equately if both simulation and measurement correspond tothe same distance from the crack.
For a crack with noninteracting faces the functionR�d /�� exhibits an oscillatory growth from zero to a steadyvalue of about 0.4 for d /��1 �see for example Refs. 5 and14�. Oscillations of the R function indicate acoustic eigen-modes of the crack, offering a means to evaluate the crackdimensions, as reported previously.15 Mutual interactionsmoothes the oscillations and for ��0.05 R�d /�� behaveslike a monotonic function.
In the time domain the interaction results in the appear-ance of an additional positive peak in the waveform, as canbe seen in Fig. 6�b�. Its amplitude depends on the interfacialstiffness, allowing an estimate of the interaction parameter �.For the particular crack studied in this work a value of �=0.08 provided reasonable description of the experiments.
The depth of the crack d was evaluated by fitting theFDM-simulated reflection coefficient R to the experimentallymeasured one by a least-squares procedure. Two free param-eters were involved, amplitude a and the crack depth d, sothat the function aR�dCR / f� was fitted to the measured fre-quency dependence of reflection. The result is shown in Fig.7, where the experimental data are presented by circles andthe curve describes the simulated reflection function. Fromthe fit the values a=1.7 and d=34 �m were extracted. Thiscrack depth is in reasonable agreement with the direct mea-surement of the crack radius of 53 �m by means of opticalmicroscopy �see Fig. 1�, if the crack is considered semicir-cular. Note that the acoustically measured crack depth essen-tially depends on the area in which the interaction betweenthe crack faces is significantly diminished, i.e., �1. In thevicinity of the tip the interaction forces can be much strongerapproaching ��1. Hence this part of the crack may not beseen acoustically, whereas optically it may scatter light, andtherefore can be observed with an optical microscope.
The transmission of a surface wave pulse through acrack is accompanied by a pronounced time lag, which can
be clearly seen in Fig. 3 as a small upward shift in the hori-zontal Rayleigh wave trace at x1=300 �m and a step downat x1=680 �m. Such a time lag of the transmitted wave withrespect to the wave in an uncracked sample has been dis-cussed in the literature,14 where the time-of-flight methodemploying narrowband SAWs was proposed for evaluatingcrack depths in the range d /��0.8. Transmission of broad-band Rayleigh pulses through the crack, as used in thepresent experiments, produces a phase shift depending onfrequency or the ratio d /�. In the low-frequency limit thephase lag is zero, whereas for higher frequencies it tends to alinear frequency dependence =4�df /CR, and in the highfrequency limit d /��1, the interaction between the fracturefaces diminishes the frequency dependence of the phase.
Here the SAW transmitted through the crack was firstsimulated using the FDM, and then the phase of the trans-mission coefficient was calculated as a function of d /�. Thiswas fitted to the experimentally measured frequency depen-dence of the phase shift with the crack size d as the only freefitting parameter. The solid line in Fig. 8 shows the depen-dence of the phase on frequency for the FDM-simulatedtransmission, fitted by the least-squares method to the experi-mental phase shift. The crack depth evaluated by the trans-mission method was d=40 �m, in reasonable agreementwith the reflection method.
By comparing the two evaluation methods one can con-clude that the advantage of the reflection method is the largerfrequency range realized by the wave reflected from thecrack. The extended frequency spectrum involved in thisevaluation procedure results in a higher spatial resolution for
FIG. 7. Fit of the experimental reflection coefficient to the simulated one todetermine the crack depth.
FIG. 8. Fit of the experimental phase shift to the simulated �FDM� one toobtain the crack depth.
084906-6 Lomonosov, Grigoriev, and Hess J. Appl. Phys. 105, 084906 �2009�
Downloaded 15 Feb 2010 to 147.142.186.54. Redistribution subject to AIP license or copyright; see http://jap.aip.org/jap/copyright.jsp

smaller cracks. In the wave transmitted through the crack thehigh-frequency components are partially lost. On the otherhand, an advantage of the transmittance method is its inde-pendence of the amplitude, since it deals with the time delayor phase shift only. Therefore, caustic effects do not play asignificant role in this particular case.
IV. CONCLUSIONS
We demonstrated that with a laser-based pump-probesetup, the frequency range of NDE of surface-breakingcracks can be extended to about 200 MHz. The applicationof noncontact optical detection methods in this frequencyrange requires surfaces of optical quality and can be used toinspect delicate samples such as silicon wafers. The experi-ments provide clear evidence that in the microcracks gener-ated by nonlinear SAW pulses with shocks in silica the frac-ture faces are not completely separated but experience a faceinteraction during transmission of the monitoring SAWpulse. While the simple one-parameter model introduced todescribe the interfacial stiffness between the crack faces�softening� cannot give a realistic microscopic picture of thespatial distribution of the mutual interaction processes, ityields an averaged number providing an idea of the overallmagnitude of the remaining interaction between the partiallycontacting crack faces. The FDM was applied in a 2D ap-proximation for a configuration where source and crack wereparallel and the crack penetrated perpendicular to the surfaceinto the material.
The measured waveforms of the reflected and transmit-ted Rayleigh waves could be simulated quite well if dynamicface interaction was taken into account. The inverse problemof crack sizing has been solved by comparing the frequencydependence of the reflection coefficient and phase lag oftransmission with FDM simulations. As expected, the acous-tically measured depth values of 34 and 40 �m were smallerthan the depth of 53 �m, obtained by optical microscopy fora semicircular crack. Such a relatively small difference be-tween the optically measured size of the crack and its acous-tical estimate may appear because of the strong inhomoge-neity of the mutual interaction across the crack area. Inaddition, scattering of light, which has a shorter wavelengththan the SAW pulses, is more sensitive to the contacting areaaround the tip.
ACKNOWLEDGMENTS
Financial support of this work by the DeutscheForschungsgemeinschaft �DFG� and by the RFBR �GrantNo. 07-02-01425-a� are gratefully acknowledged.
1C. B. Scruby and L. E. Drain, Laser Ultrasonics: Techniques and Appli-cations �Adam Hilger, Bristol, 1990�.
2V. E. Gusev and A. A. Karabutov, Laser Optoacoustics �American Insti-tute of Physics, New York, 1993�.
3A. M. Lomonosov, A. P. Mayer, and P. Hess, in Modern Acoustical Tech-niques for the Measurement of Mechanical Properties, edited by M. Levy,H. E. Bass, and R. Stern �Academic, San Diego, 2001�, Vol. 1, pp. 65–134.
4Q. Shan and R. J. Dewhurst, Appl. Phys. Lett. 62, 2649 �1993�.5D. A. Mendelsohn, J. D. Achenbach, and L. M. Keer, Wave Motion 2, 277�1980�.
6A. K. Kromine, P. A. Fomitchov, S. Krishnaswamy, and J. D. Achenbach,Mater. Eval. 58, 173 �2000�.
7I. Arias and J. D. Achenbach, Wave Motion 39, 61 �2004�.8Y. Sohn and S. Krishnaswamy, J. Acoust. Soc. Am. 115, 172 �2004�.9X. Jian, Y. Fan, R. S. Edwards, and S. Dixon, J. Appl. Phys. 100, 064907�2006�.
10R. S. Edwards, S. Dixon, and X. Jian, Ultrasonics 44, 93 �2006�.11X. Jian, S. Dixon, N. Guo, and R. S. Edwards, J. Appl. Phys. 101, 064906
�2007�.12Y. Matsuda, H. Nakano, S. Nagai, and H. Hiratsuka, Appl. Phys. Lett. 89,
171902 �2006�.13B. Masserey and E. Mazza, J. Acoust. Soc. Am. 118, 3585 �2005�.14B. Masserey and E. Mazza, Ultrasonics 46, 195 �2007�.15V. Domarkas, B. T. Khuri-Yakub, and G. S. Kino, Appl. Phys. Lett. 33,
557 �1978�.16J.-Y. Kim, V. A. Yakovlev, and S. I. Rokhlin, J. Acoust. Soc. Am. 115,
1961 �2004�.17J. J. W. Tien, B. T. Khuri-Yakub, G. S. Kino, D. B. Marshall, and A. G.
Evans, J. Nondestruct. Eval. 2, 219 �1981�.18G. Gregoire, V. Tournat, D. Mounier, and V. E. Gusev, Eur. Phys. J. Spec.
Top. 153, 313 �2008�.19J. A. Cooper, R. A. Crosbie, R. J. Dewhurst, A. D. W. McKie, and S. B.
Palmer, IEEE Trans. Ultrason. Ferroelectr. Freq. Control 33, 462 �1986�.20Q. Shan and R. J. Dewhurst, Appl. Phys. Lett. 62, 2649 �1993�.21J.-P. Monchalin, IEEE Trans. Ultrason. Ferroelectr. Freq. Control 33, 485
�1986�.22A. M. Lomonosov and P. Hess, Phys. Rev. Lett. 89, 095501 �2002�.23G. Lehmann, A. M. Lomonosov, P. Hess, and P. Gumbsch, J. Appl. Phys.
94, 2907 �2003�.24A. Moura, A. M. Lomonosov, and P. Hess, J. Appl. Phys. 103, 084911
�2008�.25J.-M. Baik and R. B. Thomson, J. Nondestruct. Eval. 4, 177 �1984�.26C. Pecorari, Wave Motion 33, 259 �2001�.27A. M. Lomonosov and P. Hess, J. Appl. Phys. 97, 093528 �2005�.28R. Thomas, B. W. Drinkwater, and D. Liaptsis, J. Acoust. Soc. Am. 117,
638 �2005�.29M. D. Verweij and C. H. Chapman, J. Acoust. Soc. Am. 101, 2473 �1997�.
084906-7 Lomonosov, Grigoriev, and Hess J. Appl. Phys. 105, 084906 �2009�
Downloaded 15 Feb 2010 to 147.142.186.54. Redistribution subject to AIP license or copyright; see http://jap.aip.org/jap/copyright.jsp