Embed Size (px)
Citation preview

Introduction
SK MASUDUL HASAN
ASST TEACHER(ENGLISH)
GHONA HIGH SCHOOL
SATKHIRA SADAR
01720-589535
Graph & Chart
TIME-50 MINUTESDATE 07-04-2015
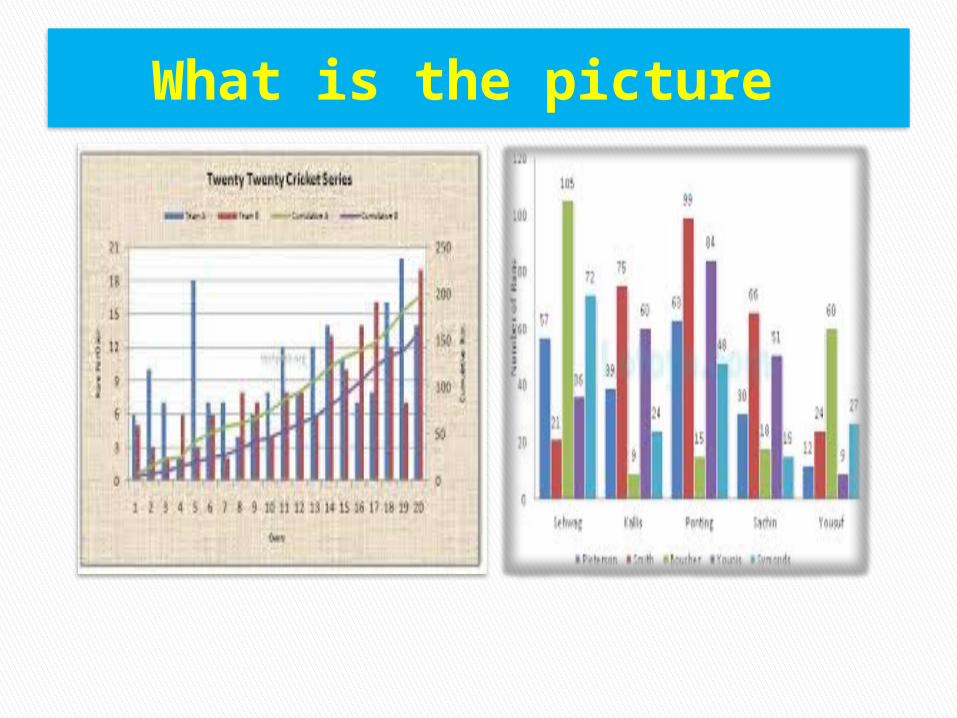
What is the picture
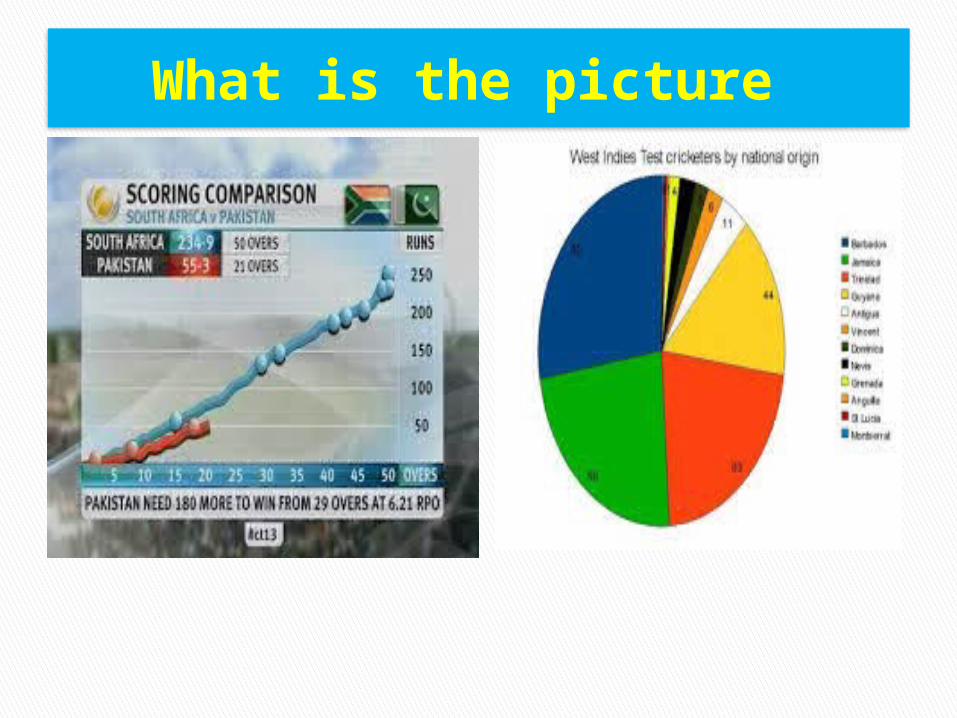
What is the picture
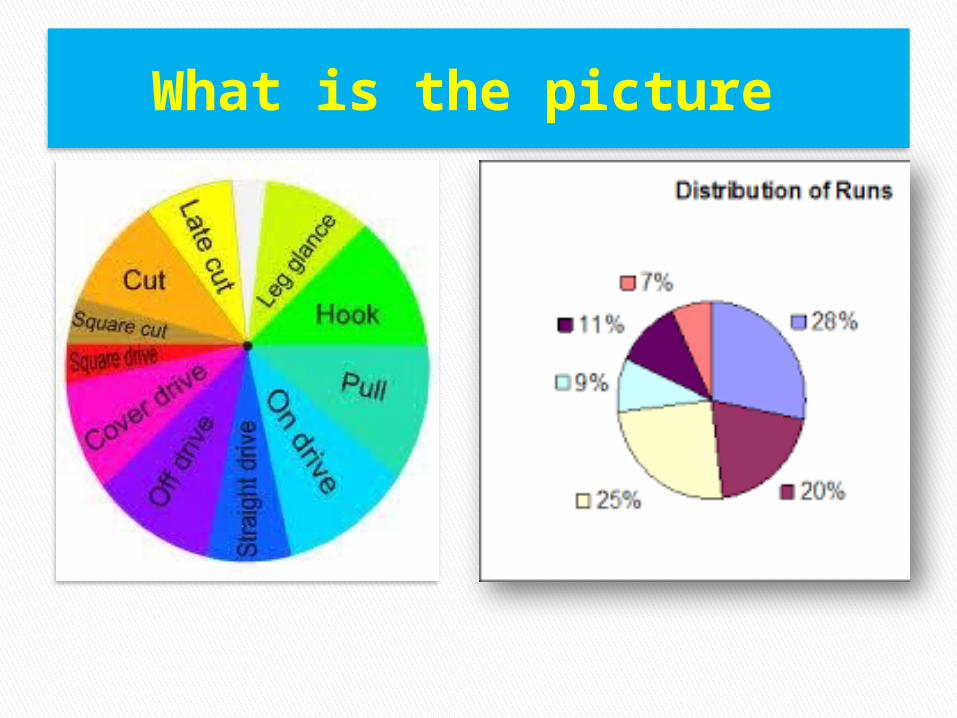
What is the picture
Today’s lesson
Graph & Chart Description
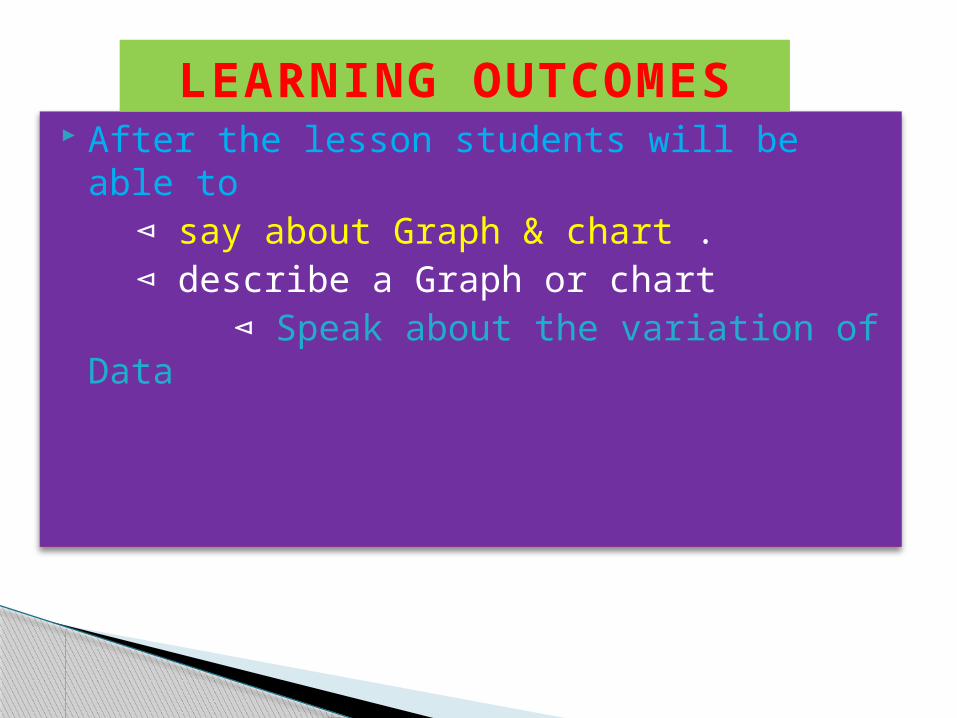
After the lesson students will be able to ⊲ say about Graph & chart .⊲ describe a Graph or chart
⊲ Speak about the variation of Data
LEARNING OUTCOMES
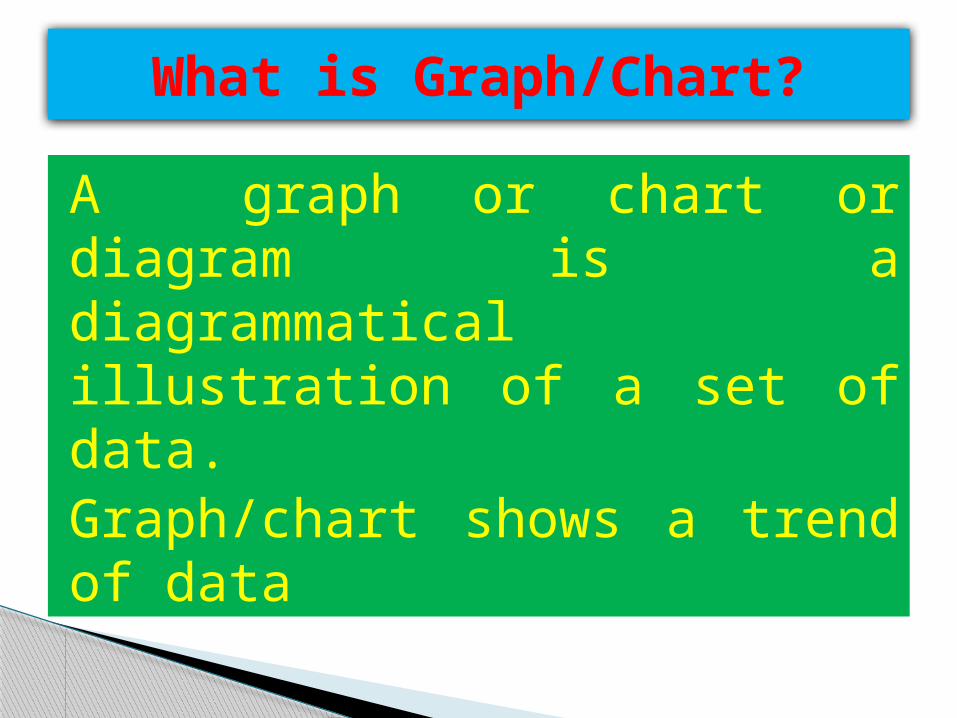
What is Graph/Chart?
A graph or chart or diagram is a diagrammatical illustration of a set of data.Graph/chart shows a trend of data
Area Graph
Bar ChartDot
Pl
ot
Flow Chart
HistographLine Graph
Photograph
Pie ChartPolar Chart
Scat
terp
lot
Stem and leaf
plot
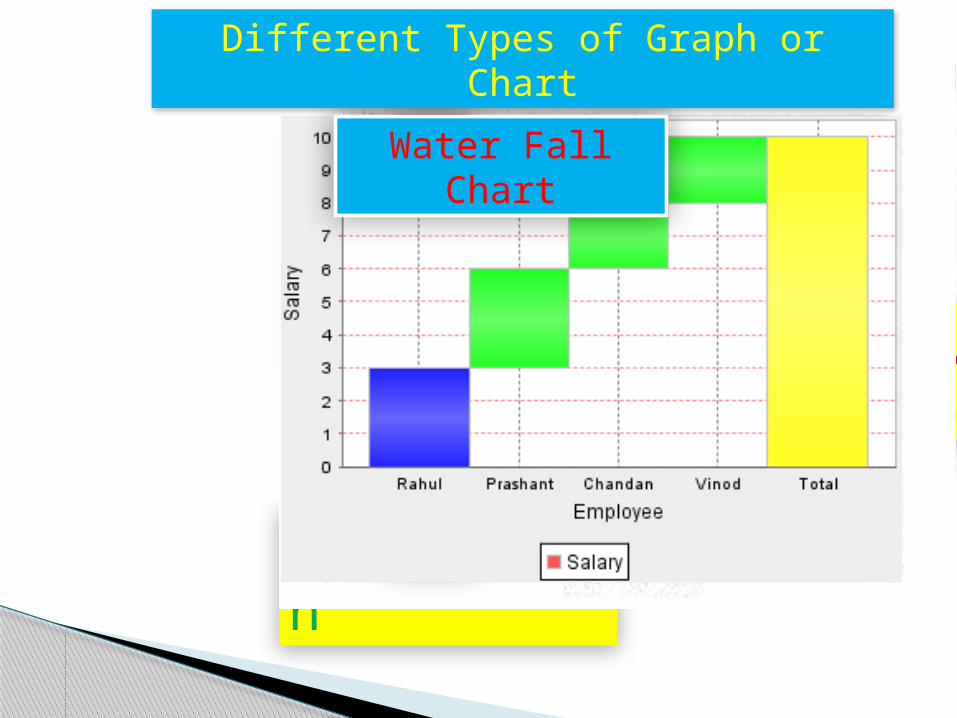
Wat
er Fal
l Cha
rtDifferent Types of Graph or Chart
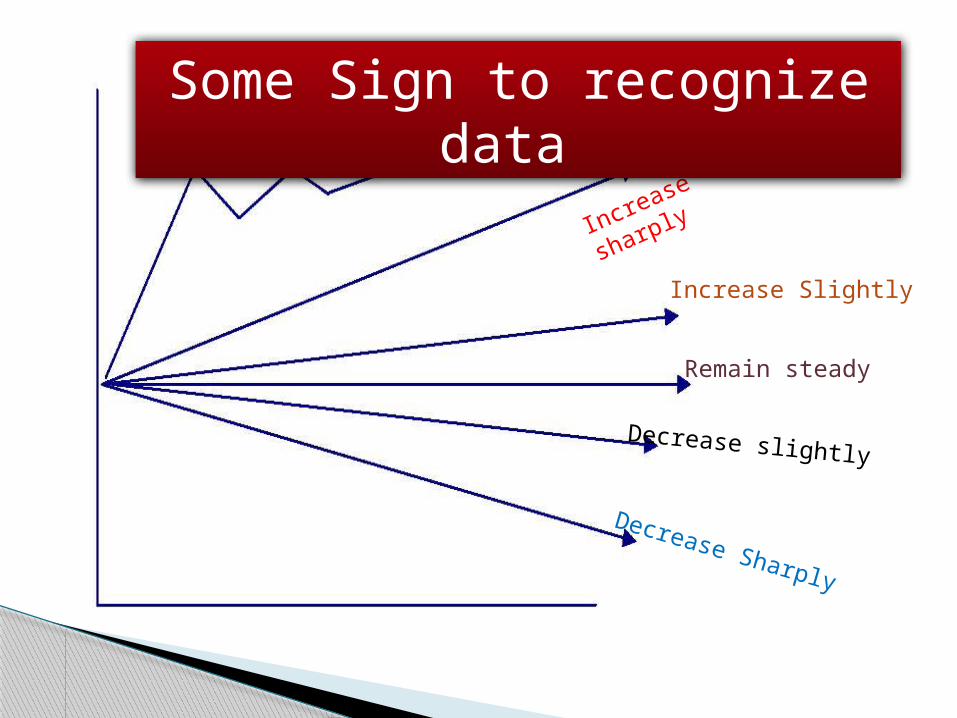
fluctuate
Increase sharply
Increase Slightly
Remain steady
Decrease slightly
Decrease Sharply
Some Sign to recognize data
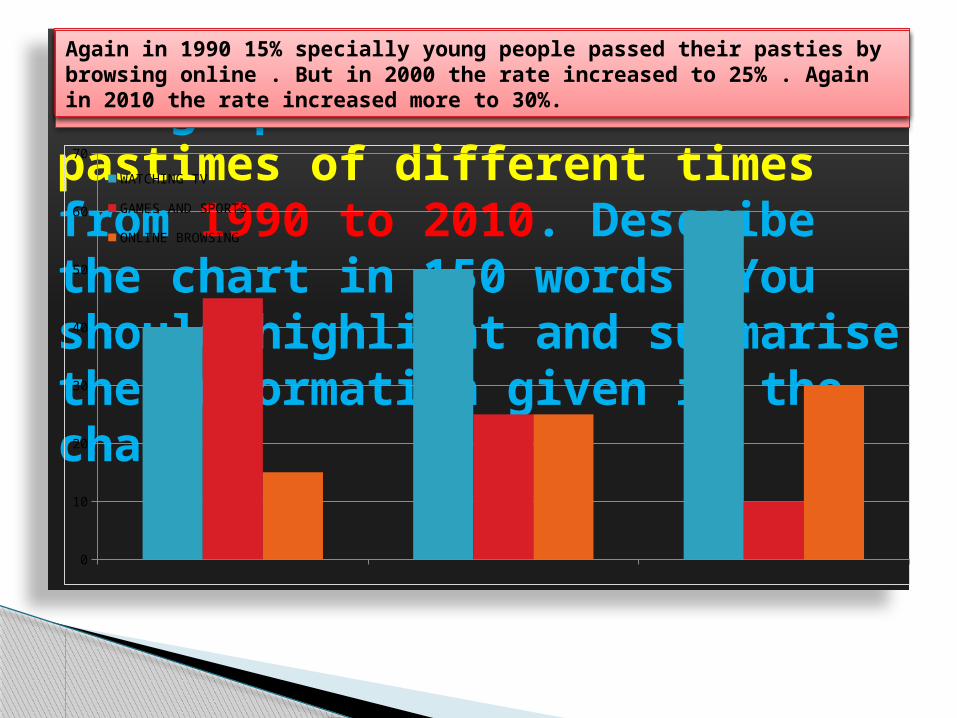
The graph shows the habit of pastimes of different times from 1990 to 2010. Describe the chart in 150 words. You should highlight and summarise the information given in the chart.
1990 2000 20100
10
20
30
40
50
60
70
WATCHING TV
GAMES AND SPORTS
ONLINE BROWSING
The graph shows about the change of pastimes during the change of generations.From the graph we know that in 1990 40% people enjoyed for watching TV . But in 2000 the rate increased to 50% . Again in 2010 the rate increased more to 60%.
On the other hand in 1990 45% people liked for doing games and sports . Unfortunately in 2000 the rate decreased to 25% . Again in 2010 the rate decreased more to 10%.
Again in 1990 15% specially young people passed their pasties by browsing online . But in 2000 the rate increased to 25% . Again in 2010 the rate increased more to 30%.
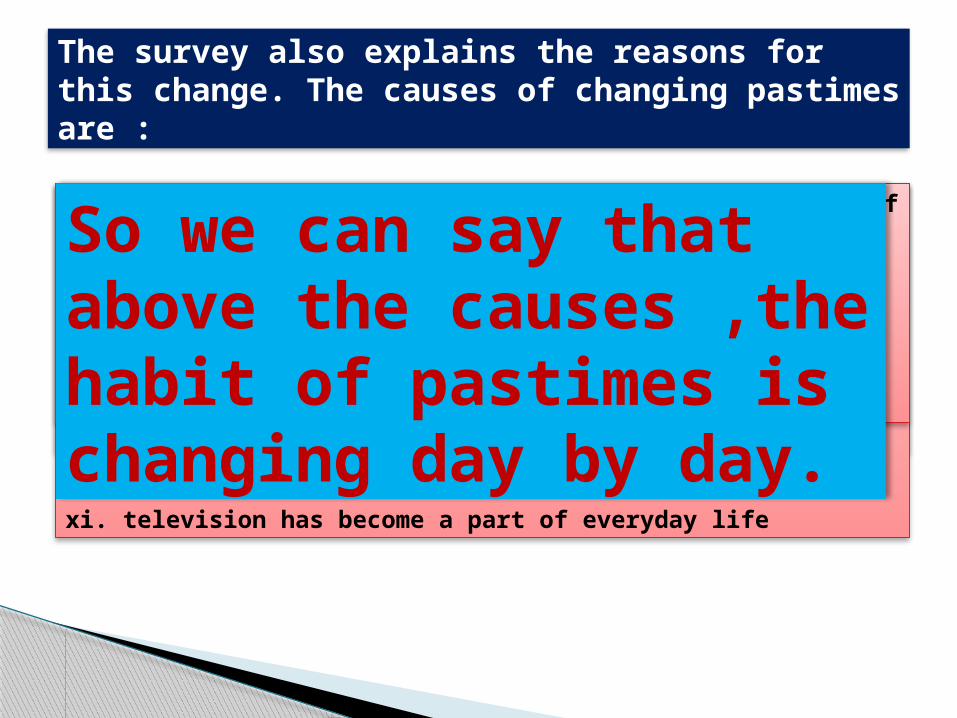
The survey also explains the reasons for this change. The causes of changing pastimes are :
i. The consciousness of people ii.The proper steps of Govt. iii.The development of civilization iv. The improvement of technology
v. the widespread of communication
vi. the hi-tech development vii. The improvement of education system viii. the style of human society ix. the importance of computer x.The eagerness of knowing the world. xi. television has become a part of everyday life
xii. The increasing urbanization has reduced the number of open fields.xiii. computer technology is getting cheaper, easier, and more popular every day. xiv. Indeed our young generations are stepping to an e-world.
So we can say that above the causes ,the habit of pastimes is changing day by day.
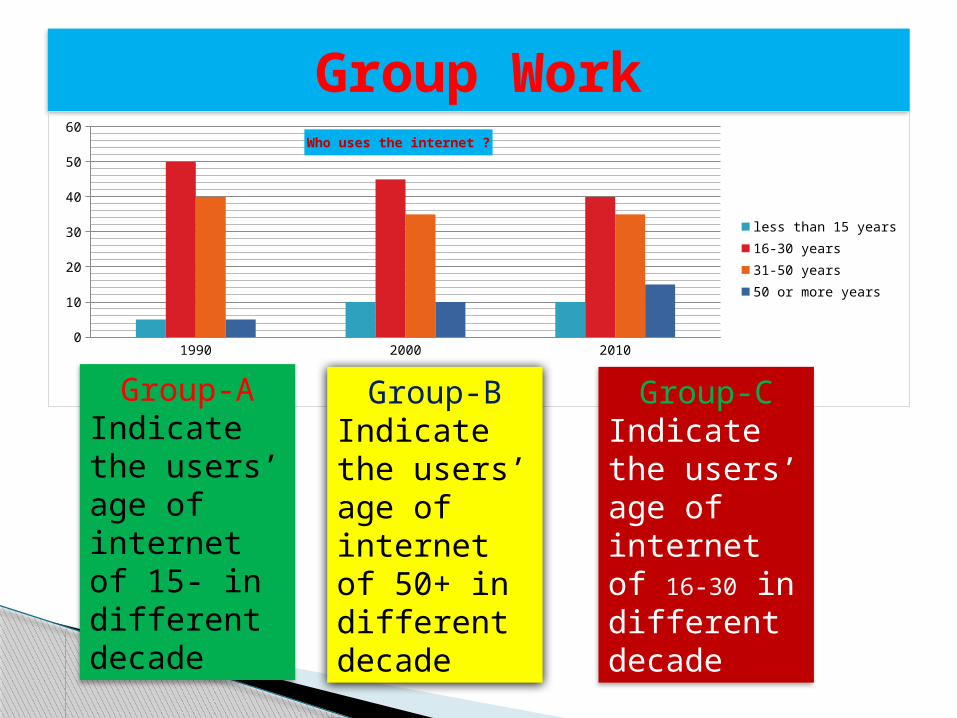
Group Work
1990 2000 20100
10
20
30
40
50
60
less than 15 years16-30 years31-50 years50 or more years
Who uses the internet ?
Group-AIndicate the users’ age of internet of 15- in different decade
Group-BIndicate the users’ age of internet of 50+ in different decade
Group-CIndicate the users’ age of internet of 16-30 in different decade
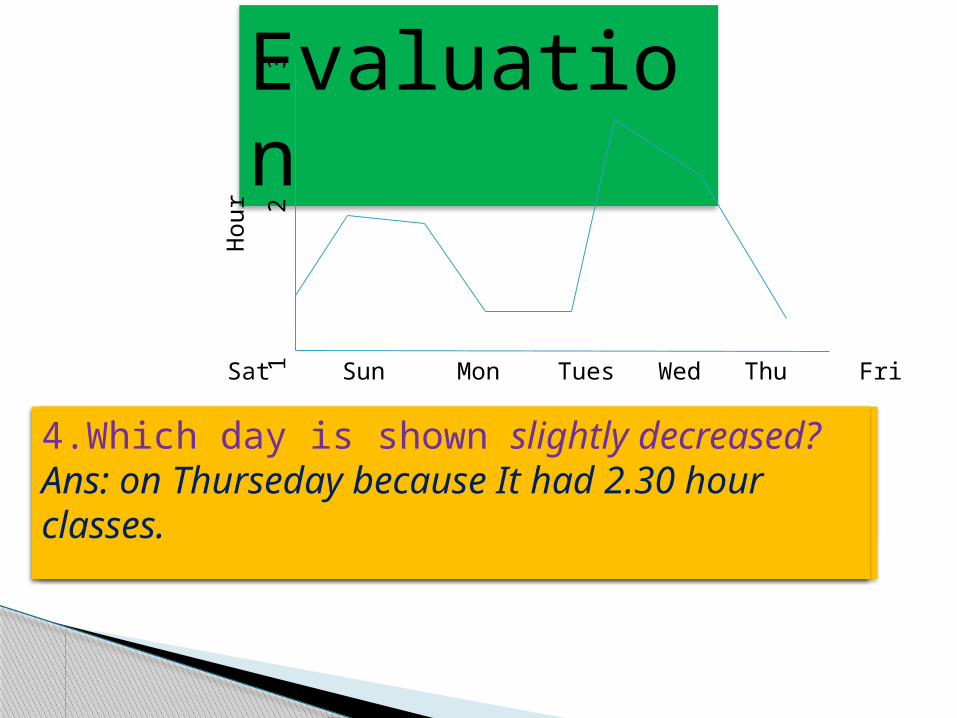
Evaluation
1
2
3
Sat Sun Mon Tues Wed Thu Fri
Hour
1.Which day is shown sharply increased? Ans: on Thurseday because It had three classes.
2.Which day is shown sharply decreased? Ans: on Friday because It had no classes for holiday.
3.Which day is shown steady? Ans: on Tuesday because It had same classes as before day of Monday.
4.Which day is shown slightly decreased? Ans: on Thurseday because It had 2.30 hour classes.
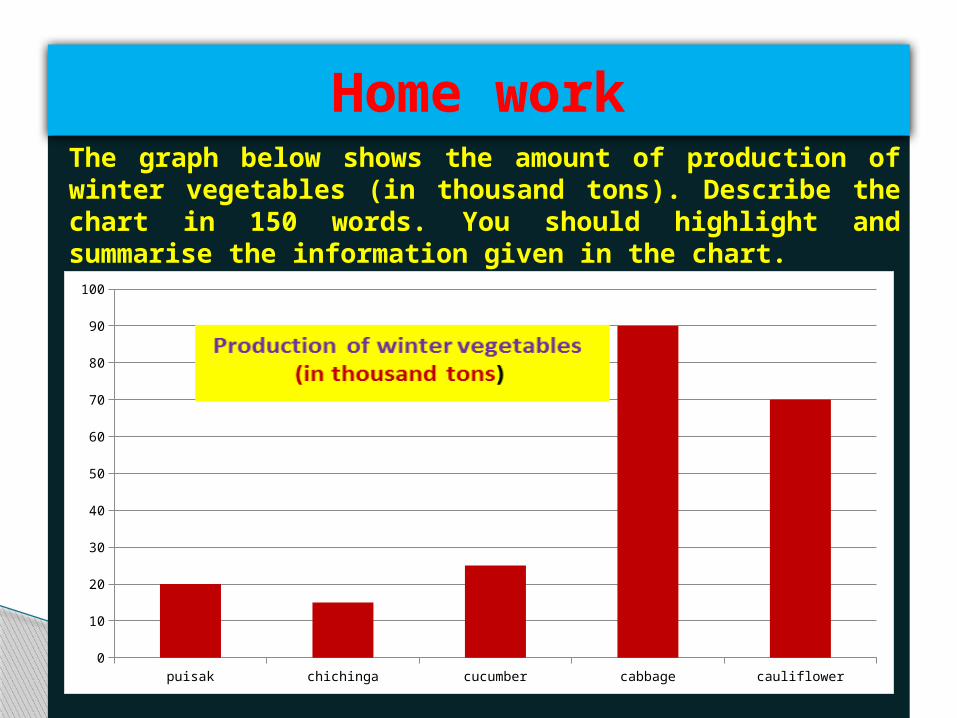
The graph below shows the amount of production of winter vegetables (in thousand tons). Describe the chart in 150 words. You should highlight and summarise the information given in the chart.
Home work
puisak chichinga cucumber cabbage cauliflower0
10
20
30
40
50
60
70
80
90
100