Embed Size (px)
Citation preview
..~
SKAGIT RIVERDAM FAILURE INUNDATION STUDY
Hydrocomp
__ ._ __._.__ ._.~" ...---r--
rC,.. -.~~: •.<
I -
IL
~.. "..
~'.
SKAGIT RIVERDAM FAILURE INUNDATION STUDY
Prepared forCity of Seattle - Department of Lighting
1015 Third AvenueSeattle
Washington 98104
bySteven M. Thurin, P.E.
Hydrocomp, Inc.201 San Antonio Circle, Suite 280Mountain View, California 94040
December, 1981
LIST OF FIGURES
Figure Page
Dam Fail ure Study Area •.•.•..••..•.•••...••......•.
Gorge Dam Failure (Outflow) •••.•••••..•.•••..•••.•.
Gorge Dam Failure (Water Surface Elevation) ...•...•
Skagit Routing: Gorge Dam Failure (Flow) ..•....••..
Skagit Routing: Gorge Dam Failure (Water
6
28
29
30
Sur face Elevation) .
Diablo Dam Failure (Outflow) •••.••••......•.•••.•.•
Diablo Dam Failure (Water Surface Elevation)
Gorge Overtopped by Diable Failure (Water
31
33
34
Surface Elevation) .
Gorge Overtopped by Diablo Failure (Flow)
Skagit Routing: Diablo Dam Failure (Flow)
Skagit Routing: Diablo Dam Failure (Water
36
37
39
Ross Dam Failure (Outflow) ••.••.••••....•••.•..•...
Surface Elevation) .
Gorge Overtopped by Ross Failure (Flow) .•...••...•.
Gorge Overtopped by Ross Failure (Water
Surface Elevation) .
Ross Dam Failure (Water Surface Elevation) ••••.•.•.
Overtopping Failure of Diablo (Flow) .•.......••••••
Diablo Overtopped by Ross Failure (Water
Surface Elevation) . 45
46
49
40
42
43
44
47
48Dam Failure (Flow)
Dam Failure (Water
Skagit Routing: Ross
Skagit Routing: Ross
Surface Elevation)
5-17
5-18
5-19 Skagit Routing: Ross Dam Failure (Water
Surface Elevation) 50
6-1 Skagit River Development Dam Failure
Inundation M'ap ••••••••••••••••••••••••••••••••••• 54
it
LIST OF TABLES
Table Page
1-1 Simulation Results at Marblemount, Concrete
, ..~. -":,
t" ~.
6-1
6-2
and Sedro-Wooley .•..••••....•.•..••...•..•..•.•
Peak Flows and Elevations ••••••••••••••••••••••
Time to Exceed Zero Damage Flow Level •••••••••
iii
3
52
53
....._-.,.--..:F"'~
•
~..
(.;
1.0 SUMMARY
In accordance with Federal 'Regulations Governing Safety of Water
Power Projects and Project Works', the Federal Energy Regulatory
Commission (FERC) requires an applicant or licensee to file an
'Emergency Action Plan' (EAP), as appropriate, for proposed or
existing hydropower generation projects (FERC Order #122, January
21,1981). One part of the preparation of an EAP is the analysis of
the potential downstream inundation resulting from a dam failure.
This report includes a discussion of assumed modes of failure and
inundation analyses for Ross Dam, Diablo Dam, and Gorge Dam which
are owned by the City of Seattle, City Light Department and
comprise the Skagit River Project (F~RC PROJECT 533). THE CAUSES
OF FAILURE ASSUMED IN THIS STUDY ARE "WORST CASE" HYPOTHETICAL
CONDITIONS THAT ARE ASSUMED FOR THE PURPOSE OF EMERGENCY ACTION
PLANNING.
This report includes analyses of the inundations that result from
the following failure cases:
- A Failure of Ross Dam which is followed by failures of the
Diablo and Gorge Dams by overtopping.
- A Failure of Diablo Dam followed by failure of Gorge Dam by
overtopping.
- A Failure of Gorge Dam.
For the inundations that result from these cases, the maximum
discharge and the elapsed times from the failure to flood stage
and to the maximum discharge are given. Maximum discharges are
shown in tables and figures for several points on the Skagit
River.
1
',,-._--/~,-:;
j'
f!:'"
~ .0-
The technical analysis used to study the inundation is "full
equations routing" which predicts flood wave movement using the
complete energy and momentum equations. Full equations routing,
rather than conventional hydrologic or kinematic wave routing, is
needed for inundation mapping because failure assumptions cause
rapidly changing stages that alter flood wave motion.
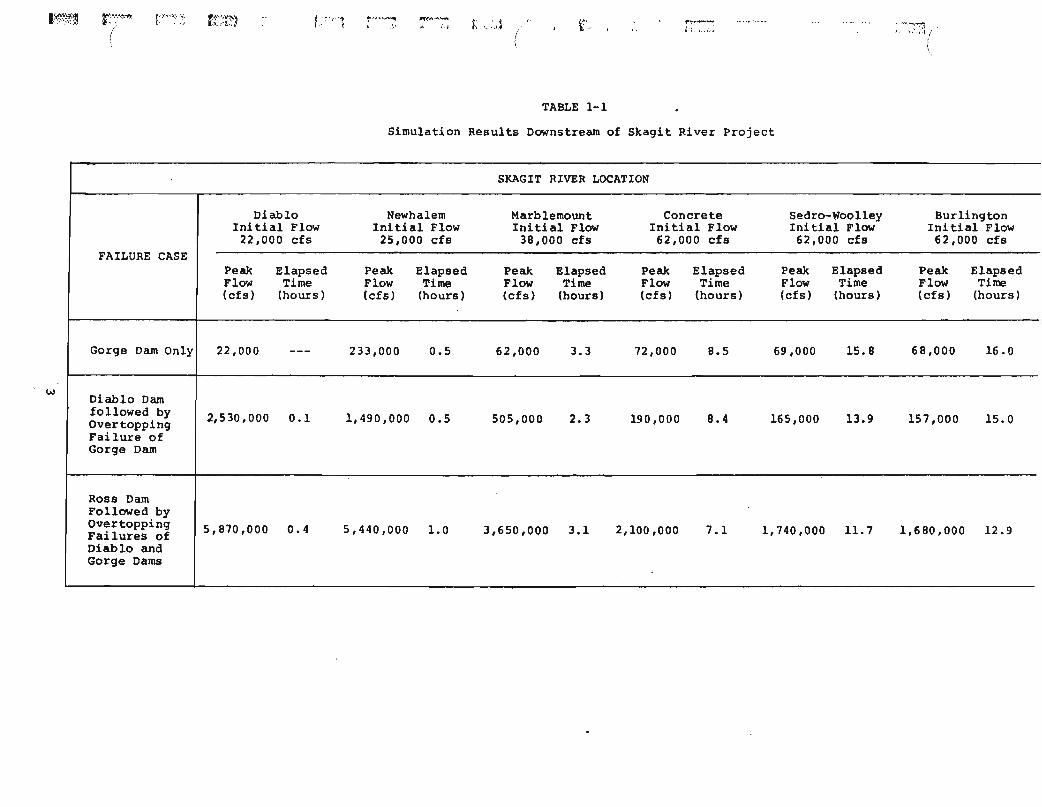
The inundation studies show that very large flows would result in
the Skagit Valley from the assumed failure of Ross, Diablo and
Gorge Dams. Failures of Diablo and Gorge cause less severeflooding. The failure of Gorge Dam alone causes flooding only
immediately below the dam. The maximum discharges for each case
are shown in Table 1.1. Note that for the Gorge Dam failure the
increase in the maximum discharge at Concrete is caused by the
increase in natural or "base" river flows as the drainage area of
the watershed increases.
2
I.~~*~ r.-....'.~"'"/
r:::"':';'~~ rt:::'i:~~ t" ""'1f"/ ,.""~
....-:-....-....\.I.. ".j K ..,,:J ( ~~.
to·
TABLE 1-1
,...~-
~.:. '" ,.', ::'~... ~;:J
w
Simulation Results Downstream of Skagit River Project
SKAGIT RIVER LOCATION
Diablo Newhalem Marblemount Concrete Sedro-Woolley BurlingtonInitial Flow Ini tial Flow Initial Flow Initial Flow Initial Flow Ini tial Flow
22,000 efs 25,000 efs 38,000 cfs 62,000 efs 62,000 cfs 62,000 efsFAILURE CASE
Peak Elapsed Peak Elapsed Peak Elapsed Peak Elapsed Peak Elapsed Peak ElapsedFlow Time Flow Time Flow Time Flow Time Flow Time Flow Time(efs) (hours) (cfs) (hours ) (efs) (hours) (cfs) (hours) (efs) (hours) (efs) (hours)
Gorge Dam Only 22,000 --- 233,000 0.5 62,000 3.3 72,000 8.5 69,000 15.8 68,000 16.0
Diablo Damfollowed by 2,530,000 0.1 1,490,000 0.5 505,000 2.3 190,000 8.4 165,000 13.9 157,000 15.0OvertoppingFailure ofGorge Dam
Ross DamFollowed byOvertopping 5,870,000 0.4 5,440,000 1.0 3,650,000 3.1 2,100,000 7.1 1,740,000 11. 7 1,680,000 12.9Failures ofDiablo andGorge Dams
c·
... ';'
t··j ... ,
~
I :i:1 :.. ~
r-<.;....i· -:
;.-.'
The flow produced by the failure of Ross Dam is several times
larger than the maximum observed historic flood at Sedro-Woolley
(220,000 cfs, November 30, 1909). At Sedro-Woolley the maximum
historic flood produces a maximum water surface elevation of 50
feet, while the maximum dam failure discharge of 1,740,000 cfs
produces a maximum stage of 75 feet at the same locat-ion. The
flooding between Sedro-Woolley and Puget Sound from the Ross;
Diablo and Gorge inundation case would be greater than that mapped
by the Corps of Engineers for a standard Project Flood (Corps of
Engineers, 1967). Levees protecting urban settlements and farm
lands between Sedro-Woolley and Puget Sound wo~ld be expected to
fail, and low lying urban centers like Burlington would be
flooded •
However, the inundation flood in the lower Skagit Valley is not a
sudden, high velocity "wall of water". It is more similar to a
flood caused by rainfall or snowmelt, and it occurs 7 to 11 hours
after the hypothetical catastrophe at Ross Dam. The significant
results of the inundation analysis that are useful in planning
warning systems, are the lengths of time before flooding occurs in
downstream communities. For example, for the failure of Ross;
Diablo and Gorge Dams, the elapsed time before the Skagit River
reaches flood stage at Concrete is 3.5 hours. This "warning-time"
would be very important in an actual emergency.
4
I-
2.0 INTRODUCTION
This report summarizes Hydrocomp's study of the Skagit River
Project (FERC Project #553), conducted for the Seattle City Light
Department as part of their Emergency Action Plan (EAP) for the
Federal Energy Regulatory Commission (FERC). The study included an
inspection of the Skagit River System and an analysis of the
movement of the flood waters following assumed failures of the
Ross, Diablo and Gorge Dams. Results of the study do not in any
way reflect upon the structural integrity of the dams, and are not
to be construed as such. The dams are considered to fail in order
to study the effects, only for the purpose of emergency action
planning.
2.1 The Skagit River System
The Skagit River Project consists of 1) the Ross Development
Ross Dam, which is a 540 foot concrete ~ravity arch dam, 2) The
Diablo Development - Diablo Dam, which is a 389 foot concrete arch
dam, and 3) The Gorge Development - Gorge Dam, w~ich is a 300 foot
concrete gravity arch dam. All three are on the Skagit River.
The reservoir behind Ross Dam is Ross Lake. Below Gorge Dam, the
Skagit River flows in a narrow canyon for 15 miles to Marblemount.
The Skagit River broadens at Marblemount and flows through a one
to three mile wide alluvial valley for 50 miles. It is joined by
the Cascade, Sauk, and Baker Rivers before reaching the wide, flat
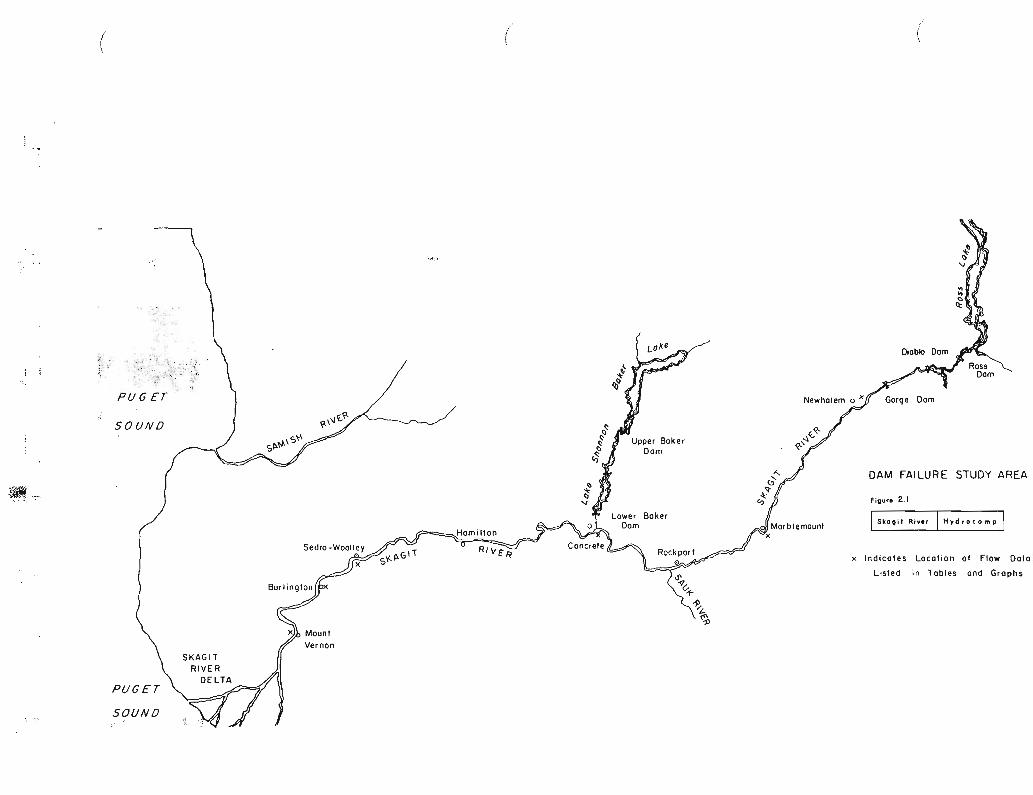
Skagit Delta, and ultimately Puget Sound. Figure 2-1 shows the
Skagit system and the locations referred to in this report for
discharges and water surface elevations.
5
.~
~
(\,
-,
SOUND
PUGET
SOUND.;"
-',1',"
( (
DAM FAILURE STUDY AREA
Figure 2.1
ISkagit River IHyd,ocomp I
x Indicates Location of Flow Data
Listed in Tables and Graphs
2.2 FERC Guidelines and Criteria
The requirements for EAP's established by the Federal Energy
Regulatory Commission recognize that every darn runs at least some
risk of failure. As a result, the owner of any water impounding
structure whose failure could endanger life or property, is
required by FERC order #122, Part 12, Subpart Emergency Action
Plans, to prepare an EAP.
1'. ~"In a
might
would
nutshell, the FERC process is designed to find out what
happen, what problems would arise, what people or property
be affected, and what can be done about it" (Kopfler, 1980).
This study will aid the City of Seattle in their preparation ofL..a the EAP for the Skagit Project. In accordance with FERC guidelines
the most probable modes and causes failures were identified, and
the area affected by the largest of these failures was delineated.
2.3 Failure Causes
The causes of sudden releases of water from the Ross, Diablo or
Gorge Developments are assumed to be massive earthquakes or
landslides. Because the foundations for these darns are rock, the
piping or erosive failures that are assumed for safety studies of
earth darns are not pertinent for the Skagit River Project. The
intent is to assume a "worst case" catastrophe, so partial
failures of the darns are not considered. Partial failures or
slowly developing failures are not considered appropriate for
concrete arch darns, since any loss of structural integrity would
result in a rapid collapse of most of the darn structure.
~.>_.
6:.:,:.:',,:.:*'ci
-
The failure modes assumed for the Skagit River dams are the same
as were used in prior FERC studies of concrete arch and gravity
dams (Hydrocomp, 1974 and 1981). These failure causes are:
- a sudden loss of structural integrity, most likely due to a
massive earthquake in the Skagit River Valley, or
landslides sufficient to cause excessive overflow depths
(50 feet or more) at the dam sites, which are then assumed
to result in a failure of the structure, or
a failure at Ross or Diablo Dams, which results in excessive over
flow depths at downstream dams, leading to an assumed failure.
For practical purposes, an earthquake induced failure or
landslide- induced failure at a project have the same effect. In
each case the dam is assumed to be removed over a 60 second
timespan. In fact if a dam is removed in 30 or 60 seconds, or in
2, 5, or 10 minutes, the failure produces nearly the same
discharges in the Skagit River Valley.
There are no identified spillway, foundation, abutment, or
operational deficiences at any of the dams in the Skagit Project.
With no known unsafe conditions, the failure causes described
above were found by asking the question, "If the dams were to
suddenly fail, what would be the most likely cause?" Earthquakes
and landslides on a massive scale sufficient to cause dam failures
are in fact highly improbable. They are simply judged to be more
likely than other catastrophies like meteor strikes.
7"
,i .
~. -
~ ..:.
2.4 Contents of the Report
Section 3.0 describes the Full Equations (FULEQ) software system
used in this study and recounts the specific techniques and
assumptions used to define the dam failure problem. The use of
topograghic data and the description of the system for use by the
computer program are detailed. For those interested in the method
of analysis used in FULEQ, a brief discussion of the flow routing
process is given in Appendix A.
Section 4.0 is a discussion of modes of failure for the dams of
the Skagit Project. The next section (S.O) presents the results of
the computer simulations. The movement of the flood waves are
described as they pass through the channel system. Section 6.0
contains the study conclusions.
8
,i..o;
-
3.0 FULEQ SOFTWARE AND THE SKAGIT RIVER SYSTEM
The principles of long wave motion in open channels and the method
of characteristics have been used as the basis for Hydrocomp's
FULEQ computer system. A discussion of the underlying principles
used to construct the program, and of the assumptions made in
FULEQ, is presented in Appendix A. The FULEQ system consists of 62
subprograms and 4 separate stand-alone programs, all written in
FORTRAN and operating on Hydrocomp's HP3000 Computer System.
FULEQ is a comprehensive model requiring an unusually detailed
description of the channel system. The major part of the model
deals solely with checking and interpreting the information used
to describe the open channel system.
3.1 Model Concepts and Terminology
In order to impart to the computer a precise description of the
channel system, a nomenclature and a set of conventions are
developed. A channel system or network is represented by channels
along which water flows, and by junctions where several channels
meet. Channels are normally much longer than their depth or
width, and so they may be thought of as being one-dimensional.
The error introduced by assuming that the only direction of flow
is parallel to the channel direction is small and may be corrected
for quite easily. The items of interest are the depth of flow and
the flowrate at each point in the channel. The depth of flow is
taken as the maximum depth, perpendicular to the assumed bottom
profile. The bottom profile is assumed because local
irregularities are considered as part of the roughness and not
part of the bottom profile. This assumption permits developing a
smooth bottom profile.
9
f\..
: ".
, .
r· :
< .;.
Naturally occurring lakes, as well as man-made lakes, may be
present in the network. There may bea variety of structures such
as bridge piers, siphons, weirs, dams, pumps, turbines, points
where water is taken out of the channel and pOints where water is
discharged to the channel. Allor part of the flow in a channel
may enter a closed conduit and flow under pressure for some
distance before it returns to an open channel. The network 6f
channels and/or closed conduits must have clearly established
boundaries or limits.
The limits of the channel network are established by conceptually
cutting various channels or closed conduits so that the network is
isolated from its surroundings. An external boundary point is
established at each place cut. The behavior of the surrounding
network at these points must be properly specified to analyze the
isolated system. Naturally enough, the conditions required at the
boundary points are called external boundary conditions or merely
boundary conditions.
These external boundary conditions are of two types: forced and
free. A forced boundary condition imposes either a flowrate or
depth as a function of time at the boundary point. The solution
must honor the given value of depth or flowrate. An example of a
forced boundary condition is the fluctuation of the water surface
caused by tides at the mouth of a river discharging into the
ocean. A free boundary condition specifies a relationship between
the depth and flowrate at the boundary point. Neither the depth
nor the flowrate is forced. The free boundary condition is
established in one of three ways. (1) A control structure may
provide the relationship, or (2) the flow in the channel may
naturally pass through critical depth near the boundary point, and
so a relationship may be assumed between depth and flowrate given
10
~..~,.t..-
r:1i ..
by the critical flow in the channel. (3) Frequently neither a
control structure nor a critical depth section is available at a
downstream boundary point. The relationship between flow and
depth must then be developed by other means.
3.1.1 Exterior and Interior Nodes
The representation of a complex channel network, so that the depth
and flowrate as a function of location and time can be determined,
is the next task. A cursory analysis of the physical principles
governing the flow shows that it is impossible to develop explicit
solutions for depth and flowrate in a general network. We must be
content with developing approximate solutions at selected points
along the channels and at selected points in time. Points along
the channel where a computation of the values of depth and
flowrate is needed are called nodes. There are two classes of
nodes: exterior nodes and interior nodes. These classes can only
be defined when the concepts of a branch and an interaction point
have been developed.
An interaction point is best defined by giving a series of
examples. A junction is an interaction point because flow from one
channel entering the junction may influence the flow
characteristics in the other channels entering the junction.
Interaction points also occur whenever there is a fixed
relationship estabished between flowrate and depth of flow in the
channel. An example would be the outlet works of a dam
controlling flow past the dam. An interaction point also occurs
whenever the point inflow or point outflow from the channel
depends on values of depth or flowrate or both in the channel. An
example of this interaction point would be a side-channel
spillway. Finally, interaction points are created at external
boundary points. Each branch will have a node at each end and
11
~ ." -:.
f;~ . ."
",,---"
f .
~
L
perhaps other nodes distributed over its length. The nodes at
each end are called exterior nodes, and the remaining nodes on the
branch are called interior nodes. A branch must always have
exterior nodes but does not have to have interior nodes.
3.1.2 Branches
The concept of a branch is very significant because every branch
is similar. A branch is simply a reach of channel which has been
artificially separated from the rest of the channel, in order to
study it. No special conditions exist for a branch and therefore
the system of equations written to describe the relationships
among the "depths and flowrates applies for every branch. Only the
number of equations will vary, with (2n-2) equations for a branch
with n nodes on it. The requirement for this similarity between
branches implies that sufficient interaction points are defined so
that the channels connecting these interaction points are in fact
similar." This requirement can be used to define interaction
points in terms of branches.
The relationship between exterior nodes and interaction points
needs explaining. Each interaction point must involve one or more
exterior nodes where at least one exterior node is on a" branch.
Exterior nodes serve as a linkage between the relationships which
exist among the variables at an interaction point and the
variables at the interior nodes of the branches connected to the
interaction point. The exterior nodes are viewed as belonging to
both the interaction points and to the branches. It is possible
to solve for the values of depth and flowrate at the exterior
nodes without knowing the values of depth and flowrate at the
interior nodes.
12
'...
The distinction made between interior and exterior nodes is
motivated by this possibility. In fact, the model user will
specify the relationships among exterior nodes in an exterior node
matrix. This specification will give the relationship between
exterior nodes and interaction points and indirectly the
relationship between branches. This approach gives the maximum
flexibility without unduly complicating the programming.
3.1.3 Control Structures
The description of control structures is the most troublesome
aspect of the system. A control structure has the following
general characteristics:
liS:i1- The device has input and side. arbitraryan an output An
distinction is imposed if a natural distinction does not
exist. The flow through the device is treated as positive'----
if its direction is from the input side to the output side.
;
> -
2. The control structure is assumed to be SUfficiently localized
so that neither changes in storage nor changes in momentum
within the control structure are significant. As a result,
the relationships for a control structure are steady state
relationships with the flowrate at both input and output sides
being equal at all times.
~~.~'.'-
3. The hydraulic characteristics of the device are determined in
one or more of the following ways:
a. depth at the input side (velocity may be needed in
some cases)
13
IL
~.... .~.
b. depth at both input and output sides (velocities may be
needed in some cases)
c. a variable setting of the device geometry.
No other details of the control structure are considered to be
significant. The input and output sides of a control structure
are normally associated with distinct exterior nodes. That is, a
control structure connects, at least in a conceptual sense, two
and only two exterior nodes. The depths and/or flowrates required
by the control structure are derived from the flow conditions at
the exterior nodes of the control structure. The flow through a
control structure is uniquely identified by requiring the flow at
one of the exterior nodes of the control structure to be the same
as the flow through the control structure.
3.2 The Skagit River System
In applying the nomenclature developed for FULEQ to the project
setting, our channel network consists of the Skagit River divided
into eight branches: three control structures, representing the
dams: and 193 interior nodes at 500 to 5000 foot intervals. The
eight branches were defined as follows:
1) Ross Lake Length equals 23 miles, divided into 45
interior nodes. Downstream control is a stage vs.
discharge control structure, upstream control is a
discharge vs. time curve.
14
.-
I. •
.-:; -,
-
2) Diablo Lake Length equals 4 miles, divided into 23
interior nodes. Downstream control is a stage vs.
discharge control structure, upstream control is the
discharge vs. time curve of the outflow from Branch 1
(Ross Dam).
3) Gorge Lake Length equals 5 miles, divided into 12
interior nodes. Downstream control is a stage vs.
discharge control structure, upstream control is the
discharge vs. time curve of the outflow from Diablo Dam.
4) Skagit River from Gorge Dam to Newhalem - Length equals
three miles, divided into 13 interior nodes. Downstream
control is provided by an equality of elevation and
discharge with the upstream Exterior node for Branch 5.
Upstream control is a discharge vs. time curve for the
outflow from Gorge Lake.
5) Skagit River from Newhalem to Bacon Creek - Length of
channel is 11 miles. Divided into 22 interior nodes.
Downstream control is an equality of discharge and
elevation with the upstream exterior node of Branch 6.
Upstream control is the discharge vs. time curve of the
outflow from Branch 4.
6) Skagit River between Bacon Creek and Rockport - Length
equals 15 miles, divided into 14 nodes. Downstream
control is an elevation and discharge equality. Upstream
control is the discharge vs. time outflow from Branch 5.
15
7) Skagit River between Rockport and Baker River confluence
Length equals 12 miles, divided into 13 interior nodes.
Downstream control is an elevation and discharge equality
with Branch 8, upstream control is the time vs. discharge
from Branch 6.
8) Skagit
channel
River Downstream of Baker Confluence - Length of
is 37 miles. Divided into 38 interior nodes.
..L.
,iL
nI·,.;.
Downstream control is an elevation vs. time curve
representing the flooding behavior of the Skagit Delta •
Upstream control is an equality of elevation and discharge
with Branch 7.
3.2.1 Cross Section Computations
Cross sections for Ross, Diablo, and Gorge Lakes, and for the
Skagit River upstream of its confluence with the Sauk River were
prepared by Centrac Associates, Inc, of Seattle. Centrac
performed field surveys and utilized existing detailed contour
maps to produce cross sections of the flood plain and reservoirs.
Cross sections for the Skagit River downstream of the Sauk were
prepared by Hydrocomp as part of the Darn Failure Inundation study
of the Baker River Project (19Bl). 'These sections were calculated
from the Department of Natural Resources, 1 inch=lOOO feet scale
topographic maps, with some additional detail provided by the
Corps of Engineers' 1967 "Flood Plain Information Study" and the
1972 "Flood Insurance Study". As with Centrac's cross sections,
these three sources provided good data on the flood plain, but
were not as. helpful in delineating the detail of actual in-channel
cross sections. A fairly uniform low-flow channel shape was
assumed, interpolating between the three channel cross sections
available on the Skagit. In order to smooth the simulation of the
recession limb of the flood hydrographs, this low-flow channel was
16
,It . .;
added to each cross section. This smoothing of channel cross
sections will not affect the accuracy of flood routing results
because the low flow channel is full at all times in the
simulation and because it represents such a small part of the
entire flood flow channel. This smooth low flow channel does
however aid the simulation by smoothing the numerical analysis of
the recession limb of the flood hydrographs.
·3.2.2 Control Structures and Boundary Conditions
The specification of boundary conditions and control structure
curves required a number of assumptions. Starting at the upstream
end of Branch 1, a constant inflow to Ross Lake of 15,000 cfs was
assumed. The FULEQ program requires that water be flowing in each
branch at all times. While this inflow value is high, it was
necessary in order to provide a high discharge to the -Skagit
River. The initial discharge is not significant when compared
with the magnitude of dam failure flows. The discharge from Ross
Dam was also assumed to be 15,000 cfs, to provide a steady state
condition. The initial water surface elevation of Ross Lake was
assumed to be at the normal full pool level of 1602.5 feet. This
corresponds to an initial storage of 1,425,000 acre feet. In
calculating the stage versus discharge control structure curves
for the failed dams, critical velocity was assumed at the dam
sites.
Diablo Dam was assumed to have an initial inflow of 15,000 cfs
from Ross Dam , plus an additional 3,000 cfs from Thunder Creek.
The lake was assumed to be at full pool with an elevation of 1205
feet and a storage volume of 89,000 acre feet. The dam control
structure was assumed to be passing the 18,000 cfs inflow. The
spillway gates were not moved during the simulation, although test
runs indicated that gate movement would not affect the simulation
17
h·.·.
r·!\: ..
results. The control structure curve for the dam was computed
based on the "Diablo Dam Spillway Discharge Curve" from the "Ross,
Diablo and Gorge Spillway Adequacy Investigation" (1973), and by
using a sharp crested weir equation (C=3.28) for overtopping
discharges.
The initial inflow "to Gorge Lake was assumed to be 20,000 cfs;
18,000 cfs from Diablo and 2,000 cfs of local inflow. The water
level was at the normal full pool level of 875 feet. The initial
storage was 8500 acre feet. The spillway gates were assumed to be
opened 6 feet and were not moved during the simulation. The
control structure curve was based on the "Spillway Adequacy
Investigation" and a sharp crested weir formula for overtopping
discharges. Initial outflow was equal to 20,000 cfs.
In choosing initial discharge values for the reaches of the Skagit
River, the intent was to use flows which would be large enough to
make the simulation numerically stable and would reduce the
effects of unknown variations in the low flow channel. These
initial flows improve the stability of the simulation and allow
the delineation of maximum probable failure caused flooding. The
initial discharge values assumed were:
Skagit River at Newhalem 25,000 cfs
Skagit River at Bacon Creek 28,000 cfs
Cascade River at Marblemount 10,000 cfs
Sauk River at Skagit River 22,000 cfs
Skagit River at Concrete 62,000 cfs
These initial values represent flows that might be observed once
every year or two. Although the initial" flows are high, they
18

, ,I .
i-f- .
iIl •
<!. -..
represent less than five percent of the peak failure-caused flows
and do not affect the accuracy of the results.
At the lower end of the Skagit River, the downstream stage vs.
time curve was calculated to simulate the effects of the flooding
of the Skagit Delta, up to the height of the eight foot sea dikes.
The intricacies of the overland flow runoff pattern and the
variable location of river dike failures makes precise simulation
of flood wave movement impossible in this delta area.
19
;..'
-e .-
4.0 FAILURE MODES STUDIED
The three dams of the Skagit Project are modern concrete arch
structures, designed and built to survive all foreseeable
circumstances. Regular maintenance and inspection are provided to
insure that no unsafe conditions develop. Periodic FERC Safety
Inspections have revealed no unsafe conditions and no reason to
suspect that any portion of the structures or foundations are
potential sources of weakness. If a potential weakness had been
identified in structural analyses of any of the dams, the failure
simulation could hypothesize an initial failure of that weak link,
leading to a progressive failure of the entire structure. With no
identified site specific hazardous conditions, the failure modes
used for this study were formulated based upon historic
occurrences of dam failures and the use of engineering judgement.
4.1 Historic Darn Failures
There have been only two major historic concrete arch dam
disasters, only one of which resulted in failure. In 1959 the 200
foot high Malpassat Dam in southern France experienced an abutment
failure which resulted in the very rapid destruction of more than
two-thirds of the darn's structure. The cause of the failure was
determined to be weak layers of rock in the foundation of the left
abutment. The only early warning. was an increase in seepage down
stream from this abutment several days before the collapse. The
failure of the dam took just a·few seconds.
In 1963 the reservoir behind Vaiont Dam experienced a tremendous
rockslide which displaced 90% of the 97,000 acre feet of water in
the reservoir. The resulting wave overtopped the 869 foot high
20
f '
-
thin arch dam by 330 feet. Though subjected to extreme stresses,
the dam did not fail. Severe damage and loss of life occured
downstream since most of the reservoir volume was forced out over
the dam.
Incidents similar to these which have occurred at concrete gravity
dams indicate that whether the cause of the failure is the
movement of an abutment or foundation or a failure of some part of
the structure, the resulting collapse usually involves most of the
dam structure and takes place in less than 10 minutes.
4.2 Specific Project Information
The Draft Report on the 1981 FERC Safety Inspection concluded that
all three dams and their foundations were "adequately stable under
static and seismic loading conditions". There were determined to
be no geologic hazards at the sites or near the reservoirs which
would affect the safety of the structures. Maintenance and
operations were reported to be satisfactory. This section draws
heavily upon that Safety Inspection Report.
4.2.1 Ross Dam
Ross Dam was completed in 1949 to a height of 540 feet. The dam
is situated in a glacial canyon carved in Skagit granite-gneiss.
The dam has two chute spillways with a design capacity of 127,000
cfs. The dam was designed to be raised beyond its current crest
elevation of 1615 feet.
The foundation for Ross Dam is massive, sound granodiorite and
gneiss. Minor shear zones were treated during construction and a
deep grout curtain was installed.
21
The slopes above Ross Lake are
of major landslide activity.
observed in the area since 1965.
4.2.2 Diablo Dam
tree-covered and exhibit no signs
No seismic activity has been
ii
,.
The 389 foot high Diablo Dam was completed in 1930. The dam's
lower sections are sited in a steep granite-gneiss canyon. The
upper portion spreads out onto a glacially scoured valley. The
predominant foundation rock is Skagit granite-gneiss. Spillways on
both abutments have a total capacity of 97,340 cfs.
The 1981 Safety Inspection revealed no hazards from avalanches or
rockslides from the hills above Diablo Lake or from earthquake
loadings.
4.2.3 Gorge Dam
Gorge Dam is 300 feet high and was completed in 1961. The
spillway is on a gravity section of the left abutment and has a
capacity of 145,000 cfs. The predominant foundation rock is
granite-gneiss. During construction, all weathered rock was
removed and a grout curtain and drain system were installed.
Some small snow and rock avalanches have occurred along the banks
of Gorge Lake, but no signs of major landslide movement have been
observed.
22
':--.-
! .1l
r":L
:..;
L',-"
4.3 Modes of Failure - Skagit project
The failure modes assumed in this study were an attempt to
simulate the rapid or instantaneously developing collapse
documented in most historic failures of concrete dams. For the
simulation, the reservoirs were assumed to be full, with a
constant flow through the damsite, when the dam was uniformly
removed over a 60 second time span. Flow through the damsite was
assumed to be at critical depth throughout the simulation, with
the depth of flow at the damsite controlling the discharge.
This mode of failure is most like that of an earthquake-induced or
foundation failure type of collapse. The simulation of a slowly
developing collapse was not performed since this type of failure
was not deemed appropriate for this type of dam. A partial
collapse of a dam or dams was not simulated since FERC inundation
maps require "worst case" results and because a partial failure of
an arch dam is less likely than a failure involving more than 50
percent of the dam structure. Also, during an actual failure
emergency, there is no way of knowing that an impending failure
will be slowly developing or will only involve part of the
structure. Thus any failure must be assumed to be the "worst
case" condition.
The inundation maps are not sensitive to the precise mode or
timing of failure assumed at the projects. Inundation maps and
elapsed times for the floods to reach points in the Skagit Valley
are relatively independent of failure modes. For example if a
landslide displaces the contents of Ross Lake in 60 seconds, or in
300 seconds, the timing and peak of the flood at Sedro-Woolley are
unchanged.
23
-'''---
; ."
... .-
,..-.-
The situation of the three dams in series defined the four
possible combinations or modes of failure, namely:
1. Failure of Gorge Dam.
2. Failure of Diablo Dam, which would cause Gorge Dam to fail.
3~ Failure of Ross Dam, which would cause Diablo and Gorge to fail
4. Failure of all three of the dams, simultaneously.
The initial simulation of case 4, a simultaneous failure of all
three dams was performed, and the results were found to be nearly
indistinguishable from the results of case 3. Therefore the
simulation of this failure mode was not continued.
The remaining three failure modes were simulated to-conclusion,
i.e., until streamflows had returned to their base conditions
throughout the Skagit River •
24
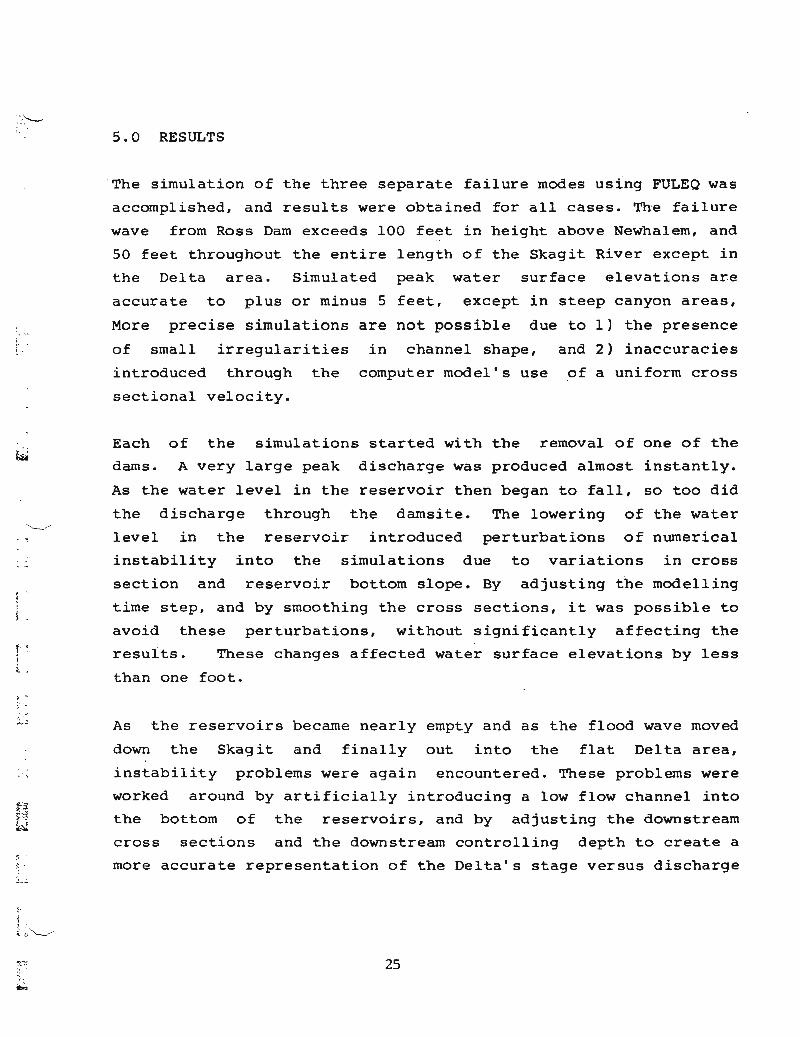
5.0 RESULTS
-The simulation of the three separate failure modes uS1ng FULEQ was
accomplished, and results were obtained for all cases. The failure
wave from Ross Dam exceeds 100 feet in height above Newhalem, and
50 feet throughout the entire length of the Skagit River except in
the Delta area. Simulated peak water surface elevations are
accurate to plus or minus 5 feet, except in steep canyon areas,
More precise simulations are not possible due to I) the presencej- '-,
L.·· of small irregularities in channel shape, and 2) inaccuracies
introduced through the computer model's use of a uniform cross
sectional velocity.
! 1.
> •
:; - .
i ..r· ;>"''-'"
Each of the simulations started with the removal of one of the
dams. A very large peak discharge was produced almost instantly.
As the water level in the reservoir then began to fall, so too did
the discharge through the damsite. The lowering of the water
level in the reservoir introduced perturbations of numerical
instability into the simulations due to variations in cross
section and reservoir bottom slope. By adjusting the modelling
time step, and by smoothing the cross sections, it was possible to
avoid these perturbations, without significantly affecting the
results. These changes affected water surface elevations by less
than one foot.
As the reservoirs became nearly empty and as the flood wave moved
down the Skagit and finally out into the flat Delta area,
instability problems were again encountered. These problems were
worked around by artificially introducing a low flow channel into
the bottom of the reservoirs, and by adjusting the downstream
cross sections and the downstream controlling depth to create a
more accurate representation of the Delta's stage versus discharge
25
F!:-L-
-'''--- -
}~' .
f ;f .~ .
relationship. Problems resulting from decreasing slope of the
channel bottom were resolved by breaking the Skagit River into
five separate branches.
Though these adjustments may affect certain minor aspects of the
results slightly, most of their influence is confined to the
recession limb of the flood hydrograph {in the case of the
reservoir adjustments} or to the far downstream area of the
simulation where the complexities of dike failures and overland
flow make precise simulation impossible. Despite these
difficulties, good simulation results, within the stated accuracy
of five feet for peak water surface elevation, were obtained for
all three failure modes.
5.1 Gorge Darn Failure Only
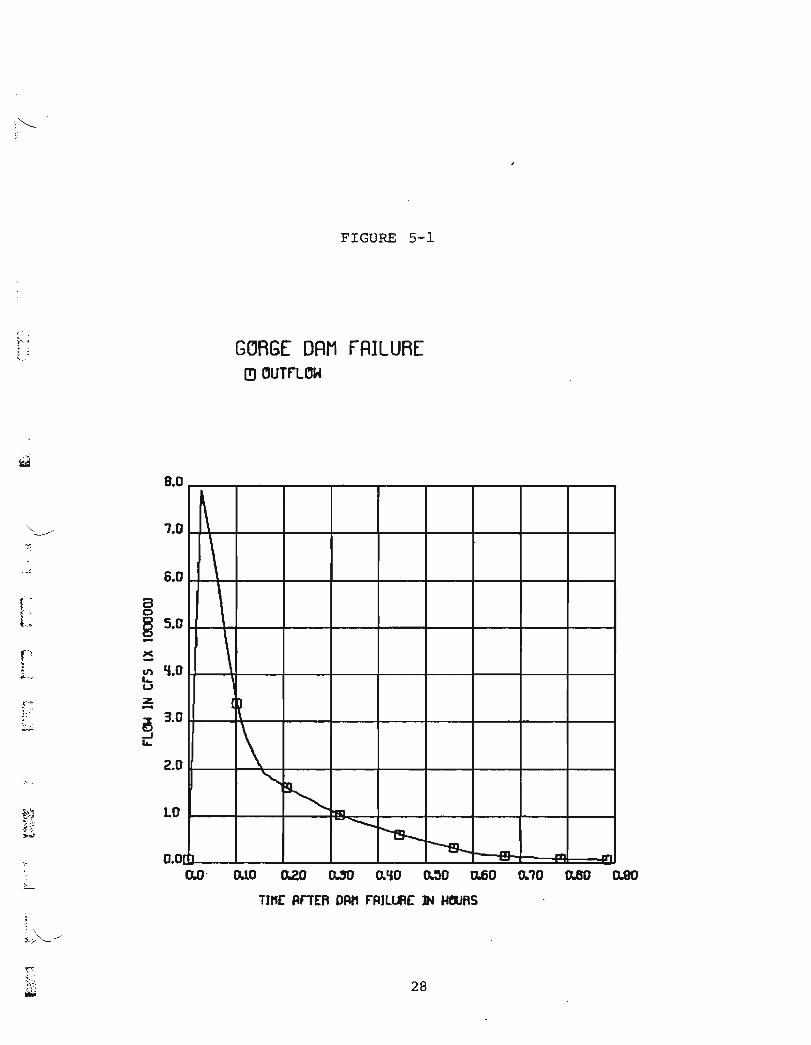
The initial elevation of Gorge Lake was 875 feet, corresponding to
a storage of 8,500 AF. Discharge from the dam was 20,000 cfs. The
dam was totally removed from the site in a 60 second period,
beginning at time=O. Within 30 seconds the discharge through the
dam site had reached 600,000 cfs. Peak outflow occurred 60
seconds after the failure began, with a discharge of 790,000 cfs.
The water level at the dam site fell rapidly for the first 60
seconds, reaching an 830 foot stage. This negative wave
propagates upstream rather more slowly, taking almost twenty
minutes to lower the water surface four miles upstream.
As the water level at the dam site falls, the discharge also
decreases rapidly. Within 20 minutes after dam failure, the
discharge has fallen below 100,000 cfs. By this time 90 percent
of the reservoir volume has flowed out. The reservoir is
26
:.: .l
I· .~
l .
t-I
l.
~...
, .
. f~i:: ~..~
effectively empty, 30 minutes after failure. Figure 5-1 is the
discharge vs. time curve for the failure of the Gorge Dam. Figure
5-2 is the stage vs. time curve.
The outflow from the failed Gorge Dam enters the steep canyon of
the Upper Skagit River and moves rapidly downstream. The front of
the flood wave reaches Newhalem, wi thin ten minutes of the dam
failure. The water level at Newhalem rises 18 feet in the first 5
minutes of the wave I s passage. The peak discharge at Newhalem
following the failure of Gorge Dam is 233,000 cfs. This is
significantly higher than the Probable Maximum ~lood, and major
damage would be expected.
The flood wave continues on down the Skagit, slowing down and
decreasing its peak discharge as the channel becomes wider and
less steep. The relatively small volume of water in the flood
gives it little ability to resist the attenuating effects of
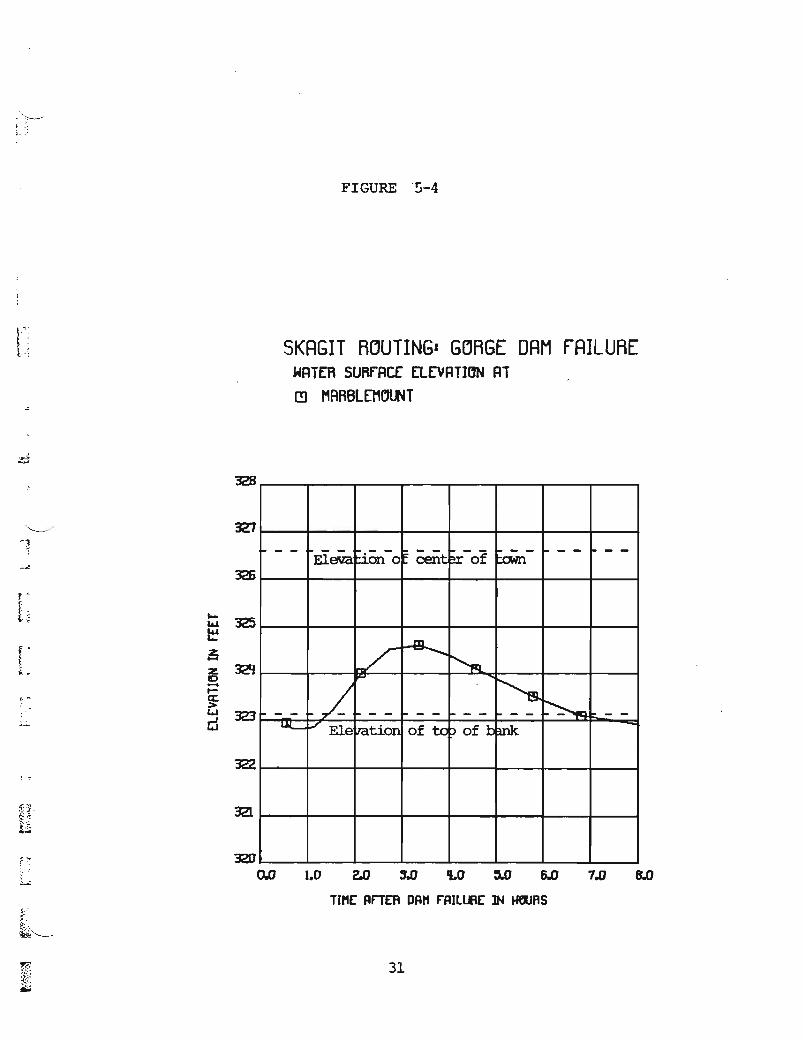
routing. The wave reaches Marblemount one and a half hours after
the failure and reaches a peak flow of 62,000.cfs at a time=3
hours. The dam-break wave produces only a two-foot increase in
stage at Marblemount.
The flood wave continues to dissipate rapidly. The peak flow
causes only a one foot rise in water surface elevation as it
passes Concrete. The discharge vs. time and water surface
elevation vs. time curves for the routing of the Gorge Dam failure
wave are shown in Figure 5-3 and 5-4.
27
,"-...... .. "
~- .
FIGURE 5-1
,i ..,0.'~. .~ ;"." :
G~RGE DAM FAILURE[!) CJUTfLOW
~
\,
\[~
\'"~~ .--.
1'5-.~r, - - ...
1.0
LO
2.0
0.0OJ) D.lO o.zo ~ 0.1I0 (C)O 0.60 0..10 0.80 o.eo
TInE: f'nER Df'n F"f'JllflE: IN faJRS
6.0
8.0
x-
~ 3.09.....
en '1.0&..U
Z-
ao§ 5.0-
f"L
(
;\--/
28
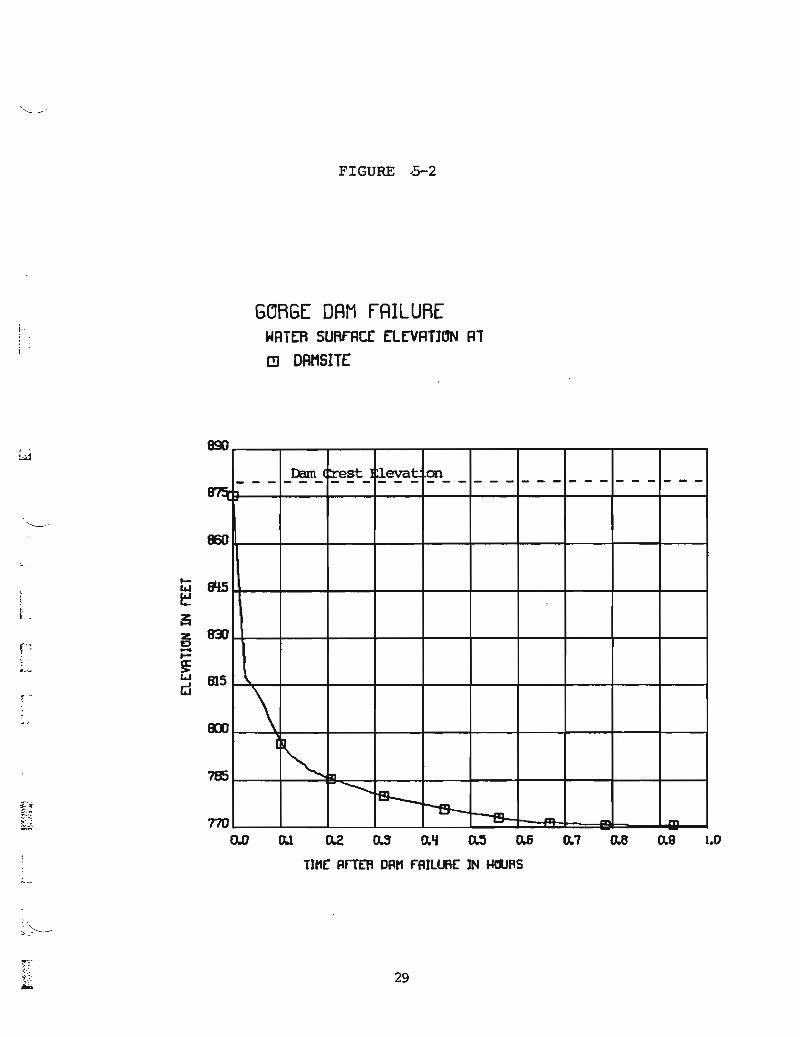
FIGURE ,5-2
GORGE DAM fAILUREWATER SURF"Acr ELrVRTlCJN Rl
[!) DAtlSITE
B90
Dam (~e~_ ~~~ on- - - - - - - - - - - - - - - - - -~
860
sti5
83)
815
ED) \785
I~in
~ ffzL.._~
no --A:I.. - - .....
...."
....,~
I 3z.
P D-:' .-~&..I
! " d;
M ~ ~ ~ M ~ ~ ~ M M W
T1t1C ArrEfi OAt1 F"AILlI\C IN IeJRS
;'~ ..
29
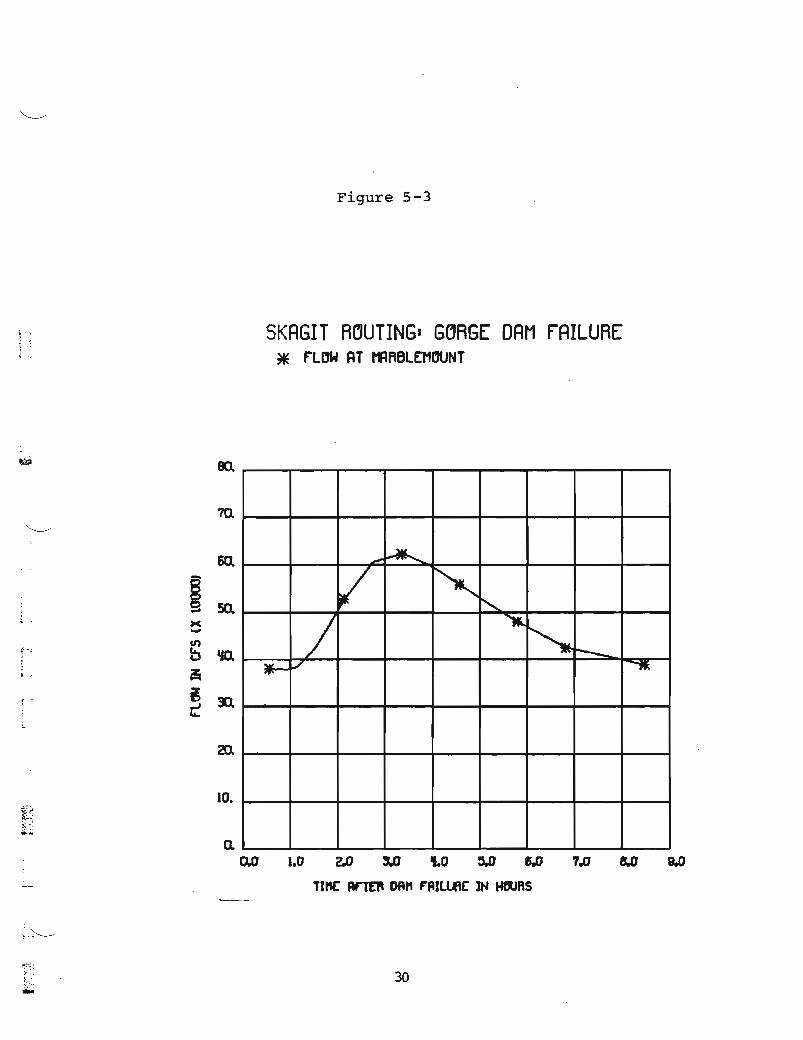
Figure 5-3
SKAGIT ROUTING· GORGE DAM F"AILURE* rLOW ATmRBL010UNT
--...V ~
~
/ ....."- -¥- ,/ ""'fl
0.~ ~ ~ ~ ~ ~ ~ ~ ~ ~
TIft[ AnD OfU1 F'~IWtC ltI wrlJAS
30
~ :: .:.
!-.t.
328
327
326
~
32S....~
:;z 321110....~a:>&oJ 323d
322
321
FIGURE -!)-4
SKAGIT RDUTINGa GDRGE DAM FAILUREWATEA SURfACC ElEVATION ATI!J MARBlEMMT
~ - - EleW ~.- - ;; - - ~ - - -- - - - - -- -l:ion 0 cent~ of town
...lIl
V -.....~....
'--s./ ~- - .. - - - - - - - =. - -UL- v Ele~tion of to ::> of 1:: mk
v
~,~
320M W W ~ ~ ~ ~ W M
Tlrt£' flrTEA Dfl" F"flIllfl£' IN l8JAS
31
,..j.:f····
t\
\.: ..
! ..
iL
I:I .~.. .~ .:
!".,'
,.~:;--.
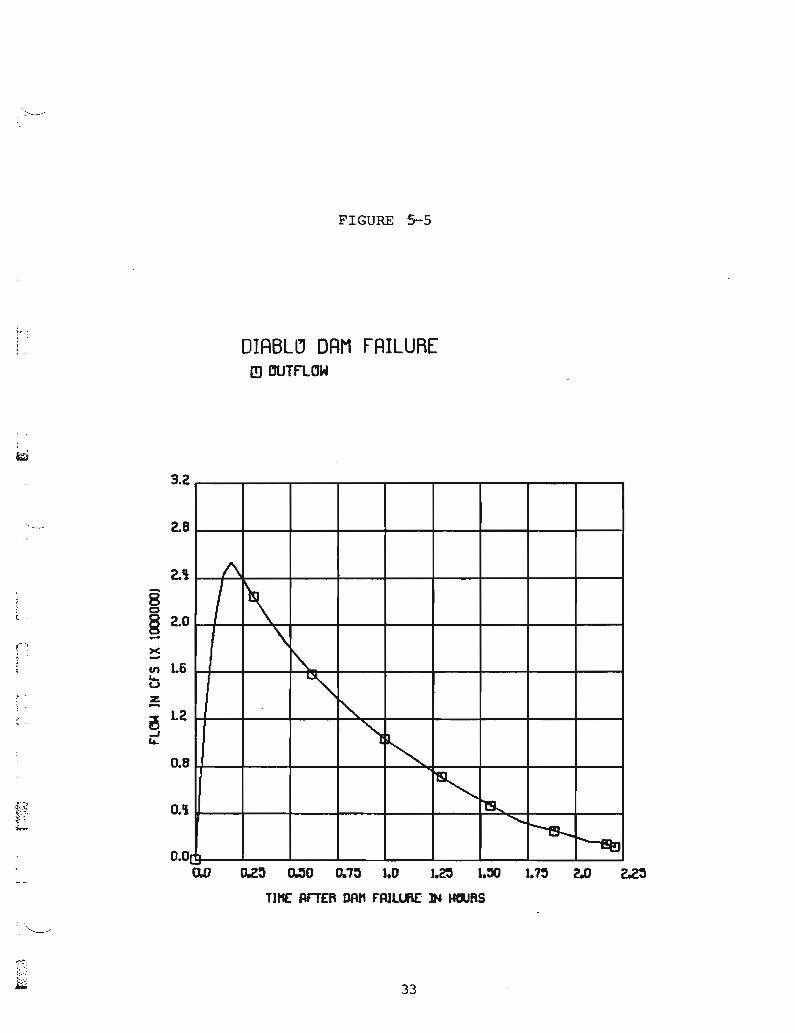
5.2 Diablo Dam Failure
The simulation of the failure of Diablo Dam began with the
reservoir at an elevation of 1,205 feet and an outflow and inflow
of 18,000 cfs. The dam was completely removed from the channel
over a 60-second period and 89, OOO-acre feet of water in storage
was allowed to flow out. Within 30 seconds, the outflow has
increased to over 400,000 cfs. After 90 seconds, it is over one
million cfs. Five minutes after failure, the peak outflow of 2.5
million cfs is reached. The water level at the dam site has
fallen to 1,160 feet and the water surface is lowering throughout
the reservoir. The outflow remains above a million cfs for almost
60 minutes, by which time nearly 70, OOO-acre feet of water have
flowed out. The complete emptying of Diablo Lake takes about
90 minutes. The outflow hydrograph and stage vs. time curve for
the failure of Diablo Dam are shown in Figure 5-5 and 5-6.
The large outflow from Diablo Lake flows directly into the
upstream/ end of Gorge Lake. The wave causes an immediate rise in
the stafe of the upstreawm end of the lake, and continues to move
down toward the dam. A number of smaller surface saves move
through Gorge Lake, but the first major change in stage at Gorge
Dam is observed 6 minutes after Diablo's failure. The water level
at the dam rises rapidly from its initial 875 feet. The parapet
wall at 884 feet is overtopped almost immediately. Nine minutes
after Diablo Dam fails, Gorge Dam is over-topped by more than
50 feet, and it is assumed to fail. This failure is simulated in
the same manner as was described previously. The dam is
completely removed from the site in 60 seconds, beginning at
time=9 minutes.
The failure of the overtopped Gorge Dam creates an immediate
outlfow of 1.5 million cfs. At this time there is still over 2
32
..:--~.
FIGURE 5-5
DIABL~ DAM FAILURE(!) OUTflOW
A
I 1\\~
~"'-
)~ ,
19...--.......r-s-
I:t!l0.00.0 o.z:) MO 0.7:) 1.0 1.~ 1.:JO 1.'rn UJ 42:)
11"( RrTEA DR" fRJlll\E IN HClIAS
0.'1
0.8
l2~4.
2.'1
2.8
3.2
><-en l6~uz-
8o§ 2.0-
~ .
il .
(-,
,
.. :'-----...--
33
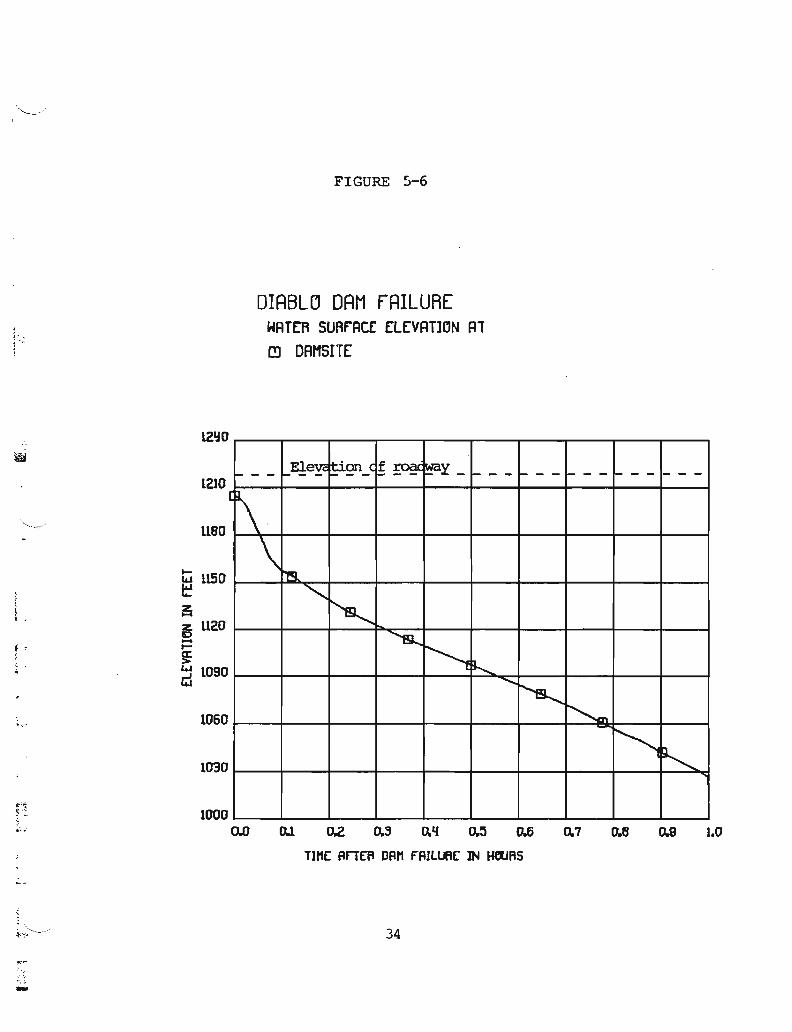
FIGURE ~-6
DIABL~ DAM fAILUREWATER SUArAC£ ELEVATION Al[!) DAMSITE
_E!eyc ~2fl_c fr.-
y -- - - - - - 1--- r.--- - - - - - - - - -1\
\'l'q
.........~
"s...~~
.........
~~-~
"
l21j0
SIll
1210
' ..'-...- .. '
1180
....11504J
, ~~
~,I.
z 1120D....
f • t-, a:
>"
w 1090d
"'..-- 1060
10'30
1000M ~ ~ ~ M M M ~ M M W
TJtU: Fln~ DFlt1 fFltllftE :IN Hl'lJAS
34
-
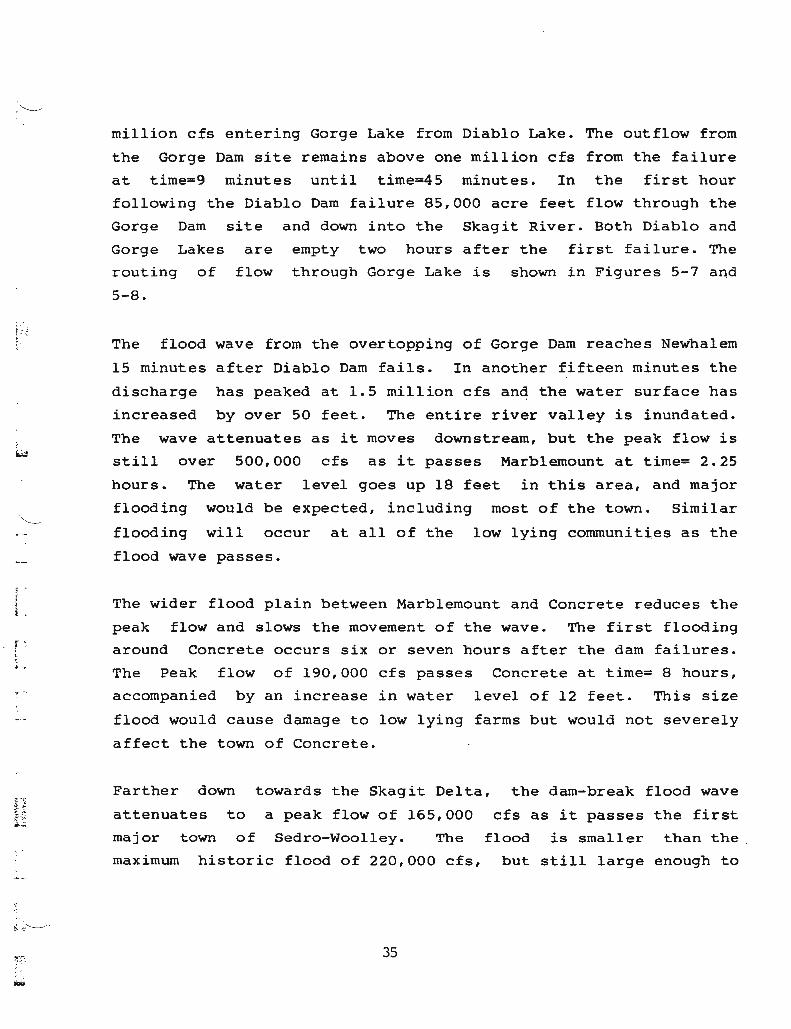
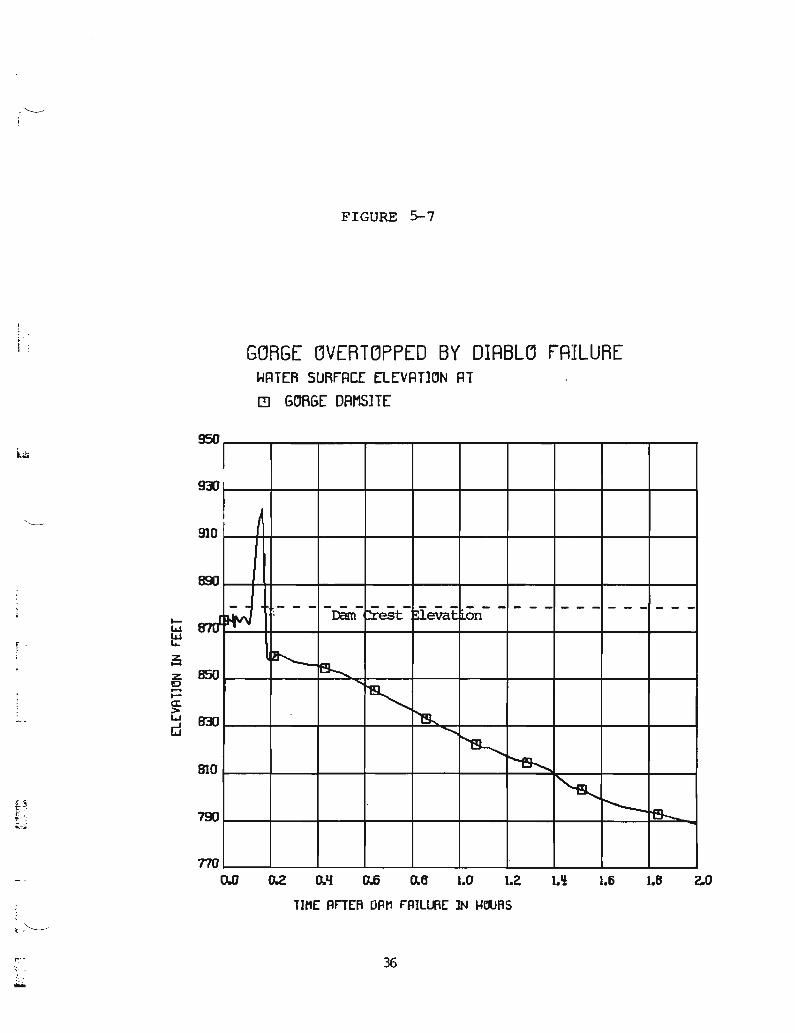
million cfs entering Gorge Lake from Diablo Lake.
the Gorge Dam site remains above one million cfs
at time=9 minutes until time=45 minutes. In
The outflow from
from the failure
the first hour
!:,r· .t.
...
v.r.-'w:.
following the Diablo Dam failure 85,000 acre feet flow through the
Gorge Dam site and down into the Skagit River. Both Diablo and
Gorge Lakes are empty two hours after the first failure. The
routing of flow through Gorge Lake is shown in Figures 5-7 and
5-8.
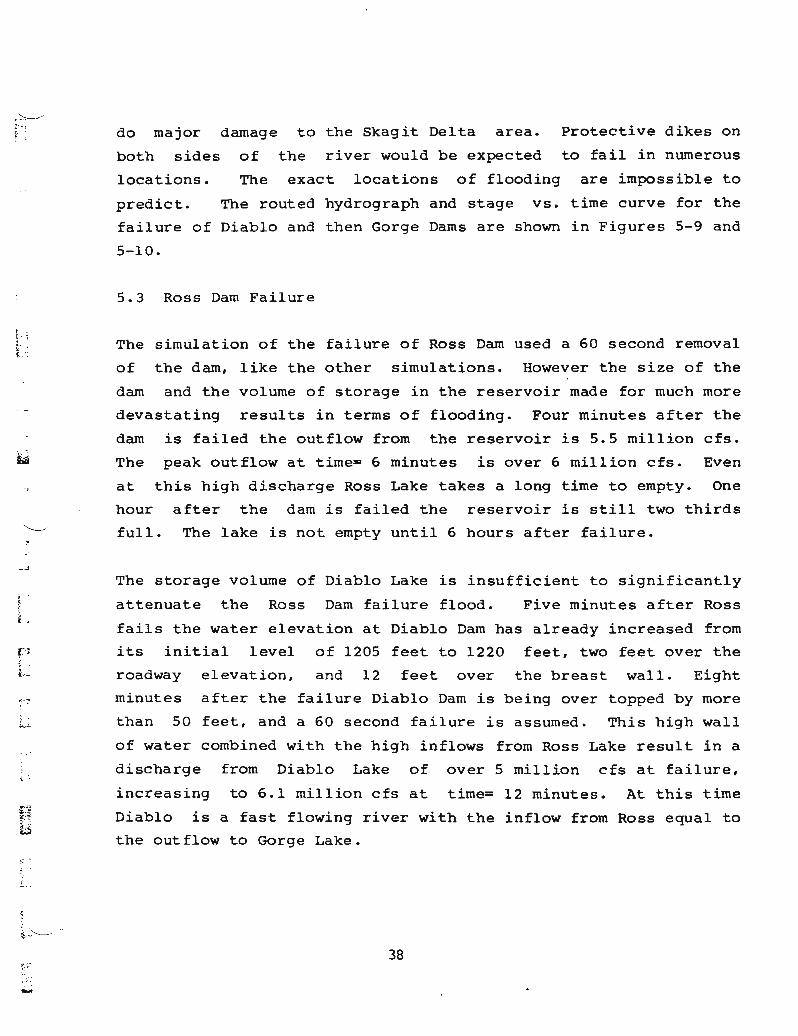
The flood wave from the overtopping of Gorge Dam reaches Newhalem
15 minutes after Diablo Dam fails. In another fifteen minutes the
discharge has peaked at 1.5 million cfs and the water surface has
increased by over 50 feet. The entire river valley is inundated.
The wave attenuates as it moves downstream, but the peak flow is
still over 500,000 cfs as it passes Marblemount at time= 2.25
hours. The water level goes up 18 feet in this area, and major
flooding would be expected, including most of the town. Similar
flooding will occur at all of the low lying communities as the
flood wave passes.
The wider flood plain between Marblemount and Concrete reduces the
peak flow and slows the movement of the wave. The first flooding
around Concrete occurs six or seven hours after the dam failures .
The Peak flow of 190,000 cfs passes Concrete at time= 8 hours,
accompanied by an increase in water level of 12 feet. This size
flood would cause damage to low lying farms but would not severely
affect the town of Concrete.
Farther down towards the Skagit Delta, the dam-break flood wave
attenuates to a peak flow of 165,000 cfs as it passes the first
major town of Sedro-Woolley. The flood is smaller than the
maximum historic flood of 220,000 cfs, but still large enough to
35
-'---! .
FIGURE 5-7
GORGE ~VERTOPPED BY DIABL~ FAILUREWRTER SURfRCE (lEVRT10N Rl~ GDRGE DAMS1TE
I93)1
I910
890
- ~ :reSt- lleVat 'on - - - - -- - -- - - -,~ Dam
87U'
~-850 ~
~,
h!kEm..........
~N9........810
i~ r---.- _15K) 'f9-
770
950
,i ....
4J
~, ~
~Z0.....l-ex.>-- W[j
M ~ M M M W ~ " ~ u W
TII1E: Ftn~ OFttl F'FtILlflE: IN \-ICURS
r,-.- 36
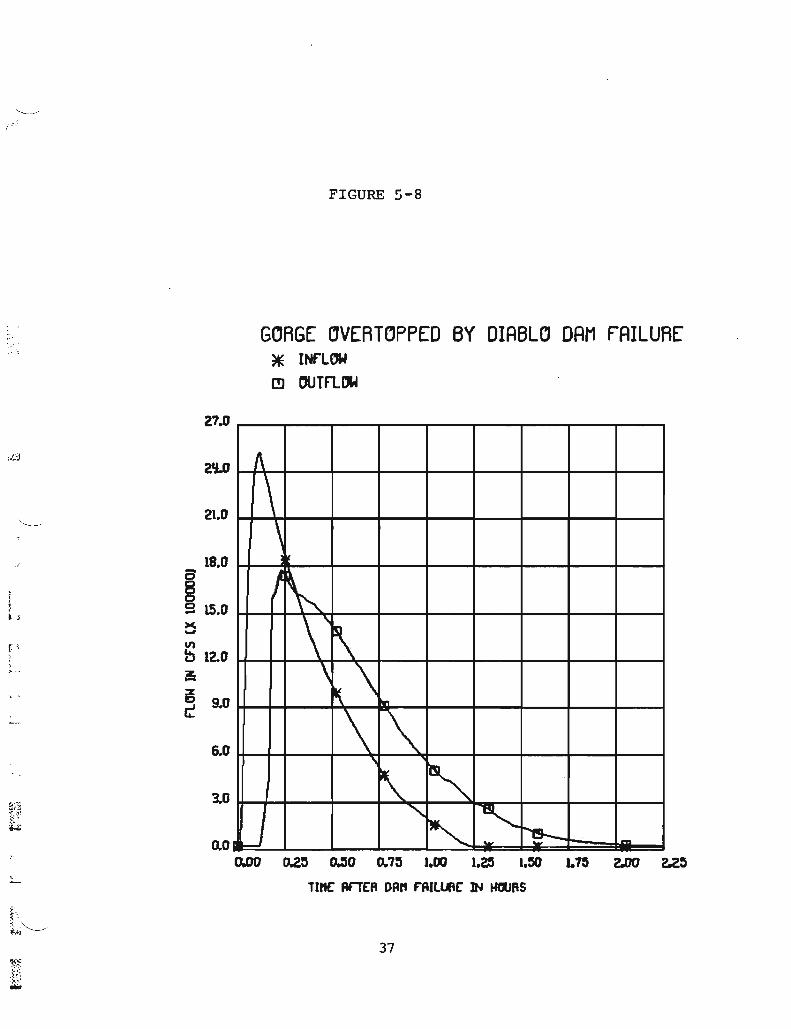
FIGURE 5-8
, ,,I'i·.:::
GORGE OVERTOPPED BY DIABLO DAM FAILURE* INfLCJW[!) DUTf1.DW
A
\~
.~
\'\\ 1(\
Ion
\ '\"I
"~'", ,
'8-! J ..., ...,1100.00 o.zo 0.00 0.70 1.00 1.2:i 1.:MJ 1.7~ 2.00 2.20
TlttC flf"TEfl Of." F'AIl(AtC IN I4ClJf\S
37
;>,-/~... I
r'
t .
r.:
f -··• J
i '"
:= .'!: .
~ ..~.,
-
do major damage to the Skagit Delta area. Protective dikes on
both sides of the river would be expected to fail in numerous
locations. The exact locations of flooding are impossible to
predict. The routed hydrograph and stage vs. time curve for the
failure of Diablo and then Gorge Dams are shown in Figures 5-9 and
5-10.
5.3 Ross Dam Failure
The simulation of the failure of Ross Dam used a 60 second removal
of the dam, like the other simulations. However the size of the
dam and the volume of storage in the reservoir made for much more
devastating results in terms of flooding. Four minutes after the
dam is failed the outflow from the reservoir is 5.5 million cfs.
The peak outflow at time= 6 minutes is over 6 million cfs. Even
at this high discharge Ross Lake takes a long time to empty. One
hour after the dam is failed the reservoir is still two thirds
full. The lake is not empty until 6 hours after failure.
The storage volume of Diablo Lake is insufficient to significantly
attenuate the Ross Dam failure flood. Five minutes after Ross
fails the water elevation at Diablo Dam has already increased from
its initial level of 1205 feet to 1220 feet, two feet over the
roadway elevation, and 12 feet over the breast wall. Eight
minutes after the failure Diablo Dam is being over topped by more
than 50 feet, and a 60 second failure is assumed. This high wall
of water combined with the high inflows from Ross Lake result in a
discharge from Diablo Lake of over 5 million cfs at failure,
increasing to 6.1 million cfs at time= 12 minutes. At this time
Diablo is a fast flowing river with the inflow from Ross equal to
the outflow to Gorge Lake.
38
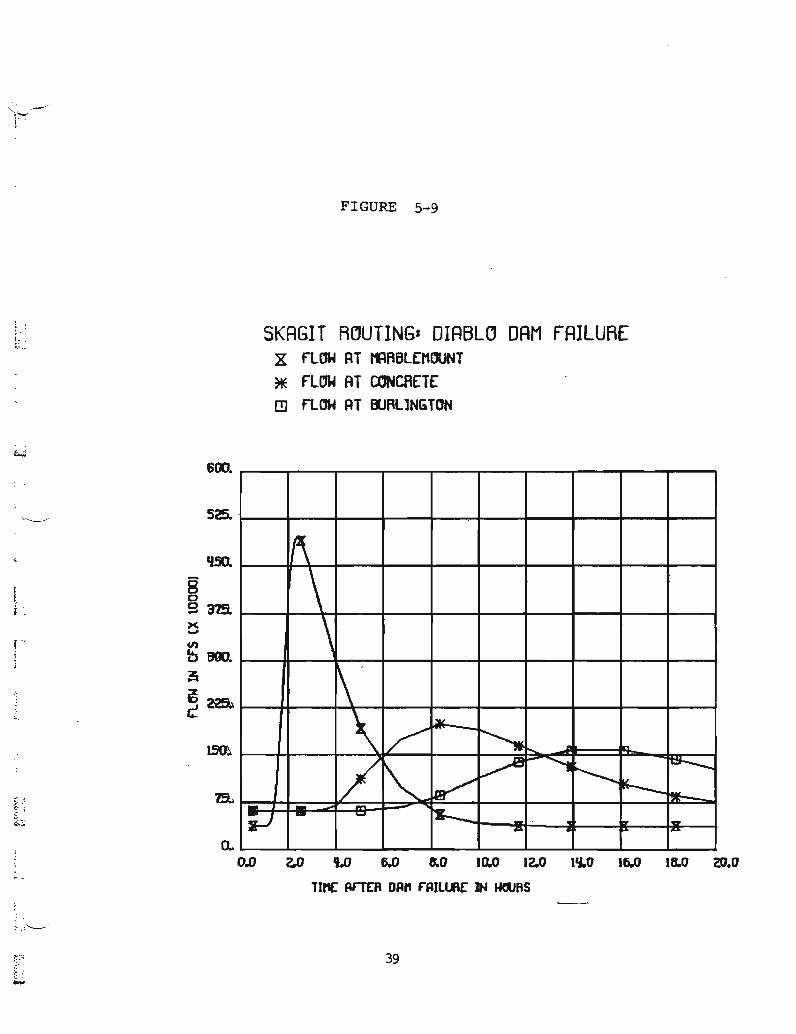
FIGURE 5-9
[.:r"·
l:.: SKAGIT ROUTING- DIABLO DAM fAILUREX flOW AT rflRBL(MDUNT
* FLOW AT CONCRETEC!J flOW AT ElJRLlNGTON
..u
I'\\~.
\ I~
/' -~ i'-...
/ '"~ "'tl
~~
V h_ --;..; - .... L ... -- . ~ -a..
0.0 2.0 W 6.0 8.0 10.0 12.0 I~O 16.0 ULO 20.0
TIlt( AF"TEA Df'" F"f'IlUiC IN I4JAS
sa
600.
. 39
FIGURE $-10
SKAGIT RCJUTINGI DIABLCJ DAM FAILUREWRTER SURfRCE: ELEVRTlDN RT
(!) CONCRETE
"---
. -
f
i ~
41
~
f' 3~ z1:. Ie
i=~ - S;
w~; d
280
260
220
200
180
160
- - - -Elev. tiOn- - - :er-of - - - - - - - - - - - -pf cen town
I .... -
~V- -;:--- In
I-"
.... .... - - of-ta~- - - - - - - - - - -Elev tion bf top
...,~ ..-
1~0
1200.0 2.0 'l.O 6.0 8.0 10.0 12.0 1ILO 16.0 16.0 20.0
TIne ~fTER D~t1 F'~ILlI\r IN wt1IRS
40
f •
L.
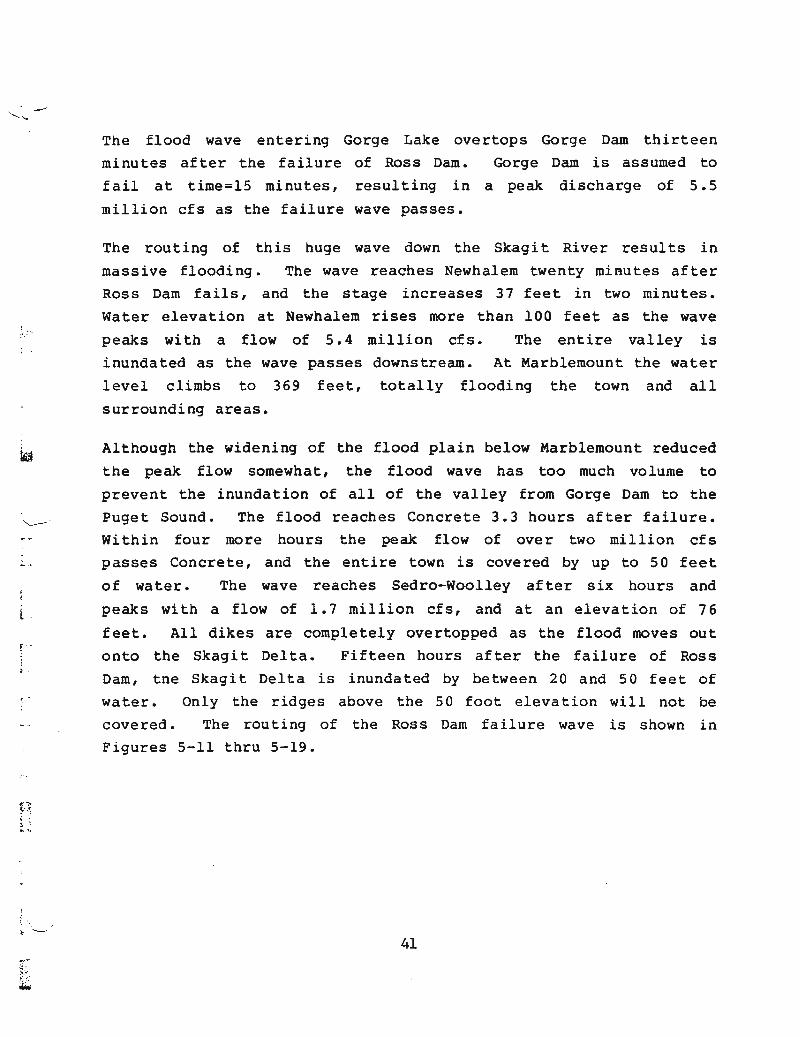
The flood wave entering Gorge Lake overtops Gorge Dam thirteen
minutes after the failure of Ross Dam. Gorge Dam is assumed to
fail at time=15 minutes, resulting in a peak discharge of 5.5
million cfs as the failure wave passes.
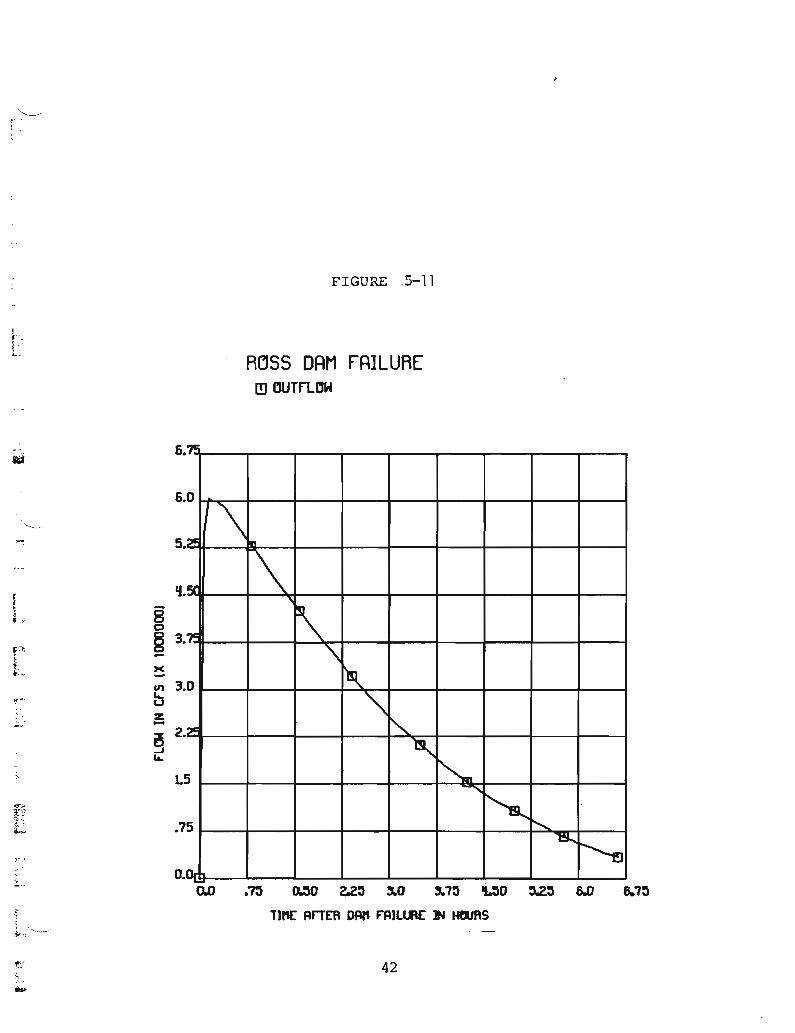
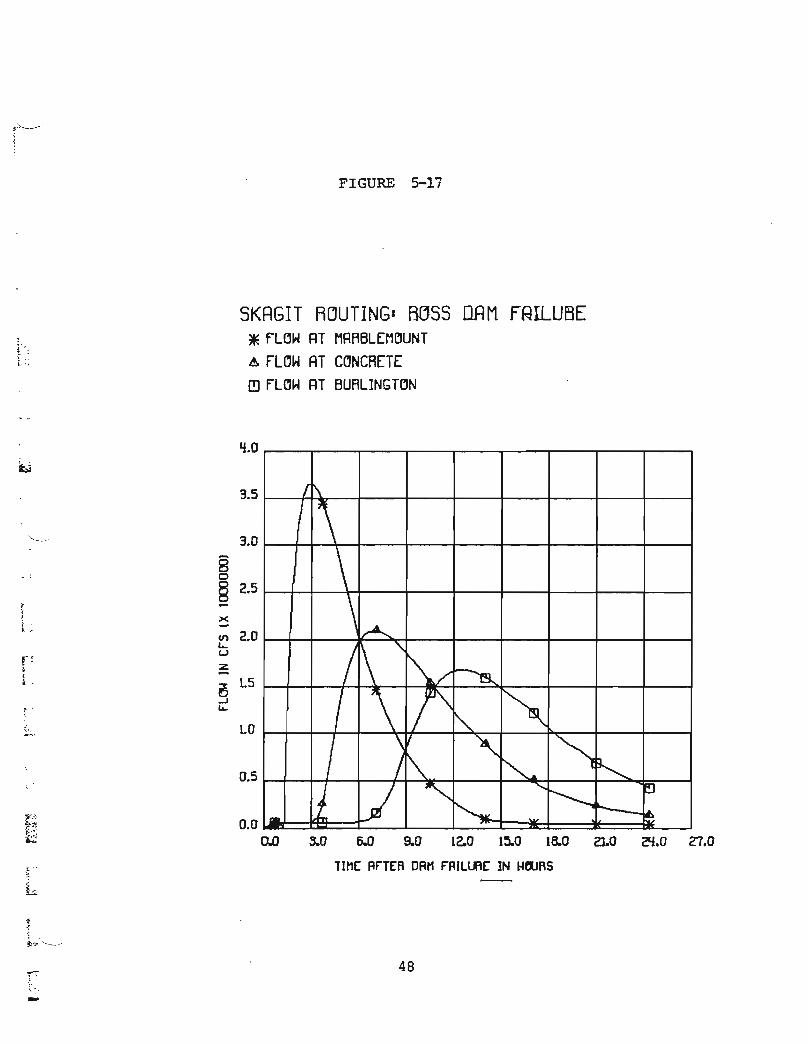
The routing of this huge wave down the Skagi t River results in
massive flooding. The wave reaches Newhalem twenty miautes after
Ross Dam fails, and the stage increases 37 feet in two minutes.
Water elevation at Newhalem rises more than 100 feet as the wave
peaks wi th a flow of 5.4 million cfs. The entire valley is
inundated as the wave passes downstream. At Marblemount the water
level climbs to 369 feet, totally flooding the town and all
surrounding areas.
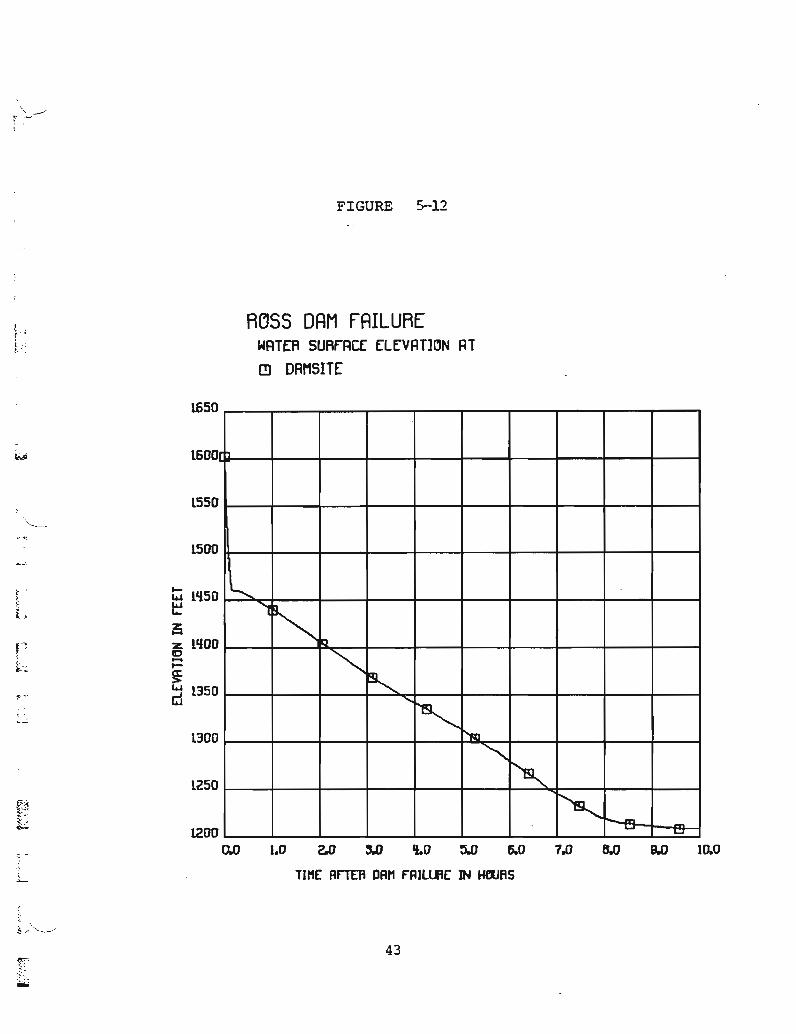
Although the widening of the flood plain below Marblemount reduced
the peak flow somewhat, the flood wave has too much volume to
prevent the inundation of all of the valley from Gorge Dam to the
Puget Sound. The flood reaches Concrete 3.3 hours after failure.
Wi thin four more hours the peak flow of over two million cfs
passes Concrete, and the entire town is covered by up to 50 feet
of water. The wave reaches Sedro-Woolley after six hours and
peaks with a flow of 1.7 million cfs, and at an elevation of 76
feet. All dikes are completely overtopped as the flood moves out
onto the Skagit Delta. Fifteen hours after the failure of' Ross
Dam, tne Skagit Delta is inundated by between 20 and 50 feet of
water. Only the ridges above the 50 foot elevation will not be
covered. The routing of the Ross Dam failure wave is shown in
Figures 5-11 thru 5-19.
41
,....~. '.
FIGURE .5-11
!f _
1i-._
RCJSS DAM FAILURE(!J OUTflOW
."11=
0
:JC
J\...
rq '\?Ii \
'\0 '!t
":lC! ~
~
5 ~"~
~5~
'-eJn..
6.
3.
3.
6.
2.
5.
.7
If.
L
o.
i~ 8i >
0
p §t -~~ ><-enJf":
l0-U
;". Z....i5..J&&.
,
!!&~.'l",':1,,'-.-
£~.- ;.
::", '.
~.~"~--'
0.0 .7:) ~O 2.2~ ,"0 ,.7~ ~O '-Z~ 6.0 6.7~
TIt'£' RF'iER DflI' rRJllJ'r IN HflJRS
1!:-, ..' .
42
, ,
FIGURE ~12
A~SS DAM fAILUREWATER SURfAC£ ElEVAT10N Al(!J DAMSITE
,,
..........."'l
~ b
'"~ "~
I'RJ
'"~~ ---.- &,;;J1200
0.0 1.0.,: -
1650
-
IMi 1600
1550",--.
1500
~. ~
11150~
&.a
L ~
~
p z 11100to
~:~.......~w 1350"1:.... d
~....:
1300
1250
L TIHE ArTER OAH F"AIl~E :IN HflJRS
43
FIGURE '5-=l3
I
Ff
OVERT~PPING FAILURE ~F DIABL~
* INflOWI!J OUTFLOW
'7C
0
~r~~
I;l1 ~O'7C ~
~
~0
~~::JC
"~in -......
~?C ~
0o.
o.
l5
6.
5.
II.
6.
Bo§ 3.-x-en 3.~uz...i§ 2-..J~
l _
r-'
0.0 0.7:) 1.'0 22:) 3.0 ,.7:) ~o :J.Z:) 6.D
Tlrtr FlnE'ft DEl" F'FlJll..l'r l'4 .amS
-44
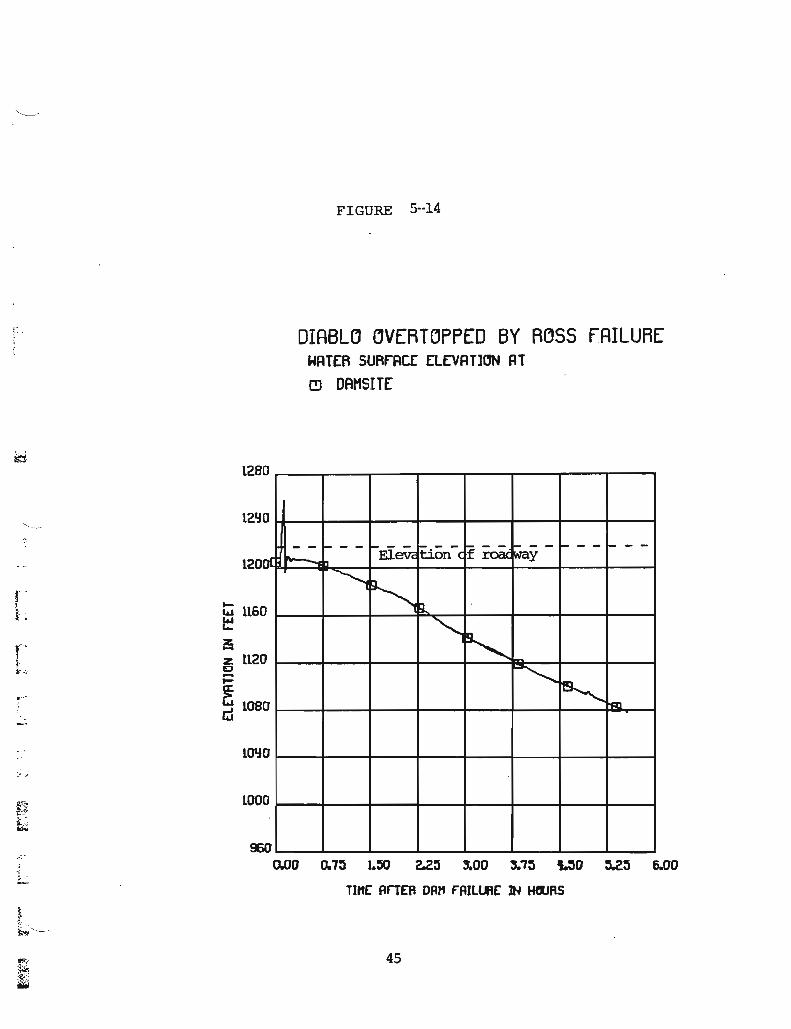
FIGURE 5--14
,.
lDIABLO OVERTOPPED BY ROSS fAILURE
WRTEfl SURFRCE ELEVAT1CN ATI:!J DAMSITE
° - - 1--- I- - - +:;00-( """ - - - -- :- - - 1---E1.cn~ f y
~
~ !l
"""~ -~,
0 'al
°°
120
1280
9600.00 o.l:i l.~ z.z:i 3.00 3.7:i ~o :i.2:i 6.00
Tlnc FtrTER Oft" F"FtllU1C IN HflJRS
100
UP-I
ti 1160~
~z 112010....~
~w 108d
.;, .
tt~··_·
45
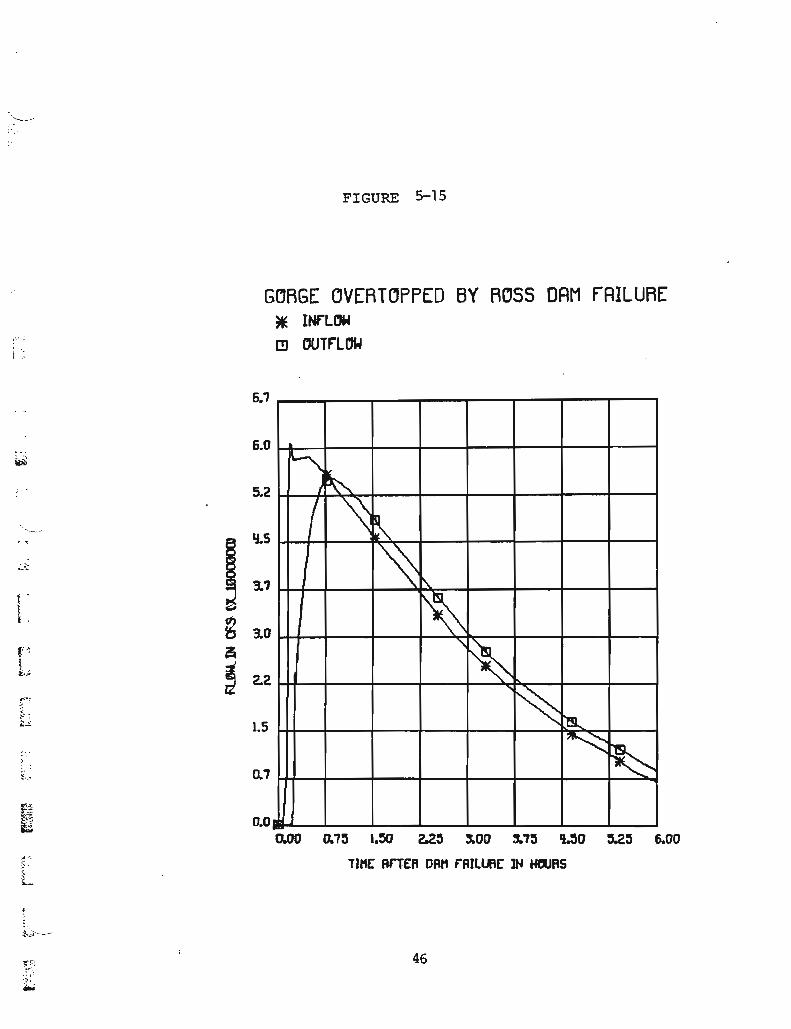
FIGURE 5-15
GORGE OVERTOPPED BY ROSS DAM FAILURE~ INf"LCJWC!J CJUTrlOW
~.."
6.7
6.0
5.2
1.5
0.7
~~~I
I ~~
~ r\.
~'"~~~
~~
0.00.00 0.7:i l.~ 2.2:i '"00 ,.7:i 'l.:i0 :i.2:i 6.00
TI"f: Rf"TEf' DR" F'RIllAlf: IN !«lIftS
46
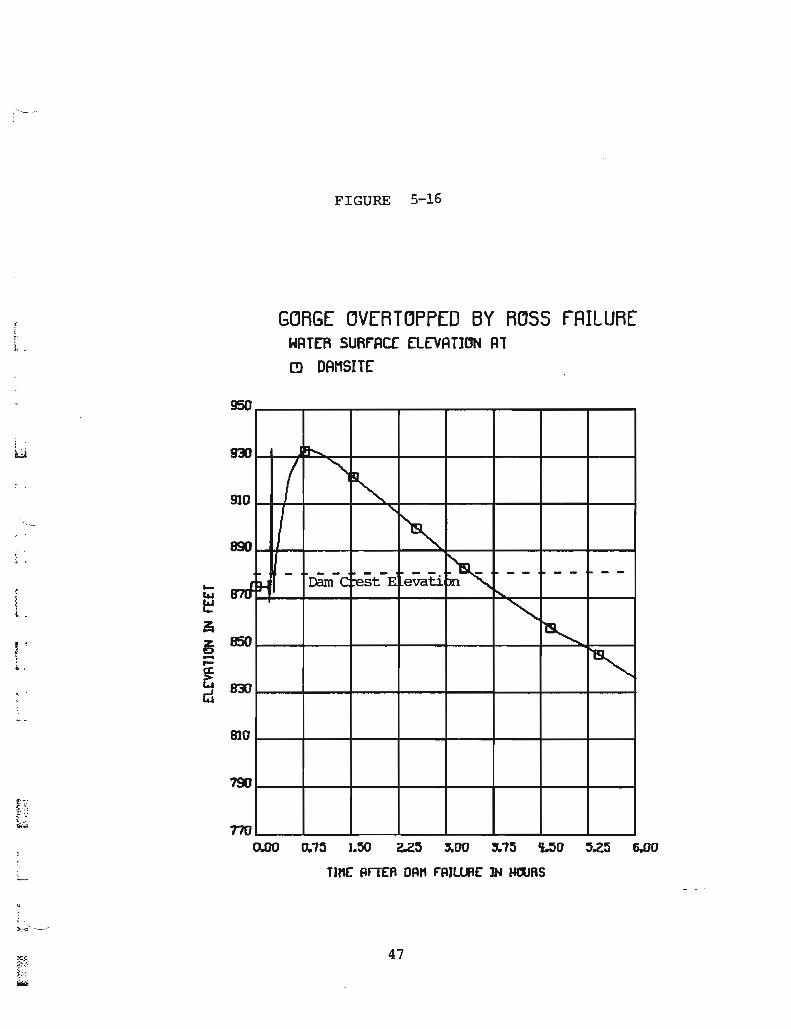
FIGURE 5-16
GORGE OVERTOPPED BY ROSS fAILUREWATER SURfACE ElEVAT1DN Al(!) DAMSITE
950
m e......
( ""~910I '",
890
- Dcin-c~st-E eVati.~ - - - - ~ - -rC1.J
B7(J" ~
'"~850 ,m
810
190
no
:. .:
1~
4A
~t.
!if' ~• ....~.. to-
~wd
0.00 0.7~ MiO 2.2~ '.00 ,.7~ ~o '.2~ 6.00
ntU: ~tTEf\ DR" F'RILlJ1C IN HrlJRS
47
~ .
FIGURE 5-17
SKRGIT RQUTING' fIDSS D11M f~ILUBE
* fL~W AT MAA8LEM~UNT
A flOW AT CONCRETEill fL~W AT BUAL]NGT~N
I f\I
\\I~
/~ ,1\../I-
""'B...
I \ r '" ~I \11 ,~J~ ~. ~
It ~~ "~ ~
~ P---..._- ~0.00.0 '-0 6.0 9.0 12.0 1~0 16.0 21.0 2'i.0 ~.O
liME RrrER DAM f"Rll~E IN HelJRS
1f.0Ii:>i
3.5
",-~_ ... 3.0
80
§ 2.5r -l. xi -~.
2.0C1'It..U
f~ z~, -> L5..~..J
t . ~
., LO
0.5
~
:~
.~.;"~_.~-
48
: ..
~
280
'------ 260
-' -2li0
I-
t.L_ .-.
22041
~f' z~
....,..... z 200Dt=
~..~41 180~ d
160
~-~ lljO-;• .t.
k
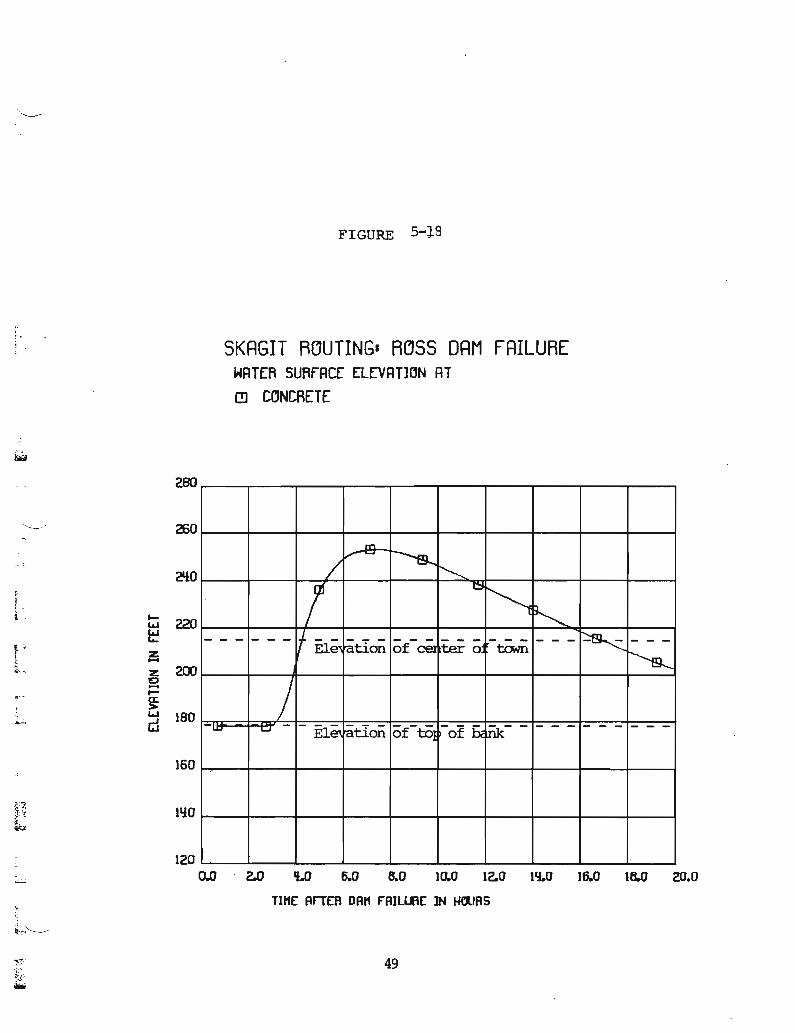
FIGURE 5-~8
SKAGIT ROUTING- ROSS DAM FAILUREWATER SURfACE ELEVAT1DN ATI!I CONCRETE
m..v- ---s../ ~
I~
~~- - - - - - If FJ.e ration - - -~ - - -of eel ter 0 town
~
).... .... - El~ ration of-tO -of be~- - - - - - - - - - -
",!;~.'
1200.0 2.0 Il.C1 6.0 8.0 10.0 12.0 I&J.O 16.0 16.0 20.0
TIt1E RrTEA DRt1 fRJL.J.I\E IN HClJRS
49
I ;1 -,
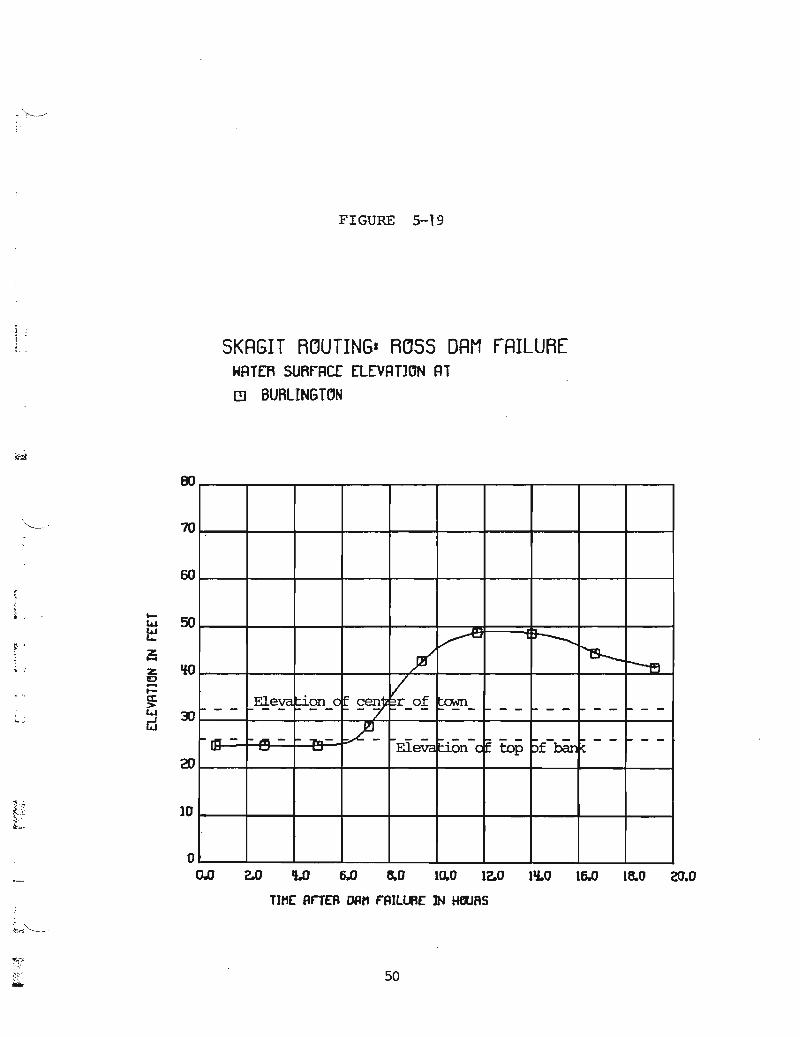
FIGURE 5-19
SKAGIT ROUTING' RCJSS DAM FAILUREWATER SURfACC rLEVATlCN ATI!I BURLINGTON
,;• ....
t..&
~~.
!i;; .; Z
D--.. ~
~,. W....... d
70
60
50
20
~ fT--"'""'19--~ ~
Eleva~gn_oF~V
.. - - ~ - - ~ - ~_af ;;.~-~ - - f- - - - - f- - -
~- - ~ "'" - -.- J-l- ~ - - f- - - F - - ~f-~ f- - - f- - -- .... .... Eleva p.an c top fc
10
o0.0 2.0 IJ.O 6.D &0 10.0 12.0 1'L0 16.0 16.0 20.0
Tlt1C ArTER OOM F"AIllitC IN HflJRS
50
i. .
f .
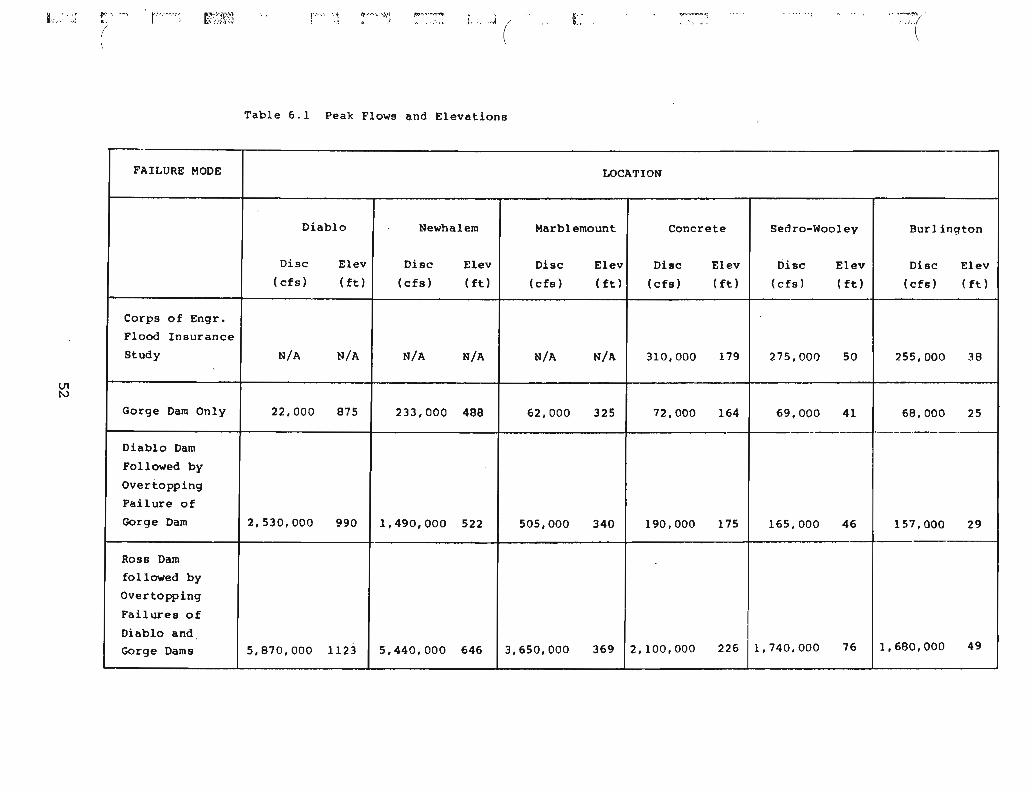
6.0 CONCLUSIONS
The three failure modes simulated produced peak discharges and
water surface elevations high enough to cause significant damage
along the Skagit River. In the case of a single failure of Gorge
Dam, the damage would be minor and confined to the small towns
above Concrete. A failure of Diablo Dam would cause Gorge Dam to
fail by overtopping, and would result in major damage above
Concrete. For the failure of Ross Dam, both Diablo and Gorge would
fail by overtopping and the damage would be extensive, with the
possibility of major inundation and loss of life in the towns of
Diablo, Newhalem, Concrete, Sedro-Woolley, and' Burlington. Peak
flows and elevations for six locations along the Skagit River are
listed in Table 6.1, along with the predicted water surface
elevations for the 100-year flood from the 1972 Corps of Engineers
Flood Insurance Study.
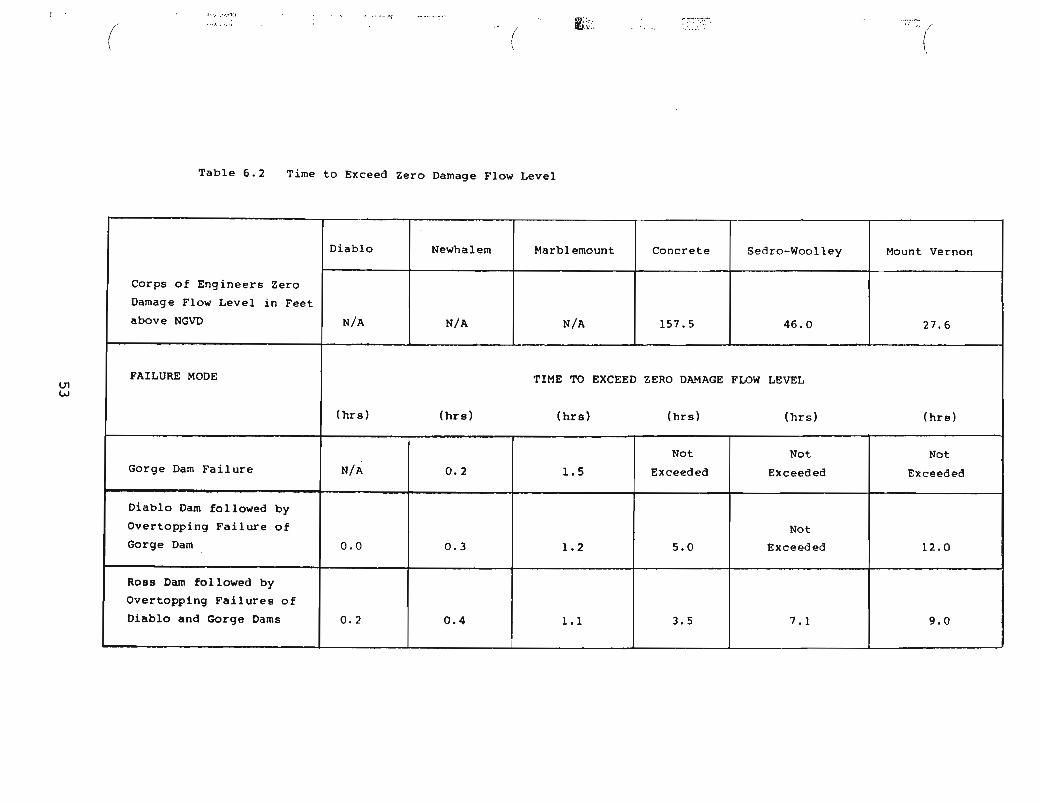
Table 6.2 lists the critical flow levels for six locations, and
the length of time from dam failure until these levels are
exceeded. These water surface elevations are called "Zero Damage
Flows", and indicate the water level above which damage would be
expected to start occurring.
The worst flooding was produced by the failure of Ross Dam,
followed by the failure of Diablo and Gorge Dams by overtopping.
This failure mode was used in preparing the Inundation Map shownin Figure 6-1.
51
I·;,',: (""". r.'··:""'~· t~~·;~~~~:~ r······· '.,
\ '.~
t1.~ ..... '. '-.:,"...~•• ':<,....,....,..
. :.,. . (, .. ,J ( f.".,..........,,_.{
<"I.: • ,- ~~~~(
U1N
Table 6.1 Peak Flows and Elevations
FAILURE MODE LOCATION
Diablo Newhalem Marb1 emount Concrete Sedro-Woo1ey Burlington
Disc E1ev Disc E1ev Disc E1ev Disc E1ev Disc E1ev Disc E1ev
(cfs) (ft) (cfs) (ft) (cfs) ( ft) (cfs) (ft ) (cfs ) (ft) (cfs) (ft)
Corps of Engr.
Flood Insurance
Study N/A N/A N/A N/A N/A N/A 310,000 179 275,000 50 255,000 38
Gorge Dam Only 22,000 875 233,000 488 62,000 325 72,000 164 69,000 41 68,000 25
-----Diablo Dam
Followed by
Overtopping
Failure of
Gorge Dam 2,530,000 990 1,490,000 522 505,000 340 190,000 175 165,000 46 157,000 29
Ross Dam
followed by
Overtopping
Failures of
Diablo and
Gorge Dams 5,870,000 1123 5,440,000 646 3,650,000 369 2,100,000 226 1,740,000 76 1,680,000 49
,.
(H-...'~."'l:'
Table 6.2
(
Time to Exceed Zero Damage Flow Level
m;., ..~S ..
~':-:~":;f:"": ....:-:'.~ /
(
lJ1W
Diablo Newhalem Marblemount Concrete Sedro-Woolley Mount Vernon
Corps of Engineers Zero
Damage Flow Level in Feet
above NGVD N/A N/A N/A 157.5 46.0 27.6
FAILURE MODE TIME TO EXCEED ZERO DAMAGE FLOW LEVEL
(hrs) (hrs) (hrs) (hrs) (hrs) (hrs)
Not Not NotGorge Dam Failure N/A 0.2 1.5 Exceeded Exceeded Exceeded
Diablo Dam followed by
Overtopping Failure of NotGorge Dam 0.0 0.3 1.2 5.0 Exceeded 12.0
Ross Dam followed by
Overtopping Failures of
Diablo and Gorge Dams 0.2 0.4 1.1 3.5 7.1 9.0
·1-. "', .
} .. '
7 .0 REFEREN:ES
1. Amein, M. am C.S. FaIx1 (1970), "Implicit Flood lOuting in Natural
Charmels" ~ Journal of the Hydraulics Division~ ASCE, Vol. 96, Dec. 1970,
W. 2481-2500.
2. CFR 18~ Part 12 (198l), "RegulationsGoven'li.n3 the safety of water ~r
Projects and Project Works - FERC Order 1122" ~ Final Rule Issued January
21, 1981.
3. Cl:>:rpe of Eh3ineers (1972), Seattle District, "Flood Insurance Stooy
Skagit County washi.n;;rt:on" ~ June 1972.
i;:.;;
4.
.~
5.
;i 6.
f-'1;,l
7.
Cl:>:rpe of Engineers (1967), seattle District~ "Flood Plain Infbnnation
Stuiy, Skagit River Basin", April, 1967•
International Engineerin:J Co.~ Inc. (1973)~ "a:>ss, Diablo am Cbrge lEns
Spill\1ilaY Mequacy Investigation", February, 1973.
Hydroccmp, Inc. (1974) ~ "Surmary of Methods for Inundation Map
Preparation - Pacific Gas & Electric Co." ~ september, 1974.
Jolly~ J.P. am V. Yevjevich (1974), "Simulation Accuracies of Gradually
Varied flOrI', Journal of the Hydraulics Division~ ASCE, Vol. l00~ July~
1974, w. 1011-1030.
55~"-~
,
VI ..
, :
~ .t .
L
8. Kop£I.er~ William F. (1980)~ "&nergency Action Plans" ~ san Francisco
Regional Of£ice~ Federal Energy Regulatory amnission.
9. Liggett, J.A. and D.A. W:x>lhiser (1967)~ "Difference Solutions to the
Shal1c:w-Water E:p:ltion", Journal of the Engineerin:J Mechanics Division,
ASCE, Vol. 93, April 1967 ~ pp. 39-71.
10. Price, R.K. (1974), uCcmparison of Four Numerical Methods for F10crl
IOutin:J", Journal of the Hydraulics Di.vision~ ASCE, Vol. 100, July 1974,
a;>. 879-899.
11. Strelkoff, T. (1969)~ "One-Di.mensiooal Fquations ofOpen-Channe1 Flow" ~
Journal of the Hydraulics Di.vision~ ASCE, Vol. 9S~ ~y 1969~ pp.
860-876.
12. Strelkoff, T. (1970)~ "Numerical Solutions of saint-Venant Fquations",
Journal of the Hydraulics Division~ ASCE~ Vol. 96~ January 1970.
13. Yen, B.C. (1972) ~ "Spatially Varied Open-Channel Flow Fquations" ,
Research Re:EOrt 1«:>. Sl~ Uliversity of Illinois~ water Resources Center~
1972.
14. zevne, J.J. (1970), "The Numerical Solution of Transient Supercritical
Flow by the Method of Claracteristics with a Teclnique for Simulatin:J
Bore Prqla9ation", ERC-0370, Environnental Resources Center~ Georgia
Institute of Teclno1ogy.
56
.....;;iii
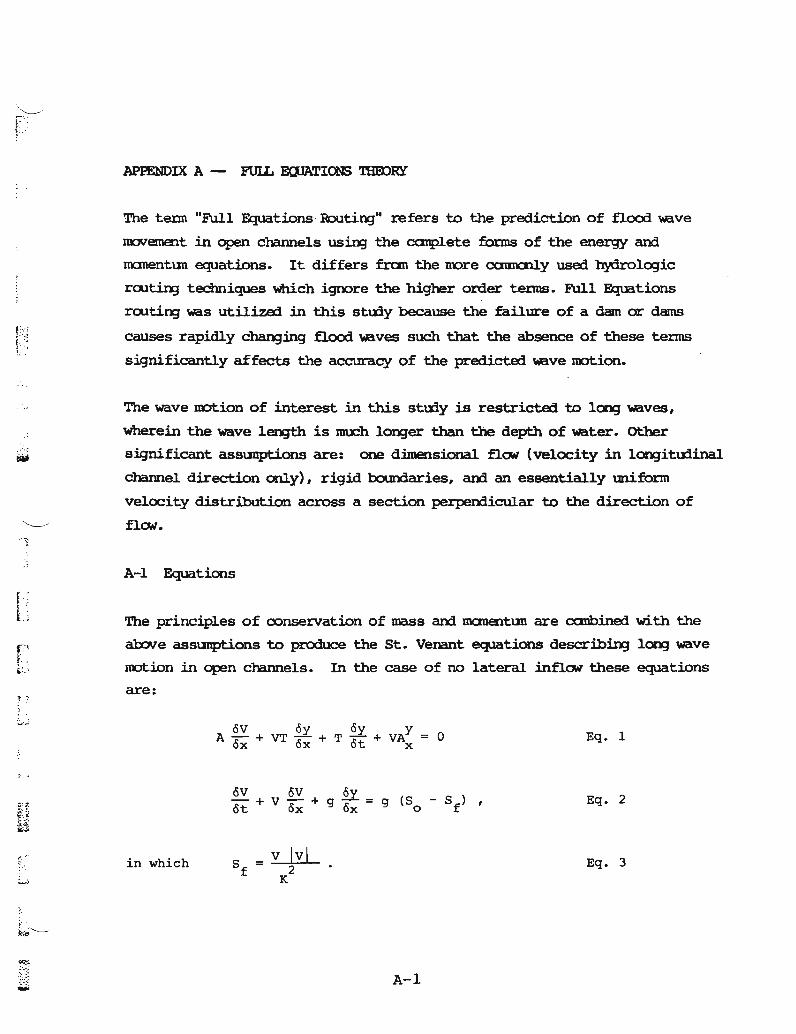
APPENDIX A - FUIL E(J1ATICR) TBEDRY
The teDIl "Full Equations Routing" :refers to the prediction of flood Wive
mc:wement in open channels usiD3 the canplete £onns of the energy and
manentun equations. It differs £ran the nore ccmncnly used b.ydrologic
rooting techniques Which ignore the higher order tenns. Full Equations
rooting was utilized in this stuiy because the failure of a dam or dams
causes rapidly chan:Jing flood waves such that the absence of these tenus
significantly affects the accuracy of the predicte:l wave rootion.
The wave lIOtion of interest in this stuiy is restricted to lcmg waves,
wherein the wave leD:]t:h is nnx::h 1003er than the depth of water. other
significant assunptions are: one dimensional flow (velocity in lcmgituiinal
charmel direction onlyL rigid lx>undaries~ am an essentially uniform
velocity distribution across a section perpeOOicular to the direction of
flOlo\f •
A-I Equations
The principles of conservation of mass arXl manentun are canbined with the
above asstmptions to produce the St. Venant equations describiD3 lC03 wave
m:x.ion in open channels. In the case of no lateral inflOlo\' these equations
are:
.: .'
~";", in which
oV oy oy YA - + VT - + T - + VA = 0Ox ox ot x
oV oV ov- + V - + g ~ = g (So - Sf> ,ot ox Ox
A-I
Eq. 1
Eq. 2
Eq. 3
( .
I.'
-'''----"
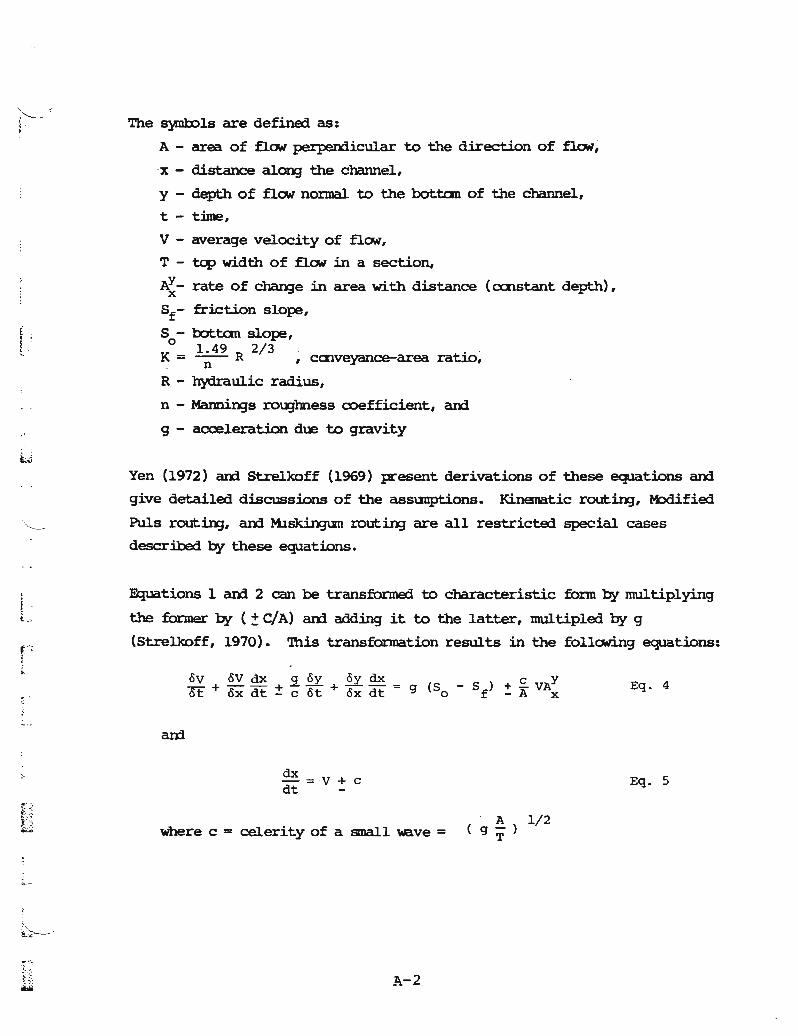
The S}'Dl1x>ls are defined as:
A- area of flC7.\' perpendicular to the direction of flaw~
·x - distance alon:J the channel,
y - depth of flC7.\' nonnal to the botton of the channe1~
t - time,
V - average velocity of flC7.\',
T - top width of flC7.\' in a section,
A~- rate of cba.D3e in area with distance (CXIlstant depth),
Sf- friction slope,
So- bottan slope,1.49 2/3 . . .
K = -n- R , calveyance-area ratio,
R - hydraulic radius,
n - Mannings roU3hness coefficient, amg - acceleration due to gravity
Yen (1972) am strelkoff (1969) present derivations of these equations amgive detailed discussions of the assunptions. Kinena.tic routing~ Modifie::l
Puls routing, am M.1~ routing are all restricte::i special cases
described by these equations.
Fquations 1 am 2 can be transformed to characteristic fonn by multiplying
the former by (-:. cIA) am adding it to the latter~ multipled by g
(Strelkcff, 1970). 'Ibis transformation results in the following equations:
.f 0
i 0"'
to;:.~ ...
oV oV dx 9 oy oy dx ) +.£ VAYot + ox dt ± c ot + ox dt = 9 (So - Sf - A x
dx=V+Cdt -
Eq. 4
Eq. 5
where c = celerity of a small wave =
A-2
. A 1/2g-)
T
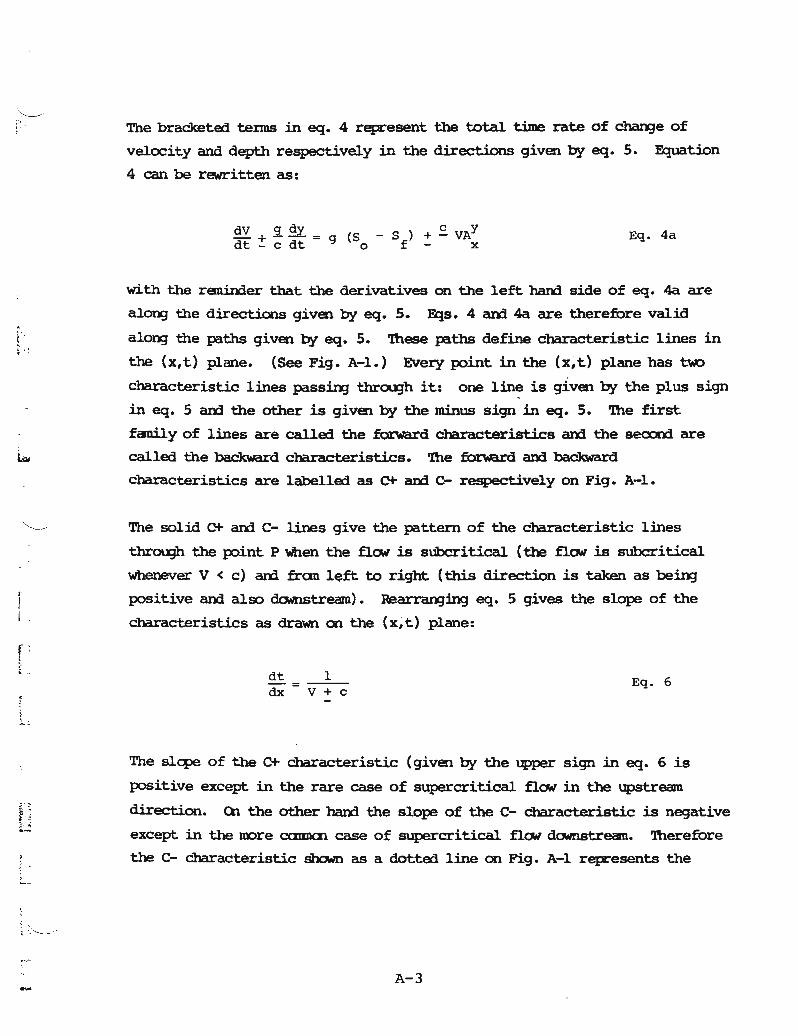
The bracketed tenus in eq. 4 represent the total time rate of chan;:Je of
velcx::ityand depth respectively in the directions given by eq. 5. Fquation
4 can be rewritten as:
dV ~ ~ _ S ) + £ VAYdt ~ C dt - 9 (So - f - x Eq. 4a
with the reminder that the derivatives on the left hand side of eq. 4a are
alQn3 the directions given by eq. 5. Fqs. 4 and 4a are therefore valid
along the paths given by eq•. 5. 'lhese paths define characteristic lines in
the (x,t) plane. (See Fig. A-I.) Every point in the (x~t) plane has t\«)
characteristic lines passin3 tll.rolgh it: one line is given by the plus sign
in eq. 5 and the other is given by the minus sign in eq. 5. 'lhe first
fanily of lines are called the forward characteristics and the second are
called the backward characteristics. 'lhe fonard and backward
characteristics are labelled as C+ and C- respectively on Fig. A-I.
The solid C+ and C- lines give the pattern of the characteristic lines
thrOU3h the point P when the flQi is subcr'itical (the flQi is subcr'itical
whenever V < c) am fran left to right (this direction is taken as bein3
positive and also cbmstI'eam). Rearranging eq. 5 gives the slope of the
characteristics as drawn on the (x,t) plane:
dt 1dx=V+c
Eq. 6
The slope of the C+ characteristic (given by the upper sign ineq. 6 is
positive except in the rare case of supercritical flQi in the upstream
direction. en the other hand the slope of the C- characteristic is negative·
except in the DDre CCIIIIIal case of supercritical flQi downstream. 'lberemre
the C- characteristic shown as a dotted line on Fig. A-l rept"esents the
A-3
IX>Sition of the C- characteristic for supercritical flow in the downstream
direction.
A-2 Solutions
No explicit solution exists for the St. Venant equations. Hence solutions
of these equations with awropriate initial and boundary ccniitions have
been developed usiD;:J nunerical tecmiques. A wide variety of tecmiques
have been stu::1i.ed. Liggett ani Wool.hiser (1967), 1Inein and FaD3 (1970),
Strelkoff (1970) am Price (1974) give representative surveys a.rXi
canparisons of methods. ~st metl'OOs have been developed and are applicable
when the flCM is subcritical. Zovne (1970) am Jolly and Yevjevich (1974)
studied supercritical flow and foum that the specified time interval metb:xl
of characteristics is applicable. F1CM in steep streams and belCM a failiD;:J
dam are fre<pently supercritical. Both conditions are encountered in dam
failure stu:ties. '!herefore, the specified time interval method of
characteristics was selected for streamflow routiD;:J in dam failure analyses.
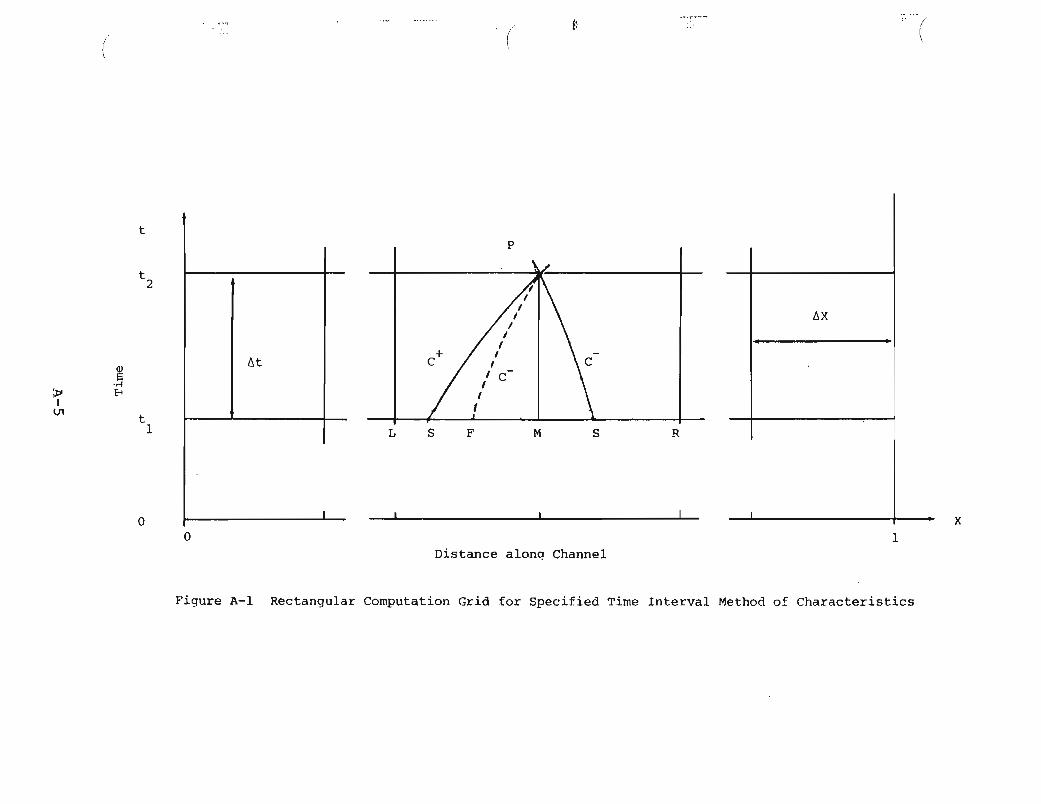
Figure A-l s'b::1.s the rectargular grid used for the nunerical solution
imp:>sed on the (x,t) plane. '!he values of depth ani Velocity are kncJwn at
the grid p:>ints al0I¥3 the channel at time tl. 'lhe problem is to predict the
values at the grid p:>ints (also called ncrles), at time t2. 'lhe typical
canpltation element is shown on Figure A-l. bbdes labelled ~ M~ and L are
at grid points at time tl a.rXi therefore the depth ani velocity are known.
Values at node P are unknc:7-m and are to be detenni.ned. 5egments of the t~
charac~ristic lines passiD;:J 1:l1ro\.gh point P and also intersecting the line
tl fom the basis for the specified time interval method of characteristics.
The points of intersection are labelled S am F on Fig. A-l. Algebraic
equations giving relationships am:ng variables at p:>ints P, L, M~ R~ S, and
F are developed to approximate the differential relationships given by eqs.
4 a.rXi 5.
A-4
( ( to:--''''/
\
t
tI I I
2
P
I I
Q)tit
/f' \S
;l>'•.-f
+
tlX
IEo<
U1
-I
t1 I I L S F M S R
oo
I 1_ I ----L
Distance along Channel1
x
Figure A-I Rectangular Computation Grid for Specified Time Interval Method of Characteristics
(.
f-·· J
The solution procedure for these algebraic equations deperXls (Xl the location
of node P aloog the channel. lbde LandS are missirq if node P is at the
left end of the channel and node R am p:>ssibly node F are missirq if node P
is at the right end of the channel. '!hese em nodes are called boundary
nodes. '!he nodes not on a bouI'Xiary are called interior nodes. Further
discussion is presented in section 3.1.2.
A-2.l Solution at an Interior N:>de
The major steps involved in the solution procedure at an interior node are
given in step by step manner as follows:
1. Estimate location of the C+ characteristic, Le. locate point S.
2. Estimate location of the C- characteristic, Le. locate point F.
3. Estimate the values of velocity and depth at point F usinJ
equations defined al0D3 the tw:> characteristics.
Refine the location of point S using Velocity and depth vallES
at point P.
Refine the location of point F usirq velocity and depth .
vallES at point P.
Refine values of velocity and depth at point P.
Repeat steps 4 throl.XJh 6 until the cba.nJe in the values for
velocity and depth at point P is acceptably small.
This highly implicit iterative solution must be used because the governi..n:Jequations (eqs 4 and 5) are highly interdepernent. For exanpl.e~ point S
camx>t be located with precision until the velocity is known at point S am
A-6
F~ :r .I
also at :Ebint P. Neither value is knc70m at the start am estimates follOJr'ed
by successive refinenents must be used.
A-2.2 Soluticm at a BOlmdary NXle
The solution procedure depends on the bourxlary type (upstrean or
damstrecm), on the state of flow at the bouD:iary (Sli>critical or
supercritical) an1 on the conditions knc70m at the bournary.
A-2.2.1 Upstrean 1:x>uJ:Xiary node - Only the backward characteristic can
pass through point P am al90 interesect line tl When the flow at the
upstrecm boundary (left eOO of the channel) is subcritical. '!he most
canrocnly available bolndary ccn:Ution at the upstream boUndary node is a
hydrograIil giving discharge into the channel as a function of time. '!he
major steps in the solution in this case are:
1. Estimate location of c- characteristic~ Le. locate point F.
2. Estimate value of velocity and depth at point P using the known
flowrate at the boundary and the algebraic equation al0D3 the C
characteristic.
3. Refine the location of point F using the velocity and depth values
at point P.
4. Refine values of velocity and depth at point P.
5. Repeat steps 3 aIX1 4 until the c~e in the values of velocity and
depth is acceptably small.
Figure A-I aIX1 the related discussion in section A-I sl:xM that no
characteristic lines passing t:1lrou3h point P aIX1 also intersectiz:g line tl
exist \1iihen the flow at the upstream 'bouD:iary is supercritiCal.. '!he boUndary
A-7
coodition must therefore supply both depth and velocity at the bc:>urXiary. A
solution for this case is obtained by neglectin::J the local and convective
acceleration tenns in eq. 1 to yield:
~ = s - sOx 0 f
Eq. 7
SUbstitution of the definition of S in eq. 7 am approximating the partial
derivative of depth by the forward difference of depth at time tl gives:
1' ..::
L<YR - YM 1/2
V =Q /A =K S -f~~~P P P P 0 6x
Eq. 8
r:! .
where Kp am Qp are the caweyanee-area ratio and the knc:wn boundary
discharge respectively at point P, and f is an adjustment factor for the
water surface slope. l'I1en f = 0 iterative solution of eq. 8 gives the
ncmnal. depth and velocity for the krx:Iwn flCMrate llthi.le f > 0 corrects the
nannal values for the effect of water surface slope.
A-2.2.2 ~ean OOundary node - the or characteristic is the only
characteristic line to intersect line tl and also pass t:hrolJ3h point F when
the flew is subcritical. A centrol giving a \mique relationship between the
stage and the discharge or discharge into a lxXly of water with a surface
elevation krx:Iwn as a function of time will give useful dCMlStream l:x>\n1ary
calditions. Frequently neither situation applies and eq. 8 with the forward
difference replaced by the back\erd difference:
Y - Y 1/2V ,= K S - f M
6L
P poxEq. 9
gives the do.mstrean lJc>l.D3ary caxiition. '!he major steps in the solution
procedure are the same for each of the al:x:ne cases:
A-a
~..
:.'
fr·
1. Estimate the location of the Ot- characteristic, i.e. locate point S.
2. Estimate values of velocity and depth at point P using the algEbraic
ecpation along the Ot- characteristic am the awroPt"iate boundary
caldition.
3. Refine the location of point F using the velocity and depth at point
P.
4. Refine values of velocity and depth at point P.
5. Repeat steps 3 am 4 until the cha.n:Je in the value of velocity and
depth is acceptably snall.
SUpercritical flOlrl at the downstream 1:x>undary precllXles the specification of
a boundary cCDtition. '!he solution can proceed as for an interior node
because both characteristic lines passing t:hrou1h point F also intersect the
line tl.
A-2.3 Channel lbuting Process
The channel rout:m;, };recess is a canbination of the above solutions. '!he
initial comitions to start the process are derive::! fran a steady state
profile analysis in the channel. '!he depth am velocity at the eIX1 of the
current time step can then be canput.ed for each interior node using the
solution p:rocedure given in Section A-2.1. '!hen the upstream and datmstream
1::x:lundary node depths am velocities can be canputed using the procedures in
section A-2. 2. 'lhi.s ccmpl.etes the canputations for one time step. '!he next
time step repeats the same set of calculations usinJ the just canpleted
values at the nodes as the knc::7tm values.
A-9