Embed Size (px)
Citation preview
Experimental Physiology (1995), 80, 89- 101Printed in Great Britain
SKELETAL MUSCLE BUFFER VALUE, FIBRE TYPEDISTRIBUTION AND HIGH INTENSITY EXERCISE
PERFORMANCE IN MAN
ANNE F. MANNION*, PHILIP M. JAKEMAN AND PETER L. T. WILLANtSchool of Sport and Exercise Sciences, University of Birmingham, Birmingham B15 277, UK
and t Department of Cell and Structural Biology, University of Manchester, Manchester M13 9PT, UK(MANUSCRIPT RECEIVED 16 MARCH 1994, ACCEPTED 21 SEPTEMBER 1994)
SUMMARY
Interrelationships between quadriceps femoris muscle buffer value (,f), fibre type distribution,and lactate concentration and pH following short-term high intensity exercise were examined ineighteen young healthy human volunteers. Muscle biopsy samples were taken from the lateralportion of the quadriceps femoris muscle at rest and after fatiguing dynamic or isometricexercise. Isometric exercise required the maintenance of 60 % quadriceps maximum voluntarycontraction, and dynamic exercise, the performance of a modified Wingate Test. The musclebuffer value displayed a positive, but non-significant correlation with the relative area of themuscle occupied by type II fibres (r = 0 42, P = 0.09). An elevated/, was associated with a lesserdecrement in muscle pH during intensive exercise but did not permit the accumulation of ahigher muscle lactate concentration or allow for an enhanced dynamic or isometic exerciseperformance. A superior performance during dynamic exercise was associated with a highconcentration of muscle lactate and a low muscle pH post-exercise; in turn, each of these factorswas positively dependent on the relative area of the muscle occupied by type II fibres. Theconverse was found for isometric exercise, where there was a tendency for an enhancedperformance to be associated with a low muscle lactate and high muscle pH post-exercise. Nosignificant relationship between the relative type II fibre area and isometric performance capacitycould be established. It was concluded that the muscle buffer value is not a major limiting factorto the performance of high intensity exercise, suggesting that the involvement of intramuscularacidosis in the development of fatigue may be indirect. The most important determinant of highintensity exercise capacity appears to be the proportional area of the muscle occupied by type IIfibres, where a high value provides for a superior dynamic but inferior isometric exerciseperformance.
INTRODUCTION
The literature reports a prominent role for intramuscular acidosis in the development offatigue during intensive muscle contraction (Hainaut & Duchateau, 1989). On this basis ithas been suggested that the capacity of a muscle to sequester excess hydrogen ions could bean important determinant of the muscle's ability to maintain high intensity exercise; a highermuscle buffer value should allow for a more prolonged utilization of anaerobic glycolysisbefore a limiting pH is reached (Parkhouse & McKenzie, 1984). In view of the knownmetabolic profiles of the various muscle fibre types (Saltin & Gollnick, 1983), it might beexpected that a muscle with a predominance of type II fibres would possess a greater buffervalue than a muscle with an abundance of type I fibres. However, the experimental evidence
* To whom correspondence should be addressed at: University of Bristol, Comparative Orthopaedic Research Unit,Department of Anatomy, Southwell Street, Bristol BS2 8EJ, UK.
A. F. MANNION AND OTHERS
to date concerning the significance of the muscle buffer value in humans is by no meansconclusive. In one study, carried out on diverse groups of specifically trained athletes,significant positive interrelationships were observed between the muscle buffer value, theconcentration of carnosine (one of the muscle's physicochemical buffering constituents), thepercentage of type II fibres and high intensity running performance (Parkhouse, McKenzie,Hochachka & Ovalle, 1985). Nonetheless, neither the corresponding post-exercise musclelactate concentrations nor the muscle pH values were reported, making verification of theproposed benefit and mechanism of action of an enhanced buffer value somewhat difficult. Incontrast, other studies report no significant relationship between the muscle buffer value andeither the fibre type distribution (Sahlin & Henriksson, 1984; Mizuno, Juel, Bro-Rasmussen,Mygind, Schibye, Rasmussen & Saltin, 1990) or the post-exercise lactate concentration(Sahlin & Henriksson, 1984).The present study was designed to investigate the role of the skeletal muscle buffer value
during exercise, with particular emphasis on its relationship with the muscle fibre typedistribution and the muscle acid-base status following intensive, fatiguing muscle contraction.
METHODS
SubjectsEighteen healthy, active but non-specifically trained male (n = 12) and female (n = 6) volunteers
agreed to participate in the study, which was approved by the local Ethical Committee. Each subjectwas informed of the purpose and potentialrisks of the study before their written voluntary consent was
obtained. The mean + S.D. age, height and body mass of the subjects was 22.4+ 3-3 years,1-78+ 0-07 m and 75.9 + 7-3 kg, respectively, for the males and 23.5+ 4-8 years, 1-67+ 008 m and66-3+ 7-4 kg, respectively, for the females.
Muscle biopsy samplingMuscle samples were obtained, under local anaesthesia (1 % lignocaine), from the lateral portion of
the quadriceps femoris muscle, using a 4-5 mm biopsy needle (UCH; Popper & Sons, New Hyde Park,NY, USA). All samples were taken with the knee at 90 deg flexion, from a site approximately100- 150 mm proximal to the superior border of the patella. Two samples were taken at rest, and a thirdwas taken immediately following either isometric (60 % maximum voluntary contraction (MVC)) or
dynamic exercise to fatigue (see later).
Muscle analysesThe first (resting) sample was used for histochemical analysis. The sample was orientated under a
dissection microscope, mounted in an embedding medium and snap-frozen in dichlorodifluoromethane(Arcton; ICI, UK) cooled to its melting point by liquid nitrogen. Serial sections, 10,um thick, were cutin a cryostat at-20°C, then stained for NADH tetrazolium reductase or for myofibrillar adenosinetriphosphatase (ATPase) following either acid (pH 435 and 4-6) or alkali (pH 10-3) pre-incubations.Each fibre was assessed for staining intensity and identified as typeI, Ila,II b, or 'other type' (Dubowitz& Brooke, 1973). The mean number of fibres classified per sample was 700. Muscle fibre cross-
sectional areas were determined by planimetry on photomicrographic enlargements (x 500) of sectionsstained with Haematoxylin and Eosin, using a digitizing tablet (Grafpad 2+ graphics system; BritishMicro, Watford, Herts, UK) interfaced to a microcomputer. Only areas without artifacts, with distinctcell borders and in the middle of the section were measured, following the recommendations ofBlomstrand, Celsing, Friden & Ekblom(1984). A mean of 280 fibres per section were measured for area.
The second (resting) muscle sample was immediately frozen by plunging the biopsy needle-tip intodichlorodifluoromethane, cooled to its melting point by liquid nitrogen. Samples were then freeze-dried(over 2-3 h), dissected free of blood and connective tissue (on average, 22 % of the tissue dry weight),re-dried and then powdered.
90
FIBRE TYPES, BUFFERING AND INTENSIVE EXERCISE
Acid extraction of metabolites was carried out on a portion of the freeze-dried muscle, according tothe method of Hams, Hultman & Nordesjo (1974), and the neutralized extract assayed enzymaticallyfor lactate concentration (Lowry & Passoneau, 1972) and, by high performance liquid chromatography,for the concentration of camosine (Marlin, Harris, Gash & Snow, 1989).
Muscle homogenate pH (pHh) and buffer value (/J) were measured using a modification (Mannion,Jakeman & Willan, 1993) of the method described by Marlin & Harris (1991). Briefly, a portion offreeze-dried muscle (1.5-2-0 mg) was accurately weighed on a microbalance (Robal; C.I. Electronics Ltd,Salisbury, Wilts, UK) and homogenized at 0 °C in a solution containing sodium fluoride (10 mmol 1-1)at a dilution of 30 mg dry muscle per ml homogenizing solution. Homogenate pH measurements weremade at 37 °C using a microelectrode (MI-415; Microelectrodes Inc., Londonderry, NH, USA)connected to a pH/ion analyser (Coming 150; Coming, Halstead, Essex, UK). For the measurement ofbuffer value, the homogenate (resting muscle sample) was adjusted to approximately pH 7-2 with NaOH(0-02 mol -%), then titrated to pH 6-2 by the serial addition of 2 IIl aliquots of HCl (0-01 mol 11). Fromthe fitted titration curve, the number of moles of H+ (per kg dry muscle (DM)) required to change the pHfrom 7-1 to 6-5 was interpolated. (This pH range was chosen because it represents that usually observedin muscle in its transition from rest to fatigue induced by high intensity exercise (Hultman & Sahlin,1980).) This buffer value was then normalized to the whole pH unit for final expression asmmol H+ (kg DM)-'(pH unit)-'. The coefficients of variation (S.D./mean) for the repeated measurementof muscle homogenate pH and homogenate buffer value (10 homogenates made up separately from thesame muscle block) were 0-2 % and 2-2 %, respectively.
Performance measuresIsometric exercise. Evaluation of isometric high intensity exercise capacity required the initial
determination of the maximum voluntary contraction (MVC) of the knee extensors. The apparatus usedwas similar to that described by Maughan, Watson & Weir (1983). Subjects were seated securely withthe hip and knee joints flexed to 90 deg. Using a high precision load cell, the maximum reproducibleforce (generated over a fixed lever arm of 360 mm) that could be sustained for 1-2 s was recorded. Theamplified output was displayed on a pen recorder. The force corresponding to 60 % MVC was markedon the recorder, which subjects observed whilst maintaining this force to fatigue. The endurance time tofatigue (in seconds) was taken as a measure of the isometric high intensity exercise capacity.Dynamic exercise. For the assessment of dynamic high intensity exercise capacity, subjects
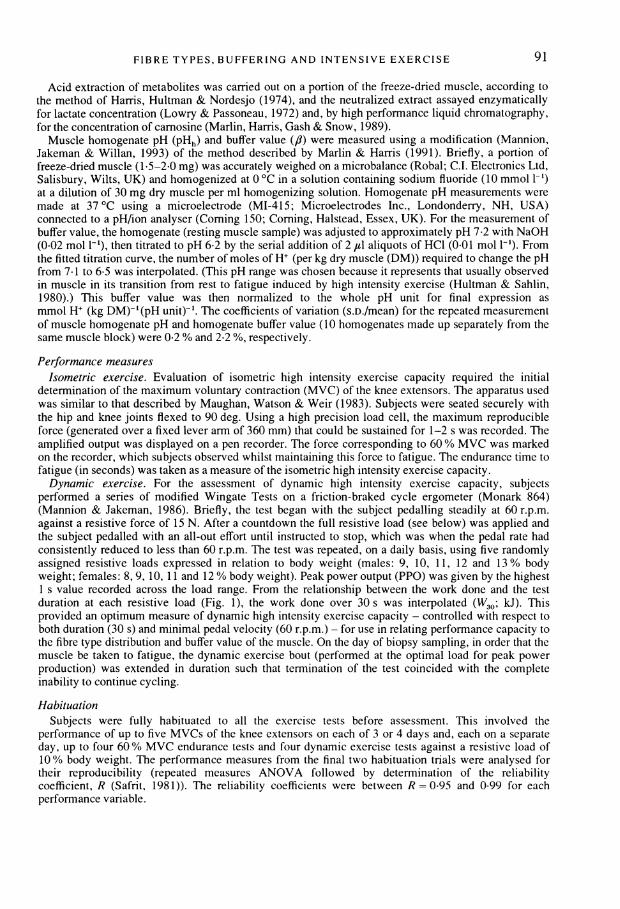
performed a series of modified Wingate Tests on a friction-braked cycle ergometer (Monark 864)(Mannion & Jakeman, 1986). Briefly, the test began with the subject pedalling steadily at 60 r.p.m.against a resistive force of 15 N. After a countdown the full resistive load (see below) was applied andthe subject pedalled with an all-out effort until instructed to stop, which was when the pedal rate hadconsistently reduced to less than 60 r.p.m. The test was repeated, on a daily basis, using five randomlyassigned resistive loads expressed in relation to body weight (males: 9, 10, 11, 12 and 13% bodyweight; females: 8, 9, 10, 11 and 12 % body weight). Peak power output (PPO) was given by the highest1 s value recorded across the load range. From the relationship between the work done and the testduration at each resistive load (Fig. 1), the work done over 30 s was interpolated (W30; kJ). Thisprovided an optimum measure of dynamic high intensity exercise capacity - controlled with respect toboth duration (30 s) and minimal pedal velocity (60 r.p.m.) - for use in relating performance capacity tothe fibre type distribution and buffer value of the muscle. On the day of biopsy sampling, in order that themuscle be taken to fatigue, the dynamic exercise bout (performed at the optimal load for peak powerproduction) was extended in duration such that termination of the test coincided with the completeinability to continue cycling.
HabituationSubjects were fully habituated to all the exercise tests before assessment. This involved the
performance of up to five MVCs of the knee extensors on each of 3 or 4 days and, each on a separateday, up to four 60 % MVC endurance tests and four dynamic exercise tests against a resistive load of10% body weight. The performance measures from the final two habituation trials were analysed fortheir reproducibility (repeated measures ANOVA followed by determination of the reliabilitycoefficient, R (Safrit, 1981)). The reliability coefficients were between R = 095 and 099 for eachperformance variable.
91
A. F. MANNION AND OTHERS
Statistical analysesResults are expressed as means + S.D. Associations between variables were examined using the
Pearson product-moment correlation coefficient (r). The dependence of one variable upon another wasdetermined by regression analysis (first- and second-order polynomial, or exponential, as appropriate).Independent Student's t tests were used to evaluate gender differences in the muscle biopsy analysesand performance measures. Specific a values are given for each analysis; statistical significance was
accepted at the 5 % level.Although eighteen subjects completed the study, sufficient muscle was not always available from
every sample to undertake the full complement of analyses. Hence, the appropriate numbers involved in
each analysis are given in the relevant section of the results.
30 - = -15 298 + 2 1478x - 0 0026158 x2
r = 0-996
28- 1 9
11%
26--: - - - - - - -/ 02
2422 -
/1%
20-24 26 28 30 32 -34 -36 -38 40 42
Time (s)
Fig. 1. Relationship between work done and test duration during performance of modified Wingate Test over the range ofresistive loads (9-13 % body weight, as marked). Work done over 30 s (W30) is interpolated from the regressionequation.
Table 1. Mean, S.D. and range of values derived from the muscle biopsy analyses
n Mean S.D. Range
Percentage type I fibre area 18 48-1 10 7 306-64.1Percentage type II (a and b) fibre area 18 50.7 11.0 33-0-69.4Mean fibre area(um2) 17 4424 1081 2610-6212Muscle buffer value (mmol H+ (kg DM)-' (pH unit)`') 17 159 17 119-190Muscle [camosine] (mmol H+ (kg DM)-') 18 21.8 4.1 13.3-28 9Restingmuscle pHh 17 7 17 009 6.95-7.31Post-exercise pHh
Isometric exercise 1 1 6.89 0 10 6.69-7-00Dynamic exercise 9 6.68 0 13 6.53-6.91
Resting muscle [lactate] (mmol (kg DM)-') 17 6.5 3.0 1.8-14.0Post-exercise [lacate] (mmol (kg DM)-')
Isometric exercise 11 58 0 15 2 40 2-90.3Dynamic exercise 13 99-6 27.6 524- 136.6
pHh, muscle homogenate pH.
92
FIBRE TYPES, BUFFERING AND INTENSIVE EXERCISE
RESULTS
The group mean, S.D. and range of values obtained from the muscle biopsy analyses arepresented in Table 1. There was no significant gender difference (P > 0.05) for any of theparameters shown, except for the mean fibre area (females: 3606 + 674 #um2; males:4850 + 967 /sm2; P = 0.013). Table 2 shows the corresponding data for the high intensitydynamic and isometric exercise tasks. Some of the measurements derived from performanceof these tests were undoubtedly influenced by the size of the active muscle mass. This isfrequently dealt with by expressing such measures in relation to body mass, lean body massor the cross-sectional area (CSA) of the muscles involved (e.g. Maughan et al. 1983). In thepresent study we were not able to make measurements of whole muscle CSA but we wereable to analyse the effect of mean fibre area (MFA), as determined from the quadricepsmuscle biopsy samples. MFA has been shown to correlate highly with the CSA of wholemuscle (Haggmark, Jansson & Svane, 1978; Schantz, Randall-Fox, Norgen & Tyden, 1981;MacDougall, Sale, Alway & Sutton, 1984), accounting for up to 83 % of the variance in CSA(Haggmark et al. 1978). In the present study MFA showed a significant positive correlation
A210- y = 125-81 + 0-66064x
-= 0-42190-*
G;170-*
_ .5 *
E 130-
25 35 45 55 65 75
B 35- y = 13 646 + 0.16002x_ r = 0-43
2530 3
Pecetae1re0o te usleocupedbytye i ibe
25~~~35 45 5 5 7Percentag arao h ucl cuidb tp1fbe
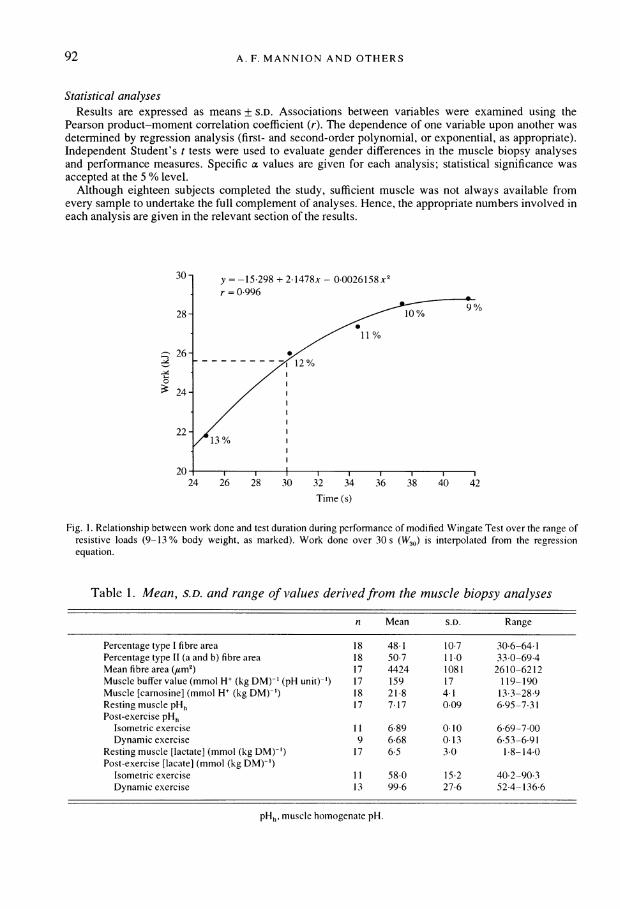
Fig. 2. Relationship between the relative area of the muscle occupied by type II fibres and muscle buffer value (A), ormuscle carnosine concentration (B).
93
A. F. MANNION AND OTHERS
A
150-04-4 130-
E 110-
CO 90-CO
-7570
E50-
J225
B 100
90
-4 80
E 70
' 60I
X 50a)c) 40
2 30
20
y = 31-173 + 1 3819x
r06
0 9**~~~~
35 45 55 65 75
y = 5.7701 + 1.0545xr = 0.79
0
35 45 55 65Percentage area of muscle occupied by type II fibres
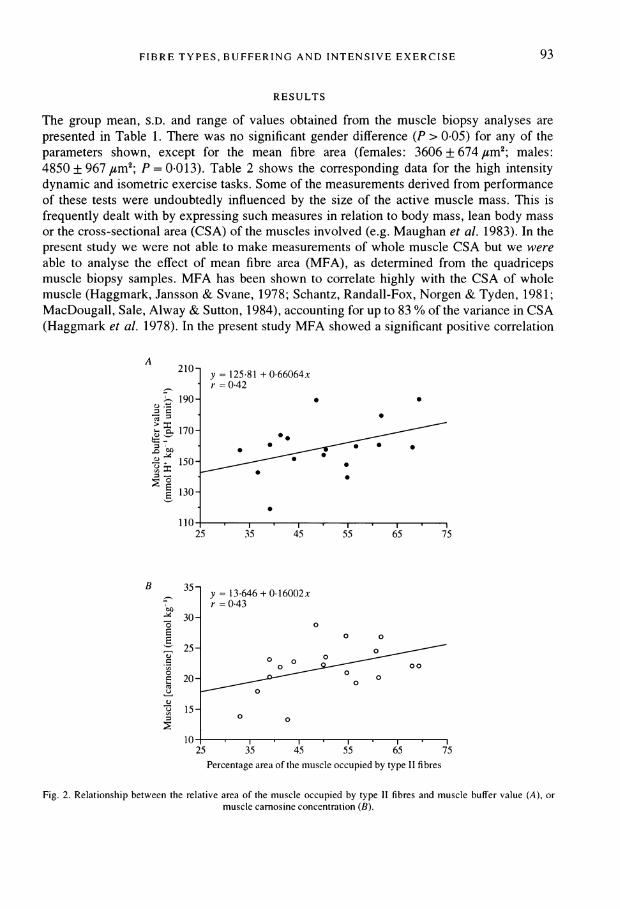
Fig. 3. Relationship between the relative area of the muscle occupied by type II fibres and the muscle lactateconcentration post-dynamic (A) and post-isometric exercise to fatigue (B).
Table 2. Mean, S.D. and range of dynamic and isometric performance data
n Mean S.D. Range
Dynamic exercise testPeak power output (W) 18 1025 249 600- 1379PPO (W)/MFA (urm') 17 0-243 0-054 0 174-0 382W30 (kJ) 18 20 2 4.3 12 2-27 0W30 (J)/MFA (,sm2) 17 4.79 1 0 3 60-7 51
Isometric exercise testMVC (N) 18 632 177 324-99160% MVC endurance (s) 18 64 1 11 0 44 0-76 0
with MVC (r = 0 52, P = 0.011, increasing to r = 0 66, P = 0 002 upon exclusion of one
outlying data point) and therefore appears to relate as well to MVC as the anatomical CSAhas been shown to do (Maughan et al. 1983; Maughan & Nimmo, 1984). The size-dependentperformance variables (PPO, W30, MVC) were therefore normalized, where necessary, byexpressing them in relation to the mean fibre area.
0
0
75
,Ml J
94
FIBRE TYPES, BUFFERING AND INTENSIVE EXERCISE
A 4-0_ y =0-28575 + 0-03585 x
r = 0-66
2o
0~~~~~~~~
0E 1-0-E
UU0-
g 25 ~~~35 45 55 65 75
B . 2-00y=-0-46310 + 0-027753xr = 0-81
1.5-0-5 -z05 -
/10
25 35 4-5 55 65 75Percentage area of the muscle occupied by type II fibres
Fig. 4. Relationship between the relative area of the muscle occupied by type II fibres and the mean rate of muscle lactateaccumulation during dynamic (A) and isometric (B) exercise to fatigue.
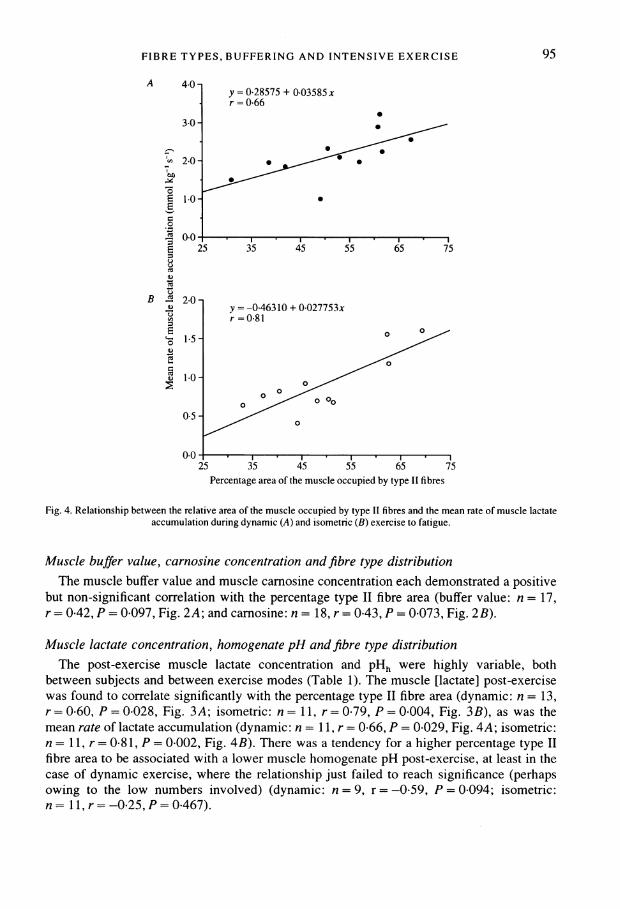
Muscle buffer value, carnosine concentration and fibre type distributionThe muscle buffer value and muscle carnosine concentration each demonstrated a positive
but non-significant correlation with the percentage type II fibre area (buffer value: n = 17,r = 0.42, P = 0.097, Fig. 2A; and carnosine: n = 18, r = 0-43, P = 0.073, Fig. 2B).
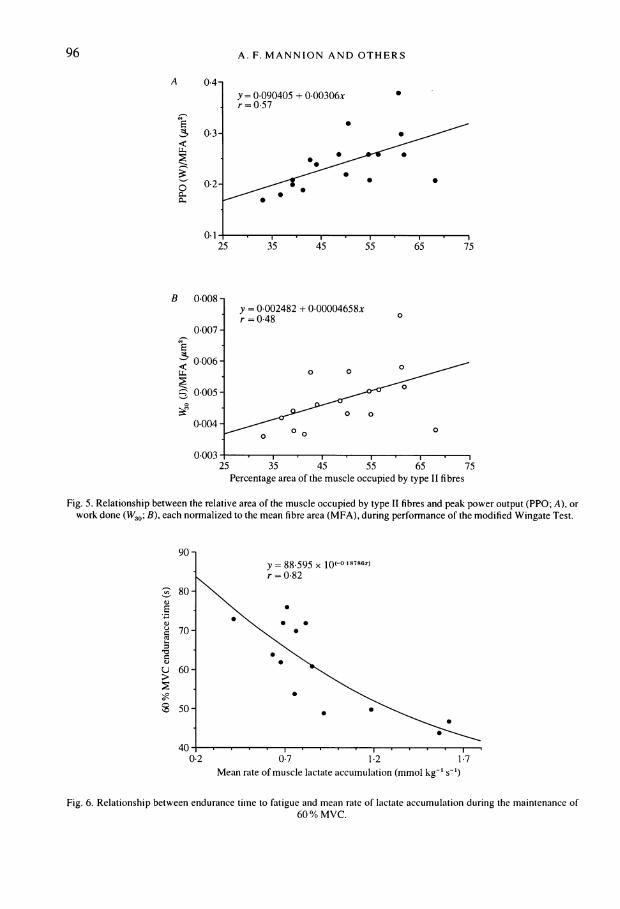
Muscle lactate concentration, homogenate pH and fibre type distributionThe post-exercise muscle lactate concentration and pHh were highly variable, both
between subjects and between exercise modes (Table 1). The muscle [lactate] post-exercisewas found to correlate significantly with the percentage type II fibre area (dynamic: n = 13,r= 0*60, P = 0*028, Fig. 3A; isometric: n = 11, r= 0 79, P = 0*004, Fig. 3B), as was themean rate of lactate accumulation (dynamic: n = 11, r = 0-66, P = 0-029, Fig. 4A; isometric:n = 11, r = 0 81, P = 0 002, Fig. 4B). There was a tendency for a higher percentage type IIfibre area to be associated with a lower muscle homogenate pH post-exercise, at least in thecase of dynamic exercise, where the relationship just failed to reach significance (perhapsowing to the low numbers involved) (dynamic: n = 9, r = -0-59, P = 0-094; isometric:n= 11,r=-0.25,P=0-467).
95
96 A. F. MANNION AND OTHERS
A 0.4-y= 0-090405 + 0-00306xr = 0 57
0.33
0)-2.- *
0-1- . . . ,25 35 45 55 65 75
B 0-008y = 0002482 + 0-00004658xr =048 0
0-007 -
$ P0n006e- o o
90~~~~~~~~
E0-005 -
g~~ ~~~ - 8859 x 10o88x~~~~80~~ ~~~~~
0-004 -
0
0.003 - . , .25 35 45 55 65 75
Percentage area of the muscle occupied by type II fibres
Fig. 5. Relationship between the relative area Of the muscle occupied by type II fibres and peakc power output (PPO; A), orwork- done (W30; B), each norrnalized to the mean fibre area (MFA), during perforrnance of the modified Wingate Test.
90 -
y = 88 595 x lo(-0 l78x.~~~~ =r0-82
80-\
E\ EC 70-\
U 60-
350- S * \
0-7 1 2 1-7Mean rate of muscle lactate accumulation (mmol kg-' s-')
Fig. 6. Relationship between endurance time to fatigue and mean rate of lactate accumulation during the maintenance of60 % MVC.
FIBRE TYPES, BUFFERING AND INTENSIVE EXERCISE
High intensity exercise capacity and fibre type distributionWhen the performance data were normalized to MFA, there was no significant difference
between male and female values for MVC (P = 0.220), PPO (P = 0.482) or W30 (P = 0.667).In addition, males and females displayed no significant difference in their 60% MVCendurance times (P = 0.520).
Normalized PPO and W330 during the dynamic exercise test each correlated significantlywith the relative area of the muscle occupied by type II fibres (n = 17, r = 0.57, P = 0.016and n = 17, r = 0-48, P = 0.005, respectively; Fig. SA and B). No significant relationship wasobserved between 60 % MVC endurance time and percentage type II fibre area (n = 18,r = -0.30, P = 0.224).
High intensity exercise capacity, post-exercise muscle pH/lactate concentration andskeletal muscle buffering
Normalized W30 (value obtained on the day of the biopsy) showed a significant positivecorrelation with the muscle lactate concentration post-dynamic exercise (n = 12, r= 0.64,P 0.026) but a non-significant negative correlation with the post-exercise muscle pH(n = 9, r = -0 45, P = 0.211). Sixty per cent MVC endurance time displayed no significantrelationship with either the post-exercise muscle lactate concentration (n = 13, r = -0.45,P = 0.128) or muscle pHh (n = 13, r = 0416, P = 0.157) but a highly significant inverserelationship with the mean rate of lactate accumulation ([lactate] s-1) (n = 13, r = -0 82,P = 0.0007, Fig. 6).
Correlations between the muscle buffer value and either dynamic or isometric high intensityexercise capacity were non-significant (f vs. normalized W30: n = 16, r = 0 34, P = 0 196; ,vs. endurance time: n = 17, r = -0 19, P = 0.454). An elevated muscle buffer value was notassociated with the capacity to accumulate a higher muscle lactate concentration duringexercise (dynamic: n = 14, r = -0.18, P = 0.550; isometric: n = 7, r = -0 14, P = 0.596).There was, however, a tendency for an elevated muscle buffer value to be associated with alesser change in muscle pHh, at least in the case of isometric exercise (dynamic: n = 11,r = -0.338, P = 0 374; isometric: n = 6, r = -0.79, P = 0.064).
DISCUSSION
It has been suggested, on the basis of animal studies, that the buffer value of a muscle ishighly correlated with its glycolytic capacity, and that these two metabolic propertiespossiblv co-adapt (Castellini & Somero, 1981; Hochachka, 1990). The functional significanceunderlying this correlation relates to the deleterious effects of a decline in pH on the processof muscle contraction: the coupling of an elevated capacity to sequester protons in a muscletype which displays an enhanced ability to generate metabolic acids should serve tominimize the disturbance to that muscle's acid-base balance.
In view of the expectedly higher glycolytic capacity of the type II fibre (Essen, Jansson,Henrikson, Taylor & Saltin, 1975) it was surprising that, in the present study, a rather lowand non-significant correlation between the muscle buffer value and the relative area of themuscle occupied by type II fibres was observed (r = 0.42). Previous studies on humanmuscle have reported conflicting results: no correlation between the muscle buffer value andthe fibre type distribution was observed by Sahlin & Henriksson (1984) or by Mizuno et al.
97
A. F. MANNION AND OTHERS
(1990), whereas Parkhouse et al. (1985) reported a moderate (though significant) correlation(r = 0.51). The latter study was carried out on a diverse group of specifically trained athletes,for which a wider and more heterogeneous set of data would be expected, possibly accountingfor their slightly higher correlation coefficient. Nonetheless, the fibre type distribution wasstill only able to account for approximately 25 % of the variance in the muscle buffer value.The major buffering constituents of human skeletal muscle have been identified as protein,
inorganic phosphate, and the histidine-containing dipeptide, carnosine (Parkhouse &McKenzie, 1984). In a study carried out on equine muscle, where the buffer value was shownto be highly dependent upon the relative distribution of the fibre types (r = 0*57, P < 0.01),the strength of the relationship was attributed to fibre type-specific differences in musclecamosine concentration; when the contribution from carnosine buffering was excluded, thedependence of the muscle buffer value on the fibre type distribution was no longer evident(Sewell, Harris & Dunnett, 1991). The mean human muscle camosine concentration reportedin the present study (21.8 mmol (kg DM)-') was much lower than that of equine muscle(109 + 15 mmol (kg DM)- (Marlin et al. 1989); 125 + 26 mmol (kg DM)-'(Sewell, Harris,Marlin & Dunnett, 1992)), and showed only a moderate, non-significant correlation with themuscle fibre type (r = 0.43, P = 0.07). Thus, if the major factor influencing the relationshipbetween the fibre type distribution and the buffer value in other species is the camosineconcentration, then it is perhaps unsurprising that in human muscle - with its relatively lowcarnosine concentration and lesser differential between the fibre types - no significantcorrelation was observed.A suggested benefit of an elevated muscle buffer value is that it should allow the muscle to
accumulate more lactic acid before reaching a limiting muscle pH, and thus allow for a moreprolonged high intensity exercise performance (Parkhouse & McKenzie, 1984). Implicit inthis theory is the assumption that intramuscular acidosis represents a direct and primarycause of fatigue in the intensely contracting muscle. The results of the present study raiseseveral objections to both facets of this hypothesis. First, confirming the findings of otherstudies (Sahlin & Henriksson, 1984) the present data reveal the existence of a wide range ofindividual post-exercise muscle pH values. This somewhat contradicts the concept of a'critical muscle pH' - which, once reached, prevents continued activity - and, instead, seemsto suggest that, if acidosis has a role to play as a limiting factor to the performance of highintensity exercise, then considerable interindividual differences must exist in the pH sensitivityof the various processes involved. Skinned fibre studies have revealed a differentialsensitivity to acidosis of the force-generating apparatus of various muscle fibre types, withtype I fibres consistently demonstrating a greater resilience to H+-mediated contractiledysfunction than type II fibres (Metzger & Moss, 1987). However, in this respect, anotherconflict arises: in the present study, the greater the area of the muscle occupied by type IIfibres, the lower the muscle pH at fatigue. By extrapolation of our regression equation ofpost-exercise pH on percentage type II fibre area (to 100 % of one fibre type), the mean post-dynamic exercise pH values of type I and type II fibres can be estimated to be 7-03 and 6-36,respectively, values which compare favourably with previous determinations using P-NMR(Achten, Van Cauteren, Willem, Luypaert, Malaisse, Van Bosch, Delanghe, De Meirleir &Osteaux, 1990). If fatigue occurred simply as a result of direct H+ inhibition of thecontractile machinery, and if type II fibres are indeed more sensitive than type I fibres to this
98
FIBRE TYPES, BUFFERING AND INTENSIVE EXERCISE
kind of inhibition, then type II fibres ought to be incapacitated by a relatively lower H+concentration such that their pH at fatigue would be higher (not lower) than that of the type Ifibres.A second objection to the theory regarding the proposed benefits of an enhanced muscle
buffer value, is that an elevated buffer value was not associated with an increased ability toaccumulate lactate during the performance of high intensity exercise. This finding is notunique to the present study. Although specific correlations between the muscle buffer valueand the post-exercise muscle lactate concentration have not previously been reported, cross-sectional and longitudinal studies have shown that muscles which display an elevated buffervalue (Sahlin & Henriksson, 1984), or achieve an improved value following training (Troup,Metzger & Fitts, 1986), tend to generate less lactate during intensive contraction. The finalobjection, unsurprising in view of the preceding comments, is that no significant relationshipwas observed between the muscle buffer value and either the work done during dynamic highintensity exercise or the 60 % MVC time to fatigue.
Thus, whilst an elevated muscle buffer value may assist in moderating the change in musclepH pre- to post-exercise, it does not per se permit the accumulation of greater quantities oflactate or allow for the performance of significantly more work during high intensityexercise. From the results of the present study, the more important factor appears to relate tothe (expected) glycolytic capacity of the muscle: the post-exercise lactate concentration(dynamic or isometric) and the work done during the dynamic exercise test were each highlycorrelated with the relative area of the muscle occupied by type II fibres. Extrapolation fromthe regression equations of normalized peak power output, and work, on percentage type IIfibre area, revealed that a hypothetical muscle composed of 100 % type II fibres wouldgenerate 4 times the peak power of, and 3 times the work done by, a muscle consistingentirely of type I fibres. A similar disparity between the peak power output of the two majorfibre types has previously been observed in bundles of fibre segments from human skeletalmuscles (Faulkner, Claflin & McCully, 1986). That type II fibres are physiologically andmetabolically better equipped to perform maximal contractions at high velocities is by nomeans a new finding; it is a concept which is suggested both in theory, from a knowledge ofthe contraction kinetics and metabolic profile of type II fibres (Saltin & Gollnick, 1983), andin practice, from the significant relationships observed between the percentage type II fibrearea and dynamic high intensity exercise performance (Bar-Or, Dotan, Inbar, Rothstein,Karlsson & Tesch, 1980).
In summary, it has been shown that a rather low and non-significant correlation existsbetween the human muscle buffer value and the relative area of the muscle occupied bytype II fibres. Previous suggestions that an elevated muscle buffer value may allow for anenhanced high intensity exercise performance, with the accumulation of a higher musclelactate concentration before a limiting muscle pH is reached, could not be confirmed. Thepresent findings may serve to support recent evidence (Sahlin, 1992) that if acidosis makesany contribution to the fatigue encountered during performance of this type of exercise it isan indirect one, possibly concerning the glycolytic resynthesis of ATP.
The support of the Sports Council of Great Britain is gratefully acknowledged.
99
A. F. MANNION AND OTHERS
REFERENCES
ACHTEN, E., VAN CAUTEREN, M., WILLEM, R., LUYPAERT, R., MALAISSE, W. J., VAN BOSCH, G.,DELANGHE, G., DE MEIRLEI, K. & OSTEAUX, M. (1990). 31P-NMR spectroscopy and the metabolicproperties of different muscle fibers. Journal of Applied Physiology 68, 644-649.
BAR-OR, O., DOTAN, R., INBAR, O., ROTHSTEIN, A., KARLSSON, J. & TESCH, P. (1980). Anaerobiccapacity and muscle fiber type distribution in man. International Journal of Sports Medicine 1,82-85.
BLOMSTRAND, E., CELSING, F., FRiDEN, J. & EKBLOM, B. (1984). How to calculate human muscle fibreareas in biopsy samples - methodological considerations. Acta Physiologica Scandinavica 122,545-551.
CASTELLINI, M. A. & SOMERO, G. N. (1981). Buffering capacity of vertebrate muscle: correlations withpotentials for anaerobic function. Journal of Comparative Physiology 143, 191-198.
DUBOWITZ, V. & BROOKE, M. H. (1973). Muscle Biopsy: A Modern Approach. W. B. Saunders Co.,Philadelphia.
ESSEN, B., JANSSON, E., HENRIKSON, J., TAYLOR, A. W. & SALTIN, B. (1975). Metabolic characteristicsof fibre types in human skeletal muscle. Acta Physiologica Scandinavica 9, 153-165.
FAULKNER, J. A., CLAFLIN, D. R. & MCCULLY. K. K. (1986) Power output in fast and slow fibers fromhuman skeletal muscle. In Human Muscle Power, ed. JONES, N. L., MCCARTNEY, N. & MCCOMAS,A. J., pp. 81-91. Human Kinetics Publishers, Champaign, IL, USA.
HAGGMARK, T., JANSSON, E. & SVANE, B. (1978). Cross-sectional area of the thigh muscle in manmeasured by computed tomography. Scandinavian Journal of Clinical Laboratory Investigation 38,355-360.
HAINAUT, K. & DUCHATEAU, J. (1989). Muscle fatigue, effects of training and disuse. Muscle and Nerve12,660-669.
HARRIS, R. C., HULTMAN, E. & NORDESJO, L. 0. (1974). Glycogen, glycolytic intermediates and high-energy phosphates determined in biopsy samples of musculus quadriceps femoris of man at rest.Methods and variance of values. Scandinavian Journal of Clinical Laboratory Investigation 38,109-120.
HOCHACHKA, P. W. (1990). The biochemical limits of muscle work. In Biochemistry of Exercise VII,International Series on Sport Sciences, vol. 21, ed. TAYLOR, A. W., GOLLNICK, P. D., GREEN, H. J.,IANUZZO, C. D., NOBLE, E. G., METIVIER, G. & SUrrON, J. R., pp. 1-9. Human Kinetics Publishers,Champaign, IL, USA.
HULTMAN, E. & SAHLIN, K. (1980). Acid-base balance during exercise. Exercise and Sport SciencesReviews 8, 41-128.
LOWRY, 0. H. & PASSONEAU, J. V. (1972). A Flexible System of Enzyme Analysis. Academic Press,New York.
MACDOUGALL, J. D., SALE, D. G., ALWAY, S. E. & SuTrON, J. R. (1984). Muscle fiber number in bicepsbrachii in bodybuilders and control subjects. Journal of Applied Physiology 57, 1399-1403.
MANNION, A. F. & JAKEMAN, P. M. (1986). Comparison of velocity dependent and time dependentmeasures of anaerobic work capacity. In Proceedings of the VIII Commonwealth and InternationalConference, Kinanthropometry III, ed. REILLY, T., WATKINS, J. & BORMS, J., pp. 301-307. E. & F. N.Spon, London.
MANNION, A. F., JAKEMAN, P. M. & WILLAN, P. L. T. (1993). Determination of human skeletal musclebuffer value by homogenate technique: methods of measurement. Journal of Applied Physiology 75,1412-1418.
MARLIN, D. J. & HARRIS, R. C. (1991). Titrimetric determination of muscle buffering capacity (,#mtitr)in biopsy samples. Equine Veterinary Journal 23, 193-197.
MARLIN, D. J., HARRIS, R. C., GASH, S. P. & SNOW, D. H. (1989). Carnosine content of the middlegluteal muscle in thoroughbred horses with relation to age, sex and training. ComparativeBiochemistry and Physiology 93A, 629-632.
MAUGHAN, R. J. & NIMMO, M. A. (1984). The influence of variations in muscle fibre composition onmuscle strength and cross-sectional area in untrained males. Journal of Physiology 351, 299-31 1.
MAUGHAN, R. J., WATSON, J. S. & WEIR, J. (1983). Strength and cross-sectional area of human skeletalmuscle. Journal of Physiology 338, 37-49.
100
FIBRE TYPES, BUFFERING AND INTENSIVE EXERCISE
METZGER, J. M. & Moss, R. L. (1987). Greater H+-induced depression of tension and velocity in singleskinned fibres of rat fast versus slow muscles. Journal of Physiology 393, 727-742.
MIZUNO, M., JUEL, C., BRO-RASMUSSEN, T., MYGIND, E., SCHIBYE, B., RASMUSSEN, B. & SALTIN, B.(1990). Limb skeletal muscle adaptation in athletes after training at altitude. Journal of AppliedPhysiology 68,496-502.
PARKHOUSE, W. S. & MCKENZIE, D. C. (1984). Possible contribution of skeletal muscle buffers toenhanced anaerobic performance: a brief review. Medicine and Science in Sports and Exercise 16,328-338.
PARKHOUSE, W. S., MCKENZIE, D. C., HOCHACHKA, P. W. & OVALLE, W. K. (1985). Buffering capacityof deproteinised human vastus lateralis muscle. Journal of Applied Physiology 58, 14-17.
SAFRIT, M. J. (1981). Evaluation in Physical Education, 2nd edn. Prentice Hall, Englewood Cliffs, NJ,USA.
SAHLIN, K. (1992). Metabolic factors in fatigue. Sports Medicine 13, 99-107.SAHLIN, K. & HENRIKSSON, J. (1984). Buffer capacity and lactate accumulation in skeletal muscle of
trained and untrained men. Acta Physiologica Scandinavica 122, 331-339.SALTIN, B. & GOLLNICK, P. D. (1983). Skeletal muscle adaptability: significance for metabolism and
performance. In Handbook of Physiology, section 10, Skeletal Muscle, ed. PEACHEY, L. D., ADRIANR. H. & GEIGER, S. R., pp. 555-631. American Physiological Society, Bethesda, MD, USA.
SCHANTZ, P. G., RANDALL-FOX, E., NORGEN, P. & TYDEN, A. (1981). The relationship between the meanmuscle fibre area and the muscle cross-sectional area of the thigh in subjects with large differences inthigh girth. Acta Physiologica Scandinavica 113, 537-539.
SEWELL, D. A., HARRIS, R. C. & DUNNETT, M. (1991). Camosine accounts for most of the variation inphysico-chemical buffering in equine muscle. Equine Exercise Physiology 3, 276-280.
SEWELL, D. A., HARRIS, R. C., MARLIN, D. J. & DUNNETT, M. (1992). Estimation of the camosinecontent of different fibre types in the middle gluteal muscle of the thoroughbred horse. Journal ofPhysiology 455,447-453.
TROUP, J. P., METZGER, J. M. & FITrs, R. H. (1986). Effect of high intensity exercise training onfunctional capacity of limb skeletal muscle. Journal of Applied Physiology 60, 1743-1751.
101


![Measurement of the exercising blood flow during rhythmical … · 2013. 12. 24. · [3,9]. Cardiac output increases with increasing exercise intensity along with enhanced skeletal](https://img.pdfslide.net/doc/110x75/61298ae73ccda0538431c0c7/measurement-of-the-exercising-blood-flow-during-rhythmical-2013-12-24-39.jpg)