Embed Size (px)
Citation preview
Skeletal Structure and Strength CoreSkeletal Structure and Strength Core
l k l t l tl dmusculoskeletalcore.wustl.edu
Matthew J. Silva, Ph.D.
N b 20 2009November 20, 2009
Washington University Core Center for Musculoskeletal Biology and Medicine (NIH P30)
M.J. Silva, November 2009
Musculoskeletal Structure and Strength CoreMusculoskeletal Structure and Strength Core
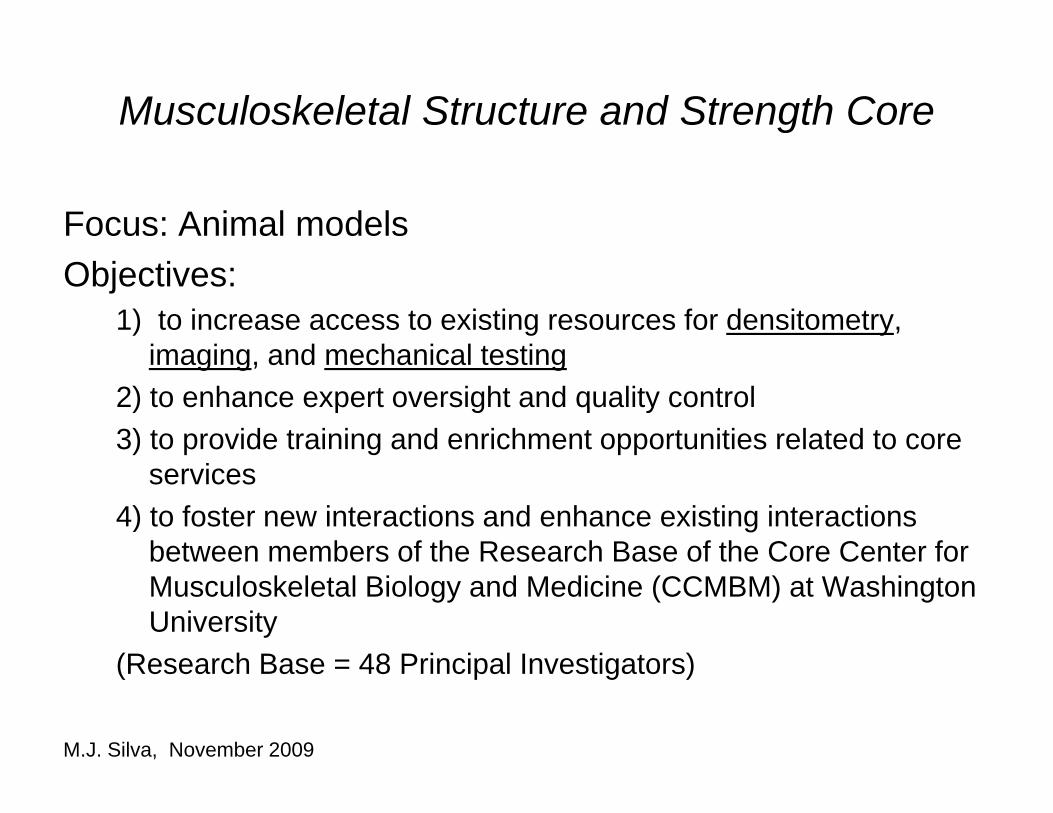
Focus: Animal modelsObjectives:
1) to increase access to existing resources for densitometry, imaging, and mechanical testing
2) to enhance expert oversight and quality control2) to enhance expert oversight and quality control3) to provide training and enrichment opportunities related to core
services4) f i i d h i i i i4) to foster new interactions and enhance existing interactions
between members of the Research Base of the Core Center for Musculoskeletal Biology and Medicine (CCMBM) at Washington University
(Research Base = 48 Principal Investigators)
M.J. Silva, November 2009
Musculoskeletal Structure and Strength Core
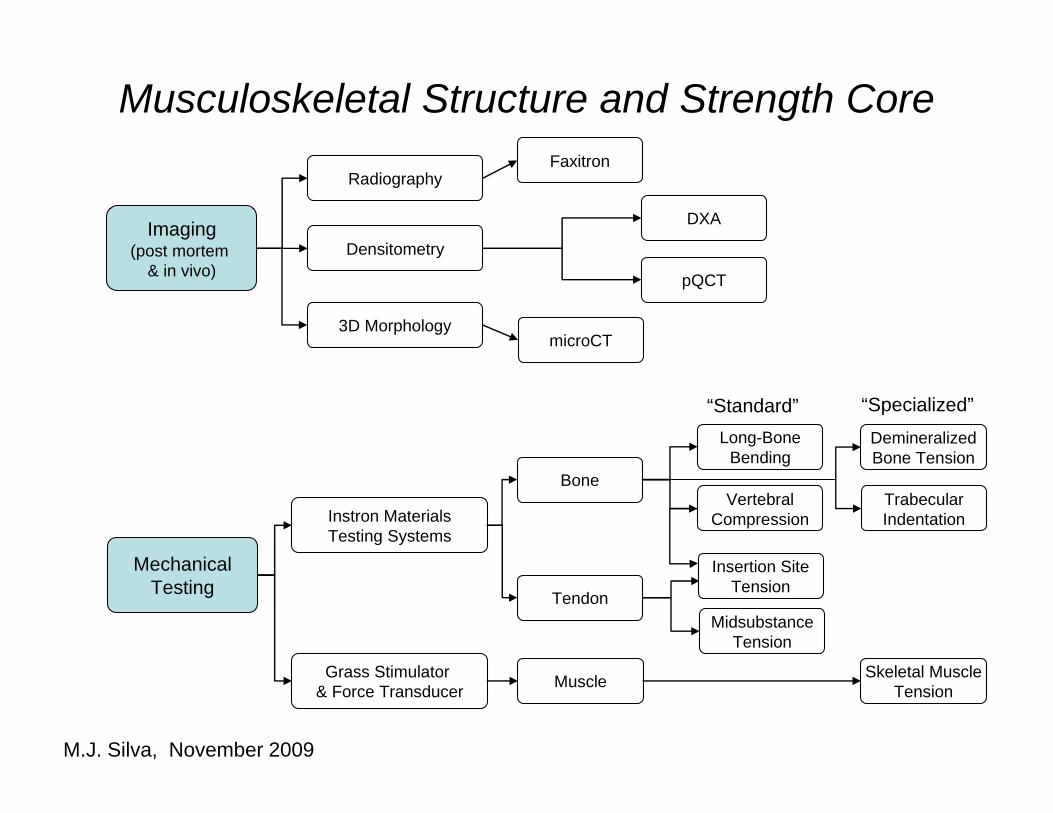
RadiographyFaxitron
Musculoskeletal Structure and Strength Core
Imaging(post mortem
& in vivo)Densitometry
DXA
pQCT
3D MorphologymicroCT
“Standard” “Specialized”
Bone
Long-BoneBending
Vertebral
Standard SpecializedDemineralizedBone Tension
Trabecular
MechanicalTesting
Instron MaterialsTesting Systems
Tendon
Compression
Insertion SiteTension
Indentation
MidsubstanceTension
Grass Stimulator & Force Transducer Muscle Skeletal Muscle
Tension
M.J. Silva, November 2009
Musculoskeletal Structure and Strength CoreMusculoskeletal Structure and Strength Core
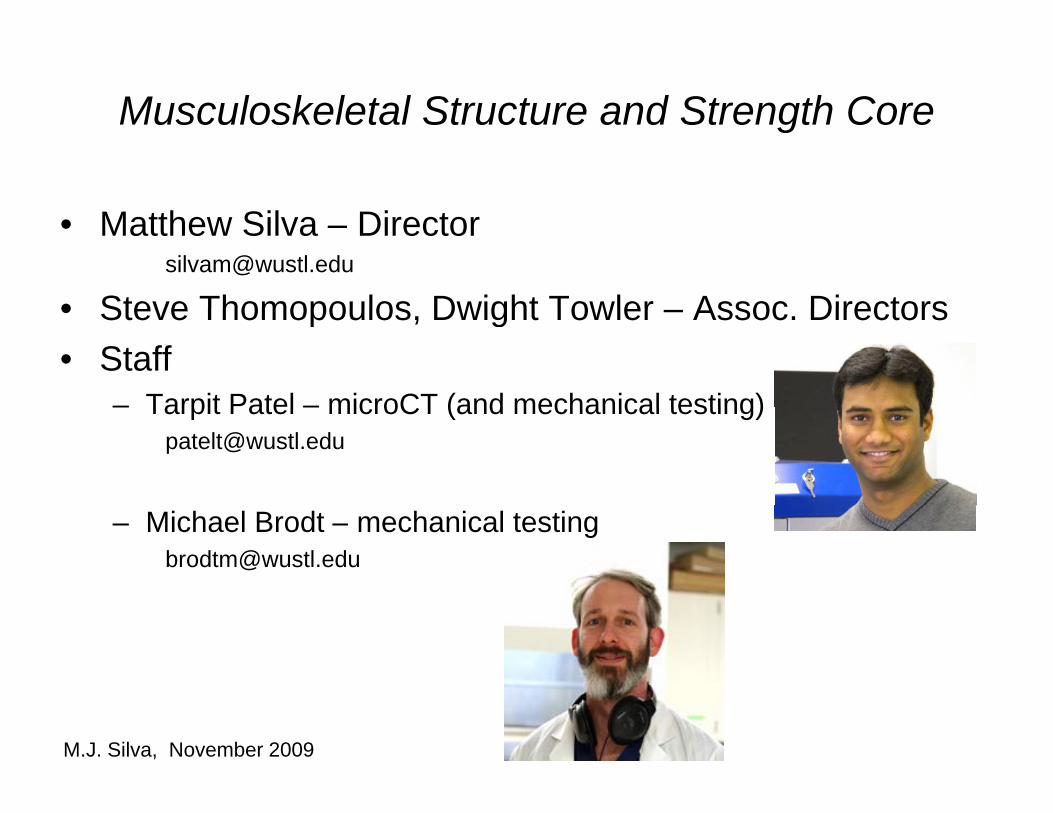
• Matthew Silva – [email protected]
• Steve Thomopoulos Dwight Towler Assoc Directors• Steve Thomopoulos, Dwight Towler – Assoc. Directors• Staff
– Tarpit Patel – microCT (and mechanical testing)– Tarpit Patel – microCT (and mechanical testing)[email protected]
– Michael Brodt – mechanical [email protected]
M.J. Silva, November 2009
Musculoskeletal Structure and Strength CoreMusculoskeletal Structure and Strength Core
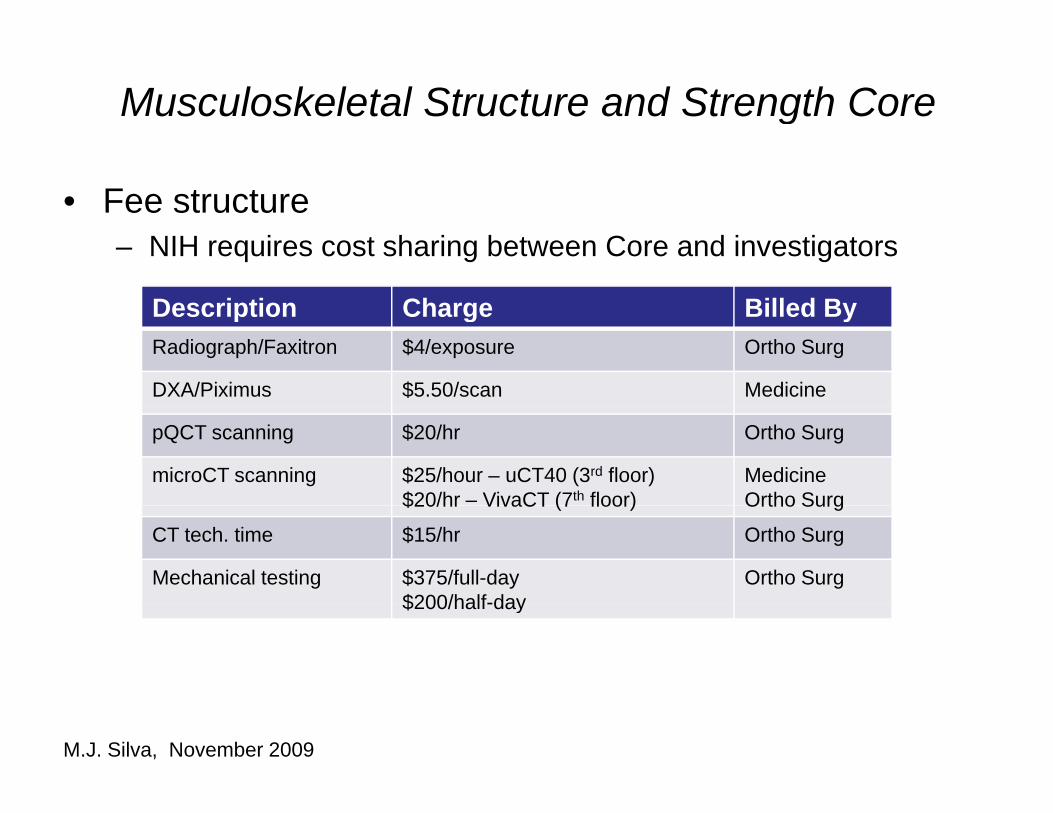
• Fee structureFee structure– NIH requires cost sharing between Core and investigators
Description Charge Billed ByDescription Charge Billed ByRadiograph/Faxitron $4/exposure Ortho Surg
DXA/Piximus $5.50/scan Medicine
pQCT scanning $20/hr Ortho Surg
microCT scanning $25/hour – uCT40 (3rd floor)$20/hr – VivaCT (7th floor)
MedicineOrtho Surg$20/hr VivaCT (7 floor) Ortho Surg
CT tech. time $15/hr Ortho Surg
Mechanical testing $375/full-day$200/half-day
Ortho Surg$200/half-day
M.J. Silva, November 2009
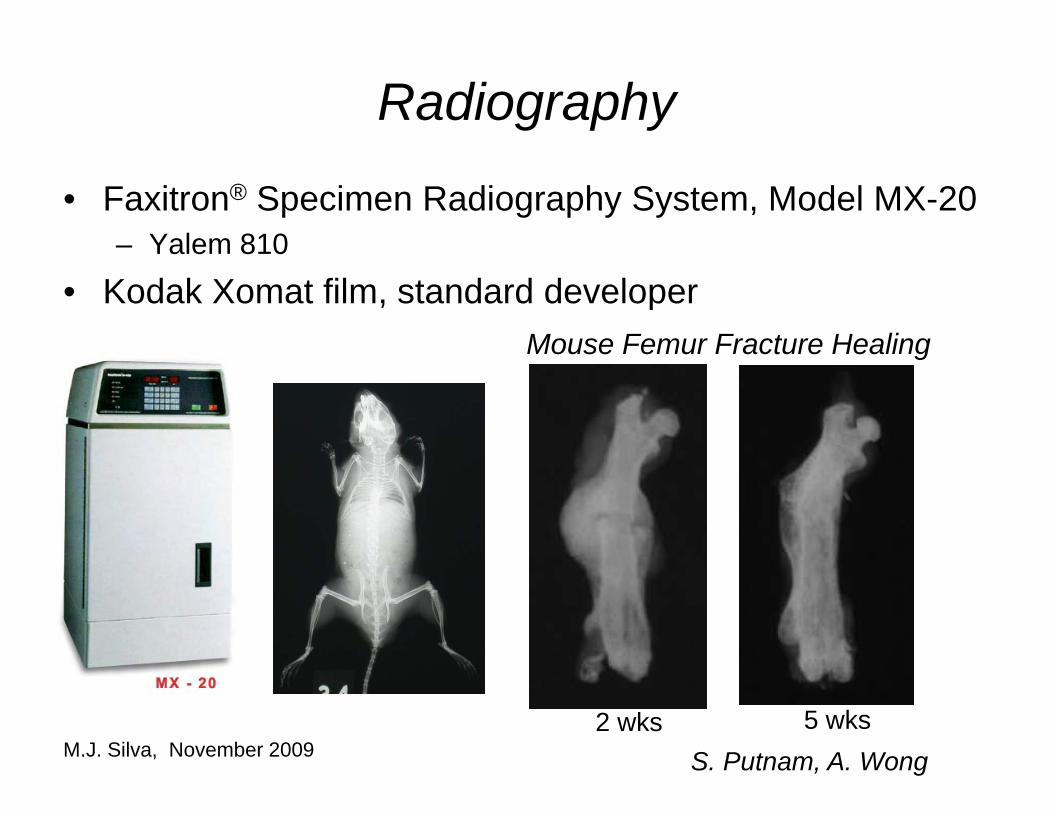
RadiographyRadiography
• Faxitron® Specimen Radiography System, Model MX-20Faxitron Specimen Radiography System, Model MX 20 – Yalem 810
• Kodak Xomat film, standard developer, pMouse Femur Fracture Healing
2 wks 5 wksS. Putnam, A. WongM.J. Silva, November 2009
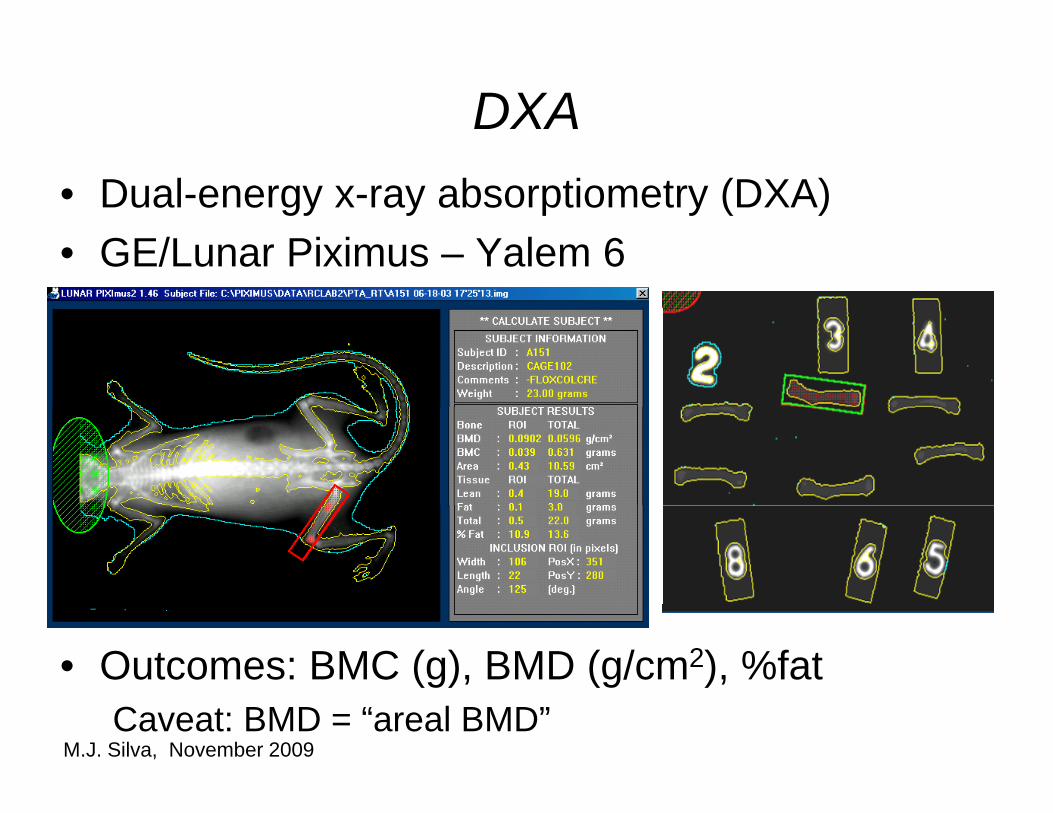
DXADXA• Dual-energy x-ray absorptiometry (DXA)gy y p y ( )• GE/Lunar Piximus – Yalem 6
• Outcomes: BMC (g), BMD (g/cm2), %fatCaveat: BMD = “areal BMD”
M.J. Silva, November 2009
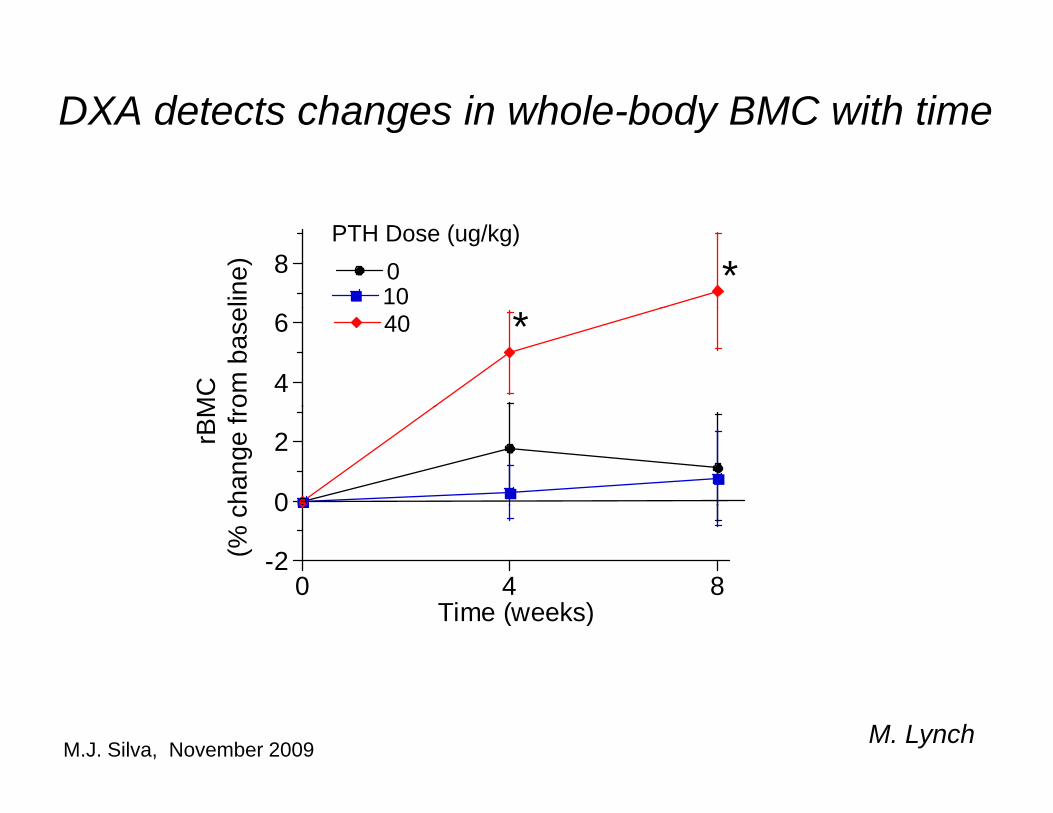
DXA detects changes in whole body BMC with timeDXA detects changes in whole-body BMC with time
8 010
PTH Dose (ug/kg)
*line)
4
6 40 *
MC om
bas
e
0
2rBM
chan
ge fr
o
-2
0
0 4 8Ti ( k )
(% c
Time (weeks)
M. LynchM.J. Silva, November 2009
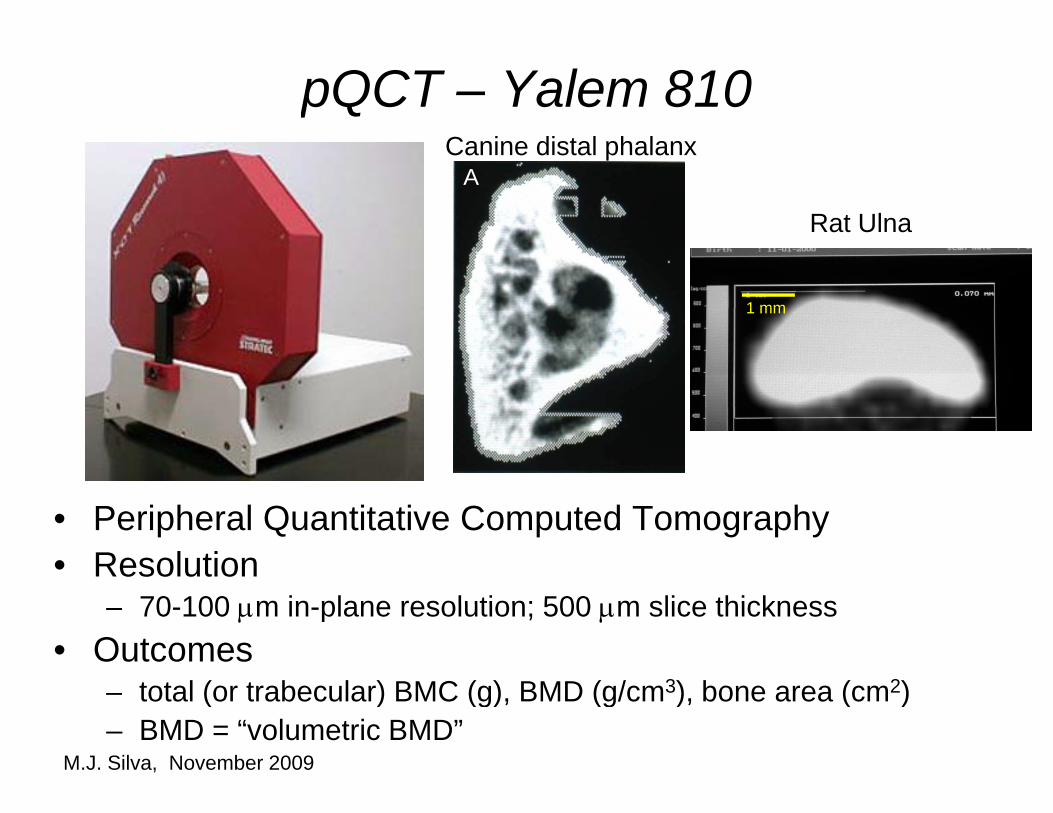
pQCT – Yalem 810pQA
Canine distal phalanx
Rat Ulna
1 mm1 mm
P i h l Q i i C d T h• Peripheral Quantitative Computed Tomography• Resolution
70 100 μm in plane resolution; 500 μm slice thickness– 70-100 μm in-plane resolution; 500 μm slice thickness • Outcomes
– total (or trabecular) BMC (g), BMD (g/cm3), bone area (cm2)( ) (g), (g ), ( )– BMD = “volumetric BMD”
M.J. Silva, November 2009
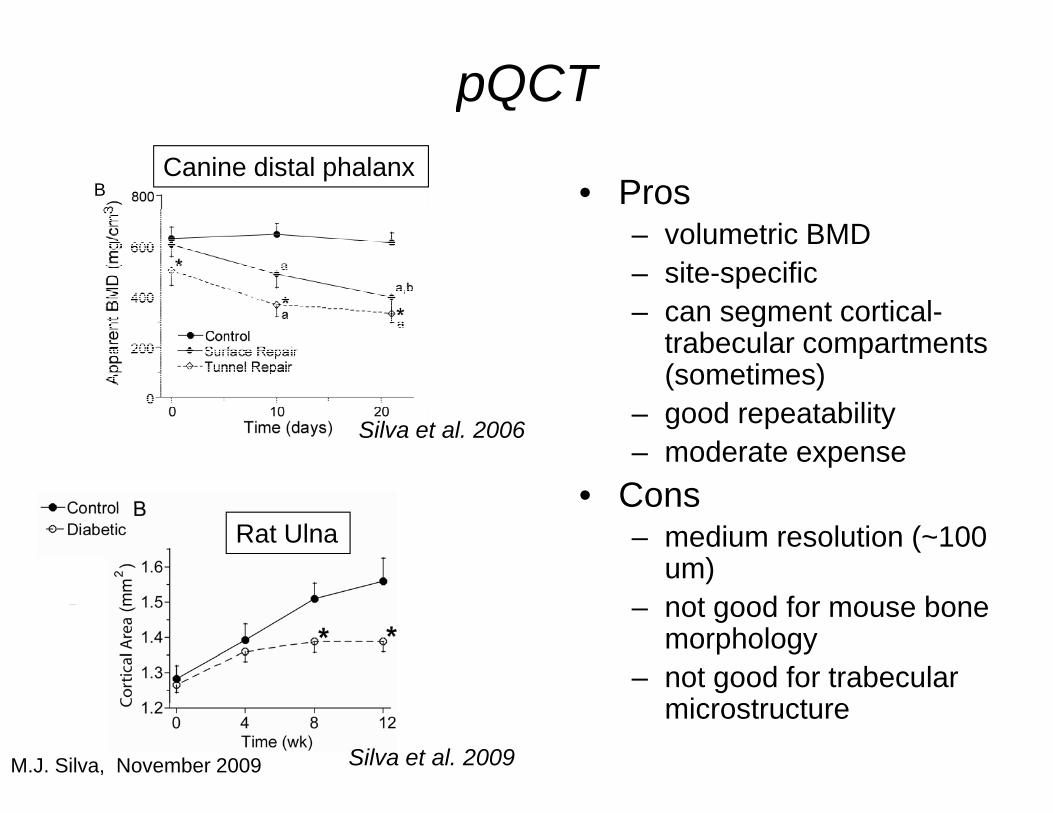
pQCTpCanine distal phalanx
B • Pros – volumetric BMD– site-specific
can segment cortical– can segment cortical-trabecular compartments (sometimes)
d t bilitSilva et al. 2006 – good repeatability– moderate expense
• ConsRat Ulna
Cons– medium resolution (~100
um) not good for mouse bone– not good for mouse bone morphology
– not good for trabecular i t t
Silva et al. 2009
microstructure
M.J. Silva, November 2009
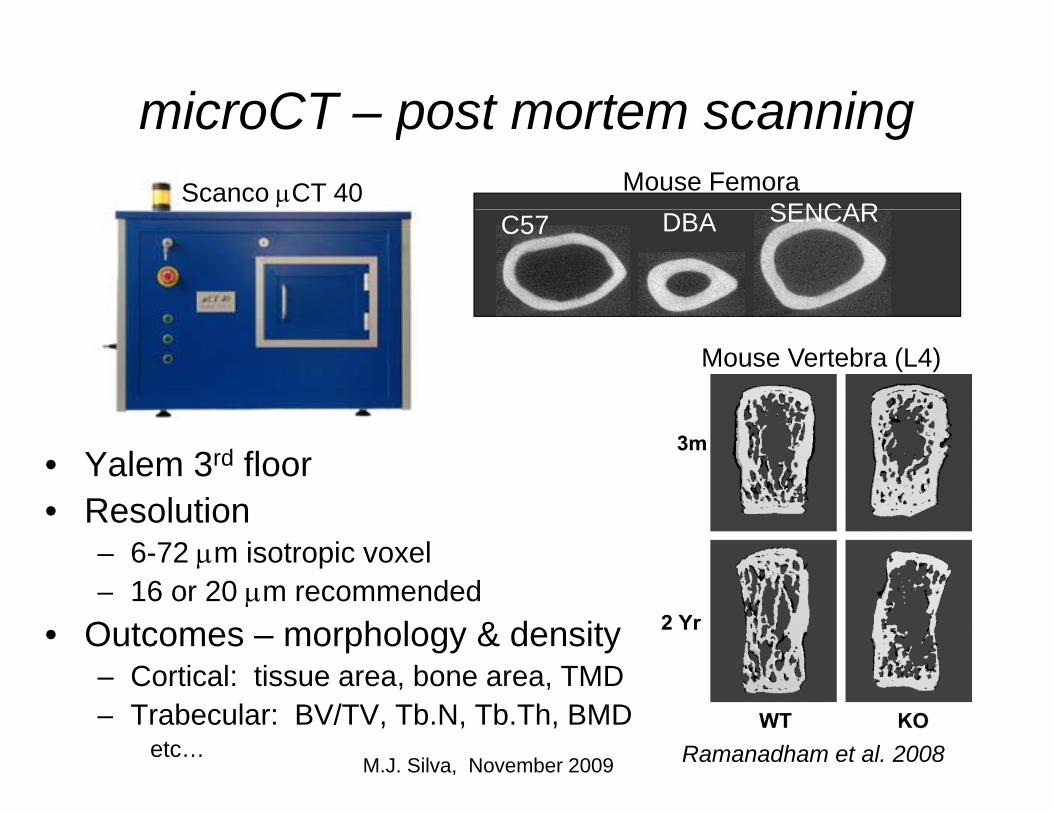
microCT post mortem scanningmicroCT – post mortem scanningMouse Femora
SENCARScanco μCT 40
C57 DBA SENCAR
Mouse Vertebra (L4)
• Yalem 3rd floorResolution• Resolution– 6-72 μm isotropic voxel– 16 or 20 μm recommendedμ
• Outcomes – morphology & density– Cortical: tissue area, bone area, TMD– Trabecular: BV/TV, Tb.N, Tb.Th, BMD
etc… Ramanadham et al. 2008M.J. Silva, November 2009
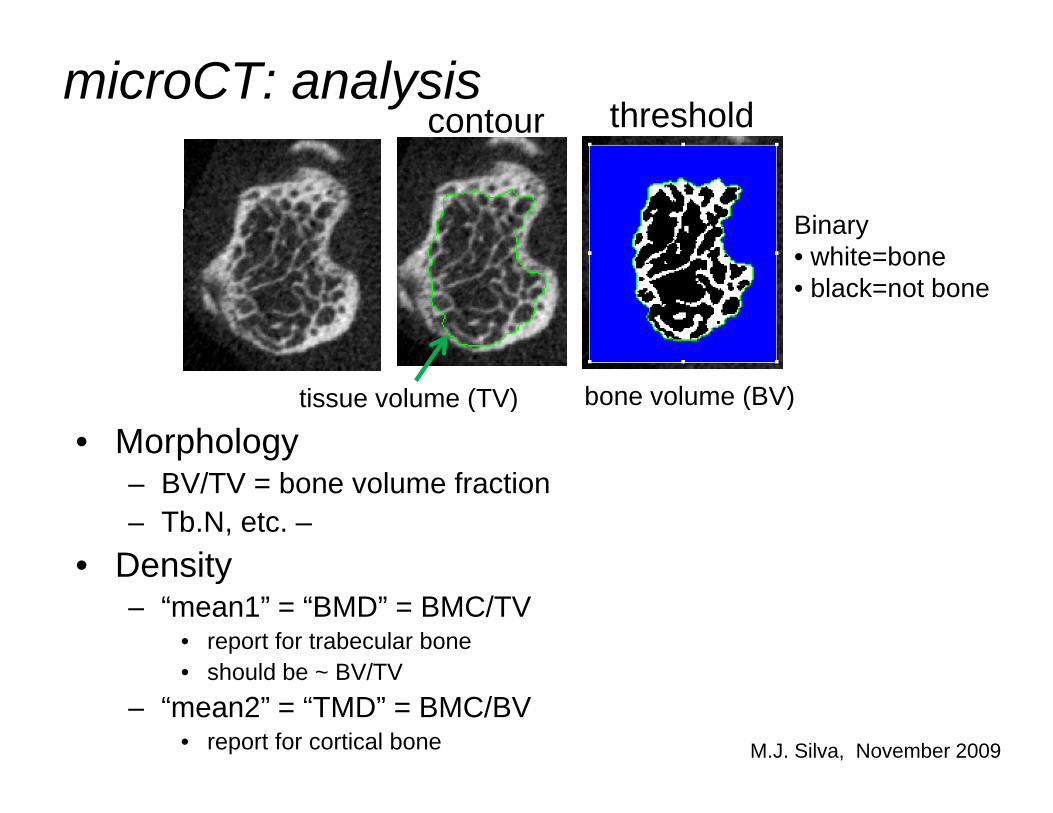
microCT: analysist thresholdcontour threshold
Binary• white=bone• black=not bone
tissue volume (TV) bone volume (BV)
• Morphology– BV/TV = bone volume fraction
tissue volume (TV) ( )
– Tb.N, etc. –• Density
“mean1” = “BMD” = BMC/TV– mean1 = BMD = BMC/TV• report for trabecular bone• should be ~ BV/TV
“mean2” = “TMD” = BMC/BV– mean2 = TMD = BMC/BV• report for cortical bone M.J. Silva, November 2009
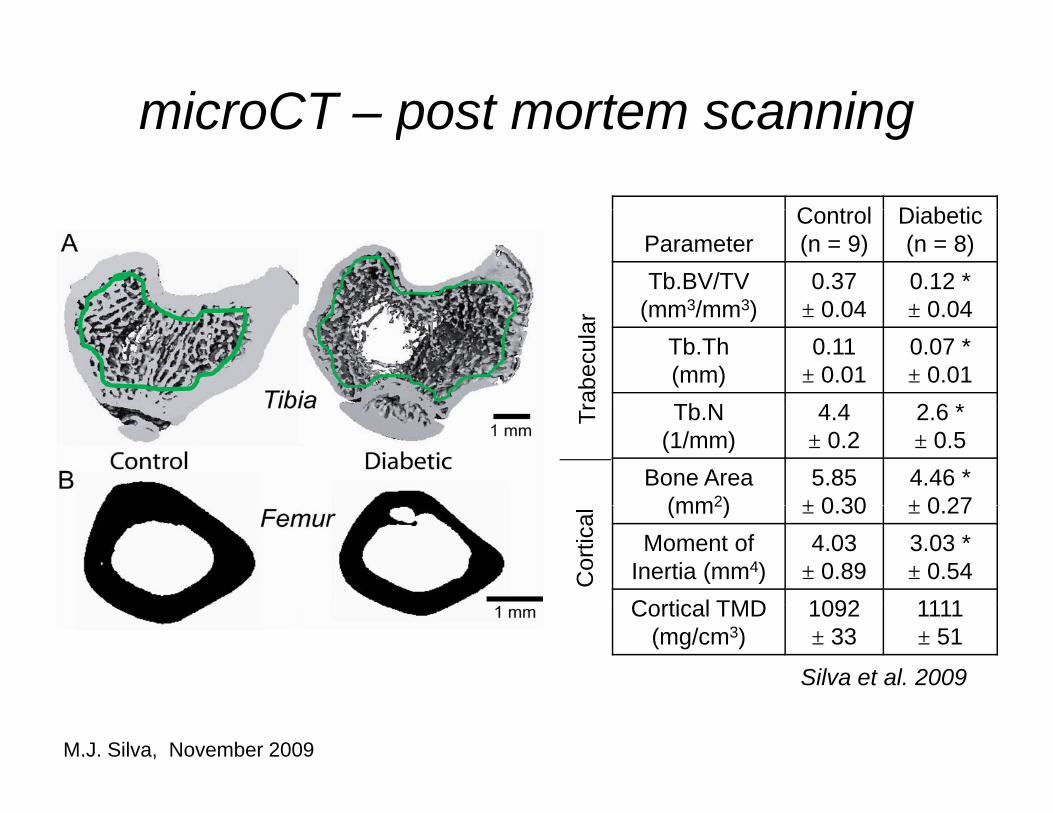
microCT post mortem scanningmicroCT – post mortem scanning
C t l Di b tiParameter
Control(n = 9)
Diabetic(n = 8)
Tb.BV/TV (mm3/mm3)
0.37± 0 04
0.12 *± 0 04(mm3/mm3) ± 0.04 ± 0.04
Tb.Th(mm)
0.11± 0.01
0.07 *± 0.01
Tb N 4 4 2 6 *rabe
cula
r
Tb.N(1/mm)
4.4± 0.2
2.6 *± 0.5
Bone Area (mm2)
5.85± 0 30
4.46 *± 0 27
Tr
(mm2) ± 0.30 ± 0.27Moment of
Inertia (mm4)4.03
± 0.893.03 *± 0.54
Cortical TMD 1092 1111C
ortic
alCortical TMD
(mg/cm3)1092± 33
1111± 51
Silva et al. 2009
M.J. Silva, November 2009
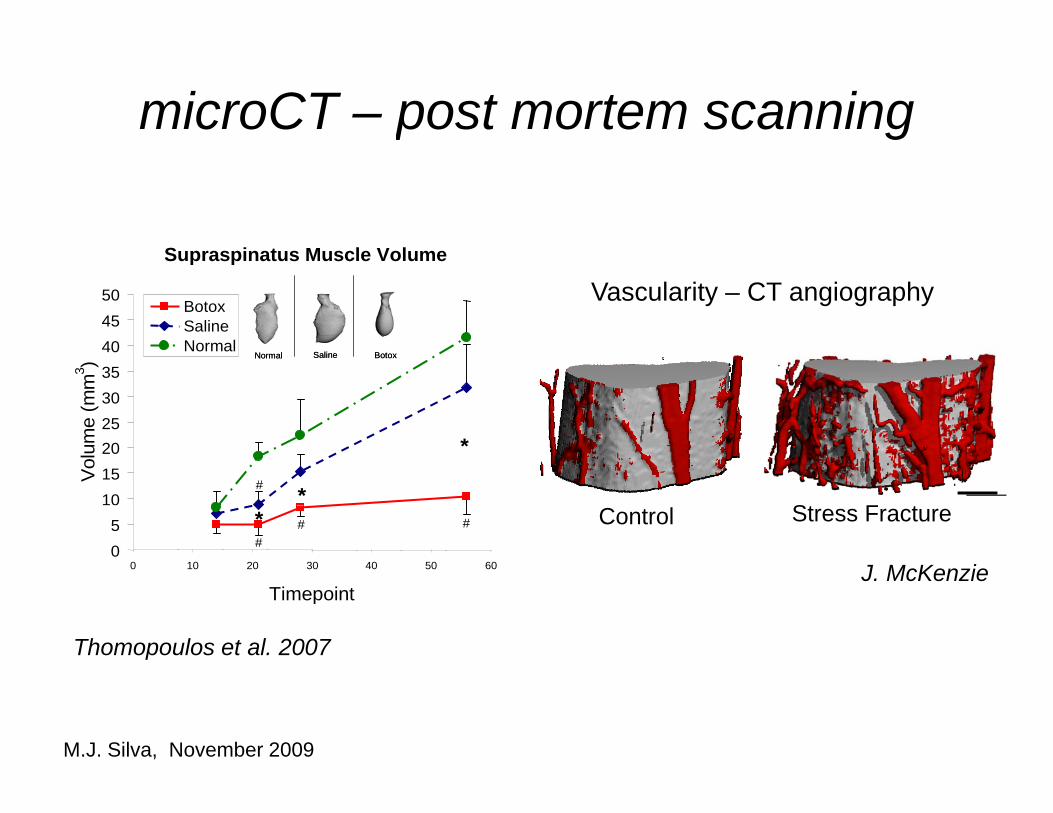
microCT post mortem scanningmicroCT – post mortem scanning
Supraspinatus Muscle Volume
50Botox
Vascularity – CT angiography
30354045
(mm
3 )
BotoxSalineNormal
BotoxSalineNormal BotoxSalineNormal
*
*10152025
Vol
ume
(
#
St F t*05
0 10 20 30 40 50 60
Timepoint
## #
J. McKenzie
Control Stress Fracture
Thomopoulos et al. 2007
M.J. Silva, November 2009
microCTmicroCT• ProsPros
– high resolution (~6-70 um voxels)– 3D morphology– quantitative (mineral HA phantom)
• Cons– expensive/laborious– results depend on image settings (e.g., energy level) and
analysis settings (e g threshold filtering)analysis settings (e.g., threshold, filtering)• beware “black box” and “mfg. settings”
M.J. Silva, November 2009
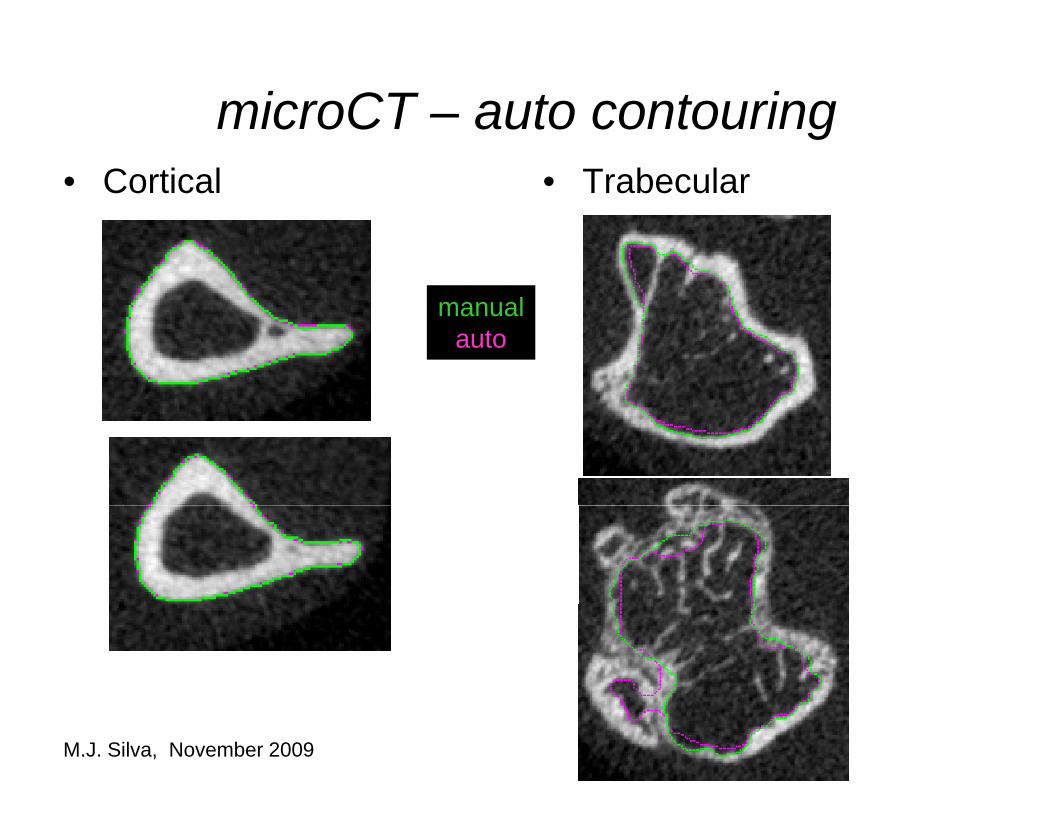
microCT auto contouringmicroCT – auto contouring• Cortical • Trabecular
manualmanualauto
M.J. Silva, November 2009
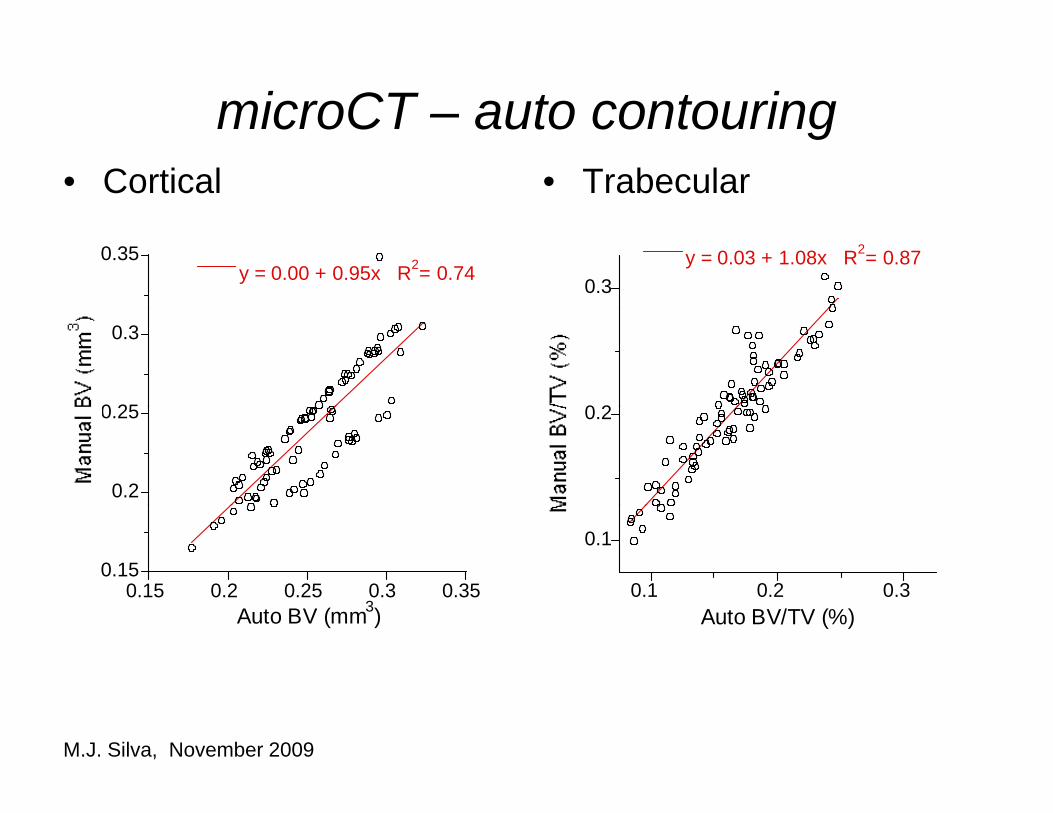
microCT auto contouringmicroCT – auto contouring• Cortical • Trabecular
0.35y = 0.00 + 0.95x R2= 0.74 0.3
y = 0.03 + 1.08x R2= 0.87
0 25
0.3
0 2
0.2
0.25 0.2
0.150.15 0.2 0.25 0.3 0.35
3
0.1
0.1 0.2 0.3Auto BV (mm3) Auto BV/TV (%)
M.J. Silva, November 2009
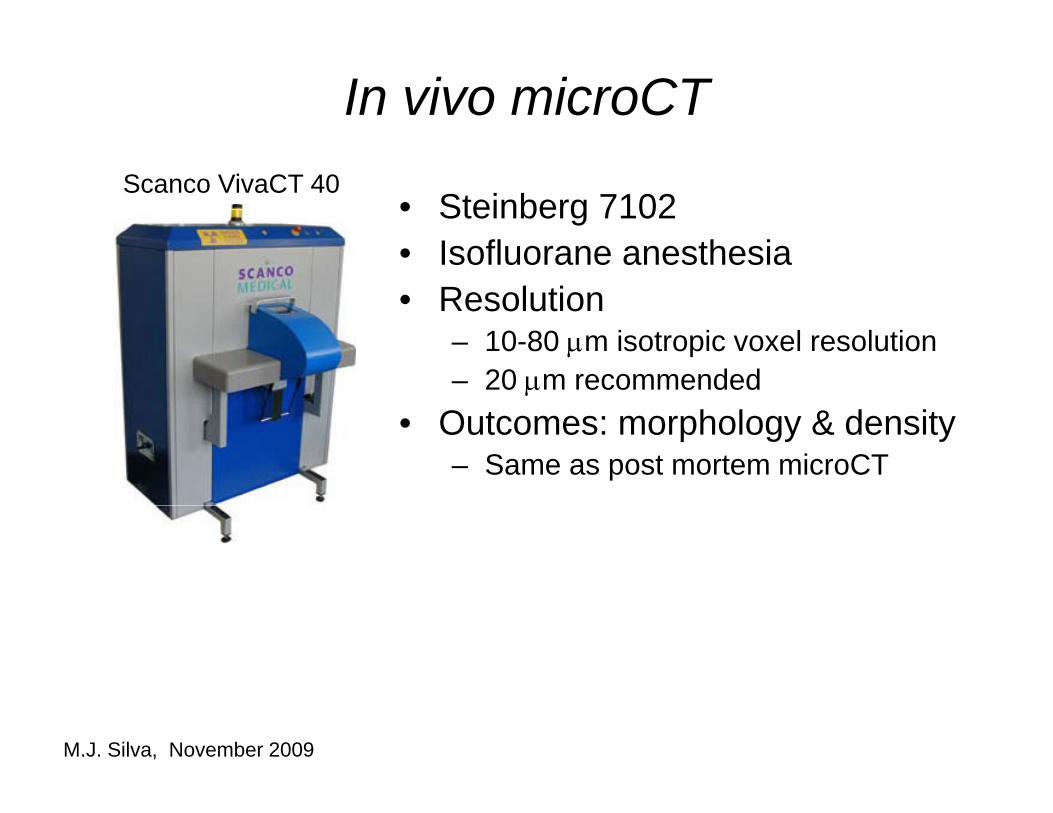
In vivo microCTIn vivo microCT
• Steinberg 7102Scanco VivaCT 40
• Steinberg 7102• Isofluorane anesthesia• ResolutionResolution
– 10-80 μm isotropic voxel resolution– 20 μm recommended
• Outcomes: morphology & density– Same as post mortem microCT
M.J. Silva, November 2009
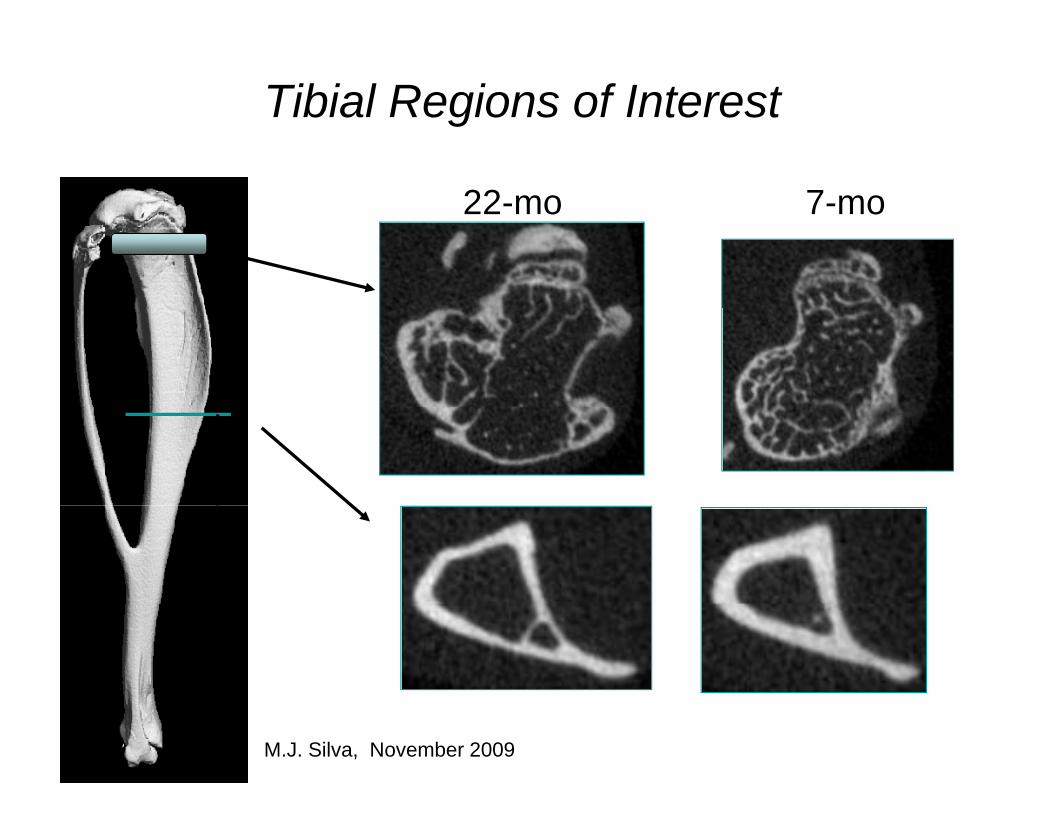
Tibial Regions of InterestTibial Regions of Interest
7-mo22-mo 7 mo22 mo
M.J. Silva, November 2009
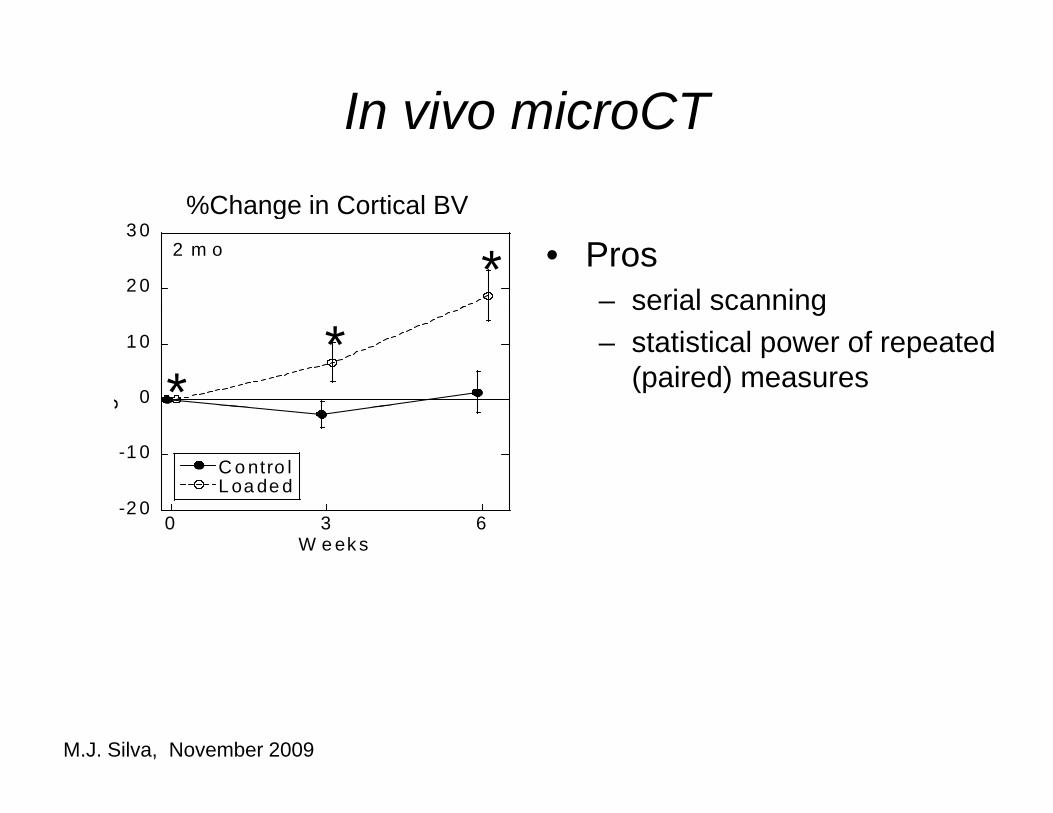
In vivo microCTIn vivo microCT%Change in Cortical BV
• Pros– serial scanning2 0
3 02 m o *%Change in Cortical BV
serial scanning– statistical power of repeated
(paired) measures0
1 0
**
g
2 0
-1 0C o ntro lL oa de d
g
-2 00 3 6
W e ek s
M.J. Silva, November 2009
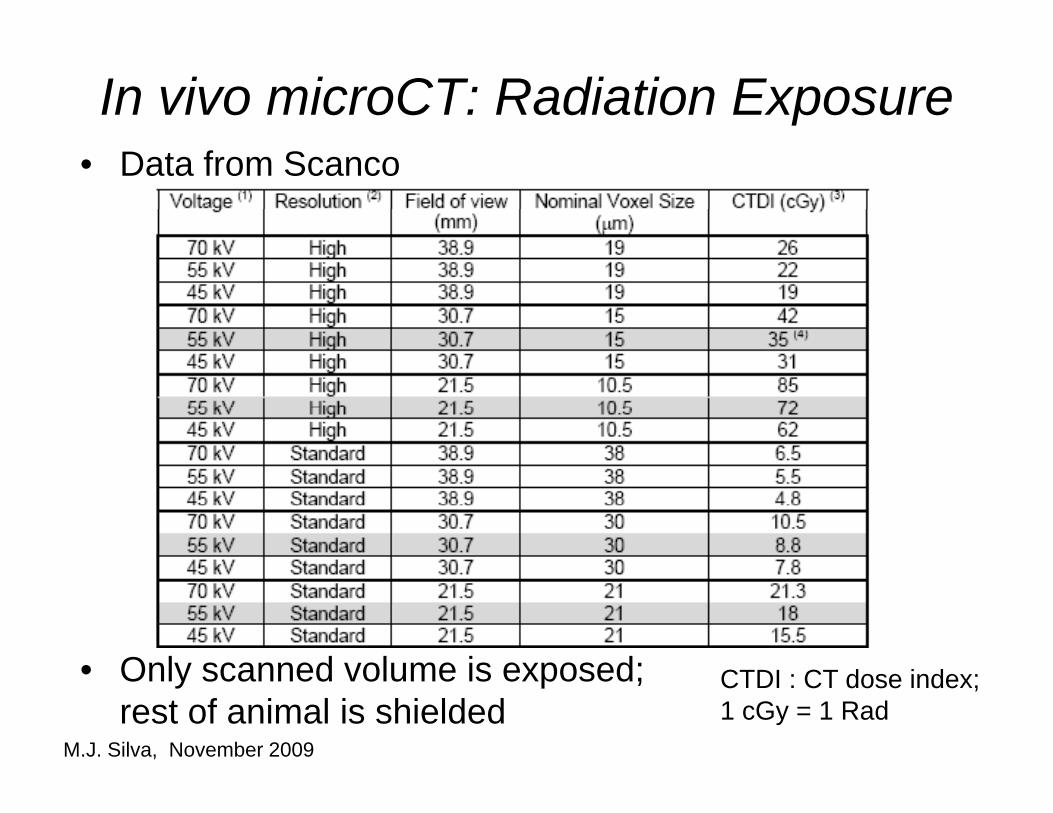
In vivo microCT: Radiation ExposureIn vivo microCT: Radiation Exposure • Data from Scanco
• Only scanned volume is exposed; t f i l i hi ld d
CTDI : CT dose index; 1 G 1 R drest of animal is shielded 1 cGy = 1 Rad
M.J. Silva, November 2009
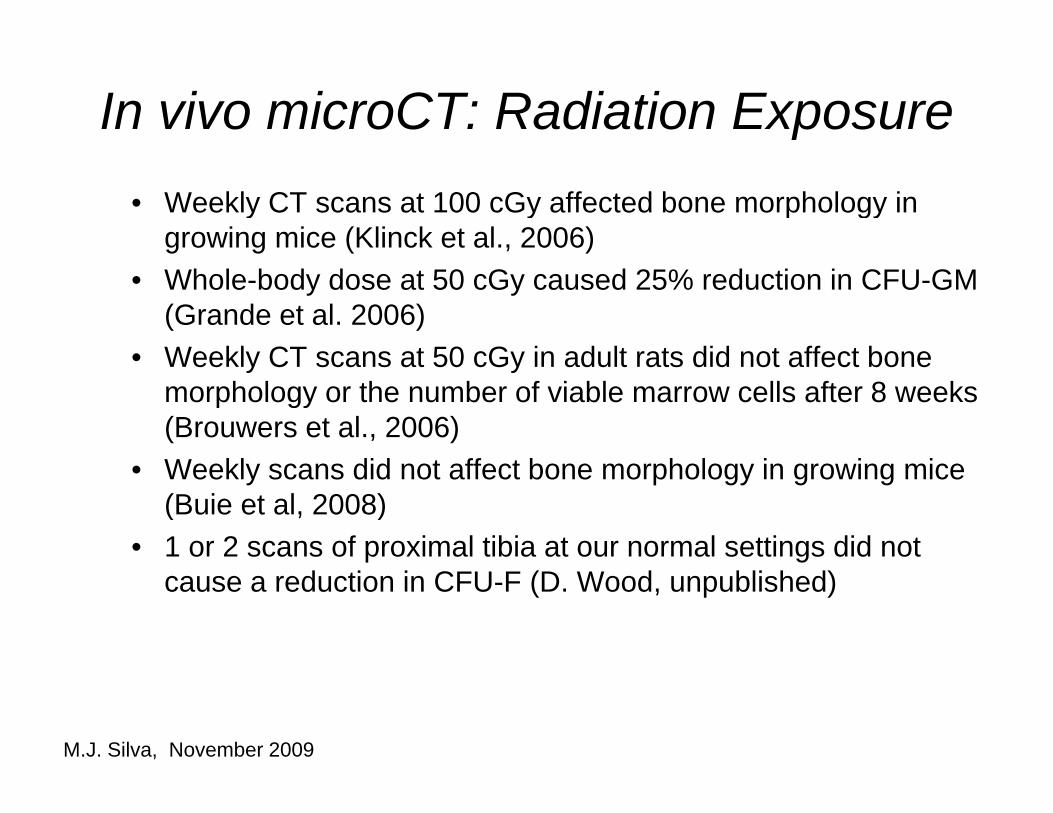
In vivo microCT: Radiation ExposureIn vivo microCT: Radiation Exposure • Weekly CT scans at 100 cGy affected bone morphology inWeekly CT scans at 100 cGy affected bone morphology in
growing mice (Klinck et al., 2006)• Whole-body dose at 50 cGy caused 25% reduction in CFU-GM
(G d t l 2006)(Grande et al. 2006)• Weekly CT scans at 50 cGy in adult rats did not affect bone
morphology or the number of viable marrow cells after 8 weeks p gy(Brouwers et al., 2006)
• Weekly scans did not affect bone morphology in growing mice (Buie et al 2008)(Buie et al, 2008)
• 1 or 2 scans of proximal tibia at our normal settings did not cause a reduction in CFU-F (D. Wood, unpublished)
M.J. Silva, November 2009
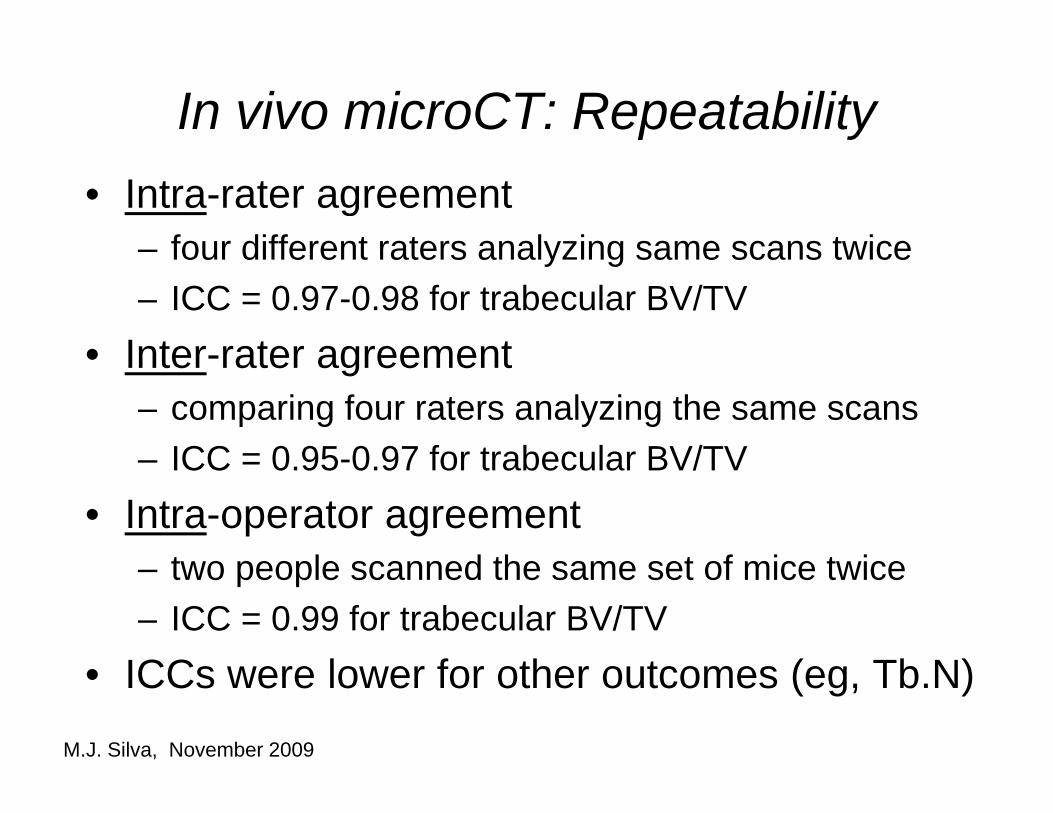
In vivo microCT: RepeatabilityIn vivo microCT: Repeatability• Intra-rater agreementg
– four different raters analyzing same scans twice– ICC = 0.97-0.98 for trabecular BV/TVICC 0.97 0.98 for trabecular BV/TV
• Inter-rater agreementcomparing four raters analyzing the same scans– comparing four raters analyzing the same scans
– ICC = 0.95-0.97 for trabecular BV/TVI t t t• Intra-operator agreement– two people scanned the same set of mice twice– ICC = 0.99 for trabecular BV/TV
• ICCs were lower for other outcomes (eg, Tb.N)
M.J. Silva, November 2009
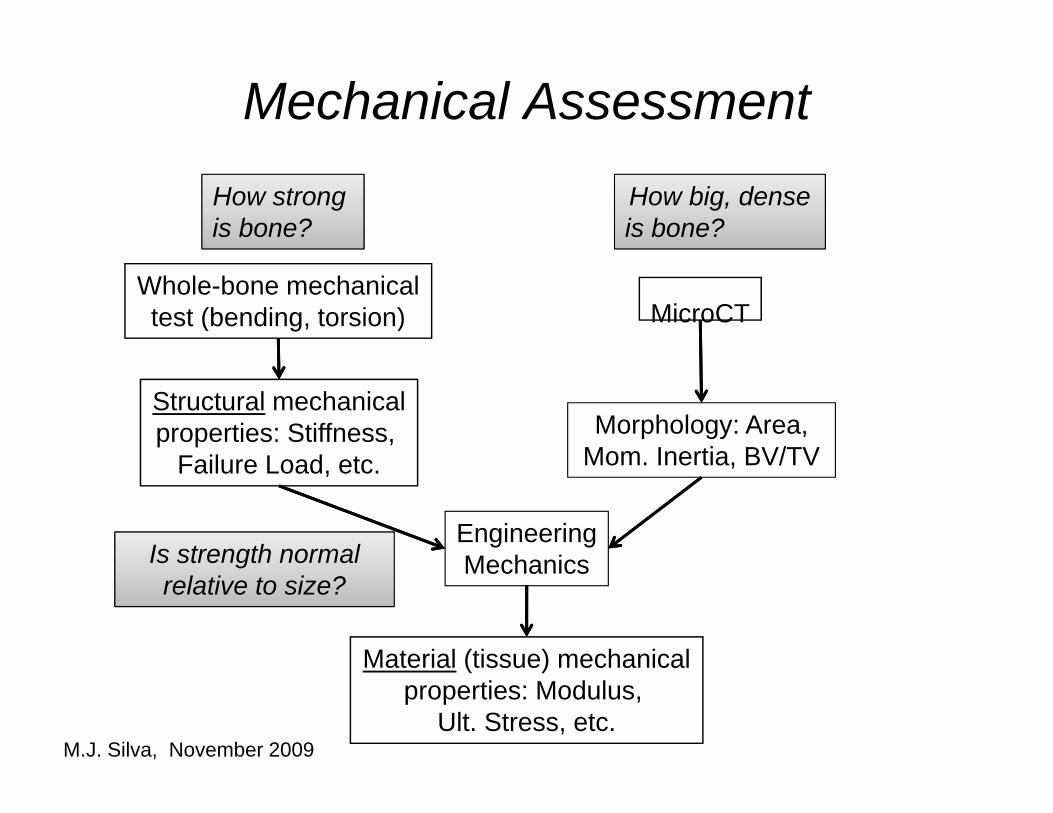
Mechanical AssessmentMechanical AssessmentHow strong How big, dense
Whole-bone mechanicalt t (b di t i ) Mi CT
gis bone?
gis bone?
test (bending, torsion) MicroCT
Structural mechanicalStructural mechanicalproperties: Stiffness,
Failure Load, etc.Morphology: Area,
Mom. Inertia, BV/TV
EngineeringMechanicsIs strength normal
relative to size?
Material (tissue) mechanicalproperties: Modulus, p p ,
Ult. Stress, etc.M.J. Silva, November 2009
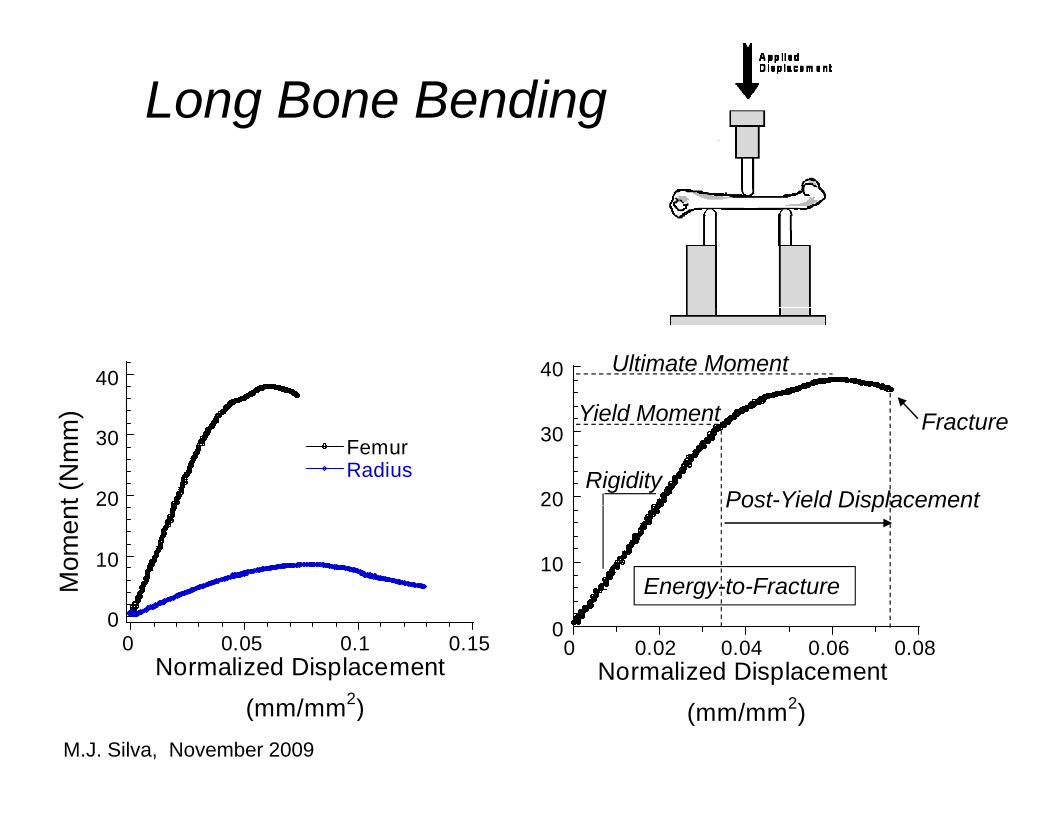
Long Bone BendingLong Bone Bending
4040
Yi ld M t
Ultimate Moment
20
30
20
30 FemurRadius
t (N
mm
) Yield Moment
Post-Yield Displacement
Fracture
Rigidity
10
20
10
20
Mom
en
Energy-to-Fracture
Post Yield Displacement
00 0.02 0.04 0.06 0.08
Normalized Displacement ( / 2)
00 0.05 0.1 0.15
Normalized Displacement( / 2) (mm/mm2) (mm/mm2)
M.J. Silva, November 2009
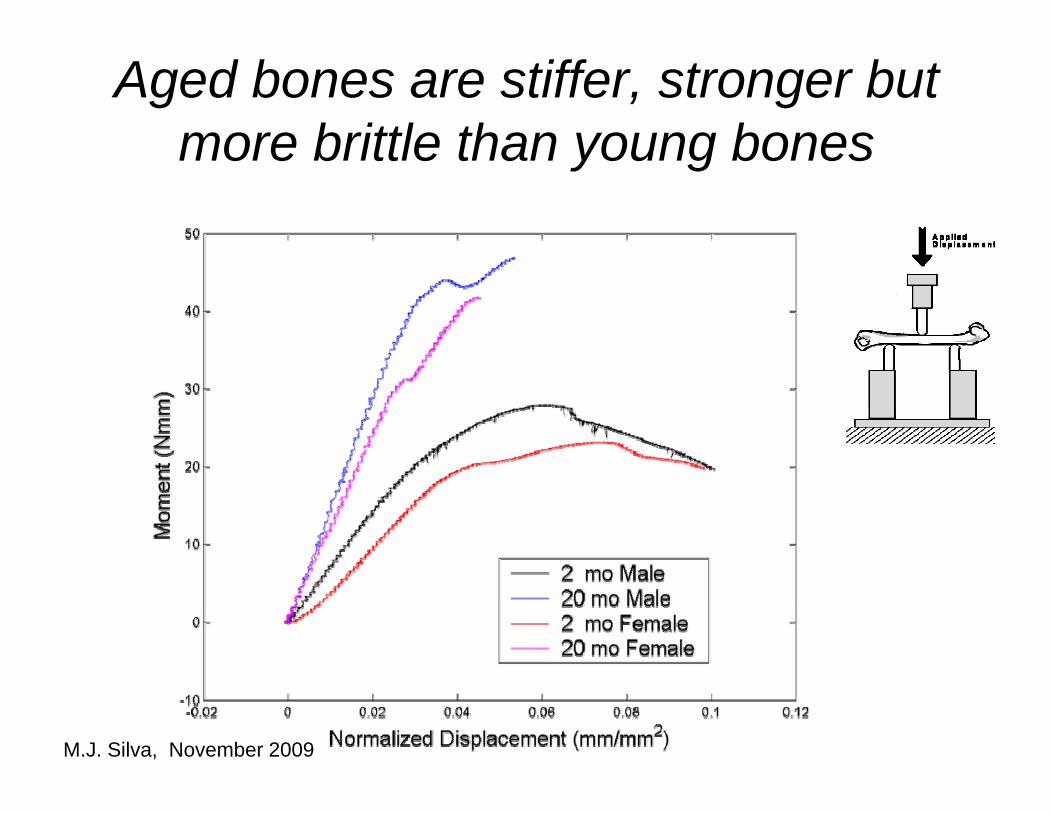
Aged bones are stiffer, stronger but more brittle than young bones
M.J. Silva, November 2009
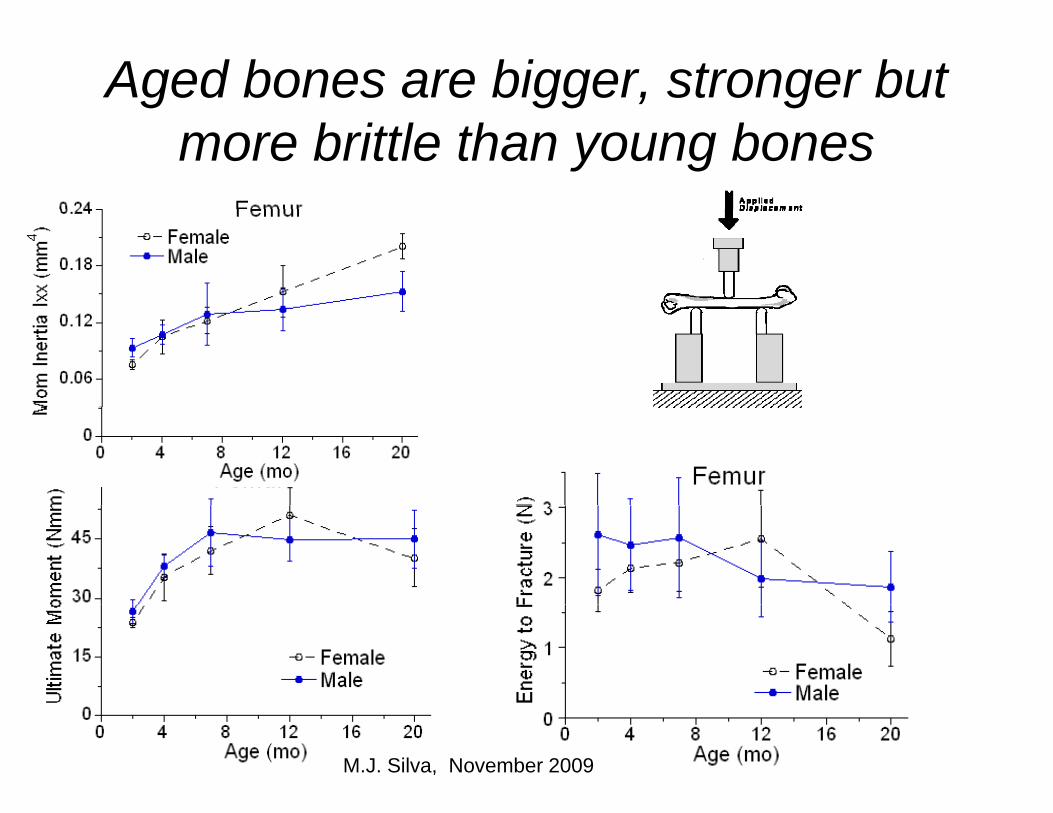
Aged bones are bigger, stronger but more brittle than young bones
M.J. Silva, November 2009
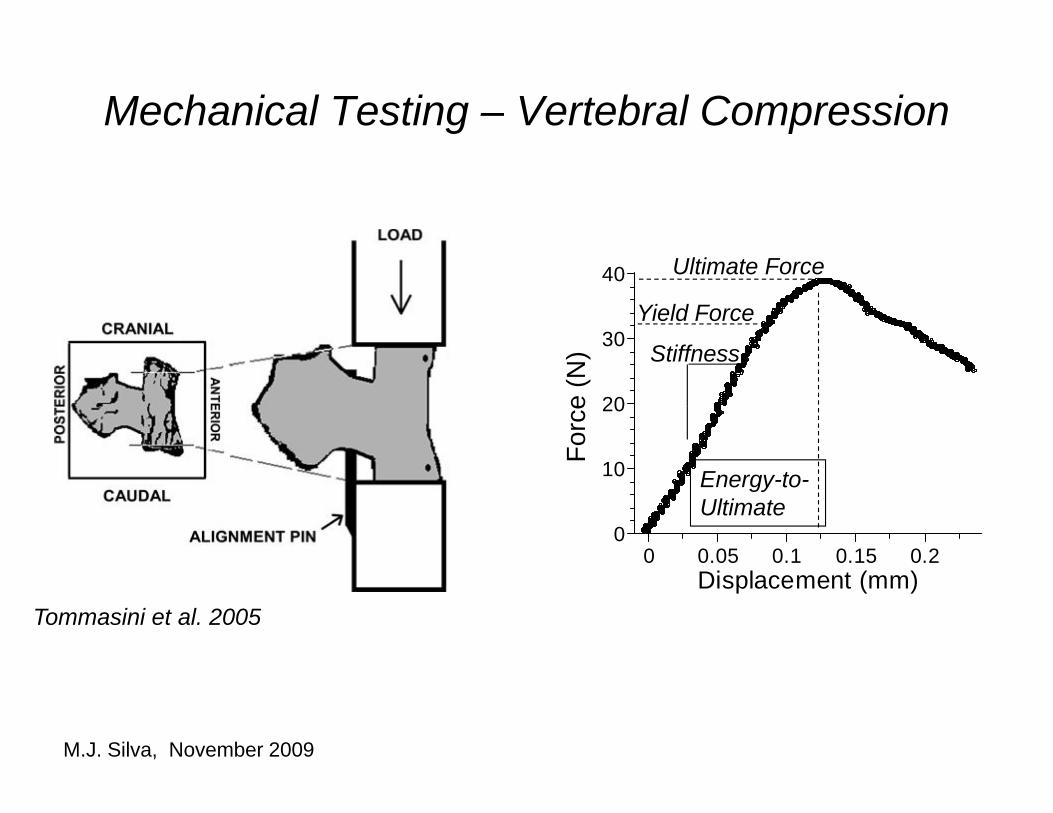
Mechanical Testing Vertebral CompressionMechanical Testing – Vertebral Compression
40
Yi ld F
Ultimate Force
20
30
e (N
)
Yield Force
Stiffness
10
20
Forc
e
Energy-to-Ultimate
00 0.05 0.1 0.15 0.2
Displacement (mm)
Ultimate
Tommasini et al. 2005
M.J. Silva, November 2009
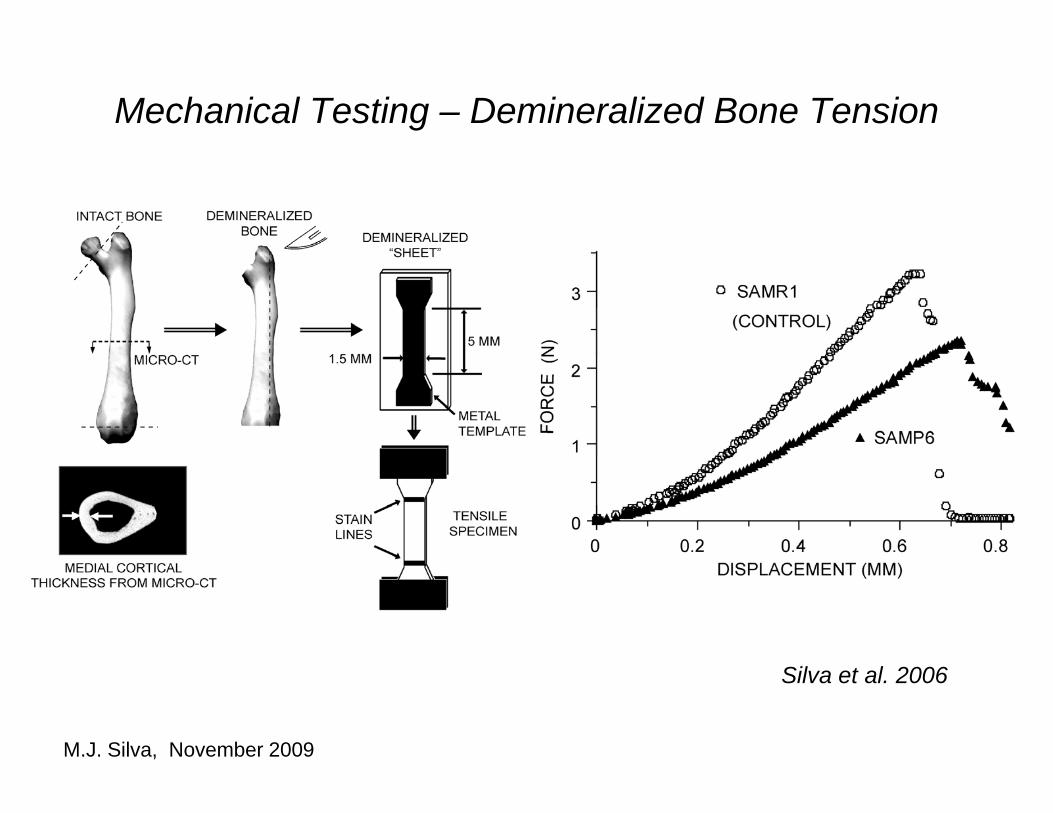
Mechanical Testing Demineralized Bone TensionMechanical Testing – Demineralized Bone Tension
Silva et al. 2006
M.J. Silva, November 2009
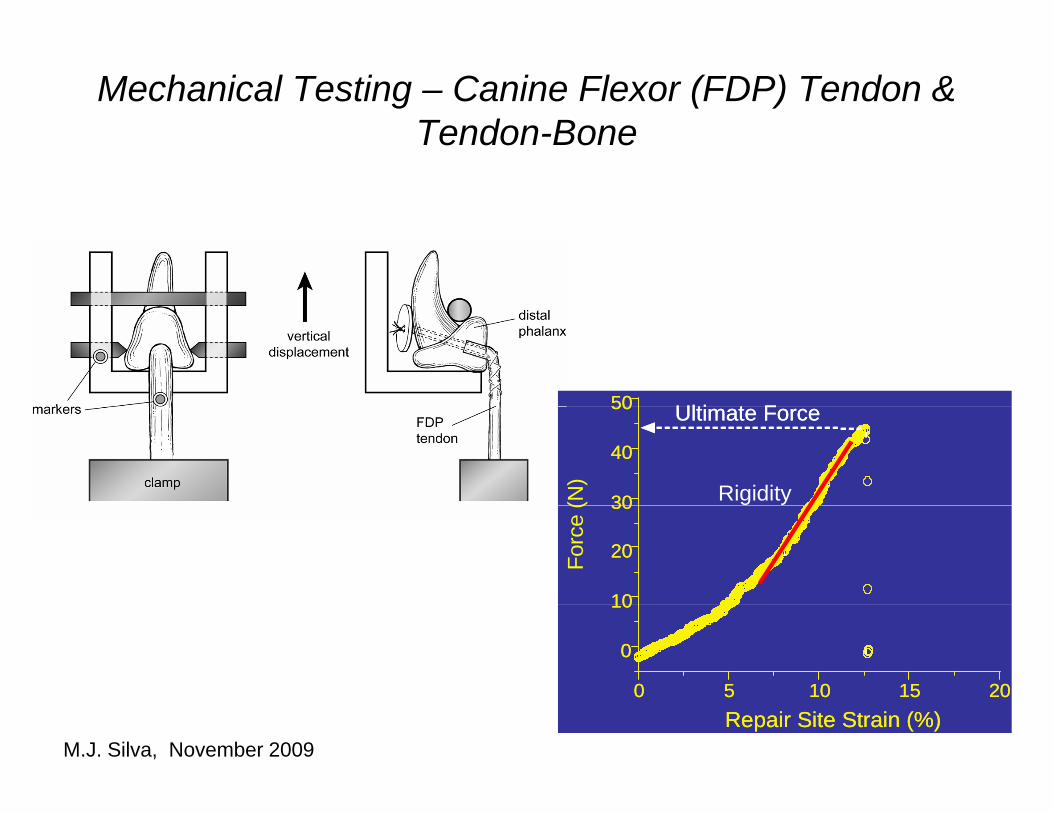
Mechanical Testing – Canine Flexor (FDP) Tendon & Tendon-Bone
50 Ulti t F50 Ulti t F
(N)
30
40
50 Ultimate Force
30
40
50 Ultimate Force
Rigidity
Forc
e (
10
20
30
10
20
30
0
10
0 5 10 15 20
0
10
0 5 10 15 20Repair Site Strain (%)Repair Site Strain (%)
M.J. Silva, November 2009
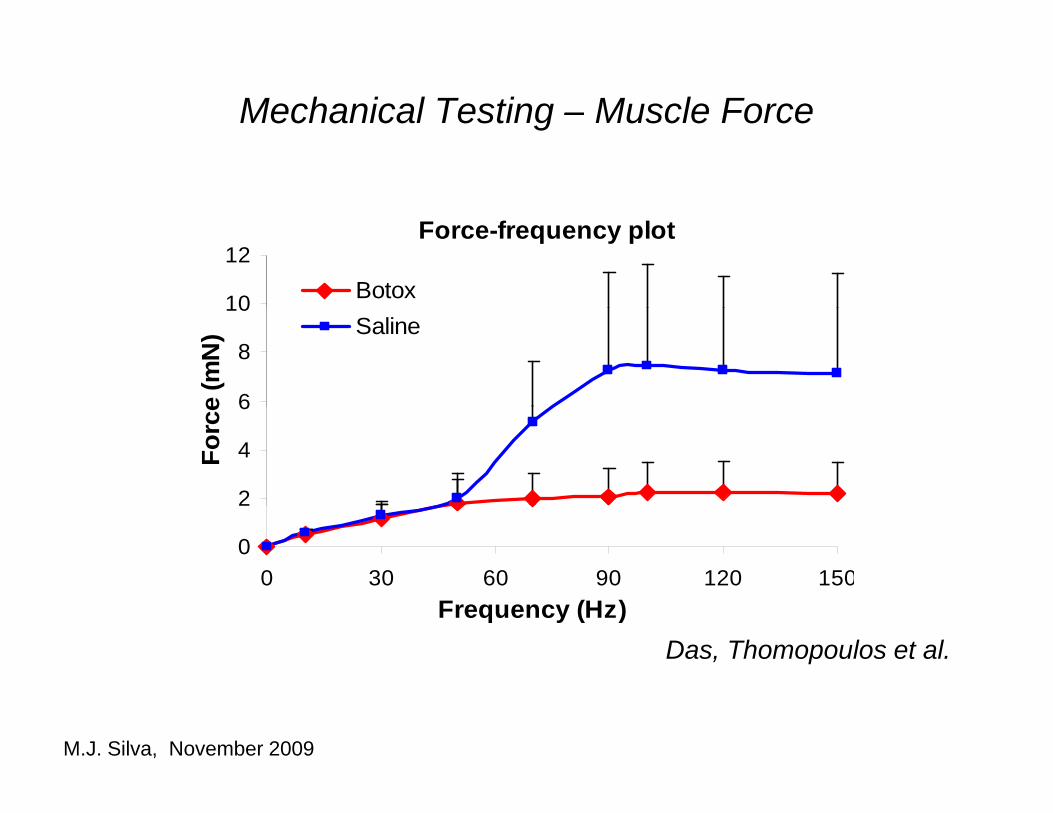
Mechanical Testing Muscle ForceMechanical Testing – Muscle Force
Force-frequency plot
10
12Botox
6
8
10
e (m
N) Saline
2
4
6
Forc
e
0
2
0 30 60 90 120 150F (H )Frequency (Hz)
Das, Thomopoulos et al.
M.J. Silva, November 2009

Musculoskeletal Structure and Strength Core
RadiographyFaxitron
Musculoskeletal Structure and Strength Core
Imaging(post mortem
& in vivo)Densitometry
DXA
pQCT
3D MorphologymicroCT
“Standard” “Specialized”
Bone
Long-BoneBending
Vertebral
Standard SpecializedDemineralizedBone Tension
Trabecular
MechanicalTesting
Instron MaterialsTesting Systems
Tendon
Compression
Insertion SiteTension
Indentation
MidsubstanceTension
Grass Stimulator & Force Transducer Muscle Skeletal Muscle
Tension
M.J. Silva, November 2009
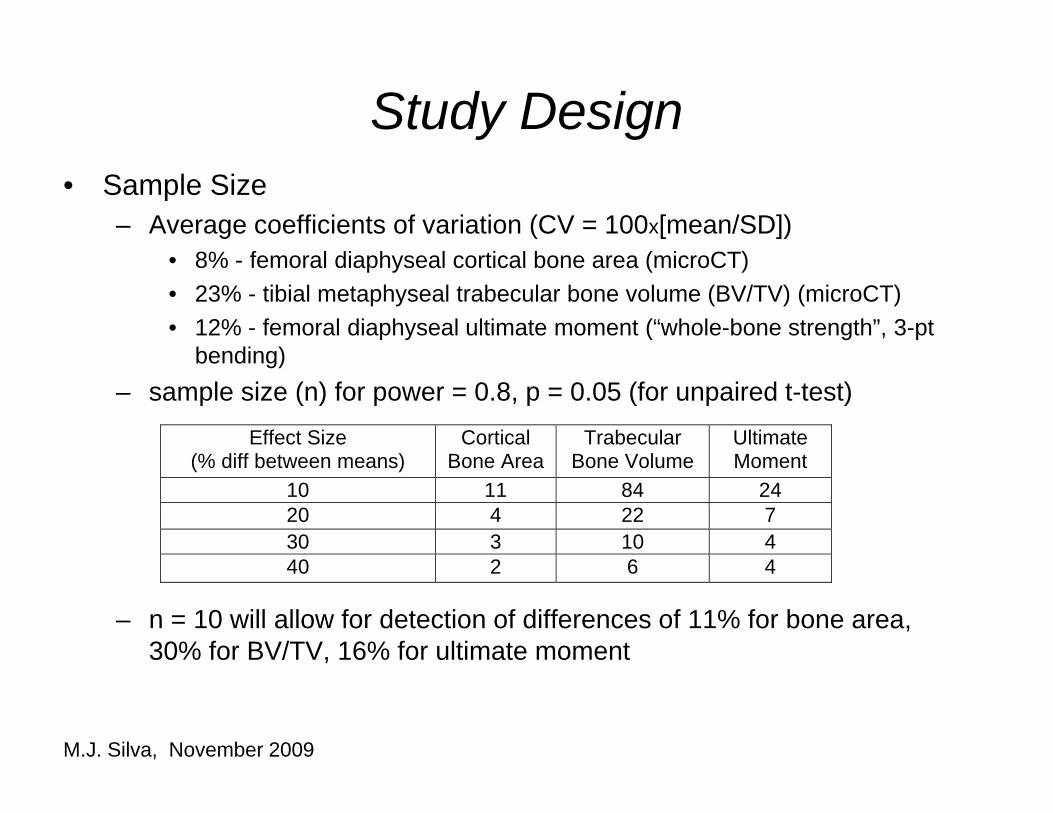
Study DesignStudy Design• Sample Size
– Average coefficients of variation (CV = 100x[mean/SD])• 8% - femoral diaphyseal cortical bone area (microCT)• 23% - tibial metaphyseal trabecular bone volume (BV/TV) (microCT)• 12% - femoral diaphyseal ultimate moment (“whole-bone strength”, 3-pt
bending)– sample size (n) for power = 0.8, p = 0.05 (for unpaired t-test)
Effect Size (% diff between means)
Cortical Bone Area
Trabecular Bone Volume
Ultimate Moment
10 11 84 24 20 4 22 730 3 10 4 40 2 6 4
– n = 10 will allow for detection of differences of 11% for bone area, 30% for BV/TV, 16% for ultimate moment
M.J. Silva, November 2009
AcknowledgementsAcknowledgements• Michael BrodtMichael Brodt• Akhilesh Kotiya
M k Willi h
• NIH/NIAMS P30AR057235
• Mark Willingham• Abby Stephens• Michelle Lynch• Dan WoodDan Wood• Jenny McKenzie
T it P t l• Tarpit Patel• Steve Thomopoulos• Dwight Towler M.J. Silva, November 2009