Embed Size (px)
Citation preview
ADVANCES in NATURAL and APPLIED SCIENCES
ISSN: 1995-0772 Published BYAENSI Publication EISSN: 1998-1090 http://www.aensiweb.com/ANAS
2017 May 11(7): pages 399-408 Open Access Journal
ToCite ThisArticle: J. Divya Jenifer and Dr. J. Benadict Raja., Skeleton Based Leaf Identification and Detection of Grape Plant Leaf Disease by Using K-Means Clustering Algorithm. Advances in Natural and Applied Sciences. 11(7); Pages: 399-408
Skeleton Based Leaf Identification and Detection of Grape Plant Leaf Disease by Using K-Means Clustering Algorithm
1J. Divya Jenifer and 2Dr. J. Benadict Raja 1PG Student, Department of Computer Science and Engineering, PSNA College of Engineering and Technology, Dindigul. 2Assistant Professor, Department of Computer Science and Engineering, PSNA College of Engineering andTechnology, Dindigul. Received 28 January 2017; Accepted 22 May 2017; Available online 28 May 2017
Address For Correspondence: J. Divya Jenifer, PG Student, Department of Computer Science and Engineering, PSNA College of Engineering and Technology, Dindigul. E-mail: [email protected]
Copyright © 2017 by authors and American-Eurasian Network for ScientificInformation (AENSI Publication). This work is licensed under the Creative Commons Attribution International License (CC BY). http://creativecommons.org/licenses/by/4.0/
ABSTRACT Agriculture is the primary backbone of Indian economy where in about 70% of the population depends on agriculture. Grape is an important commercial fruit crop of south India and grape growing has been regarded as most remunerative enterprise. For better canopy, yield and quality of the crop, the farmers are mainly depends on the experts. Many times expert advice may not be affordable and majority times the availability of expert and their services may consume time. Image processing along with availability of communication network can change the situation of getting the expert advice well within time. But, identifying leaves in horticultural crop images is very difficult because of complex conditions such as messy distributions, fuzzy edges, overlapping leaves. Also the accuracy of leaf segmentation and disease classification is degraded by the influence of reflection light and distortion regions in an acquired image. In this work, a K-means clustering based automated method is proposed for grape leaf identification and disease classification. This proposed work identify infected grape leaves from the grape plant and it finds the intensity levels of powdery Mildew and Downy Mildew diseases from the infected grape leaves. This work is carried out in two phases, in the first phase the grape leaves are identified from the horticultural crop image, which is useful for analyze each leaf and determine the crop status. In the second phase, the diseases on the leaves are classified. The k-means clustering algorithm and the skeleton of leaf are used for leaf identification. Then the KNN classifier classifies the leaf diseases.
KEYWORDS: Digital Image Processing, Plant Leaf Disease Detection, K-means Clustering, KNN.
INTRODUCTION
Image processing is defined as the process of enhancing the raw images which are received from the
cameras or sensors [8]. Different techniques are developed for various processes during digital image
processing. In agriculture, various techniques are developed for different applications such as prediction of plant
diseases, plant types, soil moisture level and monitoring the crop growth level, water content level and etc. The
plant diseases are occurred due to the impairment of normal physiological functions of plants which produces
the characteristic symptoms. These diseases are mainly caused by the pathogens which are located on the leaves
or stems of the plant [9]. These symptoms are identified by using Image Processing Techniques. The plant
disease detection is achieved by following steps:
The primary process of the plant disease detection is acquisition of the images. Images of leaves or stem are
collected from the particular database or captured by using the cameras. Then, the obtained images are utilized
for further process. The most important process is the image pre-processing which is used for removing
unnecessary information and noises from the input image in order to improve the quality of the image. Then, the
400 J. Divya Jenifer and Dr. J. Benadict Raja., 2017/Advances in Natural and Applied Sciences. 11(7) May 2017, Pages: 399-408
homogeneous pixels are detected by extracting the features from image. The identification of equivalent pixels
from the image is used for predicting the diseases quickly.
In this work, A K-means Clustering Algorithm based method is proposed to detect the Powdery Mildew
and Downy Mildew in grape plants. The result of this section explain various disease of grape plants.
Powdery Mildew:
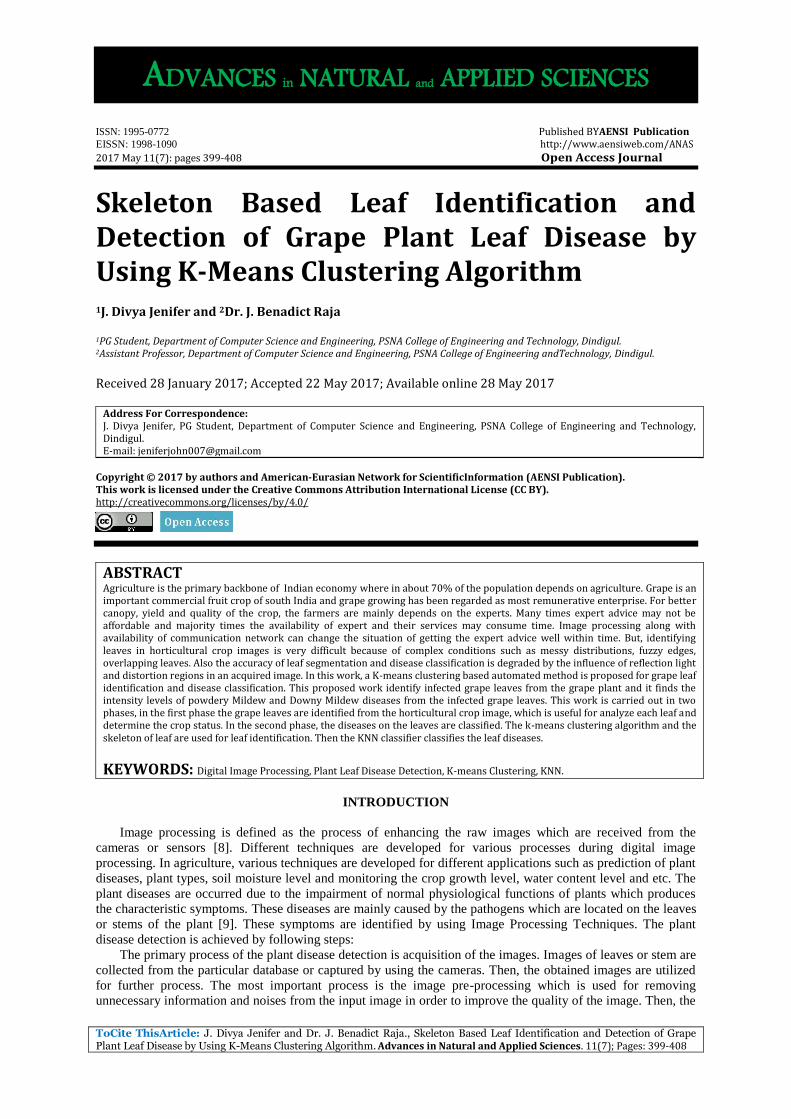
Powdery mildew can taint every green some portion of the grapevine. This disease is most effortlessly
perceived by the dusty appearance or white fine development happening in patches on natural product or clears
out. The white patches of powdery mildew deliver a great many spores (conidia) which are spread by twist to
bring about more contaminations. Free moisture is not required for optional contamination; temperature is the
most essential natural component. The image of grape leaf influenced with powdery mildew is shown below in
Figure1.
Fig. 1: Powdery Mildew affected leaf
Downy Mildew:
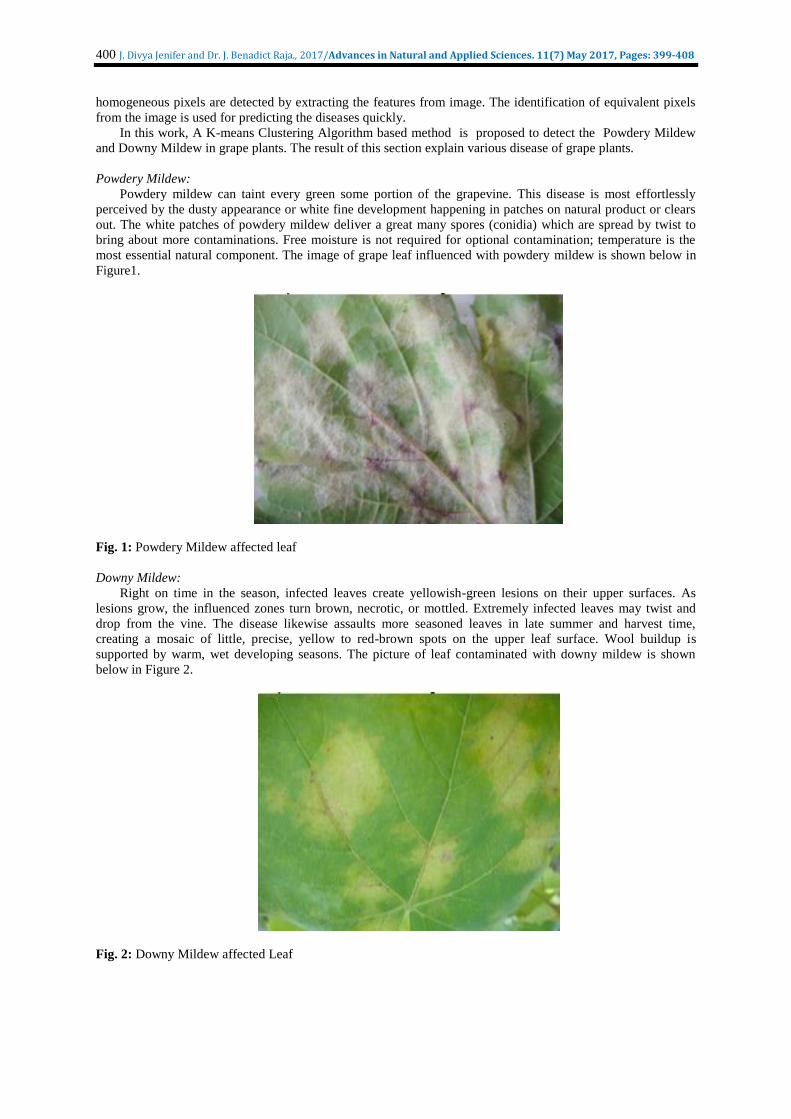
Right on time in the season, infected leaves create yellowish-green lesions on their upper surfaces. As
lesions grow, the influenced zones turn brown, necrotic, or mottled. Extremely infected leaves may twist and
drop from the vine. The disease likewise assaults more seasoned leaves in late summer and harvest time,
creating a mosaic of little, precise, yellow to red-brown spots on the upper leaf surface. Wool buildup is
supported by warm, wet developing seasons. The picture of leaf contaminated with downy mildew is shown
below in Figure 2.
Fig. 2: Downy Mildew affected Leaf
401 J. Divya Jenifer and Dr. J. Benadict Raja., 2017/Advances in Natural and Applied Sciences. 11(7) May 2017, Pages: 399-408
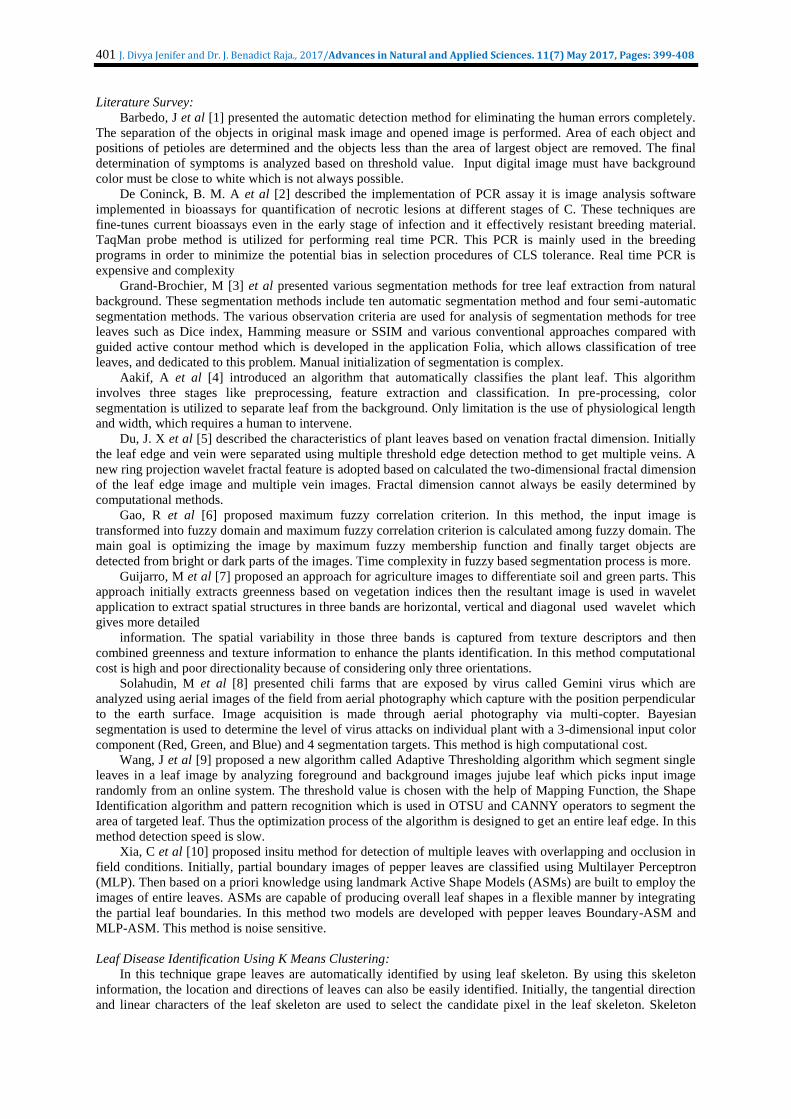
Literature Survey:
Barbedo, J et al [1] presented the automatic detection method for eliminating the human errors completely.
The separation of the objects in original mask image and opened image is performed. Area of each object and
positions of petioles are determined and the objects less than the area of largest object are removed. The final
determination of symptoms is analyzed based on threshold value. Input digital image must have background
color must be close to white which is not always possible.
De Coninck, B. M. A et al [2] described the implementation of PCR assay it is image analysis software
implemented in bioassays for quantification of necrotic lesions at different stages of C. These techniques are
fine-tunes current bioassays even in the early stage of infection and it effectively resistant breeding material.
TaqMan probe method is utilized for performing real time PCR. This PCR is mainly used in the breeding
programs in order to minimize the potential bias in selection procedures of CLS tolerance. Real time PCR is
expensive and complexity
Grand-Brochier, M [3] et al presented various segmentation methods for tree leaf extraction from natural
background. These segmentation methods include ten automatic segmentation method and four semi-automatic
segmentation methods. The various observation criteria are used for analysis of segmentation methods for tree
leaves such as Dice index, Hamming measure or SSIM and various conventional approaches compared with
guided active contour method which is developed in the application Folia, which allows classification of tree
leaves, and dedicated to this problem. Manual initialization of segmentation is complex.
Aakif, A et al [4] introduced an algorithm that automatically classifies the plant leaf. This algorithm
involves three stages like preprocessing, feature extraction and classification. In pre-processing, color
segmentation is utilized to separate leaf from the background. Only limitation is the use of physiological length
and width, which requires a human to intervene.
Du, J. X et al [5] described the characteristics of plant leaves based on venation fractal dimension. Initially
the leaf edge and vein were separated using multiple threshold edge detection method to get multiple veins. A
new ring projection wavelet fractal feature is adopted based on calculated the two-dimensional fractal dimension
of the leaf edge image and multiple vein images. Fractal dimension cannot always be easily determined by
computational methods.
Gao, R et al [6] proposed maximum fuzzy correlation criterion. In this method, the input image is
transformed into fuzzy domain and maximum fuzzy correlation criterion is calculated among fuzzy domain. The
main goal is optimizing the image by maximum fuzzy membership function and finally target objects are
detected from bright or dark parts of the images. Time complexity in fuzzy based segmentation process is more.
Guijarro, M et al [7] proposed an approach for agriculture images to differentiate soil and green parts. This
approach initially extracts greenness based on vegetation indices then the resultant image is used in wavelet
application to extract spatial structures in three bands are horizontal, vertical and diagonal used wavelet which
gives more detailed
information. The spatial variability in those three bands is captured from texture descriptors and then
combined greenness and texture information to enhance the plants identification. In this method computational
cost is high and poor directionality because of considering only three orientations.
Solahudin, M et al [8] presented chili farms that are exposed by virus called Gemini virus which are
analyzed using aerial images of the field from aerial photography which capture with the position perpendicular
to the earth surface. Image acquisition is made through aerial photography via multi-copter. Bayesian
segmentation is used to determine the level of virus attacks on individual plant with a 3-dimensional input color
component (Red, Green, and Blue) and 4 segmentation targets. This method is high computational cost.
Wang, J et al [9] proposed a new algorithm called Adaptive Thresholding algorithm which segment single
leaves in a leaf image by analyzing foreground and background images jujube leaf which picks input image
randomly from an online system. The threshold value is chosen with the help of Mapping Function, the Shape
Identification algorithm and pattern recognition which is used in OTSU and CANNY operators to segment the
area of targeted leaf. Thus the optimization process of the algorithm is designed to get an entire leaf edge. In this
method detection speed is slow.
Xia, C et al [10] proposed insitu method for detection of multiple leaves with overlapping and occlusion in
field conditions. Initially, partial boundary images of pepper leaves are classified using Multilayer Perceptron
(MLP). Then based on a priori knowledge using landmark Active Shape Models (ASMs) are built to employ the
images of entire leaves. ASMs are capable of producing overall leaf shapes in a flexible manner by integrating
the partial leaf boundaries. In this method two models are developed with pepper leaves Boundary-ASM and
MLP-ASM. This method is noise sensitive.
Leaf Disease Identification Using K Means Clustering:
In this technique grape leaves are automatically identified by using leaf skeleton. By using this skeleton
information, the location and directions of leaves can also be easily identified. Initially, the tangential direction
and linear characters of the leaf skeleton are used to select the candidate pixel in the leaf skeleton. Skeleton
402 J. Divya Jenifer and Dr. J. Benadict Raja., 2017/Advances in Natural and Applied Sciences. 11(7) May 2017, Pages: 399-408
image is then enhanced for denoising the leaf skeleton and skeleton outline is then obtained. After this, color
and smooth segmentation is applied on the input image for denoising the leaf skeleton and also for separating
the skeletons. Now clear leaf skeletons are obtained after segmentation. In overlapping problems, Leaf skeletons
are automatically found by using fuzzy connectivity scheme. Finally, individual leaf area and distribution is
identified by calculating root node of a leaf and counting number of pixels from bottom to top in a specific
direction. Based on this skeleton information, grape leaves are successfully identified.
Then so as should recognize grape leaf beet diseases, utilize k-means grouping calculation. Those color
change for RGB picture may be utilized to preferred division of sickness spots. RGB color characteristic
division may be comprises for sickness spots. Those recommended methodology is made for four steps for
example, such that segmentation, characteristic extraction and arrangement & result. The picture division
utilization those K-means grouping system. Those offers Questions are concentrated starting with the
fragmented picture and that divided pictures need aid ordered In light of a tone immersion esteem (HSV). The
information picture from claiming grape leaf beet is unpredictable toward foundation. The preprocessing will be
used to move forward picture information smother unwanted twisting. Then, division may be completed through
K-means grouping system. Those ailing bit will be recognized Eventually K means clustering utilizing division.
Here, K-means grouping is utilized to division What's more is likewise utilized for order for features. The
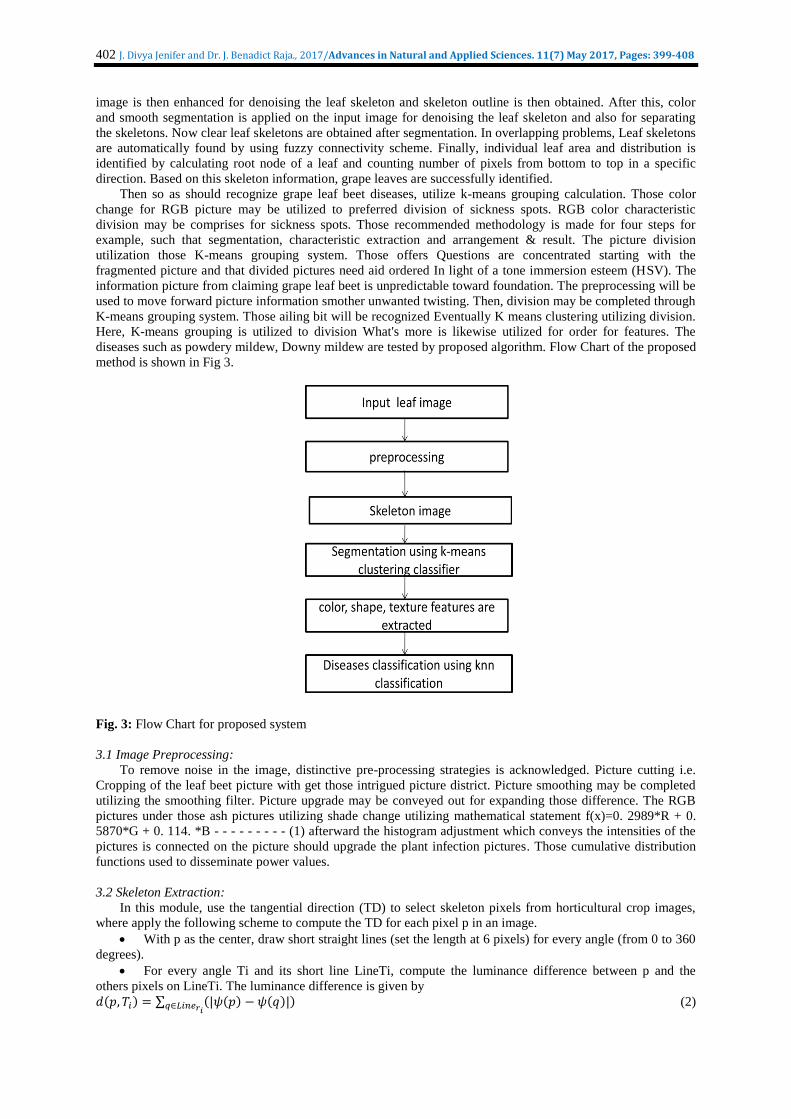
diseases such as powdery mildew, Downy mildew are tested by proposed algorithm. Flow Chart of the proposed
method is shown in Fig 3.
Fig. 3: Flow Chart for proposed system
3.1 Image Preprocessing:
To remove noise in the image, distinctive pre-processing strategies is acknowledged. Picture cutting i.e.
Cropping of the leaf beet picture with get those intrigued picture district. Picture smoothing may be completed
utilizing the smoothing filter. Picture upgrade may be conveyed out for expanding those difference. The RGB
pictures under those ash pictures utilizing shade change utilizing mathematical statement f(x)=0. 2989*R + 0.
5870*G + 0. 114. *B - - - - - - - - - (1) afterward the histogram adjustment which conveys the intensities of the
pictures is connected on the picture should upgrade the plant infection pictures. Those cumulative distribution
functions used to disseminate power values.
3.2 Skeleton Extraction:
In this module, use the tangential direction (TD) to select skeleton pixels from horticultural crop images,
where apply the following scheme to compute the TD for each pixel p in an image.
With p as the center, draw short straight lines (set the length at 6 pixels) for every angle (from 0 to 360
degrees).
For every angle Ti and its short line LineTi, compute the luminance difference between p and the
others pixels on LineTi. The luminance difference is given by
𝑑(𝑝, 𝑇𝑖) = ∑ (|𝜓(𝑝) − 𝜓(𝑞)|)𝑞∈𝐿𝑖𝑛𝑒𝑟𝑖 (2)
403 J. Divya Jenifer and Dr. J. Benadict Raja., 2017/Advances in Natural and Applied Sciences. 11(7) May 2017, Pages: 399-408
In equation (2), the function 𝜓() determines the luminance value of a pixel.
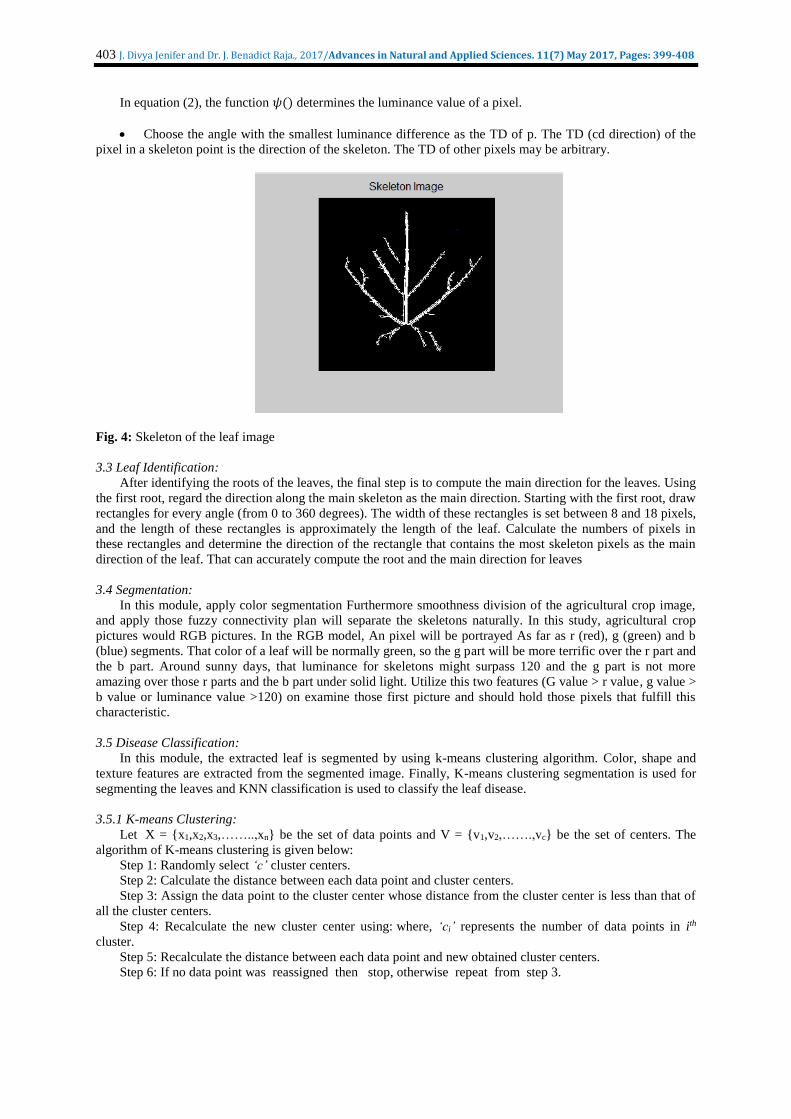
Choose the angle with the smallest luminance difference as the TD of p. The TD (cd direction) of the
pixel in a skeleton point is the direction of the skeleton. The TD of other pixels may be arbitrary.
Fig. 4: Skeleton of the leaf image
3.3 Leaf Identification:
After identifying the roots of the leaves, the final step is to compute the main direction for the leaves. Using
the first root, regard the direction along the main skeleton as the main direction. Starting with the first root, draw
rectangles for every angle (from 0 to 360 degrees). The width of these rectangles is set between 8 and 18 pixels,
and the length of these rectangles is approximately the length of the leaf. Calculate the numbers of pixels in
these rectangles and determine the direction of the rectangle that contains the most skeleton pixels as the main
direction of the leaf. That can accurately compute the root and the main direction for leaves
3.4 Segmentation:
In this module, apply color segmentation Furthermore smoothness division of the agricultural crop image,
and apply those fuzzy connectivity plan will separate the skeletons naturally. In this study, agricultural crop
pictures would RGB pictures. In the RGB model, An pixel will be portrayed As far as r (red), g (green) and b
(blue) segments. That color of a leaf will be normally green, so the g part will be more terrific over the r part and
the b part. Around sunny days, that luminance for skeletons might surpass 120 and the g part is not more
amazing over those r parts and the b part under solid light. Utilize this two features (G value > r value, g value >
b value or luminance value >120) on examine those first picture and should hold those pixels that fulfill this
characteristic.
3.5 Disease Classification:
In this module, the extracted leaf is segmented by using k-means clustering algorithm. Color, shape and
texture features are extracted from the segmented image. Finally, K-means clustering segmentation is used for
segmenting the leaves and KNN classification is used to classify the leaf disease.
3.5.1 K-means Clustering:
Let X = {x1,x2,x3,……..,xn} be the set of data points and V = {v1,v2,…….,vc} be the set of centers. The
algorithm of K-means clustering is given below:
Step 1: Randomly select ‘c’ cluster centers.
Step 2: Calculate the distance between each data point and cluster centers.
Step 3: Assign the data point to the cluster center whose distance from the cluster center is less than that of
all the cluster centers.
Step 4: Recalculate the new cluster center using: where, ‘ci’ represents the number of data points in ith
cluster.
Step 5: Recalculate the distance between each data point and new obtained cluster centers.
Step 6: If no data point was reassigned then stop, otherwise repeat from step 3.
404 J. Divya Jenifer and Dr. J. Benadict Raja., 2017/Advances in Natural and Applied Sciences. 11(7) May 2017, Pages: 399-408
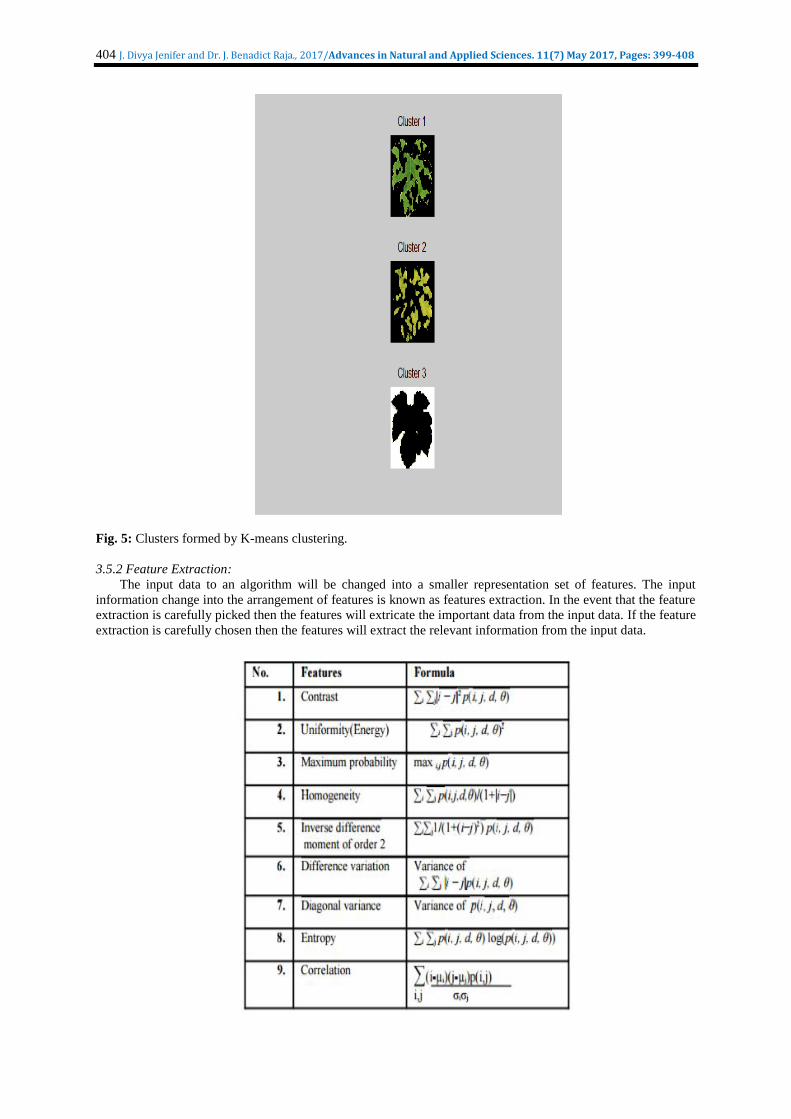
Fig. 5: Clusters formed by K-means clustering.
3.5.2 Feature Extraction:
The input data to an algorithm will be changed into a smaller representation set of features. The input
information change into the arrangement of features is known as features extraction. In the event that the feature
extraction is carefully picked then the features will extricate the important data from the input data. If the feature
extraction is carefully chosen then the features will extract the relevant information from the input data.
405 J. Divya Jenifer and Dr. J. Benadict Raja., 2017/Advances in Natural and Applied Sciences. 11(7) May 2017, Pages: 399-408
3.5.3 KNN Classification:
Numerous strategies in image processing have been created centered around early recognition of illnesses
and nutritious lacks. Specific computer vision frameworks can be a support on decision making to fitting harvest
administration. A image processing technique to determine and characterize grapevine leaves to have certain
level of potassium inadequacy is proposed. The proposed division technique in light of K-Nearest Neighbors
(KNN) was contrasted with strategies in view of histogram. KNN demonstrated to have better outcomes
uniquely when the earth were pictures are obtained is less controlled. In pattern recognition, the K-nearest
neighbor algorithms (K-NN) is a method for classifying objects based on closest training examples in the feature
space. K-NN is a type of instance-based learning where the function and computation is deferred until
classification. So the K-nearest neighbor algorithm is the powerful of all machine learning algorithms. The
object is classified of its neighbors and being assigned to the class most common to its K nearest neighbors.
Here K is an integer and if K = 1 then the object is assigned to the class of its nearest neighbor.
Classify (X,Y, x)
// X: training data, Y: class label and x: unknown sample
Step 1: For i=1 to m do
Step 2: Compute distance d(Xi,x)
Step 3: End for
Step 4: Compute set I containing indices for the k smallest distances d(Xi,x).
Step 5: Return majority label for {Yi where i belongs to I}
Thus, the proposed leaf identification technique is used for classifying the leaf diseases based on specific
types of leaves effectively and the classified dataset is utilized during the testing phase.
Experimental Results:
In this section, the proposed technique is evaluated by utilizing the grape leaf images. The selected leaf
images are may affected by different factors like sunlight, shelter, crop diseases, insect pests and the
background.
The effectiveness of the proposed technique is evaluated in terms of precision, recall, f-measure and
accuracy.
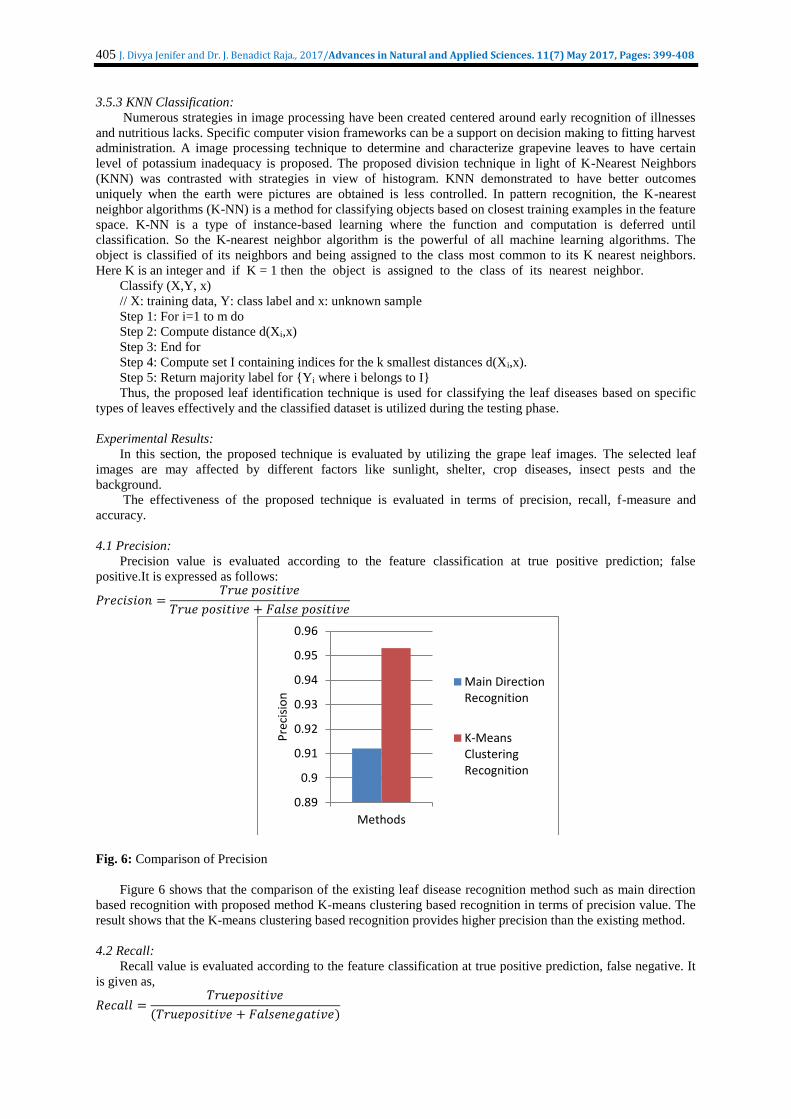
4.1 Precision:
Precision value is evaluated according to the feature classification at true positive prediction; false
positive.It is expressed as follows:
𝑃𝑟𝑒𝑐𝑖𝑠𝑖𝑜𝑛 =𝑇𝑟𝑢𝑒 𝑝𝑜𝑠𝑖𝑡𝑖𝑣𝑒
𝑇𝑟𝑢𝑒 𝑝𝑜𝑠𝑖𝑡𝑖𝑣𝑒 + 𝐹𝑎𝑙𝑠𝑒 𝑝𝑜𝑠𝑖𝑡𝑖𝑣𝑒
Fig. 6: Comparison of Precision
Figure 6 shows that the comparison of the existing leaf disease recognition method such as main direction
based recognition with proposed method K-means clustering based recognition in terms of precision value. The
result shows that the K-means clustering based recognition provides higher precision than the existing method.
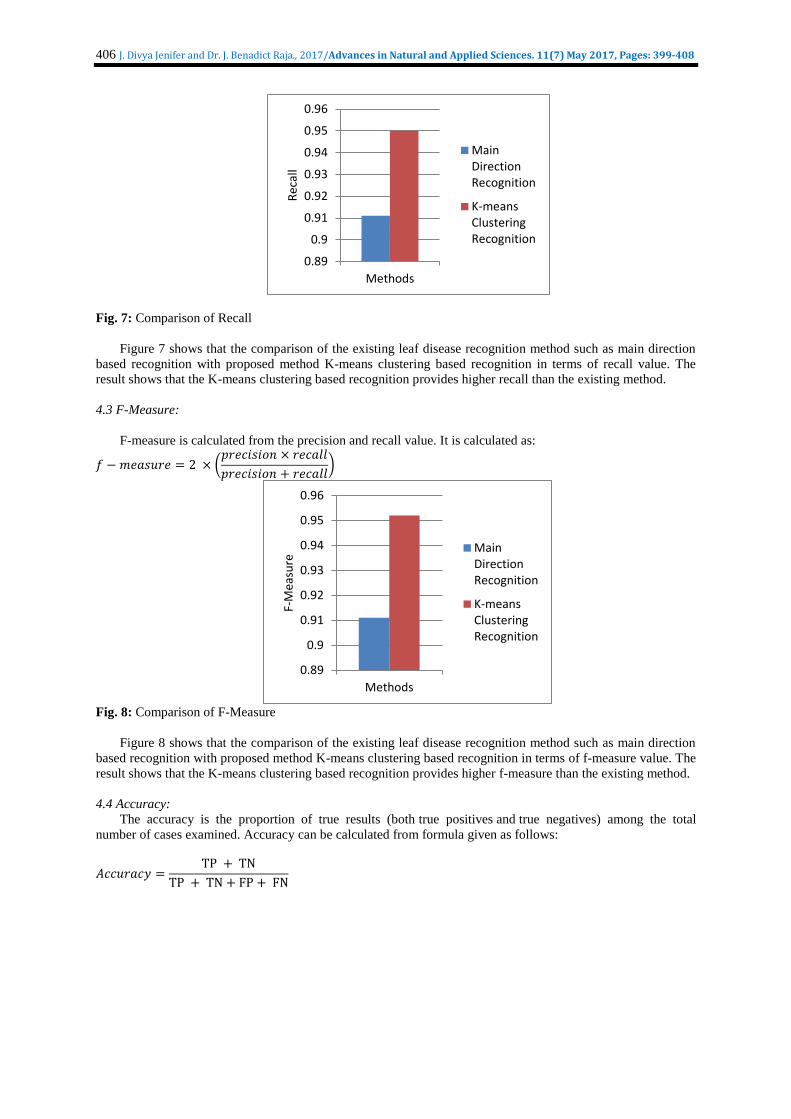
4.2 Recall:
Recall value is evaluated according to the feature classification at true positive prediction, false negative. It
is given as,
𝑅𝑒𝑐𝑎𝑙𝑙 =𝑇𝑟𝑢𝑒𝑝𝑜𝑠𝑖𝑡𝑖𝑣𝑒
(𝑇𝑟𝑢𝑒𝑝𝑜𝑠𝑖𝑡𝑖𝑣𝑒 + 𝐹𝑎𝑙𝑠𝑒𝑛𝑒𝑔𝑎𝑡𝑖𝑣𝑒)
0.89
0.9
0.91
0.92
0.93
0.94
0.95
0.96
Methods
Pre
cisi
on
Main DirectionRecognition
K-MeansClusteringRecognition
406 J. Divya Jenifer and Dr. J. Benadict Raja., 2017/Advances in Natural and Applied Sciences. 11(7) May 2017, Pages: 399-408
Fig. 7: Comparison of Recall
Figure 7 shows that the comparison of the existing leaf disease recognition method such as main direction
based recognition with proposed method K-means clustering based recognition in terms of recall value. The
result shows that the K-means clustering based recognition provides higher recall than the existing method.
4.3 F-Measure:
F-measure is calculated from the precision and recall value. It is calculated as:
𝑓 − 𝑚𝑒𝑎𝑠𝑢𝑟𝑒 = 2 × (𝑝𝑟𝑒𝑐𝑖𝑠𝑖𝑜𝑛 × 𝑟𝑒𝑐𝑎𝑙𝑙
𝑝𝑟𝑒𝑐𝑖𝑠𝑖𝑜𝑛 + 𝑟𝑒𝑐𝑎𝑙𝑙)
Fig. 8: Comparison of F-Measure
Figure 8 shows that the comparison of the existing leaf disease recognition method such as main direction
based recognition with proposed method K-means clustering based recognition in terms of f-measure value. The
result shows that the K-means clustering based recognition provides higher f-measure than the existing method.
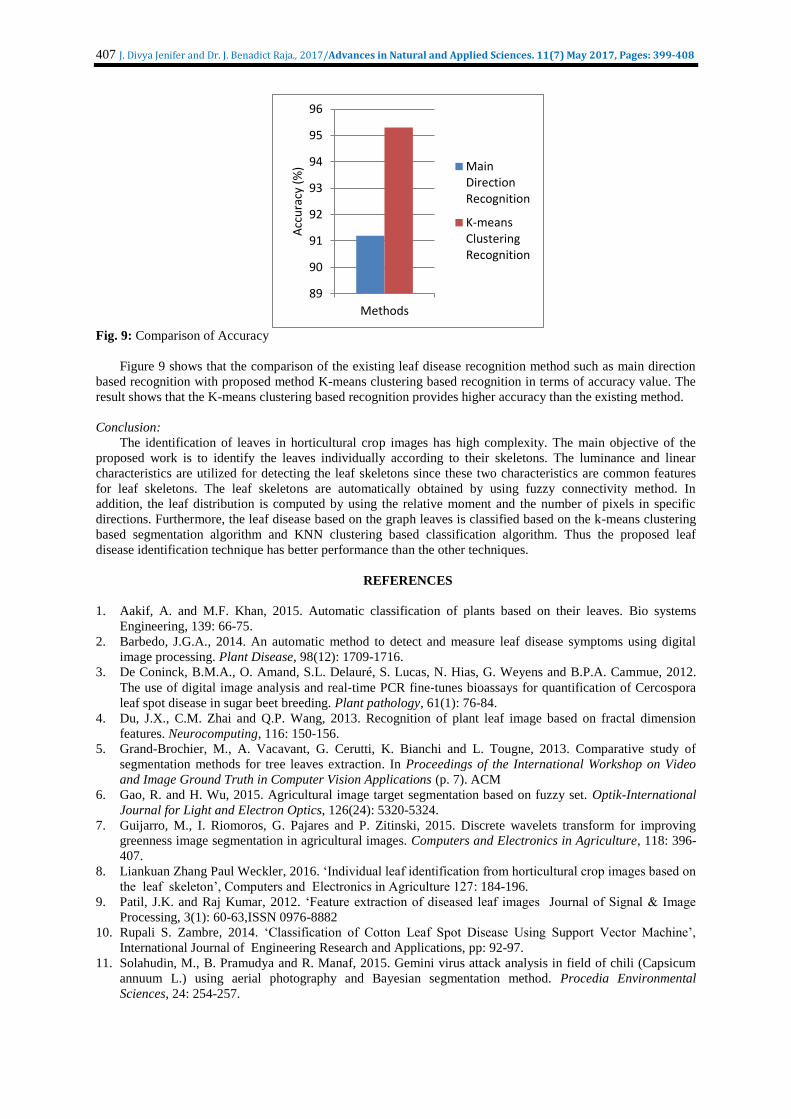
4.4 Accuracy:
The accuracy is the proportion of true results (both true positives and true negatives) among the total
number of cases examined. Accuracy can be calculated from formula given as follows:
𝐴𝑐𝑐𝑢𝑟𝑎𝑐𝑦 =TP + TN
TP + TN + FP + FN
0.89
0.9
0.91
0.92
0.93
0.94
0.95
0.96
MethodsR
ecal
l
MainDirectionRecognition
K-meansClusteringRecognition
0.89
0.9
0.91
0.92
0.93
0.94
0.95
0.96
Methods
F-M
easu
re
MainDirectionRecognition
K-meansClusteringRecognition
407 J. Divya Jenifer and Dr. J. Benadict Raja., 2017/Advances in Natural and Applied Sciences. 11(7) May 2017, Pages: 399-408
Fig. 9: Comparison of Accuracy
Figure 9 shows that the comparison of the existing leaf disease recognition method such as main direction
based recognition with proposed method K-means clustering based recognition in terms of accuracy value. The
result shows that the K-means clustering based recognition provides higher accuracy than the existing method.
Conclusion:
The identification of leaves in horticultural crop images has high complexity. The main objective of the
proposed work is to identify the leaves individually according to their skeletons. The luminance and linear
characteristics are utilized for detecting the leaf skeletons since these two characteristics are common features
for leaf skeletons. The leaf skeletons are automatically obtained by using fuzzy connectivity method. In
addition, the leaf distribution is computed by using the relative moment and the number of pixels in specific
directions. Furthermore, the leaf disease based on the graph leaves is classified based on the k-means clustering
based segmentation algorithm and KNN clustering based classification algorithm. Thus the proposed leaf
disease identification technique has better performance than the other techniques.
REFERENCES
1. Aakif, A. and M.F. Khan, 2015. Automatic classification of plants based on their leaves. Bio systems
Engineering, 139: 66-75.
2. Barbedo, J.G.A., 2014. An automatic method to detect and measure leaf disease symptoms using digital
image processing. Plant Disease, 98(12): 1709-1716.
3. De Coninck, B.M.A., O. Amand, S.L. Delauré, S. Lucas, N. Hias, G. Weyens and B.P.A. Cammue, 2012.
The use of digital image analysis and real‐time PCR fine‐tunes bioassays for quantification of Cercospora
leaf spot disease in sugar beet breeding. Plant pathology, 61(1): 76-84.
4. Du, J.X., C.M. Zhai and Q.P. Wang, 2013. Recognition of plant leaf image based on fractal dimension
features. Neurocomputing, 116: 150-156.
5. Grand-Brochier, M., A. Vacavant, G. Cerutti, K. Bianchi and L. Tougne, 2013. Comparative study of
segmentation methods for tree leaves extraction. In Proceedings of the International Workshop on Video
and Image Ground Truth in Computer Vision Applications (p. 7). ACM
6. Gao, R. and H. Wu, 2015. Agricultural image target segmentation based on fuzzy set. Optik-International
Journal for Light and Electron Optics, 126(24): 5320-5324.
7. Guijarro, M., I. Riomoros, G. Pajares and P. Zitinski, 2015. Discrete wavelets transform for improving
greenness image segmentation in agricultural images. Computers and Electronics in Agriculture, 118: 396-
407.
8. Liankuan Zhang Paul Weckler, 2016. ‘Individual leaf identification from horticultural crop images based on
the leaf skeleton’, Computers and Electronics in Agriculture 127: 184-196.
9. Patil, J.K. and Raj Kumar, 2012. ‘Feature extraction of diseased leaf images Journal of Signal & Image
Processing, 3(1): 60-63,ISSN 0976-8882
10. Rupali S. Zambre, 2014. ‘Classification of Cotton Leaf Spot Disease Using Support Vector Machine’,
International Journal of Engineering Research and Applications, pp: 92-97.
11. Solahudin, M., B. Pramudya and R. Manaf, 2015. Gemini virus attack analysis in field of chili (Capsicum
annuum L.) using aerial photography and Bayesian segmentation method. Procedia Environmental
Sciences, 24: 254-257.
89
90
91
92
93
94
95
96
MethodsA
ccu
racy
(%
) MainDirectionRecognition
K-meansClusteringRecognition
408 J. Divya Jenifer and Dr. J. Benadict Raja., 2017/Advances in Natural and Applied Sciences. 11(7) May 2017, Pages: 399-408
12. Wang, J., J. He, Y. Han, C. Ouyang and D. Li, 2013. An adaptive thresholding algorithm of field leaf
image. Computers and electronics in agriculture, 96: 23-39.
13. Xia, C., J.M. Lee, Y. Li, Y.H. Song, B.K. Chung and T.S. Chon, 2013. Plant leaf detection using modified
active shape models. Bio systems engineering, 116(1): 23-35.