Embed Size (px)
Citation preview

Skin in the game: The performance of insured and uninsured municipal debt
Daniel Bergstresser* Randolph Cohen**
Siddharth Shenai***
(First version October 2010. Comments welcome.)
Abstract We compare the performance of insured and uninsured municipal bonds by looking at
changes in the bonds’ underlying credit quality. We focus on transitions in the Standard and Poor’s ratings of the underlying municipal issuers. We find that the insured bonds have had substantially better underlying rating transition performance than uninsured bonds. In other words, the pure security selection ability of the financial guarantors appears to have been positive. We estimate that the financial guarantors’ outperformance on their portfolio of insured municipal issues has amounted industry-wide to a value of about $5 Billion since December 2007.
Keywords: Bond insurance, municipal bonds.
We are grateful for support from Harvard Business School and for excellent research assistance from Mei Zuo. We are grateful for comments and advice from Jennifer Bethel and Jens Hilscher. * Corresponding author. Harvard Business School. Tel.: 617-495-6169. E-mail: [email protected] ** Massachusetts Institute of Technology and Vision Capital. *** Harvard Business School, Harvard Law School, and Bracebridge Capital.
1

Financial guarantors have played a central role in the ongoing credit crisis. At their peak,
they insured approximately half of all municipal issues as well as billions of dollars of structured
products based on residential mortgages. The collapse of the financial guarantee industry has
had an impact throughout the financial system, and the financial guarantors have earned their
place among the magnets of blame for the entire crisis. We ask a very simple question about the
financial guarantors: given that their core business was insuring municipal debt, how good were
they at selecting which municipal issues to insure? Our conclusions lead us to have some
sympathy for the embattled guarantors. Although the guarantors were massively levered, and as
an industry they made an unfortunate detour into insuring non-municipal products, their pure
security selection ability with respect to municipal issues appears to have been positive.
This conclusion is based on an assessment of the underlying credit quality of the
municipal portfolios that the guarantors have insured. We find that, controlling for the
underlying rating, the bonds insured by financial guarantors have better ratings transition
performance than uninsured bonds. We use the underlying ratings of the municipal bond issuers,
rather than the enhanced ratings of the bonds. The underlying rating reflects that credit quality
of the municipal issuer, while the enhanced bond rating reflects the joint credit quality of the
financial guarantor and the issuer. The default performance between insured and uninsured debt
is not distinguishable, a fact attributable to the miniscule default frequency (so far) among
municipal issues. Using ratings transitions, however, we can place a dollar magnitude on the
value of the guarantors’ outperformance: we estimate that the financial guarantors’
outperformance between December of 2007 and September of 2010 amounted to about $5
Billion across the industry, or about 43 basis points of the $1.3 Trillion insured portfolio. Scaled
2

differently, security selection has amounted a total equivalent to 30 percent of the S&P-estimated
$18 Billion in guarantors’ capital as of December 2007.
These numbers, based on transitions in the underlying credit quality of the insured and
uninsured portfolios, don’t necessarily tell us about the profitability of the bond insurers’
municipal finance businesses. We do not know, bond by bond, how much the guarantors
charged for the insurance they provided. But our results do allow us to reject some interesting
hypotheses. For one thing, the period since the credit crisis has seen a particularly persistent
phenomenon where the yields on insured debt, controlling for credit rating, have exceeded the
yields on uninsured debt (see Bergstresser et al, 2010). One potential explanation for this
phenomenon would be that the credit quality of insured debt, controlling for rating, has been
lower than the credit quality of uninsured debt. By this argument, low-quality issuers would
have been more likely to need to get insurance, or to have their investors demand it (see Butler et
al, 2009, who find that issuers in more corrupt locations are more likely to get insurance) Our
results suggest that, on net, controlling for rating, the opposite seems to have held. The ratings
transition performance of the insured bonds has been better than the uninsured.
Because insurance status predicts subsequent ratings transitions, our results also allow us
to reject the hypothesis that credit ratings conveyed all information available to market
participants. Similar to analyses by Adelino (2010) and Ashcraft et al (2009) who analyze the
market for MBS, we find that additional information, available at the point of bond issuance, has
some predictive power for subsequent bond performance.
One persistent criticism of the credit rating industry has been that the ratings firms have
no ‘skin in the game’. The ratings agencies offer ratings but have only reputational capital at risk
3

based on the performance of the rated bonds. Financial guarantors are the polar opposite – they
‘rate’ a bond by taking exposure to the bond’s credit risk. The performance of the insured bonds
over the crisis period leads us to conclude that this ‘skin in the game’ seems to matter. The
insured portfolios perform substantially better than would have been the outcome of a ratings-
matched dartboard approach.
The financial guaranty industry has been criticized from many different sides recently.
Critical accounts of the industry have highlighted accounting practices, investment policies, and
practices with respect to off-balance sheet. We don’t challenge any of this criticism. We ask
and answer a very narrow question. The financial guarantors, when it came to insuring
municipal securities, appear to have had some security selection ability.
This paper proceeds in four sections. Section 1 describes the credit rating and financial
guarantee industries. Section 2 describes our hypothesis tests. Section 3 describes our data.
Section 4 presents our results. A brief final section concludes.
1. The credit rating and financial guaranty industry
The financial guarantors go back to 1971, when the American Municipal Bond Insurance
Corporation, a predecessor of Ambac, insured a local bond issue in Alaska. MBIA’s predecessor
began in 1975. The growth of the industry was boosted by the 1975 New York City default
crisis and the 1983 default at the Washington State Public Power Supply System. The industry
grew to insure roughly half of municipal debt by the mid 2000s, and was an oligopoly, with
MBIA, Ambac, FGIC, CFIG, FSA, AGC, and ACA insuring the bulk of the debt. Table 1
shows the total municipal universe, and the amounts insured by different issuers. Of the $3.4
4

Trillion in municipal debt outstanding in September 2010, approximately $1.3 Trillion was
insured. Bond insurance has been a broad phenomenon – issuers at all levels and throughout the
country have chosen to issue bonds with bond insurance attached.
With the rapid growth of structured finance, in particular securities tied to subprime
mortgages in the 2000s, the bond insurers branched out into insuring structured products based
on residential mortgages. Table 2 shows the aggregate result of this shift. As of December
2006, on the eve of the crisis in structured finance, the bond insurers collectively had insured
$823 Billion worth of structured finance instruments. Of this total, $200 Billion were directly
tied to mortgages, whether in the US or abroad. This exposure has adversely impacted the
financial guarantors, leading to ratings downgrades and even bankruptcies. This expansion into
guaranteeing CDOs and RMBS was ill-timed, and may even have been ill-considered. The bond
insurers have been criticized from all sides, and even blamed for the severity of the ongoing
credit crisis. In this paper we neither challenge nor add to any of this criticism. We ask a very
simple question: when it came to their selection ability with respect to their municipal portfolios,
were they able to do better than a ratings-matched dartboard approach.
2. Hypotheses
We test the null hypothesis that the distribution of transitions in the underlying credit
quality does not differ between insured and uninsured municipal debt. Our measure of
underlying credit quality is based on the SPUR, or Standard and Poor’s Underlying Rating.
Figure 1 shows the official statement from a recent municipal issue, where the first lines
highlight both the rating of the instrument (AAA) and the S&P rating of the credit quality of the
underlying credit (A). Bond insurance from Assured Guaranty leads the credit rating assigned to
the issue to exceed the credit rating of the issuer. We take the S&P underlying rating as a
5

measure of issuer credit quality, and for issues that are not insured we impute a SPUR equal to
the rating of the issuer. We also test the hypothesis that default probabilities are the same
between insured and uninsured debt. This test has much less power: while ratings transitions are
rather common among municipal issuers, at least to this point defaults have been exceedingly
rare.
3. Data
Data for this study are compiled from several sources. The first source is Mergent, which
has data on the bond characteristics, including the issuer, the issuance and maturity dates,
whether the bond was insured, and the identity of the insurer. Mergent also identifies whether
the bond was insured in the primary or secondary market; most municipal debt that is insured is
sold with insurance at issuance, but there is also a smaller secondary market for insuring
municipal debt. All of our results that follow include only bonds identified by Mergent as being
insured in the primary market rather than the secondary market. Our rationale for this restriction
is that purchasing bond insurance in the secondary market potentially reflects events that have
happened to the issuer since issuance. Because excluding the bonds that Mergent lists as
secondary market-insured is likely to exclude a large set of bonds that were issued without
insurance but then subsequently insured after negative events, we view this exclusion as
conservative with respect to our conclusion that the insurers collectively have good security
selection at bond issuance.
We merge the Mergent data with ratings data from Standard and Poor’s. Standard and
Poor’s ratings include both ratings for the instrument, and for many issuers of insured
6

instruments, ratings for the underlying issuer (SPURs, or Standard & Poor’s Underlying
Ratings.) For uninsured issues, we impute a SPUR equal to the rating of the instrument.
Table 3 describes the sample of bonds used in the analysis. The analysis starts with the
Mergent sample of 2,694,906 bonds. The average size of the bonds in the sample is $2.769
million, and the average maturity is 9.92 years. The average yield at issuance was 4.288 percent.
We calculate a spread measure by matching the month and maturity of issuance of the bond to
the Bloomberg-reported AAA municipal yield curve; the average spread for all bonds in the
sample was 38.4 basis points over that benchmark. 43.3 percent of the bonds were unlimited-tax
General Obligation bonds, meaning that the bonds were backed by the taxing ability of the local
or state authority that issued them. 20.3 percent of the bonds were revenue bonds, where the
instruments were backed only by the revenue from a specific project. The residual bonds include
limited-tax GO bonds, bonds backed by tobacco settlements, loan agreements, education loans,
and other types of municipal borrowing. 63.7 percent of bonds were new bonds, the remainder
were ‘refunding’ bonds issued to retire existing debt. 46.1 percent of the bonds were insured,
and for 36.8 percent of the bonds we have or are able to impute a credit rating for the underlying
issuer.
Comparing the insured and uninsured bonds, the insured bonds have an average spread of
24.8 basis points while the uninsured were issued at an average spread of 52 basis points. The
insured bonds tended to be smaller in size than the uninsured bonds, and the average maturity of
the two subsamples is the same. Our analysis, based on ratings transitions, is limited to the
sample for which we have S&P rating data. For this subsample, we must be careful to be
specific about the credit rating of the instrument versus the credit rating of the issuer. 149,415
bonds were issued by AAA-rated issuers. Of these, only 1,675 were sold with bond insurance.
7

The mean spread of insured bonds issued by AAA-underlying issuers was 16.7 basis points,
significantly lower than the 29.5 basis point mean spread of uninsured bonds issued by AAA-
underlying issuers. The sample of AAA-rated bonds is much larger – these 593,179 bonds
include both the bonds who owed their AAA rating to the underlying credit quality of the issuer
and the bonds that owed their AAA rating to the insurance wrap.
The remainder of the sample includes 412,890 bonds issued by AA-rated underlying
issuers, 358,340 bonds issued by A-rated underlying issuers, and 71,452 bonds issued by BBB-
rated underlying issuers. Not surprisingly, the wedge between the average spread of insured and
uninsured issues goes up at the lower credit ratings – among the BBB-rated underlying issuers
the average spread on uninsured issues is 97.3 basis points and the average spread on insured
issues was 33.4 basis points. The A-rated and BBB-rated underlying issuers were much more
likely to sell bonds with insurance than the AAA-rated and AA-rated underlying issuers.
4. Tests
Our first empirical analysis looks at monthly ratings transitions for the underlying credit
ratings of the issuers, over the period between 1990 and September, 2010. We take our sample
of S&P-rated bonds and issuers and construct an unbalanced panel of 63,014,771 monthly
observations. We divide these observations into three buckets, upgrades, no-change
observations, and downgrades. Our results are not sensitive to condensing the set of transitions
to three; our estimation of the empirical magnitude of the insurer outperformance that follows in
Table 11 is based on the entire transition matrix.
Among the entire sample, 98.31 percent of monthly observations were associated with no
change in the credit quality of the underlying issuer. 1.062 percent of month-bond observations
8

saw a downgrade, and 0.628 percent of observations saw an upgrade. Months with upgrades
were 37.2 percent of all of the months with changes. Among the uninsured bonds, 0.443 percent
of observations saw an upgrade, and 1.023 percent of observations saw a downgrade. The
upgrade ratio was 30.2 percent versus 37.2 percent in the entire sample.
To assess the statistical significance of the insurer outperformance we regress the
monthly change categorical variable on a dummy variable for uninsured status, the bottom panel
of Table 4 shows the coefficients and t-statistics from models with different sets of additional
controls. The first model has no covariates other than the dummy for uninsured bonds, and the
coefficient estimate is 0.0033. Assuming that all changes are by one notch, this coefficient
estimate implies that over a 5-year (60-month) period the issuer of an uninsured bond, in
expectation, would have 6*0.0033 = 0.198 notches worth of downgrade relative to the
underlying credit rating of an insured bond. Model 2 includes controls for month; downgrades
are concentrated in time in certain months, particularly recent months. Controlling for the month
raises the coefficient on the insurance dummy from 0.0033 to 0.0042. Controlling for the
interaction of month and bond type (GO, revenue, etc) leads to a coefficient of 0.0035. All of
our t-statistics are adjusted for clustering at the level of the issue. Municipal debt is typically
issued in a series, with multiple bonds in an issue, and downgrades often happen at the issue
level rather than for just one bond. The overall pattern of results is highly significant regardless
of the clustering approach.
There are 28,176,036 month-bond observations identified by Mergent as carrying bond
insurance. Among these observations, the probability of upgrade is 0.857 percent and the
probability of downgrade is 1.11 percent. There is much lower rating stability among the insured
sample, in the sense that both upgrades and downgrades are more likely than in the uninsured
9

sample. The upgrade ratio is 43.6 percent, versus 30.2 percent among the uninsured sample.
Because the insured and uninsured dummy variables are complements, the coefficients and t-
statistics for the insured dummy variables are just the opposite of the uninsured variables in the
earlier column.
We also focus on the 19,663,141 observations insured by the highly troubled insurers.
The financial guarantors cleave neatly into two groups – those whose credit ratings have been cut
below investment grade, including MBIA, Ambac, FGIC, CIFG, and XL, and those who are less
financially troubled. The less troubled insurers include only Assured Guaranty and FSA, which
have merged since the start of the financial crisis. The Berkshire Hathaway-sponsored
guarantor, BHAC, entered the market after the credit crisis had hurt the incumbents. BHAC
initially had a high credit rating. The pure security-selection performance of the troubled
insurers has been particularly good: the upgrade ratio in the troubled insurer sample is 47.4
percent, versus 30.2 percent among the uninsured bonds. This result is highly significant as well.
Table 5 looks in detail at the performance of individual insurers. The pattern that
emerges suggests that, on the whole, the troubled insurers each appear to have had some
selection ability, at least controlling for timing and bond type. Focusing on the less-troubled
guarantors, we find a pattern of evidence that could be consistent with two different hypotheses.
Specifically, Berkshire Hathaway appears to have much worse security selection performance
than the other insurers in the sample. No matter what set of controls we use, the Berkshire
Hathaway dummy carries a large and significant coefficient in the downgrade regression. This
pattern of results is consistent with Berkshire Hathaway entering the bond insurance market
naively and doing a poor job of picking securities to insure. It could also be consistent, however,
with a particular pattern of data errors in the Mergent data on bond insurance. While we
10

discarded observations listed by Mergent as having been insured in the secondary market, if
bonds insured by BHAC in the secondary market were incorrectly listed by Mergent as having
been insured in the primary market, then they would have remained in our sample. If bonds
where the underlying issuers had experienced negative ratings transitions were
disproportionately likely to get secondary insurance from Berkshire Hathaway (and get it after
the negative events), and the Mergent data on these bonds were to incorrectly list BHAC as the
insurer in the primary market, then Berkshire Hathaway’s reported security selection
performance would look, in our empirical analysis, worse than it really has been. Although
Mergent is a well-regarded source of municipal bond data, used both by practitioners and
academics, the scale of the apparent underperformance of the BHAC-insured portfolio leaves us
at least open to the possibility of some mis-coding. On the other hand, given BHAC’s status as a
new entrant to the field of bond insurance, we are open to the possibility that their security
selection performance has actually been truly dismal. Because of this uncertainty about the
BHAC-insured bonds (which amount to only 11,804 monthly observations out of 63,000,000
total), we view our overall empirical results in Table 4 to potentially slightly underestimate the
collective outperformance of the bond insurance industry.
Table 6 looks more closely at the underlying ratings transitions among the AA-rated
subset of underlying municipal issuers. Here our results are the weakest: in the model with no
covariates the dummy on insurance is slightly positive and statistically significant. With controls
for month and controls for month-by-bond type, which we view as more reliability indicating
security selection ability, the coefficient for the all-insurer dummy is negative and significant.
For the troubled-insurer subset, the coefficient is negative and statistically significant regardless
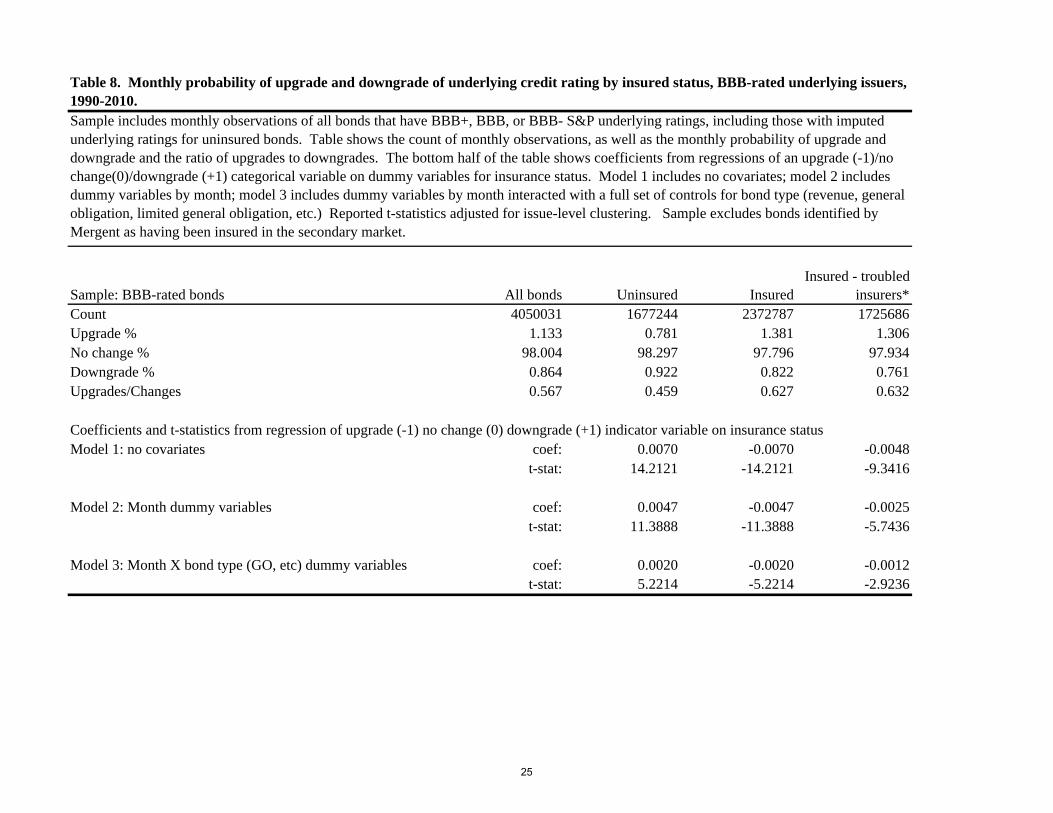
of the pattern of additional controls used. Tables 7 and 8 look more closely at the bonds with
11

underlying ratings of A and BBB. In each of these subsamples, no matter what pattern of
controls is used, and no matter whether the subset of insurers includes all of them or just the
troubled insurers, the coefficients on the insurance dummies are negative and statistically
significant. An interesting pattern emerges in the results across Tables 2, 4, 5, and 6. In the
Model 3 specification in Table 2, the coefficient on the insurance dummy is -0.0035. This
coefficient implies a net downgrade of 0.21 notches over a 5-year period for a bond. When the
Model 3 specification is fit separately by underlying credit rating, the coefficients on the
insurance dummy fall but remain statistically significant. In the A-rated subsample, the
estimated coefficient is -0.0015, implying a (still economically significant) net downgrade of
0.09 excess notches for the uninsured sample over a 5-year horizon.
Table 9 takes a slightly different empirical approach. Rather than creating monthly
observations for each bond, we use one observation for each bond and use a dependent variable
which reflects the lifetime transition experience (through September 2010) of each underlying
credit rating. Our t-statistics still reflect clustering at the issue level, and our observation cound
falls to just under 1,000,000, of which about half are insured. Here the pattern of results is the
same, and the economic magnitude of the results is similar to the earlier results as well. The
lifetime outperformance of the underlying credit quality of insured bonds over uninsured bonds
amounts to an average of 0.225 notches for the entire insured sample based on the model with no
covariates. Model 2 in this case includes dummy variables for each year that the bond was
outstanding, reflecting the fact that exposure to certain years has carried a much greater chance
of downgrade than others. Model 3 includes dummies for exposure to each year as well as
dummy variables capturing bond type. Each of these models implies outperformance among the
insured bonds, suggesting security selection ability on the part of the insurers.
12

Table 10 focuses specifically at general obligation bonds, which are backed by the taxing
authority of the state or local issuer. We find similar results within this subsample, and indeed
within all of the major subtypes of municipal debt; the outperformance of insured debt appears to
be a broad phenomenon. Table 11 reflects our attempt to place a dollar value on the
outperformance of the insured subsample. We start with the December 2007 distribution of
credit ratings of uninsured bonds, listed in columns (1) and (2). We then estimate the entire
transition matrix of underlying credit quality separately for the insured and uninsured bonds in
our sample over the period between December 2007 and September 2010, the last date for which
we have data. Columns (3) and (4) reflect (counterfactual) outcome credit rating distribution that
would have applied had the transition matrix estimated on the uninsured sample was applied to
the starting distribution of insured bonds. Columns (5) and (6) apply the transition matrix
estimated on the insured sample. We then take these estimated distributions, and make a value
impact estimate by using the September 2010 yields for 10-year maturity municipal bonds of
different credit rating, taken from Bloomberg. We estimate a value loss versus the AAA
benchmark by assuming an 8-year duration, meaning that we multiply the difference in spreads
between each rating level and the AAA spread by -8 to get a hypothetical value impact. Using
the AAA point as a benchmark is not terribly consequential since our goal is to compare the
value impact using the insured and uninsured transition matrices to each other, rather than to any
absolute benchmark. Columns (9) and (10) give a ‘contribution to loss’ for each transition
matrix, leading us to conclude that applying the uninsured bond transition matrix to the insured
bond starting point would have led to a loss 43 basis points larger than for the insured sample.
With $1.3 Trillion in insured debt outstanding, 43 basis points of outperformance amounts to
approximately $5 Billion. S&P in December 2007 estimated that the financial guarantors
13

collectively had $18 Billion in capital; our results would suggest that the outperformance based
on their municipal security selection was large relative to their starting capital – a fact that
reflects both the guarantors’ security selection ability and the astonishing leverage at which they
operated.
Table 12 is our final exercise; we look at differences in default experience over the
period between the insured and uninsured bonds. We take default data from Mergent’s record of
defaults, a record that captures default regardless of whether a financial guarantor stepped in to
cover bond payments. We fit 4 different models, each with a different set of control variables.
Column 1 has no controls; column 2 controls for the initial underlying credit rating; column 3
controls for the initial rating interacted with bond type; column 4 uses the set of controls in
column 3 as well as dummy variables for the periods that the bond was outstanding. All
specifications report standard errors adjusted to account for issue-level clustering. Across the
board, the pattern is reasonably clear. The background rate of default among municipal bonds is
extremely low – the constant estimate is 0.000514. And there does not appear to be any
statistically significant difference in the default performance experience between insured and
uninsured issues.
5. Conclusion
This paper compares the performance of insured and uninsured municipal bonds by
looking at changes in the bonds’ underlying credit quality. We focus on transitions in the
Standard and Poor’s ratings of the underlying municipal issuers. The results suggest that insured
bonds have had substantially better underlying rating transition performance than uninsured
bonds. In other words, the pure security selection ability of the financial guarantors appears to
14

have been positive. We estimate that the financial guarantors’ outperformance on their portfolio
of insured municipal issues has amounted industry-wide to a value of about $5 Billion since
December 2007.
The financial guarantors operated at high levels of leverage, poor levels of disclosure,
and collectively made an astonishing and ill-starred departure into guaranteeing structured
products based on residential mortgages – a departure that has now sunk or is sinking most of the
industry. They appear to have rightly earned a leading place among the magnets for blame for
the current credit crisis. In this paper, however, we find some evidence that in at least one
activity they seem to have beat the dartboard test (and the rating agencies as well) – they appear
to have had positive security selection ability in their choice of which municipal securities to
insure.
The future of the financial guarantee industry is cloudy at best. But with all of the
criticism of the rating agencies for their lack of ‘skin in the game’, it is interesting to find that the
financial guarantors – who if anything had excessive levels of skin in the game – appear to have
outperformed the rating agencies in evaluating municipal debt at issuance.
15

References
Adelino, Manuel, 2009, ‘Do investors rely only on ratings? The case of mortgage-backed securities,’ working paper, MIT Sloan School of Management.
Ashcraft, Adam, Paul Goldsmith-Pinkham, and James Vickery, 2010, ‘MBS ratings and the mortgage credit boom,’ working paper, Federal Reserve Bank of New York.
Becker, Bo, and Todd Milbourn, 2010, ‘How did increased competition affect credit ratings?’ working paper, Harvard Business School.
Bolton, Patrick, Xavier Freixas, and Joel Shapiro, 2010, ‘The credit ratings game,’ working paper, Columbia Business School.
Bongaerts, Dion, K.J. Martijn Cremers, and William N. Goetzmann, 2009, ‘Multiple ratings and credit spreads,’ working paper, University of Amsterdam.
Cantor, Richard, Owain ap Gwilym, and Stephen Thomas, 2007, ‘The use of credit ratings in investment management in the U.S. and Europe,’ Journal of Fixed Income, pp. 13-26.
Cantor, Richard, and Christopher Mann, 2007, ‘Analyzing the tradeoff between ratings accuracy and stability,’ Journal of Fixed Income, pp 60-68.
Cantor, Richard, and Frank Packer, 1995, ‘The credit rating industry,’ Journal of Fixed Income, pp. 10-34.
Cantor, Richard, and Frank Packer, 1997, ‘Differences of opinion and selection bias in the credit rating industry,’ Journal of Banking and Finance 21, pp. 1395- 1417.
Covitz, Daniel M. and Paul Harrison, 2003, ‘Testing conflicts of interest at bond ratings agencies with market anticipation: Evidence that reputation incentives dominate,’ working paper, Federal Reserve Board.
Dranove, David and Ginger Zhe Jin, 2010, ‘Quality disclosure and certification: Theory and practice,’ Journal of Economic Literature, forthcoming.
Griffin, John M. and Dragon Yongjun Tang, 2009, ‘Did subjectivity play a role in CDO credit ratings?’ working paper, University of Texas at Austin.
Jafry, Yusuf, and Til Schuermann, 2004, ‘Measurement, estimation, and comparison of credit migration matrices,’ Journal of Banking and Finance.
Mariano, Beatriz, 2008, ‘Do reputational concerns lead to reliable ratings?’ working paper, University Carlos III of Madrid.
Moon, C. G. and J. G. Stotsky, 1993, ‘Testing the differences between the determinants of Moody’s and Standard & Poor’s ratings,’ Journal of Applied Econometrics 8, pp. 51-69.
Nanda, Vikram and Rajdeep Singh, 2004, ‘Bond insurance: What is special about munis?’ Journal of Finance 59:5, pp. 2253-2279.
16

Neale, Faith R. and Pamela Peterson Drake, 2009, ‘Financial guarantee insurance: Arrogance or ignorance in an era of exuberance,’ working paper, University of North Carolina at Charlotte.
Pottier, Steven W. and David W. Sommer, 1999, ‘Property-liability insurer financial strength ratings: Differences across rating agencies,’ Journal of Risk and Insurance 66:4, pp. 621-642.
Richard, Christine, 2010, Confidence game: How a hedge fund manager called Wall Street’s bluff, John Wiley and Sons, Hoboken.
Sylla, Richard, 2001, ‘A historical primer on the business of credit ratings,’ chapter in Reinhart et al.
White, Lawrence J., 2001, ‘The credit rating industry – an industrial organization analysis,’ chapter in Reinhart et al.
17

Table 1. Total and Insured Municipal Debt ($Billions), by State and Insurer.
State Total Insured Ambac MBIA FGIC FSA Radian Assured Other XL BHAC* OtherCalifornia 541.60 239.23 42.83 90.68 35.84 51.65 1.28 10.09 6.89 5.20 0.23 1.46New York 339.63 110.50 19.11 38.78 16.84 26.16 0.74 3.87 5.01 2.98 0.37 1.66Texas 293.39 91.71 17.87 28.94 10.64 19.90 2.25 8.56 3.56 2.11 0.46 0.99Florida 173.89 92.99 18.71 34.62 12.16 17.93 0.58 5.76 3.23 2.07 0.41 0.75Illinois 157.38 88.76 13.49 31.45 13.71 23.18 0.42 3.44 3.08 2.10 0.17 0.81Pennsylvan 139.43 66.79 9.48 16.40 9.29 21.85 1.11 5.15 3.50 2.06 0.25 1.19New Jersey 124.05 66.45 11.72 24.71 7.50 17.73 0.31 2.71 1.78 1.25 0.00 0.53Ohio 102.23 33.06 5.81 10.75 4.97 8.16 0.35 1.96 1.07 0.72 0.00 0.35Massachuse 94.64 33.83 7.53 10.21 3.68 9.54 0.36 1.12 1.40 0.94 0.00 0.46Puerto Rico 85.95 25.93 5.66 9.04 4.37 4.60 0.00 0.97 1.29 0.48 0.00 0.81Other 1376.72 512.47 90.32 175.20 66.15 125.14 4.90 26.18 24.56 15.87 2.47 6.22Total 3428.91 1361.72 242.53 470.78 185.15 325.84 12.30 69.81 55.37 35.78 4.36 15.23
Source: Bloomberg, accessed September 2010. Totals for states include issuance at state level and by jurisdictions within each state.* Berkshire Hathaway Assurance Corp.
18

Table 2. Obligations insured by financial guaranty industry, December 2006.
463,564200,426
Utility revenue 202,48195,337
109,86267,87138,337
Student loan 27,697International 84,643Other 57,564
$1,347,783Structured Finance (principal insured)
$154,889379,828
46,646154,673
49,609Other - US 27,584
10,505823,735
Total Par $2,171,518$3,259,189
Source: AFGI 2006 Annual Report.
Net Financial Guarantees in Force (Principal and Interest)
Source: AFGI 2006 Annual Report. See www.afgi.org/fin-annualrept06.html
Other asset-backed - USMortgage-backed - InternationalOther asset-backed - InternationalInvestor-owned utility obligations
Other - InternationalTotal Structured Finance
Mortgage-backed - US
(amounts in millions)Public Finance (principal insured)
General ObligationTax-backed revenue
Health care revenueTransportation revenueUniversity revenueHousing revenue
Total Public Finance
19

Table 3. Characteristics of municipal bond sample.
Group CountAverage
size ($M)Average maturity
Average yield
Average spread* GO bond
Revenue bond New bond
Insured bond
Bond has SPUR**
All bonds 2694906 2.769 9.920 4.288 0.384 0.433 0.203 0.637 0.461 0.368
Insured 1242291 2.155 9.900 4.215 0.248 0.465 0.219 0.614 1.000 0.361Uninsured 1452615 3.294 9.940 4.359 0.520 0.406 0.189 0.657 0.000 0.375
Have S&P underlying rating 992814 3.662 10.100 4.139 0.349 0.425 0.210 0.644 0.452 1.000Have S&P bond rating 993628 3.663 10.100 4.139 0.348 0.425 0.210 0.644 0.452 0.999
AAA underlying 149415 4.024 11.050 4.202 0.293 0.538 0.149 0.645 0.011 1.000AAA underlying + insured 1675 5.737 11.810 4.069 0.167 0.587 0.176 0.639 1.000 1.000AAA underlying, uninsured 147740 4.005 11.040 4.204 0.295 0.537 0.148 0.645 0.000 1.000AAA bonds 593179 3.189 10.370 4.052 0.267 0.450 0.209 0.633 0.733 0.999
AA underlying 412890 4.093 9.780 4.044 0.321 0.447 0.201 0.649 0.355 1.000AA underlying, insured 146767 3.679 10.240 3.970 0.225 0.435 0.203 0.627 1.000 1.000AA underlying, uninsured 266123 4.321 9.530 4.090 0.381 0.454 0.199 0.661 0.000 1.000AA bonds 270865 4.267 9.560 4.097 0.383 0.451 0.198 0.661 0.028 1.000
A underlying 358340 3.161 9.990 4.153 0.360 0.365 0.246 0.635 0.713 1.000A underlying, insured 255358 2.482 10.120 4.017 0.273 0.401 0.251 0.628 1.000 1.000A underlying, uninsured 102982 4.846 9.690 4.546 0.626 0.275 0.235 0.654 0.000 1.000A bonds 101246 4.654 9.780 4.580 0.635 0.264 0.240 0.660 0.041 0.996
BBB underlying 71452 2.884 10.460 4.467 0.555 0.362 0.210 0.659 0.621 1.000BBB underlying, insured 44364 1.971 10.470 4.171 0.334 0.465 0.189 0.671 1.000 1.000BBB underlying, uninsured 27088 4.379 10.430 5.010 0.973 0.193 0.245 0.639 0.000 1.000BBB bonds 27761 4.141 10.700 5.002 0.955 0.213 0.238 0.651 0.075 0.998
* spread calculated against Bloomberg-reported fair-value AAA curve for matching maturity in month of bond issuance** includes imputed SPURs; for observations with no bond insurance and with a S&P rating for the instrument, we assume that the SPUR is equal to the S&P rating for the instrument.
Sample starts with Mergent municipal bond database, which provides data on bond size, maturity, yield, security (general obligation, revenue, etc), insurance status and insurer. Rating data for the bond and underlying issuer come from S&P. For uninsured bonds for which S&P reports only the instrument credit ratings, we impute an underlying rating equal to the instrument rating.
20

Table 4. Monthly probability of upgrade and downgrade of underlying credit rating by insured status, 1990-2010.
Sample: All bonds All bonds Uninsured InsuredCount 63014771 34838735 28176036 19663141Upgrade % 0.628 0.443 0.857 0.866No change % 98.310 98.534 98.033 98.174Downgrade % 1.062 1.023 1.110 0.960Upgrades/Changes 0.372 0.302 0.436 0.474
Coefficients and t-statistics from regression of upgrade (-1) no change (0) downgrade (+1) indicator variable on insurance status Model 1: no covariates coef: 0.0033 -0.0033 -0.0050
t-stat: 29.4504 -29.4504 -42.7711
Model 2: Month dummy variables coef: 0.0042 -0.0042 -0.0035t-stat: 49.6596 -49.6596 -36.8953
Model 3: Month X bond type (GO, etc) dummy variables coef: 0.0035 -0.0035 -0.0029t-stat: 42.2074 -42.2074 -31.0775
* Troubled financial guarantors all guarantors except BHAC, Assured Guaranty, and FSA.
Insured - troubled insurers*
Sample includes monthly observations of all bonds that have S&P underlying ratings, including imputed underlying ratings for uninsured bonds. Table shows the count of monthly observations, as well as the monthly probability of upgrade and downgrade and the ratio of upgrades to downgrades. The bottom half of the table shows coefficients from regressions of an upgrade (-1)/no change(0)/downgrade (+1) categorical variable on dummy variables for insurance status. Model 1 includes no covariates; model 2 includes dummy variables by month; model 3 includes dummy variables by month interacted with a full set of controls for bond type (revenue, general obligation, limited general obligation, etc.) Reported t-statistics adjusted for issue-level clustering. Insured bonds include all bonds insured by financial guarantors; the troubled insurers include all insurers except for Assured Guaranty, FSA, and BHAC. Sample excludes bonds identified by Mergent as having been insured in the secondary insurance market.
21
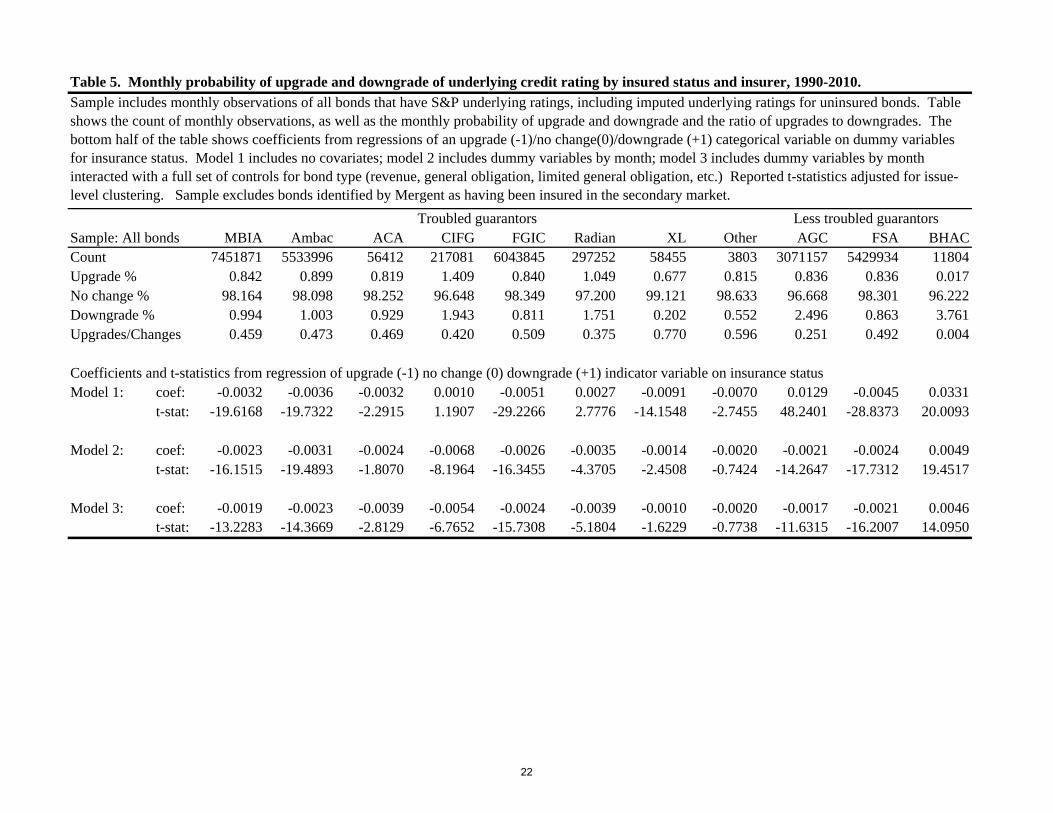
Table 5. Monthly probability of upgrade and downgrade of underlying credit rating by insured status and insurer, 1990-2010.
Sample: All bonds MBIA Ambac ACA CIFG FGIC Radian XL Other AGC FSA BHACCount 7451871 5533996 56412 217081 6043845 297252 58455 3803 3071157 5429934 11804Upgrade % 0.842 0.899 0.819 1.409 0.840 1.049 0.677 0.815 0.836 0.836 0.017No change % 98.164 98.098 98.252 96.648 98.349 97.200 99.121 98.633 96.668 98.301 96.222Downgrade % 0.994 1.003 0.929 1.943 0.811 1.751 0.202 0.552 2.496 0.863 3.761Upgrades/Changes 0.459 0.473 0.469 0.420 0.509 0.375 0.770 0.596 0.251 0.492 0.004
Coefficients and t-statistics from regression of upgrade (-1) no change (0) downgrade (+1) indicator variable on insurance status Model 1: coef: -0.0032 -0.0036 -0.0032 0.0010 -0.0051 0.0027 -0.0091 -0.0070 0.0129 -0.0045 0.0331
t-stat: -19.6168 -19.7322 -2.2915 1.1907 -29.2266 2.7776 -14.1548 -2.7455 48.2401 -28.8373 20.0093
Model 2: coef: -0.0023 -0.0031 -0.0024 -0.0068 -0.0026 -0.0035 -0.0014 -0.0020 -0.0021 -0.0024 0.0049t-stat: -16.1515 -19.4893 -1.8070 -8.1964 -16.3455 -4.3705 -2.4508 -0.7424 -14.2647 -17.7312 19.4517
Model 3: coef: -0.0019 -0.0023 -0.0039 -0.0054 -0.0024 -0.0039 -0.0010 -0.0020 -0.0017 -0.0021 0.0046t-stat: -13.2283 -14.3669 -2.8129 -6.7652 -15.7308 -5.1804 -1.6229 -0.7738 -11.6315 -16.2007 14.0950
Troubled guarantors Less troubled guarantors
Sample includes monthly observations of all bonds that have S&P underlying ratings, including imputed underlying ratings for uninsured bonds. Table shows the count of monthly observations, as well as the monthly probability of upgrade and downgrade and the ratio of upgrades to downgrades. The bottom half of the table shows coefficients from regressions of an upgrade (-1)/no change(0)/downgrade (+1) categorical variable on dummy variables for insurance status. Model 1 includes no covariates; model 2 includes dummy variables by month; model 3 includes dummy variables by month interacted with a full set of controls for bond type (revenue, general obligation, limited general obligation, etc.) Reported t-statistics adjusted for issue-level clustering. Sample excludes bonds identified by Mergent as having been insured in the secondary market.
22

Sample: AA-rated bonds All bonds Uninsured InsuredCount 26697502 16040217 10657285 7377908Upgrade % 0.657 0.580 0.773 0.784No change % 98.158 98.345 97.876 97.985Downgrade % 1.184 1.074 1.350 1.231Upgrades/Changes 0.357 0.351 0.364 0.389
Coefficients and t-statistics from regression of upgrade (-1) no change (0) downgrade (+1) indicator variable on insurance status Model 1: no covariates coef: -0.0008 0.0008 -0.0011
t-stat: -4.4194 4.4194 -5.5278
Model 2: Month dummy variables coef: 0.0017 -0.0017 -0.0018t-stat: 12.6026 -12.6026 -11.9830
Model 3: Month X bond type (GO, etc) dummy variables coef: 0.0011 -0.0011 -0.0012t-stat: 8.4347 -8.4347 -8.1578
Sample includes monthly observations of all bonds that have AA+, AA, or AA- S&P underlying ratings, including those with imputed underlying ratings for uninsured bonds. Table shows the count of monthly observations, as well as the monthly probability of upgrade and downgrade and the ratio of upgrades to downgrades. The bottom half of the table shows coefficients from regressions of an upgrade (-1)/no change(0)/downgrade (+1) categorical variable on dummy variables for insurance status. Model 1 includes no covariates; model 2 includes dummy variables by month; model 3 includes dummy variables by month interacted with a full set of controls for bond type (revenue, general obligation, limited general obligation, etc.) Reported t-statistics adjusted for issue-level clustering. Sample excludes bonds identified by Mergent as having been insured in the secondary market.
Insured - troubled insurers*
Table 6. Monthly probability of upgrade and downgrade of underlying credit rating by insured status, AA-rated underlying issuers, 1990-2010.
23

Sample: A-rated bonds All bonds Uninsured InsuredCount 20674386 6104245 14570141 10183394Upgrade % 0.830 0.767 0.857 0.871No change % 98.186 98.148 98.202 98.375Downgrade % 0.984 1.084 0.942 0.754Upgrades/Changes 0.458 0.414 0.476 0.536
Coefficients and t-statistics from regression of upgrade (-1) no change (0) downgrade (+1) indicator variable on insurance status Model 1: no covariates coef: 0.0023 -0.0023 -0.0053
t-stat: 10.0019 -10.0019 -24.8824
Model 2: Month dummy variables coef: 0.0020 -0.0020 -0.0012t-stat: 11.4549 -11.4549 -7.7742
Model 3: Month X bond type (GO, etc) dummy variables coef: 0.0015 -0.0015 -0.0011t-stat: 8.5011 -8.5011 -7.3218
Table 7. Monthly probability of upgrade and downgrade of underlying credit rating by insured status, A-rated underlying issuers, 1990-2010. Sample includes monthly observations of all bonds that have A+, A, or A- S&P underlying ratings, including those with imputed underlying ratings for uninsured bonds. Table shows the count of monthly observations, as well as the monthly probability of upgrade and downgrade and the ratio of upgrades to downgrades. The bottom half of the table shows coefficients from regressions of an upgrade (-1)/no change(0)/downgrade (+1) categorical variable on dummy variables for insurance status. Model 1 includes no covariates; model 2 includes dummy variables by month; model 3 includes dummy variables by month interacted with a full set of controls for bond type (revenue, general obligation, limited general obligation, etc.) Reported t-statistics adjusted for issue-level clustering. Sample excludes bonds identified by Mergent has having been insured in the secondary market.
Insured - troubled insurers*
24
Sample: BBB-rated bonds All bonds Uninsured InsuredCount 4050031 1677244 2372787 1725686Upgrade % 1.133 0.781 1.381 1.306No change % 98.004 98.297 97.796 97.934Downgrade % 0.864 0.922 0.822 0.761Upgrades/Changes 0.567 0.459 0.627 0.632
Coefficients and t-statistics from regression of upgrade (-1) no change (0) downgrade (+1) indicator variable on insurance status Model 1: no covariates coef: 0.0070 -0.0070 -0.0048
t-stat: 14.2121 -14.2121 -9.3416
Model 2: Month dummy variables coef: 0.0047 -0.0047 -0.0025t-stat: 11.3888 -11.3888 -5.7436
Model 3: Month X bond type (GO, etc) dummy variables coef: 0.0020 -0.0020 -0.0012t-stat: 5.2214 -5.2214 -2.9236
Table 8. Monthly probability of upgrade and downgrade of underlying credit rating by insured status, BBB-rated underlying issuers, 1990-2010. Sample includes monthly observations of all bonds that have BBB+, BBB, or BBB- S&P underlying ratings, including those with imputed underlying ratings for uninsured bonds. Table shows the count of monthly observations, as well as the monthly probability of upgrade and downgrade and the ratio of upgrades to downgrades. The bottom half of the table shows coefficients from regressions of an upgrade (-1)/no change(0)/downgrade (+1) categorical variable on dummy variables for insurance status. Model 1 includes no covariates; model 2 includes dummy variables by month; model 3 includes dummy variables by month interacted with a full set of controls for bond type (revenue, general obligation, limited general obligation, etc.) Reported t-statistics adjusted for issue-level clustering. Sample excludes bonds identified by Mergent as having been insured in the secondary market.
Insured - troubled insurers*
25

Table 9. Bond lifetime probability of upgrade and downgrade by insured status and credit rating, 1990-2010.
Sample: All bonds All bonds Uninsured InsuredCount 990492 538344 452148 287266Upgrade % 28.036 18.346 39.574 43.360No change % 65.953 75.054 55.117 50.719Downgrade % 6.010 6.600 5.309 5.922Upgrades/Changes 0.823 0.735 0.882 0.880
Coefficients and t-statistics from regression of upgrade (-1) no change (0) downgrade (+1) indicator variable on insurance status Model 1: no covariates coef: 0.225 -0.225 -0.217
t-stat: 58.050 -58.050 -47.110
Model 2: Dummy variables for each year outstanding coef: 0.168 -0.168 -0.141t-stat: 43.810 -43.810 -30.670
coef: 0.147 -0.147 -0.123t-stat: 38.580 -38.580 -27.140
* Troubled financial guarantors all guarantors except BHAC, Assured Guaranty, and FSA.
Sample includes one observation per bond, for all bonds that have S&P underlying ratings, including imputed underlying ratings for uninsured bonds. Table shows the count, as well as the lifetime probability of upgrade and downgrade and the ratio of upgrades to downgrades. The bottom half of the table shows coefficients from regressions of an upgrade (-1)/no change(0)/downgrade (+1) categorical variable on dummy variables for insurance status. Model 1 includes no covariates; model 2 includes dummy variables for each year the bond was outstanding; model 3 includes dummy variables for each period the bond was outstanding as well as a full set of controls for bond type (revenue, general obligation, limited general obligation, etc.) Reported t-statistics adjusted for issue-level clustering. Insured bonds include all bonds insured by financial guarantors; the troubled insurers include all insurers except for Assured Guaranty, FSA, and BHAC. Sample excludes bonds identified by Mergent as having been insured in the secondary market.
Insured - troubled insurers *
Model 3: Dummy variables for each year outstanding + dummy variables for bond type
26

Sample: General Obligation bonds All bonds Uninsured InsuredCount 15130481 15130481 11671310 7580847Upgrade % 0.601 0.421 0.835 0.858No change % 98.311 98.535 98.020 98.180Downgrade % 1.088 1.044 1.145 0.962Upgrades/Changes 0.356 0.287 0.422 0.471
Coefficients and t-statistics from regression of upgrade (-1) no change (0) downgrade (+1) indicator variable on insurance status Model 1: no covariates coef: 0.0031 -0.0031 -0.0053
t-stat: 18.4572 -18.4572 -30.0766
Model 2: Month dummy variables coef: 0.0044 -0.0044 -0.0040t-stat: 33.9460 -33.9460 -26.7705
* Troubled financial guarantors all guarantors except BHAC, Assured Guaranty, and FSA.
Sample includes monthly observations of all bonds that have S&P underlying ratings, including imputed underlying ratings for uninsured bonds. Table shows the count of monthly observations, as well as the monthly probability of upgrade and downgrade and the ratio of upgrades to downgrades. The bottom half of the table shows coefficients from regressions of an upgrade (-1)/no change(0)/downgrade (+1) categorical variable on dummy variables for insurance status. Model 1 includes no covariates; model 2 includes dummy variables by month; model 3 includes dummy variables by month interacted with a full set of controls for bond type (revenue, general obligation, limited general obligation, etc.) Reported t-statistics adjusted for issue-level clustering. Insured bonds include all bonds insured by financial guarantors; the troubled insurers include all insurers except for Assured Guaranty, FSA, and BHAC. Sample excludes bonds identified by Mergent as having been insured in the secondary market.
Insured - troubled insurers*
Table 10. Monthly probability of upgrade and downgrade of underlying credit rating by insured status, 1990-2010. General Obligation bonds only.
27

Table 11. Economic magnitude of insured portfolio outperformance, December 2007 through September 2010.
PDF CDF PDF CDF PDF CDFRating (1) (2) (3) (4) (5) (6) (7) (8) =8*(8); (9) (3)*(9); (10) (4)*(9); (11)AAA 1.63% 1.63% 7.06% 7.06% 3.74% 3.74% 2.51% 0.00% 0.0% 0.00% 0.00%AA+ 4.20% 5.83% 8.87% 15.94% 10.82% 14.56% 2.96% 0.45% 3.6% 0.32% 0.39%AA 16.80% 22.63% 17.78% 33.71% 19.19% 33.75% 2.99% 0.48% 3.8% 0.68% 0.73%AA- 17.66% 40.29% 18.44% 52.15% 19.43% 53.18% 3.01% 0.50% 4.0% 0.74% 0.78%A+ 16.67% 56.96% 13.27% 65.42% 18.49% 71.67% 3.26% 0.75% 6.0% 0.79% 1.10%A 19.37% 76.33% 13.41% 78.82% 15.43% 87.10% 3.50% 0.99% 7.9% 1.06% 1.22%A- 9.10% 85.42% 10.83% 89.66% 8.14% 95.24% 3.75% 1.24% 9.9% 1.07% 0.81%BBB+ 3.87% 89.29% 5.46% 95.11% 2.47% 97.71% 3.99% 1.48% 11.9% 0.65% 0.29%BBB 2.96% 92.25% 2.47% 97.58% 1.26% 98.97% 4.24% 1.73% 13.8% 0.34% 0.17%BBB- 1.56% 93.81% 1.64% 99.22% 0.55% 99.52% 4.76% 2.25% 18.0% 0.30% 0.10%BB+ 0.02% 93.83% 0.23% 99.46% 0.16% 99.68% 5.29% 2.78% 22.2% 0.05% 0.04%BB 0.11% 93.94% 0.27% 99.73% 0.17% 99.85% 5.81% 3.30% 26.4% 0.07% 0.04%BB- 0.02% 93.96% 0.09% 99.82% 0.01% 99.86% 6.33% 3.82% 30.6% 0.03% 0.00%B+ 0.00% 93.96% 0.02% 99.84% 0.00% 99.86% 6.86% 4.35% 34.8% 0.01% 0.00%B 0.09% 94.06% 0.06% 99.90% 0.06% 99.93% 7.38% 4.87% 39.0% 0.02% 0.02%B- 0.02% 94.08% 0.01% 99.91% 0.02% 99.95% 7.91% 5.40% 43.2% 0.00% 0.01%CCC 0.00% 94.08% 0.06% 99.97% 0.00% 99.95% 8.43% 5.92% 47.4% 0.03% 0.00%CC 0.00% 94.08% 0.01% 99.98% 0.00% 99.95% 8.95% 6.44% 51.5% 0.00% 0.00%C 0.01% 94.09% 0.01% 99.98% 0.04% 99.99% 9.48% 6.97% 55.7% 0.00% 0.02%D 0.00% 94.09% 0.02% 100.00% 0.01% 100.00% 10.00% 7.49% 59.9% 0.01% 0.00%NR 5.91% 100.00% 0.00% 100.00% 0.00% 100.00%Sum Estimated difference = 0.43% 6.18% 5.74%
Insured transition
matrix
Contribution to loss
Dec. 2007 underlying distribution (insured)
Estimated on uninsured bonds
Table presents calculations behind estimated economic magnitude of the insured portfolio outperformance between December 2007 and September 2010. Starting point (columns (1) and (2) is the December 2007 underlying rating distribtion for the uninsured bonds in our sample. Sample excludes bonds identified by Mergent as having been insured in the secondary market. Columns (3) and (4) apply the underlying rating transition matrix estimated on uninsured bonds to column (1); Columns (5) and (6) apply the underlying transition matrix estimated on insured bonds. Estimated yields by credit rating column (7) are from Bloomberg (at AAA, AA+, AA-, and BBB) and imputed. Value loss versus hypothetical AAA yield is estimated for 8-year duration bond, roughly sample median.
Apply estimated transition matrix September 2010
estimated yield
Spread over AAA yield
Percent loss versus
AAA
Estimated on insured bonds
Uninsured transition
matrix
28

Table 12. Regressions of default on bond insurance dummy
Sample: bonds with SPURs (1) (2) (3) (4)Insured dummy 0.000049 -0.000335 -0.000075 -0.000110
(0.000195) (0.000243) (0.000211) (0.000226)Constant 0.000514*** 0.000686*** 0.000569*** 0.000181
(0.000122) (0.000153) (0.000130) (0.000143)N 1018696 1018696 1018696 1018696r2 0 0.0073 0.0160 0.0167
Controls None Initial SPURInitial SPUR X bond type
Initial SPUR X bond type, dummy variables for period bond was outstanding
Standard errors clustered by Issue Issue Issue Issue
Table shows coefficient estimates from linear probability model regression of bond default dummies on insurance status. Default data from Mergent and reflect default of underlying issuer, regardless of whether guarantor stepped in to make payments to bondholers. Ratings data from S&P, Standard & Poor's underlying rating at time of bond issuance. SPURs direct from S&P; for uninsured bonds with bond rating data but no direct SPUR data we impute SPUR, setting it equal to the instrument's rating. Bond type dummy variables include GO, limited GO, revenue, etc. Standard errors adjusted for clustering at the issue level.
29