Embed Size (px)
Citation preview
Glasgow Theses Service http://theses.gla.ac.uk/
Skuce, Rebecca L. (2015) Bacteria - mineral - nanoparticle interactions in water and wastewater. PhD thesis. http://theses.gla.ac.uk/6153/ Copyright and moral rights for this thesis are retained by the author A copy can be downloaded for personal non-commercial research or study, without prior permission or charge This thesis cannot be reproduced or quoted extensively from without first obtaining permission in writing from the Author The content must not be changed in any way or sold commercially in any format or medium without the formal permission of the Author When referring to this work, full bibliographic details including the author, title, awarding institution and date of the thesis must be given

Bacteria – mineral – nanoparticle
interactions in water and
wastewater
Rebecca L. Skuce
BSc (Hons) University of Glasgow
Submitted in fulfilment of the requirements for the Degree of Doctor of Philosophy
School of Geographical and Earth Sciences
College of Science and Engineering
University of Glasgow
February 2015
© Rebecca L. Skuce, 2015

Dedication
I dedicate this thesis to the loving memory of my Grandfather George Donaldson
Crooke.
Abstract
With a rising demand for nanomaterials and their continual increase in
production, the release of nanoparticles (NPs) into the environment is inevitable
(Petosa et al., 2010). Problematically, NPs can have a wide range of toxic
effects, which are exacerbated by their size (at least one dimension smaller
than 100 nm)(Engineering., 2004). Detrimental effects include brain, intestinal
and respiratory injury, delayed embryonic development, DNA damage which
ultimately lead to increased mortality (Trouiller et al., 2009), (Handy et al.,
2008). Natural and manufactured NPs also have the ability to bind and transport
chemical pollutants, thus enhancing their toxicity (Moore, 2006).
While an array of techniques are available for in situ remediation of
numerous groundwater contaminants, there are currently none for in situ
remediation of nanoparticles. This fundamental technology gap means we are
poorly prepared to deal with nanoparticle pollution events. The aim of this PhD
was to develop mechanisms to immobilise and remove nanoparticles from water
and waste water in order to prevent the transport of nanoparticles to sites
where they have the potential to cause harm.
Experiments conducted demonstrate the potential of microbially
mediated mineral formation to immobilise nanoparticles from water. The
ureolytic bacteria Sporosarcina pasteurii was used to induce calcium carbonate
precipitation in batch and column experiments. Nanoparticle immobilisation was
tested as a function of nanoparticle size and surface charge. The results
demonstrate the successful immobilisation of negatively charged nanoparticles
(both large and small, 150 and 35 nm respectively), while failing to remove
positively charged nanoparticles from solution. In order to capture positively
charged nanoparticles a second mineral, struvite, was tested. The precipitation
of struvite successfully immobilised positively charged nanoparticles. However,
in comparison to the calcite precipitation experiments the removal of positively
charged nanoparticles was found to be pH and ionic strength dependant. Finally,
the ability of Bacillus subtilis, a common groundwater bacterium and
wastewater treatment biofilm to adsorb and remove nanoparticles from solution
was examined. Here both biosorbent materials were highly efficient at removing
positively charged nanoparticles from solution whilst negatively charged
nanoparticles remained in suspension.

4
The research presented here demonstrates that microbially induced
mineral precipitation may be used as a tool to immobilise nanoparticles from
contaminated groundwater. In addition, bacteria and wastewater treatment
biofilm were found to be highly efficient biosorbents of positively charged
nanoparticles. These findings hold implications for the fate and transport of
nanoparticles through environmental systems and wastewater treatment plants.
5
Table of Contents
List of tables ................................................................................ 8
List of Figures ............................................................................... 9
Acknowledgement ......................................................................... 11
Author’s declaration ...................................................................... 12
List of parameters ......................................................................... 13
Acronyms ................................................................................... 15
1 Introduction ........................................................................... 16
1.1 Nanoparticles .................................................................... 16
1.1.1 Natural and anthropogenic nanoparticle toxicity ...................... 17
1.1.2 Manufactured nanoparticles .............................................. 18
1.1.3 Manufactured nanoparticle toxicology .................................. 21
1.1.4 Physiochemical properties of Nanoparticles ............................ 23
1.1.5 Nanoparticles used in remediation ....................................... 27
1.1.6 Environmental exposure to nanoparticles .............................. 28
1.2 Bacteria ........................................................................... 30
1.2.1 Biofilm ........................................................................ 31
1.2.2 Biofilm – nanoparticle interactions ...................................... 31
1.3 Microbially mediated mineral formation ..................................... 32
1.3.1 General microbial mineral formation .................................... 32
1.3.2 Ureolytically-driven calcium carbonate precipitation ................ 33
1.3.3 Ureolytically-driven calcium carbonate precipitation technologies 33
1.4 Research objectives ............................................................. 34
2 Immobilisation of nanoparticles by microbially mediated calcite precipitation ............................................................................... 36
2.1 Summary .......................................................................... 36
2.2 Introduction ...................................................................... 36
2.3 Materials and methods .......................................................... 39
2.3.1 Nanoparticles................................................................ 39
2.3.2 Experimental design ........................................................ 40
2.3.3 Chemical analysis ........................................................... 40
2.3.4 Transmission Electron Microscopy (TEM) ................................ 41
2.3.5 Kinetic analysis and calcite precipitation ............................... 42
2.4 Results ............................................................................ 43
2.4.1 Immobilisation of small negatively charged nanoparticles(s-negNP) 43
2.4.2 Immobilisation of small positively charged nanoparticles (s-posNP) 48
2.4.3 Immobilisation of large negatively charged nanoparticles ........... 49
6
2.5 Mineral analysis by Transmission Electron Microscopy (TEM) ............. 50
2.6 Discussion ......................................................................... 54
2.7 Conclusion ........................................................................ 65
3 Immobilisation of nanoparticles through porous media by calcium carbonate precipitation ............................................................................... 66
3.1 Summary .......................................................................... 66
3.2 Introduction ...................................................................... 66
3.3 Materials and methods .......................................................... 67
3.3.1 and porous media ........................................................... 67
3.3.2 Nanoparticle transport experiments ..................................... 68
3.3.3 Nanoparticle immobilisation experiments .............................. 69
3.4 Results ............................................................................ 70
3.4.1 Nanoparticle transport experiments ..................................... 70
3.5 Discussion ......................................................................... 79
3.6 Conclusion ........................................................................ 86
4 Immobilisation of nanoparticles by bacterially precipitated struvite ........ 88
4.1 Introduction ...................................................................... 88
4.2 Materials and methods .......................................................... 90
4.2.1 Nanoparticles................................................................ 90
4.2.2 Struvite precipitation experiments ...................................... 90
4.2.3 Nanoparticle capture by struvite precipitation ........................ 91
4.2.4 Nanoparticle removal by pre-formed struvite .......................... 92
4.2.5 Chemical analysis ........................................................... 93
4.2.6 Zeta potential analysis ..................................................... 93
4.2.7 Scanning Electron and Raman Microscopy .............................. 93
4.3 Results ............................................................................ 94
4.3.1 Struvite precipitation experiments ...................................... 94
4.3.2 Nanoparticle capture by struvite ......................................... 97
4.3.3 Nanoparticle removal by pre-formed struvite crystals ............... 105
4.3.4 Zeta potential of struvite ................................................ 106
4.4 Discussion ........................................................................ 107
4.5 Conclusion ....................................................................... 117
5 Bacterial biosorption of nanoparticles ........................................... 118
5.1 Summary ......................................................................... 118
5.2 Introduction ..................................................................... 118
5.3 Materials and Methods ......................................................... 120
5.3.1 Nanoparticles............................................................... 120
5.3.2 Bacillus subtilis adsorption experiments ............................... 120
5.3.3 Wastewater biofilm adsorption experiments .......................... 121

7
5.3.4 Chemical analysis .......................................................... 123
5.3.5 Transmission Electron Microscopy (TEM) ............................... 123
5.4 Results ........................................................................... 124
5.4.1 Bacillus subtilis adsorption experiments ............................... 124
5.4.2 Wastewater biofilm sorption experiments ............................. 127
5.4.3 Transmission Electron Microscopy (TEM) ............................... 129
5.4.4 Discussion ................................................................... 132
5.4.5 Conclusion .................................................................. 138
6 Conclusion ............................................................................ 139
6.1 Summary ......................................................................... 139
6.2 Immobilisation of nanoparticles by mineral precipitating systems ..... 139
6.3 Immobilisation of nanoparticles through porous media by calcium carbonate precipitation ............................................................... 142
6.4 Bacterial biosorption of nanoparticles ...................................... 142
6.5 Future work ..................................................................... 143
Appendix A ................................................................................ 146
Appendix B ................................................................................ 147
List of references ......................................................................... 148

8
List of tables
Table 2.1: Characteristics of NPs used in this study. ................................ 39
Table 2.2: Summary of kinetic parameters. ........................................... 55
Table 2.3: Summary of the parameters for used in DLVO equations .............. 58
Table 3.1: Total recovery of NH4+, Ca2+ and NPs as calculated from the area
under the recovery curve. ............................................................... 79
Table 4.1: Summary of tested experimental conditions. ............................ 92
Table 4.2 Summary of the experimental parameters for each Mg2+/PO43- addition
.............................................................................................. 114
Table 5.1: Summary of tested experimental conditions. ........................... 124
9
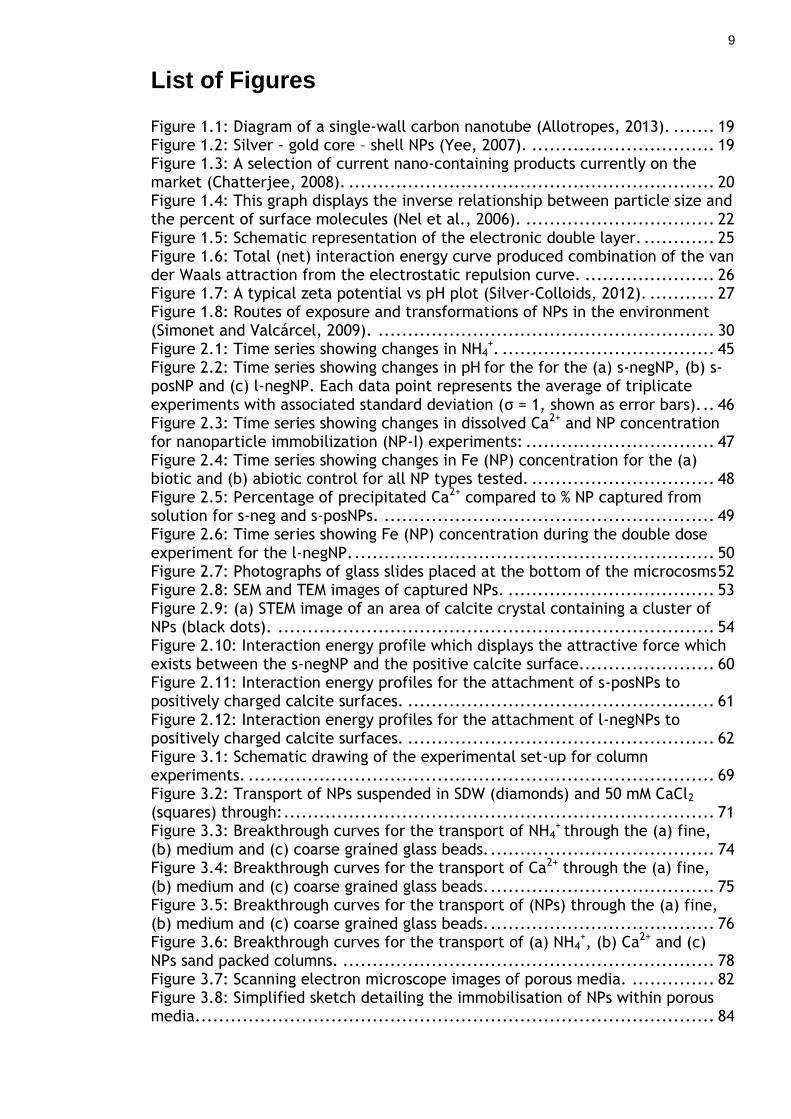
List of Figures
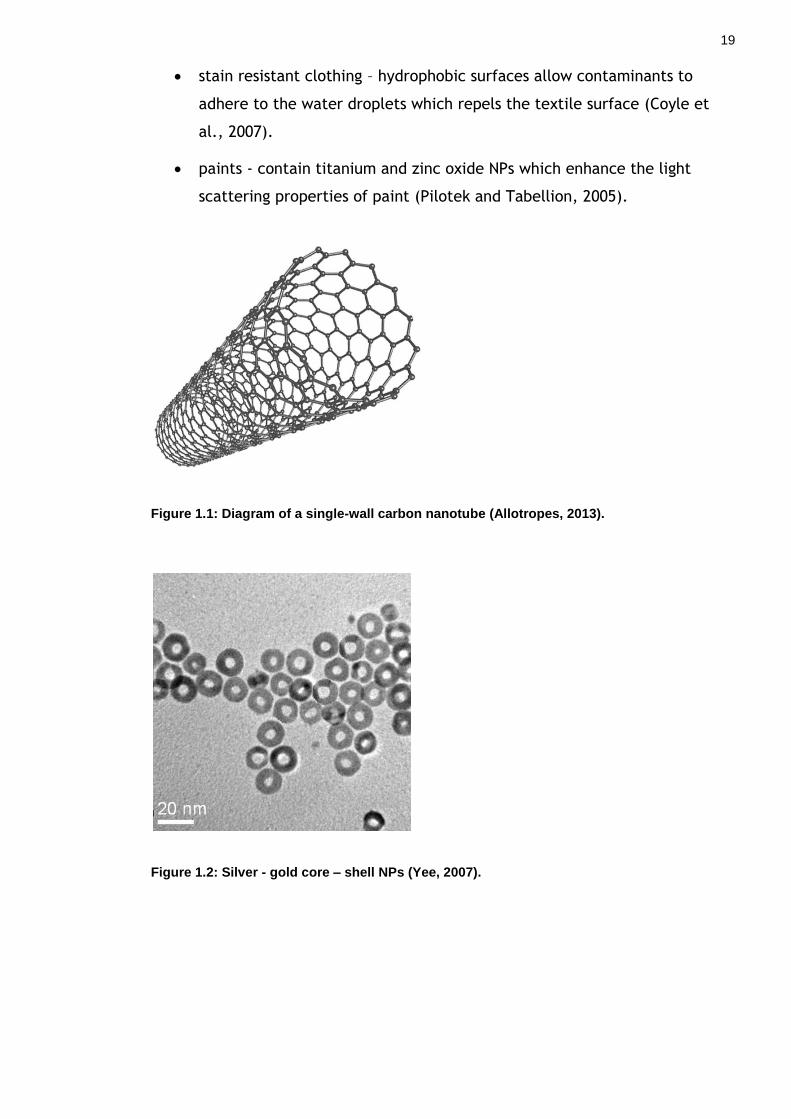
Figure 1.1: Diagram of a single-wall carbon nanotube (Allotropes, 2013). ....... 19
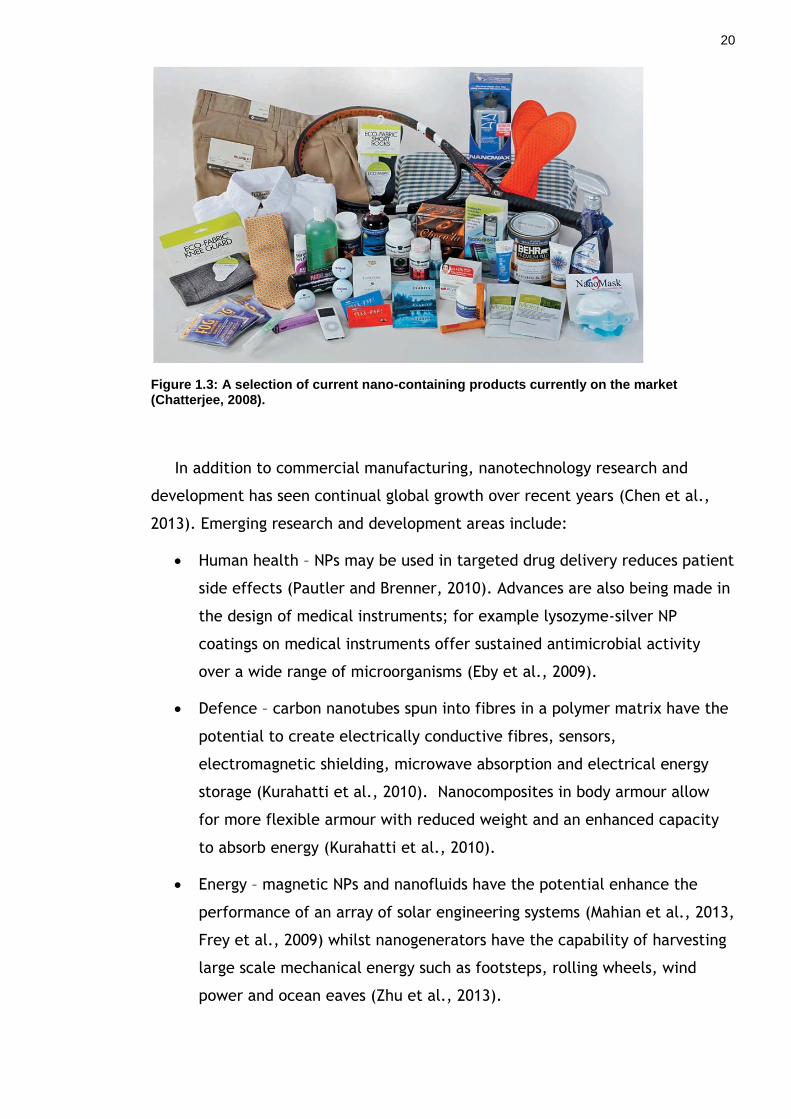
Figure 1.2: Silver - gold core – shell NPs (Yee, 2007). ............................... 19
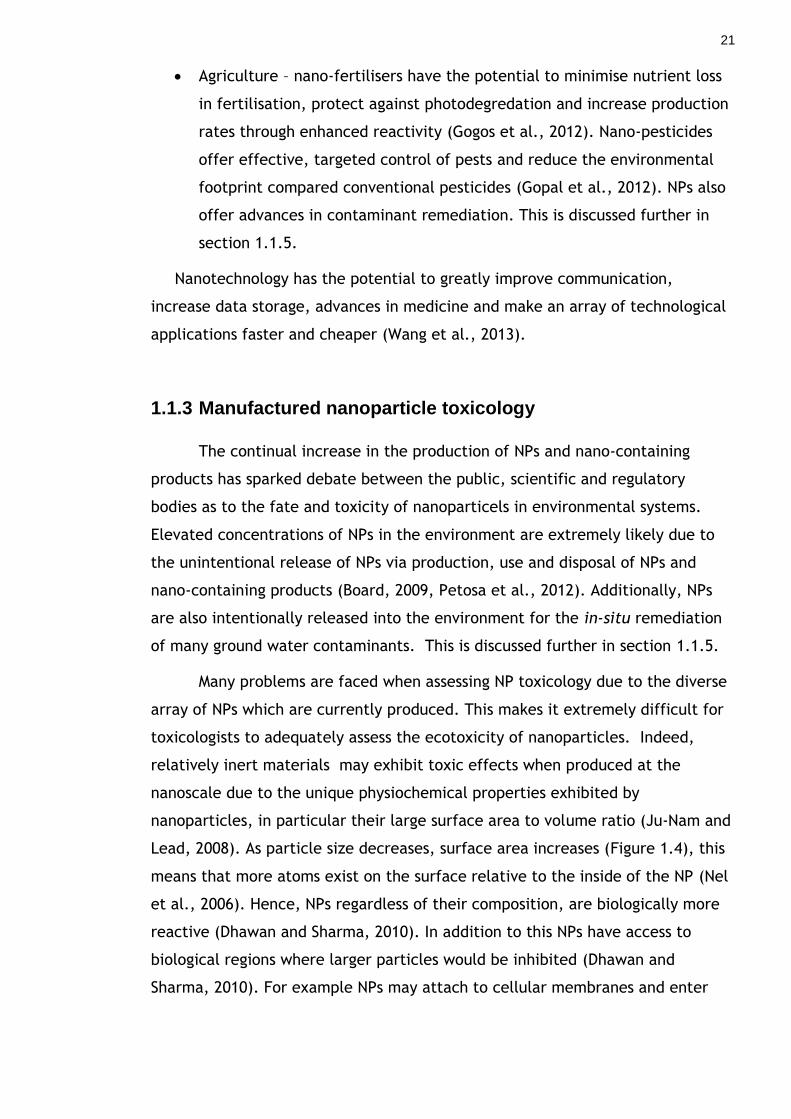
Figure 1.3: A selection of current nano-containing products currently on the market (Chatterjee, 2008). .............................................................. 20
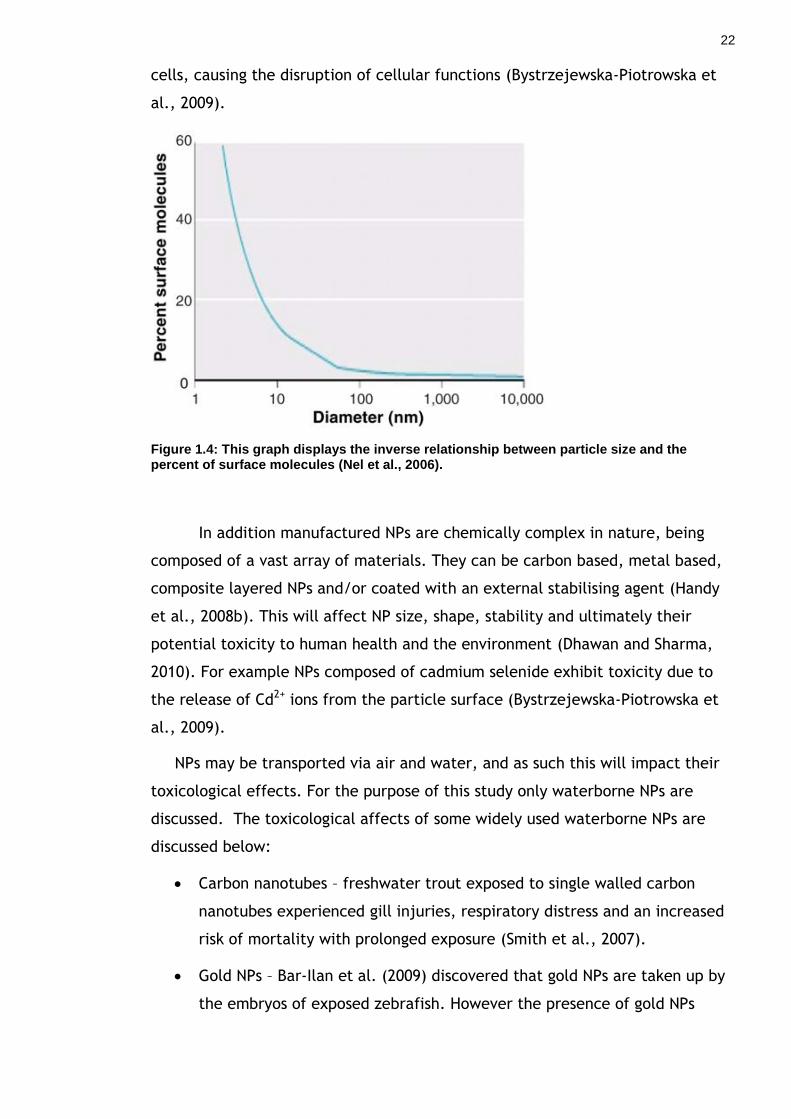
Figure 1.4: This graph displays the inverse relationship between particle size and the percent of surface molecules (Nel et al., 2006). ................................ 22
Figure 1.5: Schematic representation of the electronic double layer. ............ 25
Figure 1.6: Total (net) interaction energy curve produced combination of the van der Waals attraction from the electrostatic repulsion curve. ...................... 26
Figure 1.7: A typical zeta potential vs pH plot (Silver-Colloids, 2012). ........... 27
Figure 1.8: Routes of exposure and transformations of NPs in the environment (Simonet and Valcárcel, 2009). ......................................................... 30
Figure 2.1: Time series showing changes in NH4+. .................................... 45
Figure 2.2: Time series showing changes in pH for the for the (a) s-negNP, (b) s-posNP and (c) l-negNP. Each data point represents the average of triplicate experiments with associated standard deviation (σ = 1, shown as error bars). .. 46
Figure 2.3: Time series showing changes in dissolved Ca2+ and NP concentration for nanoparticle immobilization (NP-I) experiments: ................................ 47
Figure 2.4: Time series showing changes in Fe (NP) concentration for the (a) biotic and (b) abiotic control for all NP types tested. ............................... 48
Figure 2.5: Percentage of precipitated Ca2+ compared to % NP captured from solution for s-neg and s-posNPs. ........................................................ 49
Figure 2.6: Time series showing Fe (NP) concentration during the double dose experiment for the l-negNP. ............................................................. 50
Figure 2.7: Photographs of glass slides placed at the bottom of the microcosms 52
Figure 2.8: SEM and TEM images of captured NPs. ................................... 53
Figure 2.9: (a) STEM image of an area of calcite crystal containing a cluster of NPs (black dots). .......................................................................... 54
Figure 2.10: Interaction energy profile which displays the attractive force which exists between the s-negNP and the positive calcite surface....................... 60
Figure 2.11: Interaction energy profiles for the attachment of s-posNPs to positively charged calcite surfaces. .................................................... 61
Figure 2.12: Interaction energy profiles for the attachment of l-negNPs to positively charged calcite surfaces. .................................................... 62
Figure 3.1: Schematic drawing of the experimental set-up for column experiments. ............................................................................... 69
Figure 3.2: Transport of NPs suspended in SDW (diamonds) and 50 mM CaCl2 (squares) through: ......................................................................... 71
Figure 3.3: Breakthrough curves for the transport of NH4+ through the (a) fine,
(b) medium and (c) coarse grained glass beads. ...................................... 74
Figure 3.4: Breakthrough curves for the transport of Ca2+ through the (a) fine, (b) medium and (c) coarse grained glass beads. ...................................... 75
Figure 3.5: Breakthrough curves for the transport of (NPs) through the (a) fine, (b) medium and (c) coarse grained glass beads. ...................................... 76
Figure 3.6: Breakthrough curves for the transport of (a) NH4+, (b) Ca2+ and (c)
NPs sand packed columns. ............................................................... 78
Figure 3.7: Scanning electron microscope images of porous media. .............. 82
Figure 3.8: Simplified sketch detailing the immobilisation of NPs within porous media. ....................................................................................... 84
10
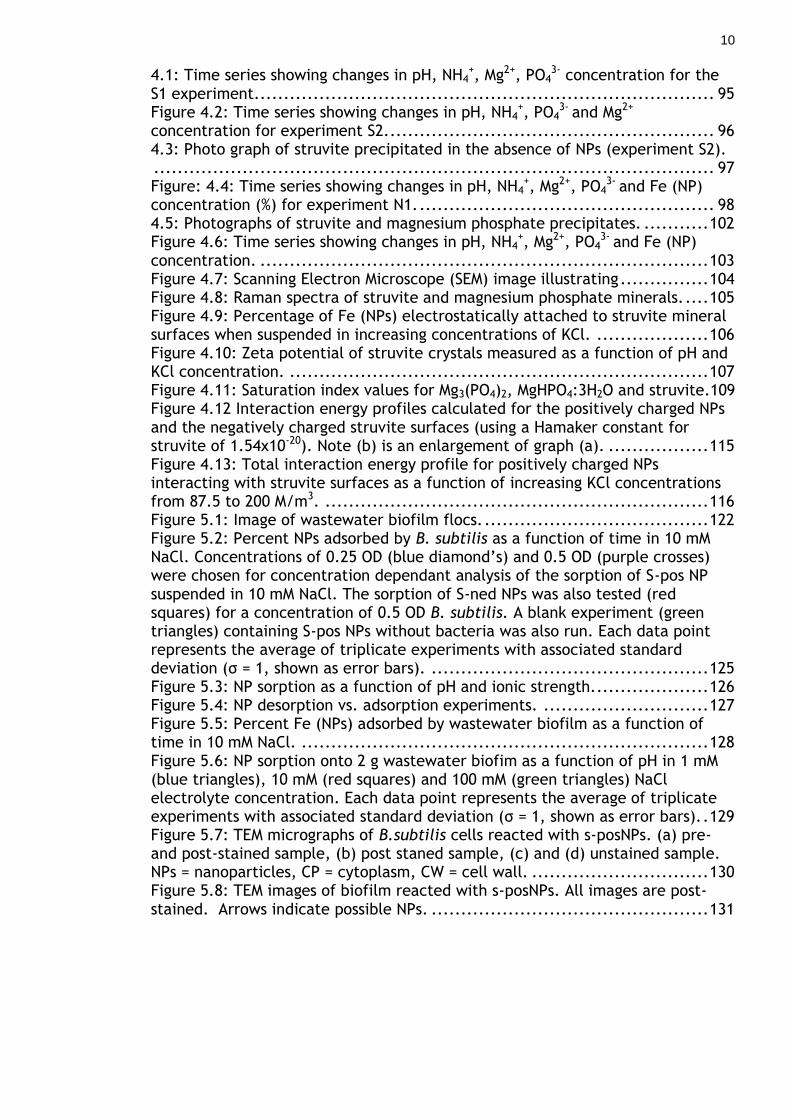
4.1: Time series showing changes in pH, NH4+, Mg2+, PO4
3- concentration for the S1 experiment. ............................................................................. 95
Figure 4.2: Time series showing changes in pH, NH4+, PO4
3- and Mg2+ concentration for experiment S2. ....................................................... 96
4.3: Photo graph of struvite precipitated in the absence of NPs (experiment S2). ............................................................................................... 97
Figure: 4.4: Time series showing changes in pH, NH4+, Mg2+, PO4
3- and Fe (NP) concentration (%) for experiment N1. .................................................. 98
4.5: Photographs of struvite and magnesium phosphate precipitates. ........... 102
Figure 4.6: Time series showing changes in pH, NH4+, Mg2+, PO4
3- and Fe (NP) concentration. ............................................................................ 103
Figure 4.7: Scanning Electron Microscope (SEM) image illustrating ............... 104
Figure 4.8: Raman spectra of struvite and magnesium phosphate minerals. .... 105
Figure 4.9: Percentage of Fe (NPs) electrostatically attached to struvite mineral surfaces when suspended in increasing concentrations of KCl. ................... 106
Figure 4.10: Zeta potential of struvite crystals measured as a function of pH and KCl concentration. ....................................................................... 107
Figure 4.11: Saturation index values for Mg3(PO4)2, MgHPO4:3H2O and struvite.109
Figure 4.12 Interaction energy profiles calculated for the positively charged NPs and the negatively charged struvite surfaces (using a Hamaker constant for struvite of 1.54x10⁻²⁰). Note (b) is an enlargement of graph (a). ................. 115
Figure 4.13: Total interaction energy profile for positively charged NPs interacting with struvite surfaces as a function of increasing KCl concentrations from 87.5 to 200 M/m3. ................................................................. 116
Figure 5.1: Image of wastewater biofilm flocs. ...................................... 122
Figure 5.2: Percent NPs adsorbed by B. subtilis as a function of time in 10 mM NaCl. Concentrations of 0.25 OD (blue diamond’s) and 0.5 OD (purple crosses) were chosen for concentration dependant analysis of the sorption of S-pos NP suspended in 10 mM NaCl. The sorption of S-ned NPs was also tested (red squares) for a concentration of 0.5 OD B. subtilis. A blank experiment (green triangles) containing S-pos NPs without bacteria was also run. Each data point represents the average of triplicate experiments with associated standard deviation (σ = 1, shown as error bars). ............................................... 125
Figure 5.3: NP sorption as a function of pH and ionic strength. ................... 126
Figure 5.4: NP desorption vs. adsorption experiments. ............................ 127
Figure 5.5: Percent Fe (NPs) adsorbed by wastewater biofilm as a function of time in 10 mM NaCl. ..................................................................... 128
Figure 5.6: NP sorption onto 2 g wastewater biofim as a function of pH in 1 mM (blue triangles), 10 mM (red squares) and 100 mM (green triangles) NaCl electrolyte concentration. Each data point represents the average of triplicate experiments with associated standard deviation (σ = 1, shown as error bars). . 129
Figure 5.7: TEM micrographs of B.subtilis cells reacted with s-posNPs. (a) pre- and post-stained sample, (b) post staned sample, (c) and (d) unstained sample. NPs = nanoparticles, CP = cytoplasm, CW = cell wall. .............................. 130
Figure 5.8: TEM images of biofilm reacted with s-posNPs. All images are post-stained. Arrows indicate possible NPs. ............................................... 131

11
Acknowledgement
The completion of this thesis would not have been possible without the
help and support from a number of people to whom I would like to express my
gratitude.
Firstly I would like to thank my supervisors Vernon Phoenix and Martin
Lee. Your enthusiasm and limitless knowledge have been invaluable to me over
the past four years and have made this journey an unforgettable one. I am also
indebted to Dominique Tobler for the many hours spent in the lab, discussing
ideas and planning experiments. You have been essential to the success of this
PhD. Thanks are also due to Ian MacLaren with whom I spent many hours hunting
for nanoparticles in calcite grains with. I could not have completed this work
without the help of many academics, support staff and undergraduate students,
these include (in no particular order): Margret Mullin, Peter Chung, Robert
McDonald, Les Hill, John Gilleece, Margret Jackson, Jacqueline Mckie, Garry
Tate and Holly Clark. I would also like to thank the Biogeo group for their helpful
feedback on my papers and presentations in addition to providing fascinating
discussions on biominerals, biogeochemistry and climate change.
A big thank you to all my office mates, past and present for filling the
past four years with lots of laughs, cups of tea and numerous bottles of wine! A
special thank you goes to Jill, Heather and Eric you guys have been such a
support to me through the many highs and lows over this time. And to Callum for
providing some much needed stress relief on the squash court! Thanks also go to
my home girls – Amy, Lyndsey, Jenny and Lydia who have provided me with
invaluable advice and encouragement over the past 10 or so years. And to
Catriona, thank you for believing that I could do it even when I thought I
couldn’t.
Above all I would like to thank every member of my family (too numerous
to mention individually) for your unconditional love and support. In particular
thank you to my Mum, you have guided me throughout my life and supported me
in every decision (good and bad) that I have made. I could never have realised
my potential without you. Thank you.

12
Author’s declaration
I declare that the material presented in this thesis is the result of my own work
carried out in the School of Geographical and Earth Sciences, University of
Glasgow. This research was supervised by Dr. Vernon Phoenix, Dominique Tobler
and Martin Lee. Any published or unpublished work by other authors has been
given full acknowledgement in the text.
Rebecca Skuce

13
List of parameters
Hamaker constant of nanoparticles
Hamaker constant of calcite
Hamaker constant of water
Combined Hamaker constant
C Molar concentration
CT Dissolved inorganic carbon
CTcalcite Dissolved carbon removed by calcite precipitation
CTinitial Initial dissolved inorganic carbon
CTurea Dissolved carbon produced by ureolysis
Electric charge
Ionic strength
k-1 Debye length
Boltzmann constant
ks First order rate constant
KSO Equilibrium calcite solubility product
kp Calcite precipitation rate constant
n Reaction order
Avogadro’s number
R Bacterial membrane
Nanoparticle radius
S Saturation state
S0 Saturation state at time zero
Scrit Critical saturation state
St Saturation state at time
t Time
Velec Electrostatic energy
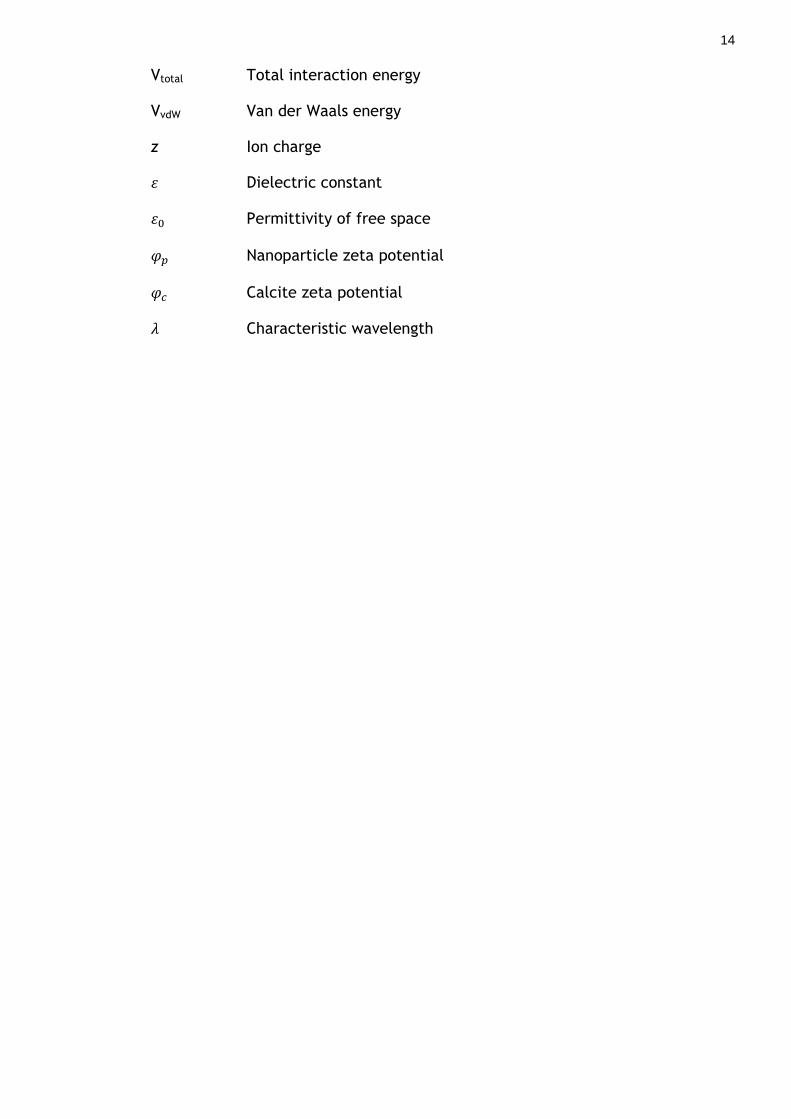
14
Vtotal Total interaction energy
VvdW Van der Waals energy
z Ion charge
Dielectric constant
Permittivity of free space
Nanoparticle zeta potential
Calcite zeta potential
Characteristic wavelength

15
Acronyms
AAS Atomic Adsorption Spectroscopy
Bs1 First Bacillus subtilis adsorption experiment
Bs2 Second Bacillus subtilis adsorption experiment
Bs3 Third Bacillus subtilis adsorption experiment
DLVO Derjaguin-Landau-Verwey-Overbeek (theory)
DLS Dynamic Light Scattering
EELS Electron Energy Loss Spectroscopy
FIB Focuses Ion Beam
l-negNP Large negatively charged nanoparticle
NP Nanoparticle
NP-I Nanoparticle Immobilisation
OD Optical Density
SAED Selected Area Electron Diffraction
SDW Sterile Deionised Water
SEM Scanning Electron Microscopy
s-negNP Small negatively charged nanoparticle
s-posNP Small positively charged nanoparticle
STEM Scanning Transmission Electron Microscopy
TEM Transmission Electron Microscopy
WB1 First wastewater treatment biofilm adsorption experiment
WB2 Second wastewater treatment biofilm adsorption experiment
16
1 Introduction
1.1 Nanoparticles
Nanoparticles (NPs) are defined as particles with at least 2 dimensions less
than 100 nm (Peralta-Videa et al., 2011). NPs can either occur naturally, or they
can be manufactured for specific tasks. Natural NPs have existed on Earth since
the beginning of time, being formed by both geogenic and biogenic mechanisms
(Handy et al., 2008b, Nowack and Bucheli, 2007).
Geologic processes include physiochemical weathering, where by abrasion
and dissolution weather rock fragments which naturally contain particles within
the nano size range (Handy et al., 2008b, Hochella et al., 2008). In addition
mechanical grinding within earthquake fault zones can create ultrafine grained
rock fragments down to 10 to 20 nm in size (Hochella et al., 2008, Wilson et al.,
2005). Furthermore, volcanic processes, including geothermal/hrdrothermal
activity produce a vast array of nanoparticles. For example Esquivel and Murr
(2004) found aggregates of carbon nanotubes and silica NPs (thought to be
volcanic in origin) trapped within a Greenland ice core dating back to 10,000
years ago. Whilst Rietmeijer (1997) examined upper stratospheric dust which
contained bismuth oxide NPs formed from fumarolic volcanic gases. Rietmeijer
(1997) linked these NPs to volcanic eruptions which occurred in the 1980’s such
as Mount St. Helens and El Chicon. Other natural atmospheric NPs include sea
salt aerosols formed from the mechanical disruption of the ocean surface
(Hochella et al., 2008, O'Dowd et al., 1997). Whilst interplanitary dust particles
and meteorites also contain small concentrations of diamond nanoparticles,
thought to be produced by supernova sources (Hochella et al., 2008, Verchovsky
et al., 2006).
Biological processes often function at a nano-level. For example proteins,
peptides and viruses all exist within the nano size range (Handy et al., 2008b).
Furthermore, humic and fulvic acids (50-200 nm in size) may also be released
into the natural environment by the degradation of biological matter (Handy et
al., 2008b). In addition the process of biomineralisation produces minerals on a
nano-scale. This includes biogenic iron and manganese (oxyhydr)oxide NPs
(Nowack and Bucheli, 2007, Handy et al., 2008b, Hochella et al., 2008). For
more information on biogenic mineral formation see section 1.3.1.

17
NPs have also been unintentionally produced via anthropogenic processes
for thousands of years, primarily as a consequence of combustion (Nowack and
Bucheli, 2007). For example nano-sized black carbon forms due to the
incomplete combustion of fossil fuels whilst carbon black NPs can be found in
industrial soot formed from the manufacturing of automobile tires (Nowack and
Bucheli, 2007). In addition, platinum and rhodium NPs are produced as a by
product of automotive catalytic converters (Zereini et al., 2001, Nowack and
Bucheli, 2007).
1.1.1 Natural and anthropogenic nanoparticle toxicity
Life on Earth has been exposed to natural NPs throughout evolution and so
organisms are assumed to have adapted to living with these materials (Handy et
al., 2008b). However toxicity occurs as a function of exposure and dose (Handy
et al., 2008b). For example the lungs have adapted mechanisms to clear small
amounts of airborne particles (Handy et al., 2008b). They have not evolved to
operate under more extreme environmental conditions such as a volcanic
eruption. Prolonged exposure to NPs in volcanic ash can cause respiratory
problems such as asthma, bronchitis, silicosis and chronic obstructive pulmonary
disease (Horwell and Baxter, 2006).
Anthropogenic NP toxicity has generated much attention over recent
years. Atmospheric NPs produced via the combustion of fossil fuels have shown
enhanced toxicity due to their enhanced residence time (Kumar et al., 2010).
This means that atmospheric particles which fall within the nano-size range are
more likely to persist within the atmosphere, increasing the likihood of
penetration in respiratory and cardiovascular systems (Kumar et al., 2010).
When inhaled nano-carbon (formed form vehicle emissions) can cause oxidation
stress, pulmonary inflammation and cardiovascular events (Kumar et al., 2010,
Nel et al., 2006). Whilst with regards to the natural environment, platinum NPs
produced from catalytic converters have found to cause increased toxicity to
kiwifruit pollen (Speranza et al., 2010). Speranza et al. (2010) discovered that
platinum NPs of 5-10 nm altered kiwifruit pollen morphology and penetrated the
grains rapidly and to a greater extent than compared to soluble platinum. In
addition the grains underwent plasma membrane damage, resulting in the
cessation of pollen tube emergence (Speranza et al., 2010). These findings hold

18
implications for in vivo pollen function with the potential for ecosystem level
impacts (Speranza et al., 2010).
1.1.2 Manufactured nanoparticles
The nanotechnology industry is now a multibillion dollar industry,
estimated to be worth 3.1 trillion by 2015 (Network, 2010). With large
investment into this sector, a diverse array of NPs are now being produced on an
industrial scale with consumers using nano-containing products daily (Shi et al.,
2011). As we look to the future, nanomaterials are becoming increasingly
complex as we push to discover novel products to meet our consumer and energy
demands (Maynard et al., 2011).
A diverse array of nanomaterials currently exist, based on their chemical
form Li et al. (2006) classified them into 4 categories: 1) carbon based materials
such as carbon nanotubes and fullerenes (see Figure 1.1), 2) metal based
particles such as nano gold, silver and metal oxides, 3) dendrimers which
encompass many forms of nano-scale polymers and 4) composites which involve
the production of NPs with more than 1 material (such as gold-silver composite
nanoparticles, Figure 1.2). The applications of NPs are endless and are found in
almost every aspect of society. A selection of nano-containing products currently
on the market today can be seen in Figure 1.3. In the UK existing nano-
containing products include:
Sunscreens - contain zinc and titanium dioxide NPs due to their high UV
light sorbing capacity (Weir et al., 2012).
Antimicrobial wound dressings - contain silver NPs due to their enhanced
antimicrobial, antifungal and antiviral properties(Rai et al., 2009). In
addition wounds treated with silver NPs exhibit scarless healing (Rai et
al., 2009).
Self-cleaning windows – hydrophobic surfaces act to clean the window
through the action of water whilst the hydrophobic layer carries away dirt
by a process called sheeting (Parkin and Palgrave, 2005).
19
stain resistant clothing – hydrophobic surfaces allow contaminants to
adhere to the water droplets which repels the textile surface (Coyle et
al., 2007).
paints - contain titanium and zinc oxide NPs which enhance the light
scattering properties of paint (Pilotek and Tabellion, 2005).
Figure 1.1: Diagram of a single-wall carbon nanotube (Allotropes, 2013).
Figure 1.2: Silver - gold core – shell NPs (Yee, 2007).
20
Figure 1.3: A selection of current nano-containing products currently on the market (Chatterjee, 2008).
In addition to commercial manufacturing, nanotechnology research and
development has seen continual global growth over recent years (Chen et al.,
2013). Emerging research and development areas include:
Human health – NPs may be used in targeted drug delivery reduces patient
side effects (Pautler and Brenner, 2010). Advances are also being made in
the design of medical instruments; for example lysozyme-silver NP
coatings on medical instruments offer sustained antimicrobial activity
over a wide range of microorganisms (Eby et al., 2009).
Defence – carbon nanotubes spun into fibres in a polymer matrix have the
potential to create electrically conductive fibres, sensors,
electromagnetic shielding, microwave absorption and electrical energy
storage (Kurahatti et al., 2010). Nanocomposites in body armour allow
for more flexible armour with reduced weight and an enhanced capacity
to absorb energy (Kurahatti et al., 2010).
Energy – magnetic NPs and nanofluids have the potential enhance the
performance of an array of solar engineering systems (Mahian et al., 2013,
Frey et al., 2009) whilst nanogenerators have the capability of harvesting
large scale mechanical energy such as footsteps, rolling wheels, wind
power and ocean eaves (Zhu et al., 2013).
21
Agriculture – nano-fertilisers have the potential to minimise nutrient loss
in fertilisation, protect against photodegredation and increase production
rates through enhanced reactivity (Gogos et al., 2012). Nano-pesticides
offer effective, targeted control of pests and reduce the environmental
footprint compared conventional pesticides (Gopal et al., 2012). NPs also
offer advances in contaminant remediation. This is discussed further in
section 1.1.5.
Nanotechnology has the potential to greatly improve communication,
increase data storage, advances in medicine and make an array of technological
applications faster and cheaper (Wang et al., 2013).
1.1.3 Manufactured nanoparticle toxicology
The continual increase in the production of NPs and nano-containing
products has sparked debate between the public, scientific and regulatory
bodies as to the fate and toxicity of nanoparticels in environmental systems.
Elevated concentrations of NPs in the environment are extremely likely due to
the unintentional release of NPs via production, use and disposal of NPs and
nano-containing products (Board, 2009, Petosa et al., 2012). Additionally, NPs
are also intentionally released into the environment for the in-situ remediation
of many ground water contaminants. This is discussed further in section 1.1.5.
Many problems are faced when assessing NP toxicology due to the diverse
array of NPs which are currently produced. This makes it extremely difficult for
toxicologists to adequately assess the ecotoxicity of nanoparticles. Indeed,
relatively inert materials may exhibit toxic effects when produced at the
nanoscale due to the unique physiochemical properties exhibited by
nanoparticles, in particular their large surface area to volume ratio (Ju-Nam and
Lead, 2008). As particle size decreases, surface area increases (Figure 1.4), this
means that more atoms exist on the surface relative to the inside of the NP (Nel
et al., 2006). Hence, NPs regardless of their composition, are biologically more
reactive (Dhawan and Sharma, 2010). In addition to this NPs have access to
biological regions where larger particles would be inhibited (Dhawan and
Sharma, 2010). For example NPs may attach to cellular membranes and enter
22
cells, causing the disruption of cellular functions (Bystrzejewska-Piotrowska et
al., 2009).
Figure 1.4: This graph displays the inverse relationship between particle size and the percent of surface molecules (Nel et al., 2006).
In addition manufactured NPs are chemically complex in nature, being
composed of a vast array of materials. They can be carbon based, metal based,
composite layered NPs and/or coated with an external stabilising agent (Handy
et al., 2008b). This will affect NP size, shape, stability and ultimately their
potential toxicity to human health and the environment (Dhawan and Sharma,
2010). For example NPs composed of cadmium selenide exhibit toxicity due to
the release of Cd2+ ions from the particle surface (Bystrzejewska-Piotrowska et
al., 2009).
NPs may be transported via air and water, and as such this will impact their
toxicological effects. For the purpose of this study only waterborne NPs are
discussed. The toxicological affects of some widely used waterborne NPs are
discussed below:
Carbon nanotubes – freshwater trout exposed to single walled carbon
nanotubes experienced gill injuries, respiratory distress and an increased
risk of mortality with prolonged exposure (Smith et al., 2007).
Gold NPs – Bar-Ilan et al. (2009) discovered that gold NPs are taken up by
the embryos of exposed zebrafish. However the presence of gold NPs

23
caused minimal toxic effects, producing less than 3 % mortality at 12
hours post-fertilisation.
Silver NPs – Bar-Ilan et al. (2009) found that silver NPs were also taken up
by the embryos of exposed zebra fish. In contrast silver NP exposure
produces almost 100 % mortality at 12 hours post fertilisation due to a
variety of embryonic morphological malformations. Silver NPs have also
shown ecosystem level impacts in field experiments. Colman et al. (2013)
applied environmentally relevant concentrations of silver NPs via sewage
biosolids to terrestrial mesocosms. Long-term analysis showed an increase
in nitrous oxide fluxes, changes in microbial community composition, a
reduction in microbial biomass by 35 % as well as bioaccumulation of
silver NPs in the tissue of above ground plants such as Microstegium
vimineum and Lobelia cardinalis.
Quantum dots – Kim et al. (2010a) found that quantum dots become
unstable when exposed to UV light, releasing toxic metals from the core
and generating reactive oxygen species resulting in lethal toxicity to
Daphnia magna.
Metal oxide NPs – waterborne zinc oxide NPs exhibited significant effects
on the survival, growth and reproduction in the marine amphipod
Corophium volutator at concentrations as low as 1 mg/l (Fabrega et al.,
2011). Jiang et al. (2009) tested the toxicity of aluminium, silicon,
titanium and zinc oxide NPs to 3 bacteria strains (Bacillus subtilis,
Escherichia and Pseudomonas fluorescents). Zinc oxide NP exhibited
superior toxicity, causing 100% mortality to all tested bacteria. Whilst
aluminium oxide NPs were lethal to 57% Bacillus subtilis, 36% Escherichia
and 70% Pseudomonas fluorescents and silicon oxide NPs to 40% Bacillus
subtilis, 58% Escherichia and 70% Pseudomonas fluorescents.
1.1.4 Physiochemical properties of Nanoparticles
Manufactured NPs exhibit a wide range of physiochemical properties due
to their diverse and complex nature. The physiochemical properties of NPs are
dependant and influenced by NP size, shape and surface properties. Of these, NP
size is critical. It has long been known that material properties change as a
24
function of size, however, within the nano range (1-100 nm) an unfamiliar
transition zone is approached between the bulk and quantum laws of material
science (Hochella Jr, 2002). Here, the atomic and electronic structures of
particles are altered resulting in enhanced catalytic, optical and magnetic
properties which are not exhibited by that same material at the macroscale
(Guczi et al., 2012, Maillard et al., 2007, Hochella Jr, 2002). For example, gold
is an inert material at the macroscale, however in NP form it is far more
reactive, being utilised for its enhanced catalytic properties, allowing for the
oxidation of CO and methane and the reduction of O2 (Yang et al., 2003, Della
Pina et al., 2008, El-Deab and Ohsaka, 2003). Such phenomena occur as particles
approach the nanometre range as a higher percentage of atoms are exposed on
the surface relative to the particle interior (Figure 1.4), (Roduner, 2006). For
instance, a NP with a diameter of 1 nm exhibits 100% of its atoms on the surface
whilst a NP of 10 nm displays only 15 % of its atoms on the surface (Rao et al.,
2002).
At first, size seems a simple parameter to determine. However in reality
this is complicated as size can change throughout the lifetime of a nanoparticle.
Many are prone to aggregation, thus increasing NP size (Levard et al., 2012).
Equally some are stabilised and so are inhibited form aggregation (Illés and
Tombácz, 2003, Kvitek et al., 2008, Stankus et al., 2010). This is where NP
surface properties come into play. NPs are thought to follow the laws of
colloidal science demonstrated by the classical Derjaguin, Landau, Verwey and
Overbeek (DLVO theory). DLVO theory attempts to describe and explain the
stability of charged surfaces in solution. DLVO combines the electrostatic
repulsion and the van der Waals attraction to create a total interaction energy
which explains why some charged surfaces agglomerate while other remains
stable.
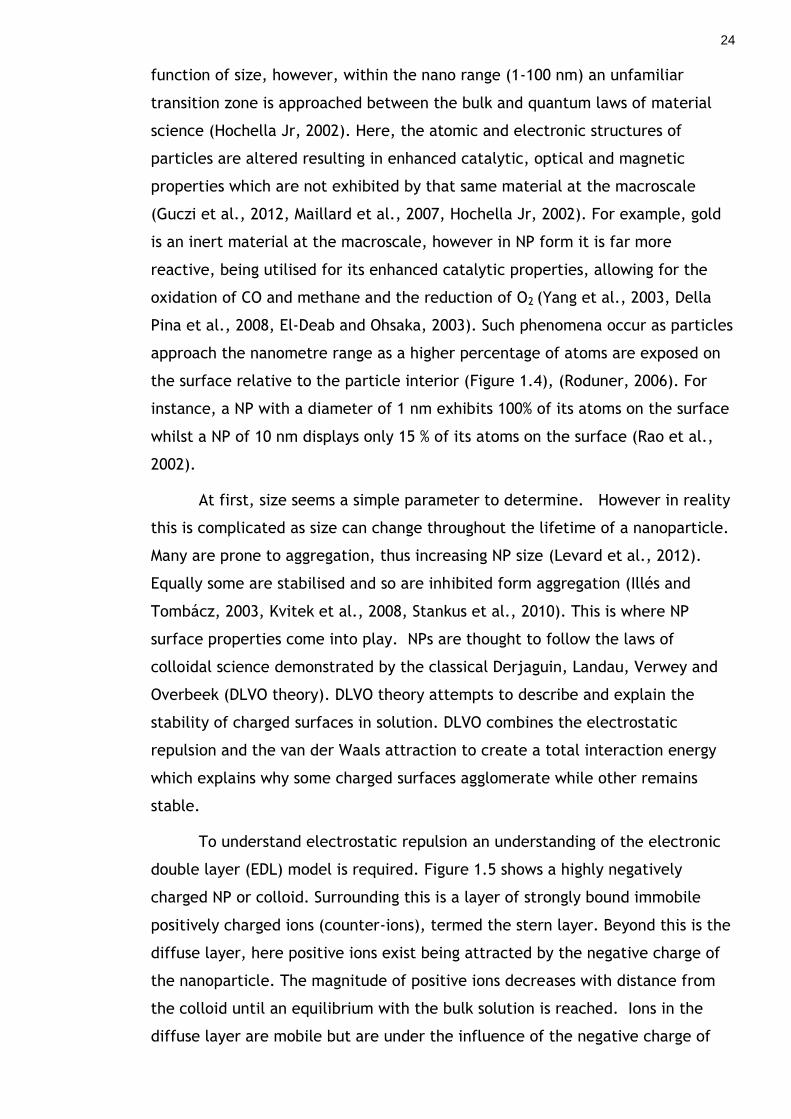
To understand electrostatic repulsion an understanding of the electronic
double layer (EDL) model is required. Figure 1.5 shows a highly negatively
charged NP or colloid. Surrounding this is a layer of strongly bound immobile
positively charged ions (counter-ions), termed the stern layer. Beyond this is the
diffuse layer, here positive ions exist being attracted by the negative charge of
the nanoparticle. The magnitude of positive ions decreases with distance from
the colloid until an equilibrium with the bulk solution is reached. Ions in the
diffuse layer are mobile but are under the influence of the negative charge of
25
the colloid and so move as one with the colloid. It is the attached stern layer
and charged diffuse layer that creates the double layer surrounding the charged
surface.
Figure 1.5: Schematic representation of the electronic double layer.
In DLVO theory electrostatic effects come into play when two charged
surfaces approach each other and their double layers begin to overlap. If the
two surfaces are similarly charged an energy barrier is required to overcome the
electrostatic repulsion for attachment to occur, this is demonstrated by an
electrostatic repulsion curve. A maximum energy exists as the charged surfaces
are almost touching, reducing to zero beyond the EDL. The magnitude of the
energy barrier is related to the zeta potential of the charged surface. Indeed,
two surfaces of opposite charge will exhibit no electrostatic repulsion and
therefore no energy barrier (assuming attractive Van der Walls forces).
Van der Waals attraction results from the force between two permanent
dipoles (Keesom force), the force between a permanent dipole and an induced
dipole (Debye force) and instantaneously induced dipoles (London dispersion
forces). The Keesom force occurs when two polar molecules approach each
other. The partially negative side of one molecule is attracted to the partially
positive side of the other. This is often referred to the dipole-dipole interaction.
Debye or induced dipole interactions occur when a polar molecule induces a
dipole moment in a nonpolar molecule by creating an uneven electronic
configuration in the nonpolar molecule. Whilst the London dispersion forces arise
26
from the orbit of electrons around atoms and molecules, creating an uneven
distribution of electrons. This uneven distribution of electrons induces weak
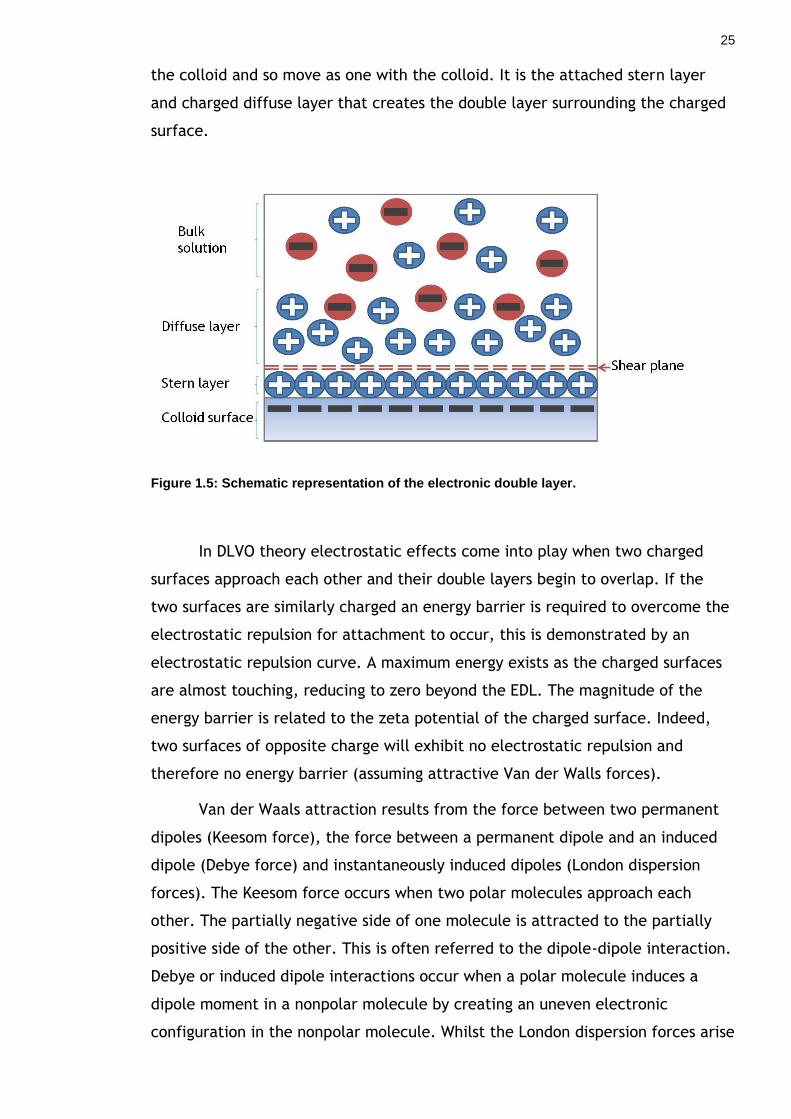
dipole moments between atoms and molecules. The combination of these two
opposing forces (van der Waals attraction and the electrostatic repulsion)
creates a total interaction energy curve (Figure 1.6). In order for attraction to
occur the charged surfaces must have sufficient energy to overcome the energy
barrier. The energy barrier may be altered by changing the zeta potential of the
charged surface.
Figure 1.6: Total (net) interaction energy curve produced combination of the van der Waals attraction from the electrostatic repulsion curve.
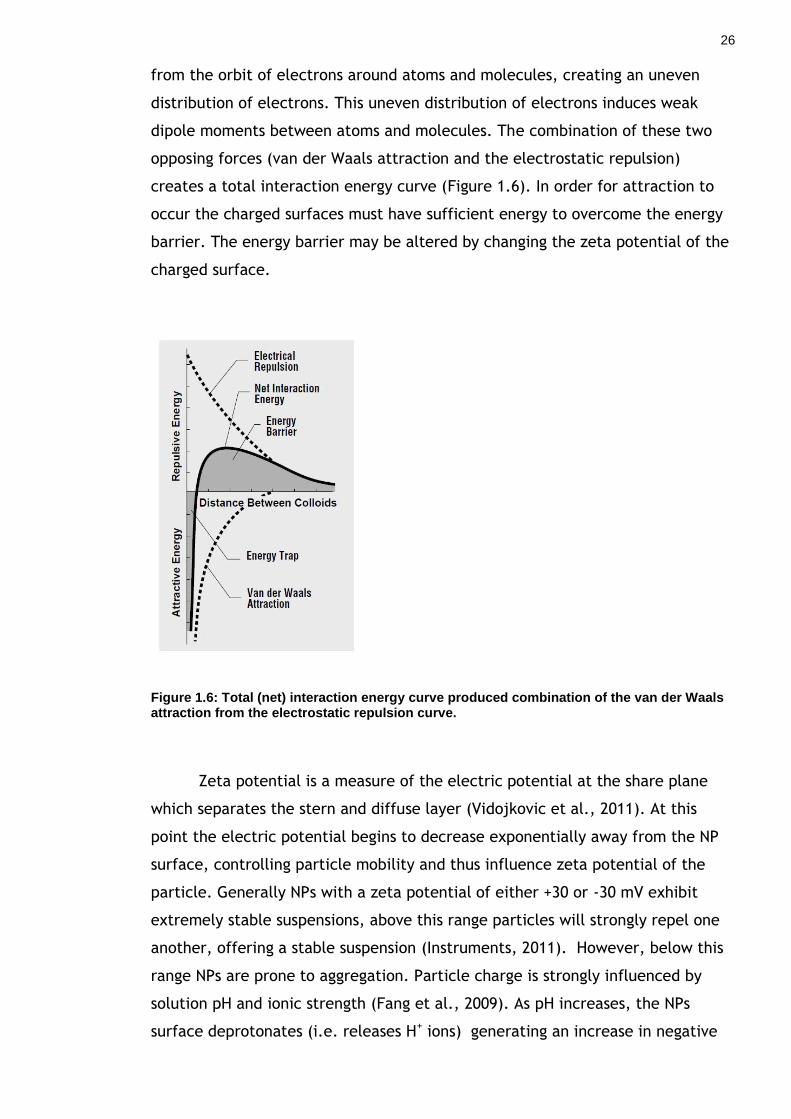
Zeta potential is a measure of the electric potential at the share plane
which separates the stern and diffuse layer (Vidojkovic et al., 2011). At this
point the electric potential begins to decrease exponentially away from the NP
surface, controlling particle mobility and thus influence zeta potential of the
particle. Generally NPs with a zeta potential of either +30 or -30 mV exhibit
extremely stable suspensions, above this range particles will strongly repel one
another, offering a stable suspension (Instruments, 2011). However, below this
range NPs are prone to aggregation. Particle charge is strongly influenced by
solution pH and ionic strength (Fang et al., 2009). As pH increases, the NPs
surface deprotonates (i.e. releases H+ ions) generating an increase in negative
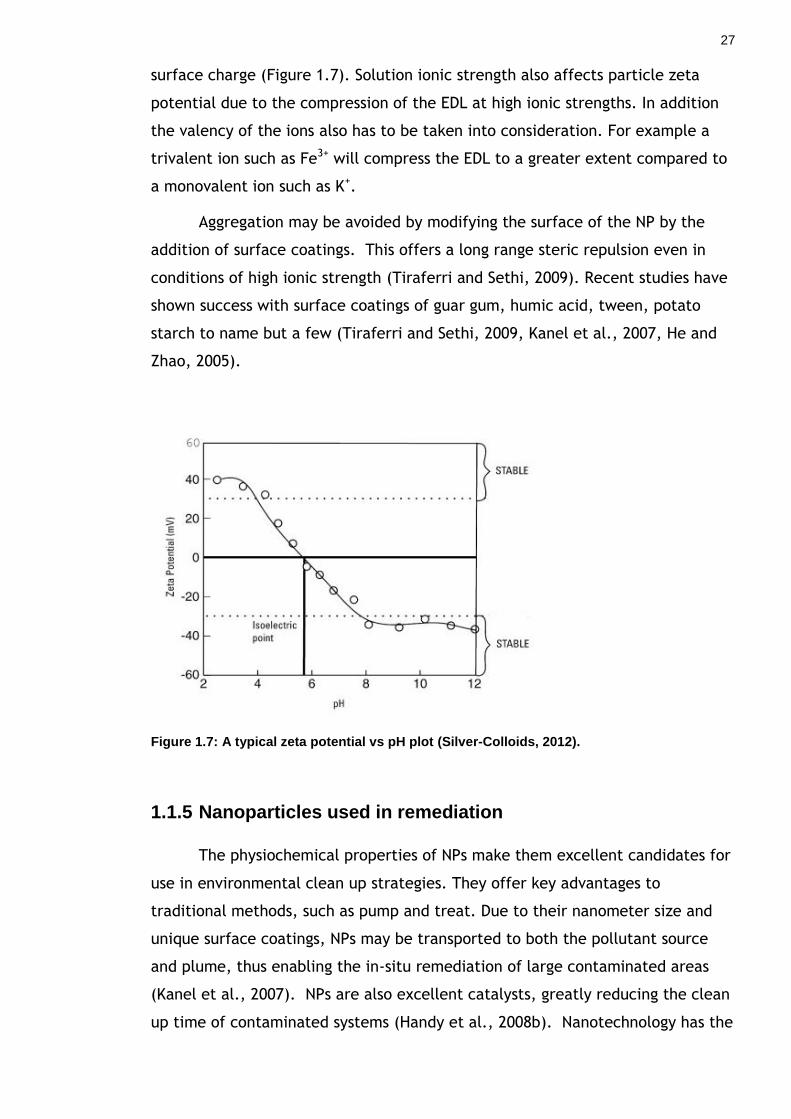
27
surface charge (Figure 1.7). Solution ionic strength also affects particle zeta
potential due to the compression of the EDL at high ionic strengths. In addition
the valency of the ions also has to be taken into consideration. For example a
trivalent ion such as Fe3+ will compress the EDL to a greater extent compared to
a monovalent ion such as K+.
Aggregation may be avoided by modifying the surface of the NP by the
addition of surface coatings. This offers a long range steric repulsion even in
conditions of high ionic strength (Tiraferri and Sethi, 2009). Recent studies have
shown success with surface coatings of guar gum, humic acid, tween, potato
starch to name but a few (Tiraferri and Sethi, 2009, Kanel et al., 2007, He and
Zhao, 2005).
Figure 1.7: A typical zeta potential vs pH plot (Silver-Colloids, 2012).
1.1.5 Nanoparticles used in remediation
The physiochemical properties of NPs make them excellent candidates for
use in environmental clean up strategies. They offer key advantages to
traditional methods, such as pump and treat. Due to their nanometer size and
unique surface coatings, NPs may be transported to both the pollutant source
and plume, thus enabling the in-situ remediation of large contaminated areas
(Kanel et al., 2007). NPs are also excellent catalysts, greatly reducing the clean
up time of contaminated systems (Handy et al., 2008b). Nanotechnology has the
28
potential to provide faster, cost effective environmental clean-up strategies
whilst reducing many common groundwater contaminants to near zero, all in-
situ (Wong et al., 2009).
NPs proposed for use in contaminant remediation include various metal
oxides, carbon nanotubes and tatinium dioxide and nano zero valent iron (nZVI,
Karn et al., 2011). Of these nZVI is the most commonly used. nZVI has shown
high success rates for the remediation of various organic and inorganic soil and
groundwater contaminants ranging from chlorinated solvents to a wide range of
heavy metal ions (Misra et al., 2011, Fein et al., 2005, Mueller et al., 2012). The
versatility of nZVI to treat a wide range of environmental contaminants is a
result of oxidation of the zero valent iron core, forming an oxide shell (Wong et
al., 2009). This core shell structure allows enhanced chemical removal via two
mechanisms. The zero valent iron core provides a reducing agent due to its
electron donating properties whilst the oxide shell exhibits a strong sportive
character via electrostatic interactions and surface complexation mechanisms
(Kanel et al., 2007). Presently nZVI is being used extensively in the US for
contaminant remediation whilst a few cases exist in Europe, namely Czech
Republic, Italy and Germany (Wong et al., 2009). The results of nZVI treated
sites look promising, for example a contaminated site in Bornhein, Germany saw
a 90% reduction of total chlorinated compounds (Wong et al., 2009). No adverse
environmental problems have been reported thus far, however the long term
affects of nanoremediation are poorly understood. As a result continual
environmental monitoring of nZVI-remediated sites is essential in order to
prevent any adverse environmental impacts (Karn et al., 2011, Wong et al.,
2009).
1.1.6 Environmental exposure to nanoparticles
Evidence suggests that the uncontrolled release of nanomaterials through
the use and disposal of nano-containing products has led to the emergence of
NPs within the natural environment (Musee, 2011). As the volume of nano-
containing products increases this will inevitably lead to their accumulation in
the environment (Simonet and Valcárcel, 2009). To this point, no published data
exist for nano-waste volume, however, reasonable estimates can be inferred by
the production volumes of NPs and nano-containing products (EEA, 2002). In

29
2004 1000 tonnes of nanomaterials were produced globally. This figure is
estimated to increase to 58,000 tonnes annually between the years 2011 and
2020 (Musee, 2011, Engineering, 2004). A significant source of nano-waste to
the natural environment may occur via point sources such as landfill,
wastewater treatment works and industrial waste streams, whilst nonpoint
sources include wear and tear of nano-containing products (Musee, 2011, Powell
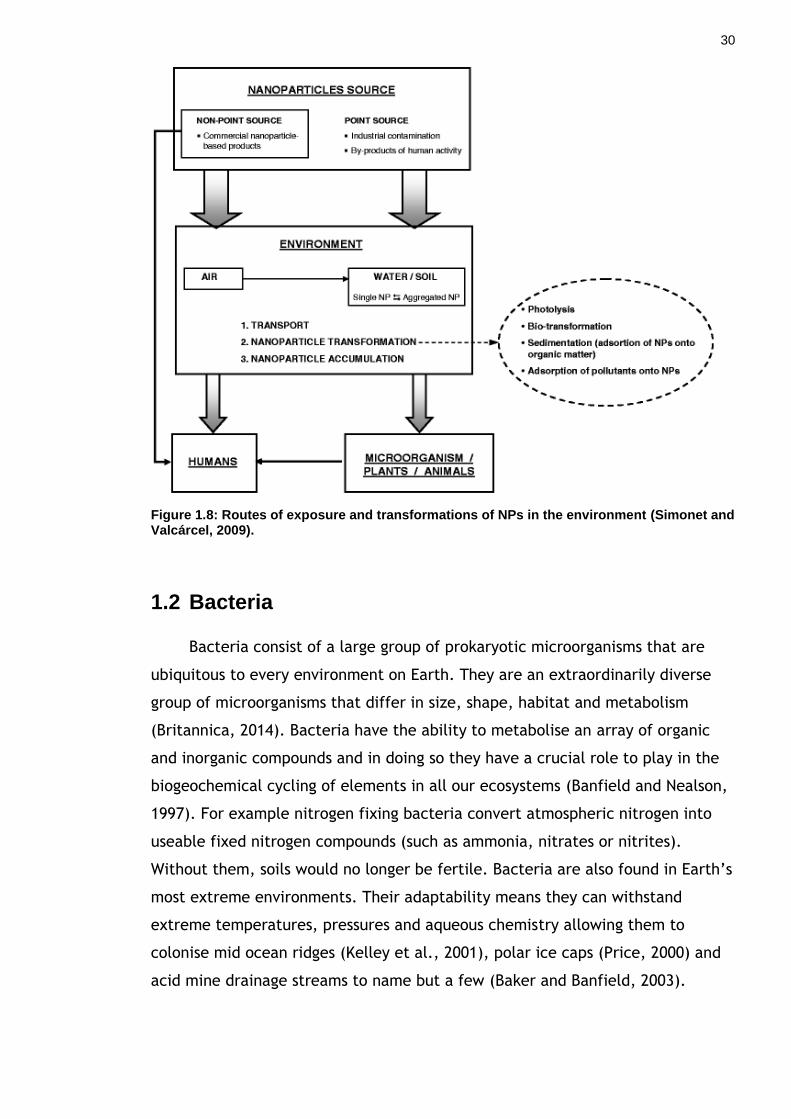
et al., 2008). Figure 1.8 highlights the potential routes of exposure and
transformations of NPs in environmental systems. In addition, NPs may be
intentionally released into the environment for contaminant remediation
purposes, (see section 1.1.5). Once released into the environment, NPs may
undergo a variety of transformations such as redox reactions, aggregation and
dissolution (Figure 8, Lowry et al., 2012b). For example when exposed to a large
scale microcosm, replicating a freshwater wetland, silver NPs underwent almost
complete sulfidation over a period of 18 months (Lowry et al., 2012a). This
altered the particles aggregation state, surface chemistry and charge (Lowry et
al., 2012b). However under the experimental conditions tested here Lowry et al.
(2012a) found that Ag ions remained bioavailable to the plants and biota living
within the microcosm. In addition NPs may be intentionally stabilised with a
variety of surface coatings such as guar gum and humic acid (Simonet and
Valcárcel, 2009, Tiraferri and Sethi, 2009) which will inhibit particle aggregation
(see section 1.1.4). NP surface properties will ultimately determine the fate,
transport and toxicity of NPs in environmental systems.
30
Figure 1.8: Routes of exposure and transformations of NPs in the environment (Simonet and Valcárcel, 2009).
1.2 Bacteria
Bacteria consist of a large group of prokaryotic microorganisms that are
ubiquitous to every environment on Earth. They are an extraordinarily diverse
group of microorganisms that differ in size, shape, habitat and metabolism
(Britannica, 2014). Bacteria have the ability to metabolise an array of organic
and inorganic compounds and in doing so they have a crucial role to play in the
biogeochemical cycling of elements in all our ecosystems (Banfield and Nealson,
1997). For example nitrogen fixing bacteria convert atmospheric nitrogen into
useable fixed nitrogen compounds (such as ammonia, nitrates or nitrites).
Without them, soils would no longer be fertile. Bacteria are also found in Earth’s
most extreme environments. Their adaptability means they can withstand
extreme temperatures, pressures and aqueous chemistry allowing them to
colonise mid ocean ridges (Kelley et al., 2001), polar ice caps (Price, 2000) and
acid mine drainage streams to name but a few (Baker and Banfield, 2003).
31
1.2.1 Biofilm
Biofilms can be described as aggregated communities of microorganisms
(O'Toole et al., 2000, Stoodley et al., 2002). Biofilms differ greatly to their
individual planktonic counterparts, having key advantages of antimicrobial
resistance, better availability to nutrients and are capable of withstanding
greater environmental stress (Donlan, 2002, Palmer et al., 2007, Stanley and
Lazazzera, 2004). They can form on solids, liquids and on living tissue (such as
animal and plant tissues), (Britannica, 2014). Biofilm formations may be
composed of a single bacterial species or a multiple community including
eukaryotic organisms such as algae and fungi (O'Toole et al., 2000, Palmer Jr and
White, 1997). However mixed communities are more common in environmental
systems whilst single species more likely to occur as an infection or on the
surface of medical implants (O'Toole et al., 2000). Biofilm growth is initiated by
attachment to a surface; however the attachment mechanism is of much
contention. Many factors may affect bacterial attachment to surfaces, such as
mass transport, surface charge, surface roughness and surface micro-topography
(Palmer et al., 2007). Once attachment has been made biofilm growth and cell
division may occur. During growth, extracellular polymeric substances (EPS) are
secreted, this is crucial to the structure of the biofilm, comprising 50 to 90% of
the total organic carbon of the biofilm (Donlan, 2002). In addition EPS prevents
biofilm desiccation and contributes to the antimicrobial resistance of biofilm
(Donlan, 2002).
1.2.2 Biofilm – nanoparticle interactions
Bacteria – NP interactions hold implications for the transport of NPs within
environmental systems. Their presence may facilitate the degradation, sorption
and/or generation of NPs (Peulen and Wilkinson, 2011). Ultimately, the mobility
and bioavalibility of NPs will depend on diffusion coefficients as this is the
dominant transport mechanism of NPs into biofilm communities (Peulen and
Wilkinson, 2011). Hence, the structure and composition of the biofilm hold
important implications for biofilm – NP interactions. Peulen et al. (2011) found
that the pore size within the biofilm is crucial to determine whether NP diffusion
into the biofilm occurs. Here, NPs larger than 50 nm were excluded from biofilm

32
formations, suggesting their presence in environmental systems would not affect
the transport of larger NPs. In addition, the physiochemical characteristics of
NPs are crucial. For example, Li et al. (2013) found that biofilm coated sand
grains retained bare NPs through sand column experiments, whilst polymer
coated NPs showed high mobility with little retention within the column due to
steric repulsion. The physiochemical interactions of NPs are discussed in detail in
section 1.1.4.
Biofilms are formed by a variety of microorganisms, under differing growth
conditions which produce communities that vary widely in physiology and
biochemistry. Coupled with the diverse array of NPs produced bacteria – NP
interactions within the natural environment is a complex process which is
currently not well understood.
1.3 Microbially mediated mineral formation
1.3.1 General microbial mineral formation
Microorganisms are key players in the precipitation and dissolution of
numerous minerals. Mineral formation may be induced or controlled by the
microorganism. Biologically induced mineralisation occurs as a by product of the
organisms metabolic processes where as biologically controlled mineralisation
occurs to serve a physiological purpose to the microorganism (Konhauser, 2009).
For example ferrihydrite is a common biologically induced mineral forming in an
array of environments ranging from aquifers to mine waters (Konhauser, 2009).
This mineral can be precipitated by microbial oxidation of Fe(II) to Fe(III).
Mineralisation can be assisted by the adsorption of iron by the cell surface,
followed by nucleation and consequently growth until the cell becomes
completely encrusted in the mineral precipitate (Konhauser, 2009). Warren and
Ferris (1998) demonstrated that ferrihydrite precipitation was enhanced by the
presence of bacteria, with precipitation occurring at a lower pH and in greater
quantities compared to the abiotic (no bacteria) controls. Here the bacterial
cells acted as heterogeneous nucleation templates for ferrihydrite precipitation
(Warren and Ferris, 1998). In contrast biologically controlled mineralisation
occurs as the microorganism exerts control over the nucleation and growth of
the mineral (Bazylinski and Frankel, 2003). For example, magnetotactic bacteria
33
control the formation of magnetite. The mineral may form on or within the
organism or within vesicles inside the cell (Devouard et al., 1998). This allows
the organism to exert a high degree of control over biomineralization, forming
well ordered crystals which have a narrow size distribution and well defined
morphologies (Devouard et al., 1998).
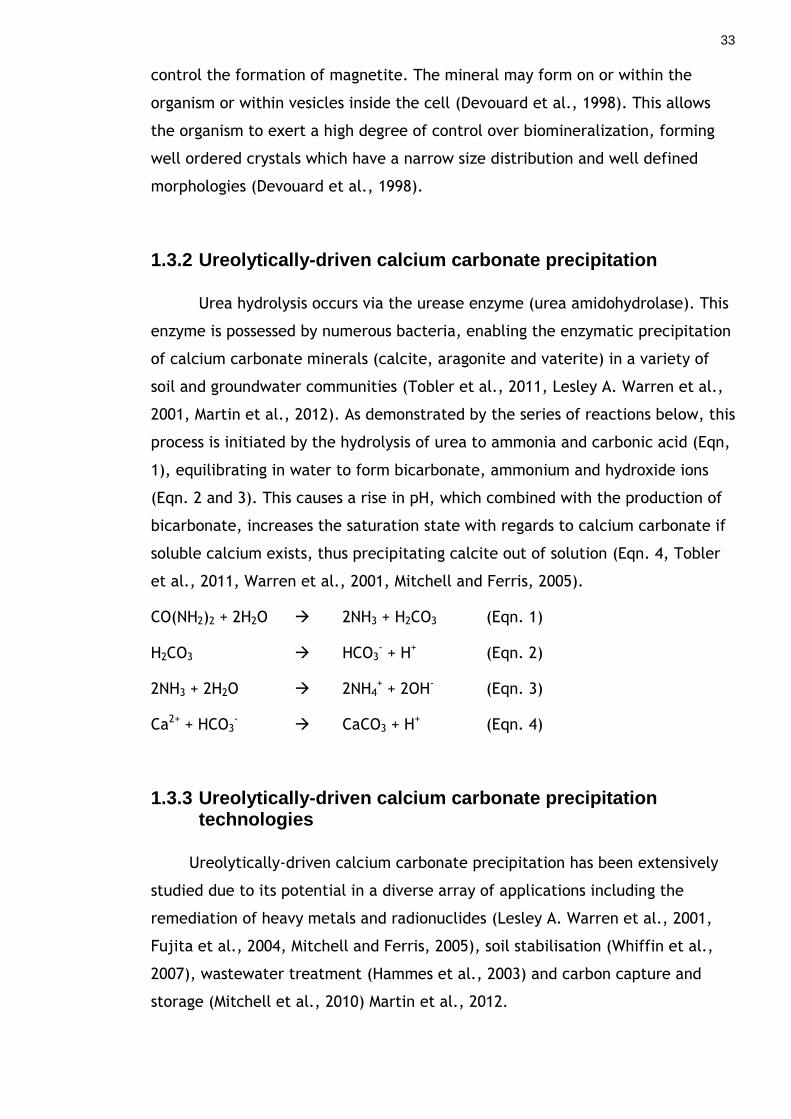
1.3.2 Ureolytically-driven calcium carbonate precipitation
Urea hydrolysis occurs via the urease enzyme (urea amidohydrolase). This
enzyme is possessed by numerous bacteria, enabling the enzymatic precipitation
of calcium carbonate minerals (calcite, aragonite and vaterite) in a variety of
soil and groundwater communities (Tobler et al., 2011, Lesley A. Warren et al.,
2001, Martin et al., 2012). As demonstrated by the series of reactions below, this
process is initiated by the hydrolysis of urea to ammonia and carbonic acid (Eqn,
1), equilibrating in water to form bicarbonate, ammonium and hydroxide ions
(Eqn. 2 and 3). This causes a rise in pH, which combined with the production of
bicarbonate, increases the saturation state with regards to calcium carbonate if
soluble calcium exists, thus precipitating calcite out of solution (Eqn. 4, Tobler
et al., 2011, Warren et al., 2001, Mitchell and Ferris, 2005).
CO(NH2)2 + 2H2O 2NH3 + H2CO3 (Eqn. 1)
H2CO3 HCO3- + H+ (Eqn. 2)
2NH3 + 2H2O 2NH4+ + 2OH- (Eqn. 3)
Ca2+ + HCO3- CaCO3 + H+ (Eqn. 4)
1.3.3 Ureolytically-driven calcium carbonate precipitation technologies
Ureolytically-driven calcium carbonate precipitation has been extensively
studied due to its potential in a diverse array of applications including the
remediation of heavy metals and radionuclides (Lesley A. Warren et al., 2001,
Fujita et al., 2004, Mitchell and Ferris, 2005), soil stabilisation (Whiffin et al.,
2007), wastewater treatment (Hammes et al., 2003) and carbon capture and
storage (Mitchell et al., 2010) Martin et al., 2012.
34
1.4 Research objectives
This PhD research examines microbially mediated processes which reduce
NP mobility and ultimately immobilise NPs within water and waste water.
Nanotechnology is a rapidly growing field which shows no signs of slowing in
the future. Concern arises due to the toxicological effects displayed by some
nanoparticles. As NP production increases, so too will human and environmental
exposure to nanoparticles, resulting in detrimental effects to human health and
the natural environment. However, in order for NP toxicity to present a real
threat, a route of exposure must exist. Some NPs which are electrostatically
and electrosterically stabilised are highly mobile within environmental systems
and so it is these NPs which present the greatest risk with regards to toxicity.
This thesis looks to explore microbially mediated processes which can prevent
the transport of NPs to sites where they have the potential to cause harm.
Much of this thesis explores the ability of microbial precipitated minerals
to immobilize nanoparticles. While, microbially driven mineral precipitation has
already been shown to have potential for immobilization of dissolved heavy
metals, the capture of NPs has yet to be examined. In addition to this, NP
sorption onto planktonic bacteria and granular biofilms is also assessed. This was
done to assess the capacity for current municipal wastewater treatment works
to remove NPs conventionally through biological treatment.
The key research chapters in this thesis are as follows:
Chapter 2 - utilizes batch reactions to test the ability of ureolytic calcite
precipitation to capture highly stable nanoparticles. This is tested as a
function of NP surface charge and size.
Chapter 3 - builds upon chapter 2, but here the capture of NPs is
undertaken inside packed sand columns to explore how this process works
inside porous media. This understanding is key if this process were to be
scaled up to natural aquifers and soils.
Chapter 4 – tests the ability of struvite to remove positively charged NPs
from water as these were poorly captured by the process of ureolytic
calcite precipitation (Chapter 3). The ability of struvite mineral formation
to remove ammonia (an undesirable by product of ureolysis) was also
tested.

35
Chapter 5 – determines the ability of bacteria (Bacillus subtilis) and
wastewater treatment biofilms to adsorb and remove NPs from solution.
The ability of both biosorbent materials to remove (adsorb) NPs is
examined as a function of bacterial concentration, pH and ionic strength.
36
2 Immobilisation of nanoparticles by microbially mediated calcite precipitation
2.1 Summary
Microbial driven mineral precipitation has the potential to capture
dissolved heavy metals, impacting the transport and fate of metals in the
natural environment. However, the capture of NPs by microbial mineral
precipitation has yet to be examined. In this study, the ureolytic bacteria
Sporosarcina pasteurii was used to induce calcium carbonate precipitation in the
presence of organo-metallic manufactured NPs. As calcium carbonate crystals
grew the NPsin the solution became trapped within these crystals. Critically,
further growth caused the NPs-crystal composite to settle out of suspension.
NPs with a negative surface charge were captured with greater efficiency than
those with a positive surface charge, likely resulting from stronger attachment
of negative NPs to the positively charged calcite surfaces. Thermodynamic and
kinetic analysis, however, did not reveal a significant difference in kp (calcite
precipitation rate constant) or the critical saturation at which precipitation
initiates (Scrit), indicating the presence of different charged NPs did not
influence calcite precipitation at the concentrations used here. Overall, these
findings demonstrate that bacterially driven solid-phase capture has potential to
immobilize NPss, and thus may potentially be utilized to immobilize NPs in
contaminated groundwater systems.
2.2 Introduction
Microorganisms have the ability to drive the precipitation of a wide range
of minerals (Chapter 1.3). This process can lead to the immobilisation of
dissolved metals, either within the crystalline structure of the mineral or bound
to the mineral surface. For example, oxidation of Fe(II) and Mn(II) generates
metal (hydr)oxides which can absorb a diverse array of dissolved heavy metals
and metalloids (Martinez et al., 2004, Martinez and Ferris, 2005, Villalobos et
al., 2014, Pei et al., 2013) while enzymatic precipitation of phosphate produces
hydroxyapatites which bind significant quantities of dissolved heavy metals and
have potential in engineered permeable reactive barriers (Handley-Sidhu et al.,

37
2011). Ureolysis-driven calcium carbonate precipitation has been extensively
studied due to its potential in a diverse array of applications including soil
stabilisation (Whiffin et al., 2007), concrete crack remediation (De Muynck et
al., 2010), fracture and porosity sealing to inhibit pollutant flow (Tobler et al.,
2012), wastewater treatment (Hammes et al., 2003), and carbon capture and
storage (Mitchell et al., 2010). This process also has potential for solid phase
capture of heavy metals and radionuclides, which are incorporated into the
calcium carbonate mineral as it crystallizes, thus preventing their mobility in the
subsurface. In particular, this approach has been investigated for the solid
phase capture of 90Sr ions from contaminated groundwaters; the strontium
replacing Ca2+ in the crystal lattice (Warren et al., 2001). In this process,
ureolysis occurs via the hydrolysis of urea by the urease enzyme generating
ammonia and carbonic acid (Eqn. 1). This then equilibrates in water to form
bicarbonate, ammonium and hydroxide ions (Eqn. 2&3), causing a rise in pH and
an increase in the saturation state with regards to calcium carbonate if soluble
calcium is available. Once saturation is reached the precipitation of calcium
carbonate minerals such as calcite occurs (Eqn. 4, Tobler et al., 2011).
CO(NH2)2 + 2H2O 2NH3 + H2CO3 (Eqn. 1)
H2CO3 HCO3- + H+ (Eqn. 2)
2NH3 + 2H2O 2NH4+ + 2OH- (Eqn. 3)
Ca2+ + HCO3- CaCO3 + H+ (Eqn. 4)
Calcium carbonate precipitation may also be driven via chemical
(abiogenic) precipitation; however biologically driven precipitation of calcium
carbonate offers a key advantage of slower precipitation rates. This enables the
treatment of a larger target area of the subsurface, as reagents can be injected
throughout the target zone before significant precipitation occurs (Tobler et al.,
2011). Conversely, rapid abiogenic precipitation is likely to cause blocking of
the injection well.
While a diverse array of microbial mineral precipitation pathways have
potential to immobilize heavy metals, their ability to capture NPs has yet to be
examined. With a rising demand for nanomaterials and continual growth in

38
production, increased environmental exposure to NPs (NPs) is inevitable (Petosa
et al., 2010, Musee, 2011, Luo et al., 2006, Moore, 2006, Nowack and Bucheli,
2007). This has brought NP toxicity to the forefront of research and
governmental concern, with the UK government alone spending £10 million
during 2005-08 to identify and manage the risks posed by the nanotechnology
industry (DEFRA, 2011). Problematically, NPs can have a wide range of toxic
effects, exacerbated by their size (at least one dimension smaller than 100 nm,
Engineering., 2004). Detrimental effects include brain, intestinal and
respiratory injury, delayed embryonic development, DNA damage and increased
mortality (Trouiller et al., 2009, Handy et al., 2008a). See Chapter 1.1.3 for
further discussion on NP toxicity.
Such findings raise concern with regards to the fate and transport of NPs
within the environment. Owing to their small size NPs are highly reactive,
making them excellent catalysts (Luo et al., 2006). Increasingly, applications of
NPs require them to be highly dispersed, stable suspensions and so NP systems
are increasingly being designed to exhibit enhanced stability via modifications of
NP surfaces with capping agents and surfactants (Lecoanet et al., 2004, Kanel et
al., 2007, Petosa et al., 2012). Such NPs have the ability to be transported more
readily within the natural environment (Kanel et al., 2007, Lecoanet et al.,
2004). Aside from enhancing NP mobility, stable NP dispersions also exhibit
increased toxicity compared to agglomerated NPs due to their large surface area
to volume ratio (Levard et al., 2012). For example, Kvitek et al. (2008)
demonstrated that increasing the stability of silver NPs enhanced their
antibacterial activity. Aside from this highly stable, mobile surface modified NPs
also have the ability to bind and transport chemical pollutants, thus enhancing
the dispersal of pre-existing contaminants within the environment (Moore,
2006).
It is clear that some NPs are highly stable and therefore mobile under
environmental conditions, presenting a route of exposure of NPs to humans and
the natural environment (Lecoanet et al., 2004, Ben-Moshe et al., 2010, Petosa
et al., 2012). The ability of microbial driven mineral precipitation to immobilise
NPs should therefore be examined.
In this study, ureolysis driven calcium carbonate precipitation by the
urease positive bacterium Sporosarcina pasteurii (S. pasteurii) was investigated
39
as a means of immobilising NPs through solid-phase capture in aqueous systems.
Experiments were performed as a function of NP surface charge and size to
determine if these factors impacted capture efficiency. Thermodynamic and
kinetic interpretation of results were undertaken to determine whether these NP
properties had a significant impact on precipitation kinetics and the saturation
state required for precipitation.
2.3 Materials and methods
2.3.1 Nanoparticles
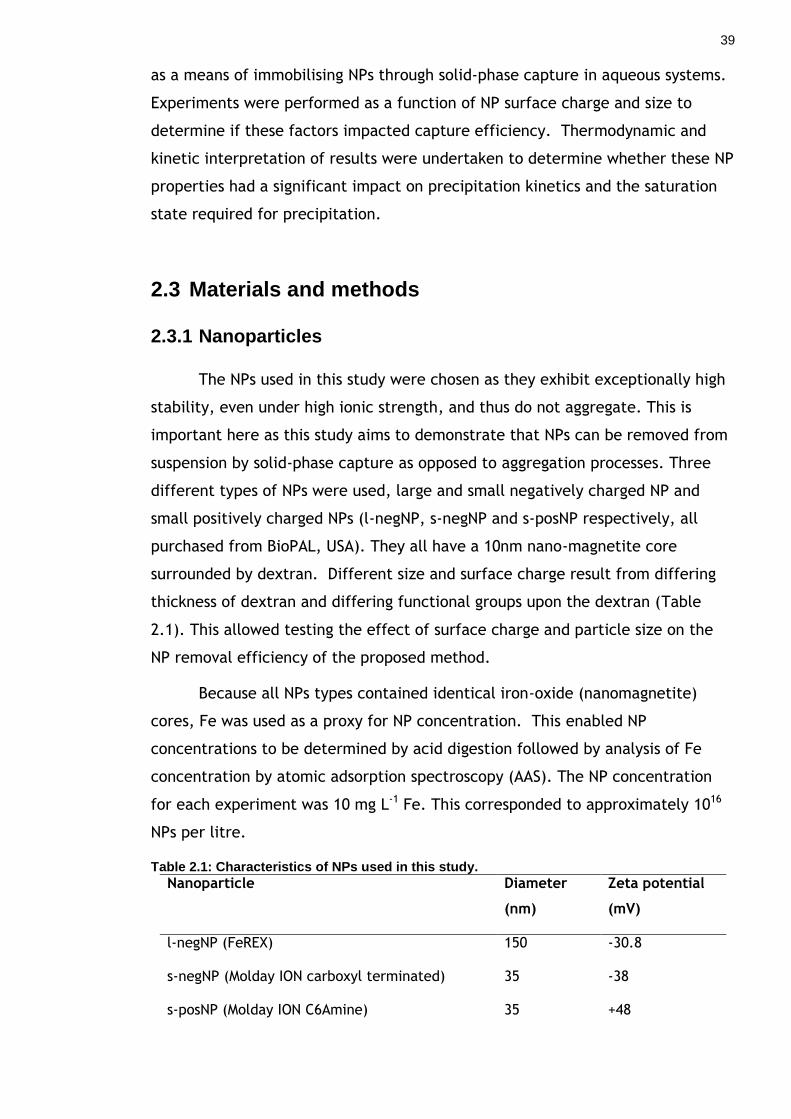
The NPs used in this study were chosen as they exhibit exceptionally high
stability, even under high ionic strength, and thus do not aggregate. This is
important here as this study aims to demonstrate that NPs can be removed from
suspension by solid-phase capture as opposed to aggregation processes. Three
different types of NPs were used, large and small negatively charged NP and
small positively charged NPs (l-negNP, s-negNP and s-posNP respectively, all
purchased from BioPAL, USA). They all have a 10nm nano-magnetite core
surrounded by dextran. Different size and surface charge result from differing
thickness of dextran and differing functional groups upon the dextran (Table
2.1). This allowed testing the effect of surface charge and particle size on the
NP removal efficiency of the proposed method.
Because all NPs types contained identical iron-oxide (nanomagnetite)
cores, Fe was used as a proxy for NP concentration. This enabled NP
concentrations to be determined by acid digestion followed by analysis of Fe
concentration by atomic adsorption spectroscopy (AAS). The NP concentration
for each experiment was 10 mg L-1 Fe. This corresponded to approximately 1016
NPs per litre.
Table 2.1: Characteristics of NPs used in this study.
Nanoparticle Diameter
(nm)
Zeta potential
(mV)
l-negNP (FeREX) 150 -30.8
s-negNP (Molday ION carboxyl terminated) 35 -38
s-posNP (Molday ION C6Amine) 35 +48

40
2.3.2 Experimental design
Batch experiments where performed using the gram positive ureolytic
bacterium S. pasteurii (strain ATCC 11859). Cultures were grown at 25°C in brain
heart infusion broth supplemented with filter-sterilised urea (20g L-1). Cells in
exponential phase growth were harvested by vacuum filtration (using sterile
0.2µm membrane filters) and rinsed twice with sterile deionised water (SDW).
The bacterial pellet was re-suspended in SDW to a cell count (OD) of 0.14 as
determined spectrophotometrically at 600nm (this equates to 2.3 x 10⁶ cells ml-
1, based on the S. pasteurii OD to cell conversion in (Levard et al., 2012)) and
then pH adjusted to 6.5 using HCl to ensure that the system was undersaturated
with respect to calcium carbonate precipitation (Analar grade). For each
nanoparticle immobalisation (NP-I) experiment, a solution containing 100 mM
CaCl2 and 100 mM urea was prepared and then mixed at a ratio of 1:1 with the
bacterial suspension before the addition of nanoparticles. The final
concentrations were 50mM CaCl2, 50mM urea, 10 mg/L NPs (Fe concentration)
and 0.07 OD S. pasteurii. Biotic controls (S. pasteurii + urea + NP) and abiotic
controls (CaCl2 + urea + NP) were also run. Double dosing experiments were
undertaken with l-negNPs to determine if any non-captured NPs could be
trapped by a second phase of calcium carbonate precipitation. For the double
dosing experiment, reactions were set up as described above (using l-negNPs),
but once ureolysis and calcite precipitation were completed, urea and CaCl2
were added once again (to yield final concentrations of 50 mM each), which then
induced a second phase of calcium carbonate precipitation.
All nanoparticle immobilisation experiments were carried out in triplicate
in glass beakers that were covered with parafilm® to prevent evaporation.
2.3.3 Chemical analysis
Analyses of solution pH, NH4+, Ca2+ and Fe were determined at time zero
and at regular intervals thereafter. At each sampling time, 10 ml aliquots were
removed from the experiment; 5ml were used for pH measurement using a
Mettler Toledo MA 235 pH/ion analyser, 0.5 ml to determine NH4+ by the Nessler
assay (analysis was performed using a Hach Lange DR 5000 spectrophotometer)
and 4.5 ml were mixed with 0.5 ml of concentrated HCl for Ca2+ and Fe

41
concentration measurements using AAS. For Fe analysis calibration standards
(0.1, 1, 5 and 10 mg/l) were prepared prior to each analysis by dilution of a
single element standard for AAS which contained 1000 ppm Fe in nitric acid
(purchased from fisher Scientific). An air-acetylene flame was used for all Fe
determinations at a flow rate of 0.8 – 1 l/min. The spectrometer was operated
at a wavelength of 248.3 nm and a spectral band pass of 0.2 nm with the lamp
current running at 75%. The analytical limit detected under these conditions is
0.06 mg/l. For Ca2+ analysis standards of 0.1, 1, 2, 3 mg/l were prepared prior to
each analysis using CaCl2. A nitrous oxide – acetylene flame was used at a fuel
flow rate of 4 – 4.4 l/min for all Ca2+ analysis. The spectrometer was operated at
a wavelength of 422.7 nm and a spectral band pass of 0.5 nm with the lamp
current running at 100%. The analytical limit detected under these conditions is
0.015 mg/l.
2.3.4 Transmission Electron Microscopy (TEM)
TEM imaging, selected area electron diffraction (SAED) and chemical
analysis was undertaken on thin foils that were extracted from calcite grains
using the Focused Ion Beam (FIB) lift-out technique using a FEI Nova 200
Dualbeam. Calcite crystal surfaces were first sputter coated with gold to
prevent charging of the mineral surface and ion-implantation into the calcite,
followed by further deposition of platinum from an organometallic precursor
within the FIB. Foils were thinned using a 30 kV Ga+ ion beam to a thickness of
~1 µm prior to being removed from their parent grain using an in-situ
micromanipulator, and were then welded to the tines of an Omniprobe copper
support using electron and ion beam deposited platinum. Final thinning was then
performed using lower accelerating voltages and beam currents on these
supported thin foils to reduce the total thickness to less than ~60 nm in the
thinnest areas in order to facilitate EELS (Electron Energy Loss Spectroscopy),
without compromising the crystallinity. Initial characterisation of these foils by
diffraction-contrast imaging and SAED was performed using a FEI T20 TEM
operated at 200 kV. EELS analysis was performed using a JEOL ARM200F
equipped with a Gatan GIF Quantum Electron Energy Loss Spectrometer; the
EELS work was undertaken at an accelerating voltage of 80 kV in scanning TEM
(STEM) mode using line scans with a nominal step size of about 1 nm.

42
2.3.5 Kinetic analysis and calcite precipitation
A kinetic and thermodynamic analysis to determine calcite precipitation
rate constants and the critical saturation state at which calcite precipitation
initiates was performed as detailed by Tobler at al. (2011). This work was done
to determine if these parameters were affected by NP properties (size and
surface charge), either through NPs acting as nucleation sites for CaCO3
precipitation, or by interacting with crystal growth during NP occlusion. Details
of these calculations are described below.
The precipitation of calcite can be fitted to the following saturation-
dependent kinetic expression (Lasaga, Teng et al., 2000):
n
p Skdt
Cad)1(
][ 2
(1)
where kp represents the rate constant for calcite precipitation, S the saturation
state and n the reaction order. Based on the findings from Tobler et al. (2011),
the data presented here was fitted to first-order (n=1, (Dupraz et al., 2009) rate
laws.
The saturation state, S, with respect to calcite is defined by:
SOK
COCaS
}}{{2
3
2
(2)
where {Ca2+} and {CO32-} are the activities of dissolved Ca2+ and CO3
2-,
respectively, and KSO is the equilibrium calcite solubility product. The
geochemical code PHREEQC (version 2.13.3; (Parkhurst and Appelo, 1999) and
the wateq4 database (Ball and Nordstrom, 1992) were utilised to calculate S
values for each step. Here, dissolved inorganic carbon (CT), i.e., total dissolved
carbonate species (as produced by urea hydrolysis), increased over time
according to the following mass balance relationship:
TcalciteTureaTinitialT CCCC (3)
where CTinitial corresponds to the initial dissolved inorganic carbon
concentrations, CTurea is the amount of dissolved carbon produced by ureolysis
(CTurea = [NH4+]t / 2) and CTcalcite equals the dissolved carbon removed from
solution by calcite precipitation (CTcalcite = [Ca2+]intial - [Ca2+]t).

43
The change in saturation state with respect to time (dS /dt) can be described
using following first-order mass action:
SkK
COCak
dt
dSs
SO
s
}}{{2
3
2
(4)
From integration of equation 4, the change in calcite saturation state over
time can be described using:
tk
tseSS
0
(5)
where St is the saturation state at time t, S0 is the apparent saturation state if
precipitation is expected at time zero, and ks is a first order rate constant for
the change in saturation state. S values were calculated for each time step using
PHREEQC and the wateq4 database (W. and K., 1992)(W. and K., 1992)(W. and
K., 1992). S0 and ks were then determined from a plot of Ln S(t) vs. Ln S0 - kst.
The rate constant for calcite precipitation (kp) and Scrit, the critical
saturation at which precipitation initiates, can be determined from the following
first order reaction (Tobler et al., 2011).
crit
crit
crit
s
pCa
S
SSS
k
kCa ][ln][ 22
(6)
where Scrit is the critical saturation state at which precipitation starts, kp is the
calcite precipitation rate constant, and [Ca2+]crit is the dissolved Ca
concentration at Scrit (i.e., initial dissolved Ca2+ concentration).
To estimate Scrit and kp, Equation 2 was fitted to the experimental data
(i.e., S and [Ca2+] over time) using unconstrained nonlinear regression and a
quasi-Newton optimization routine for parameter estimation in the STATISTICA
v.6.0 software package(Ferris et al., 2004).
2.4 Results
2.4.1 Immobilisation of small negatively charged nanoparticles(s-negNP)
Solid-phase capture was first tested on the s-negNPs (zeta potential -38
mv). In all experiments apart for the abiotic control, urea hydrolysis was
44
complete within 10 hours (Figure 2.1a). This was accompanied by a sharp rise in
pH for the NP-I (nanoparticle immobilisation) and biotic control experiment
(Figure 2.2a). As a result, the solution in the NP-I experiment became highly
saturated with respect to calcium carbonate, resulting immediately in the
precipitation of calcite, as indicated by the rapid decrease in dissolved Ca2+
(Figure 2.3a). As calcium carbonate precipitated, the Fe concentration in
solution decreased asymptotically indicating the removal of suspended NPs
(Figure 2.4a). Importantly, once Ca2+ removal ceased after 10 hours, no further
decrease in Fe concentration, i.e., NP removal, was observed. Over 80% of the s-
negNPs were removed within 1 day, with the majority of this occurring within
only 6 hours. By contrast no NP removal was observed in the biotic (S. pasteurii
+ NP + urea) or abiotic (NP + CaCl2 + urea) control for the s-negNP experiments
(Figure 2.4a and b), confirming that NP removal occurred only due to calcium
carbonate precipitation (as opposed to, for example, aggregation or attachment
to bacteria or the reaction vessel walls).
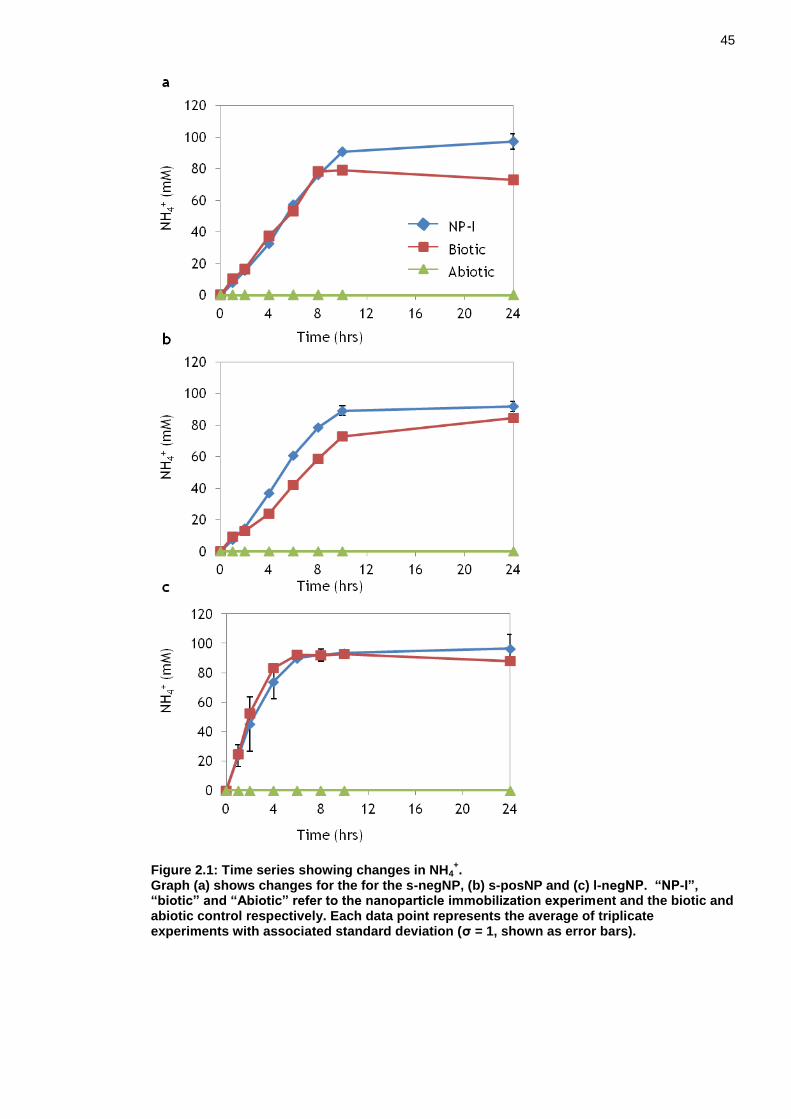
45
Figure 2.1: Time series showing changes in NH4+.
Graph (a) shows changes for the for the s-negNP, (b) s-posNP and (c) l-negNP. “NP-I”, “biotic” and “Abiotic” refer to the nanoparticle immobilization experiment and the biotic and abiotic control respectively. Each data point represents the average of triplicate experiments with associated standard deviation (σ = 1, shown as error bars).
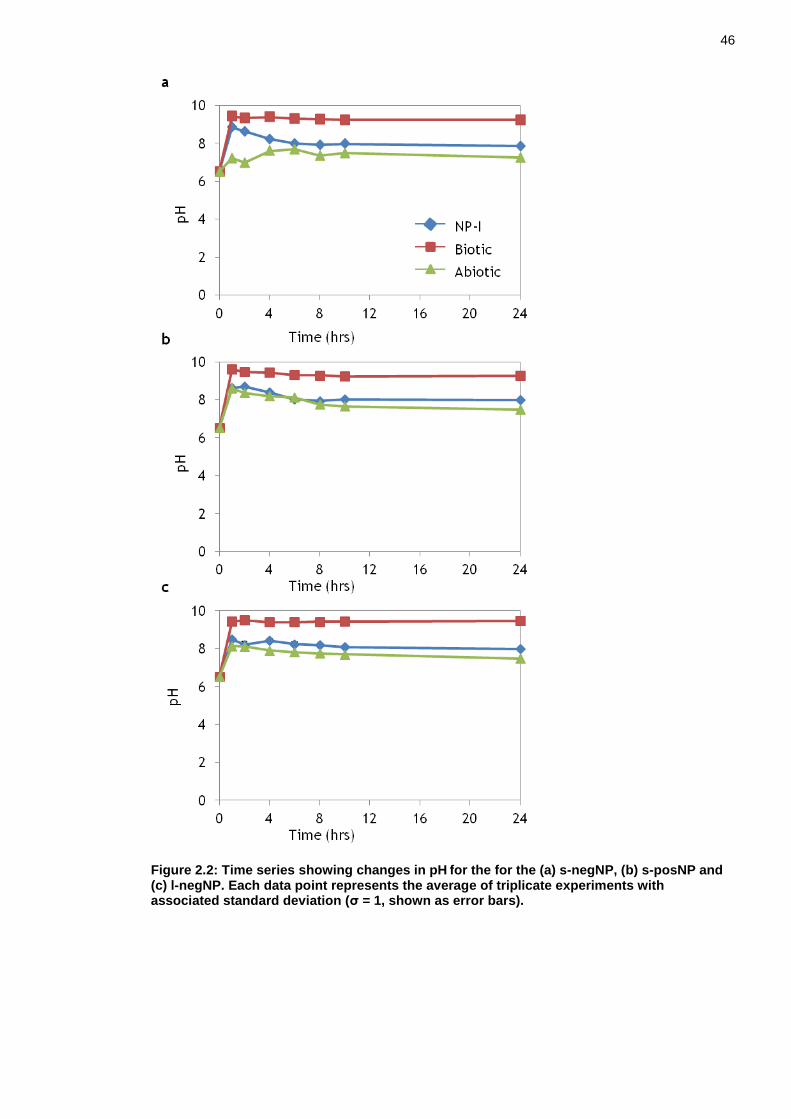
46
Figure 2.2: Time series showing changes in pH for the for the (a) s-negNP, (b) s-posNP and
(c) l-negNP. Each data point represents the average of triplicate experiments with associated standard deviation (σ = 1, shown as error bars).
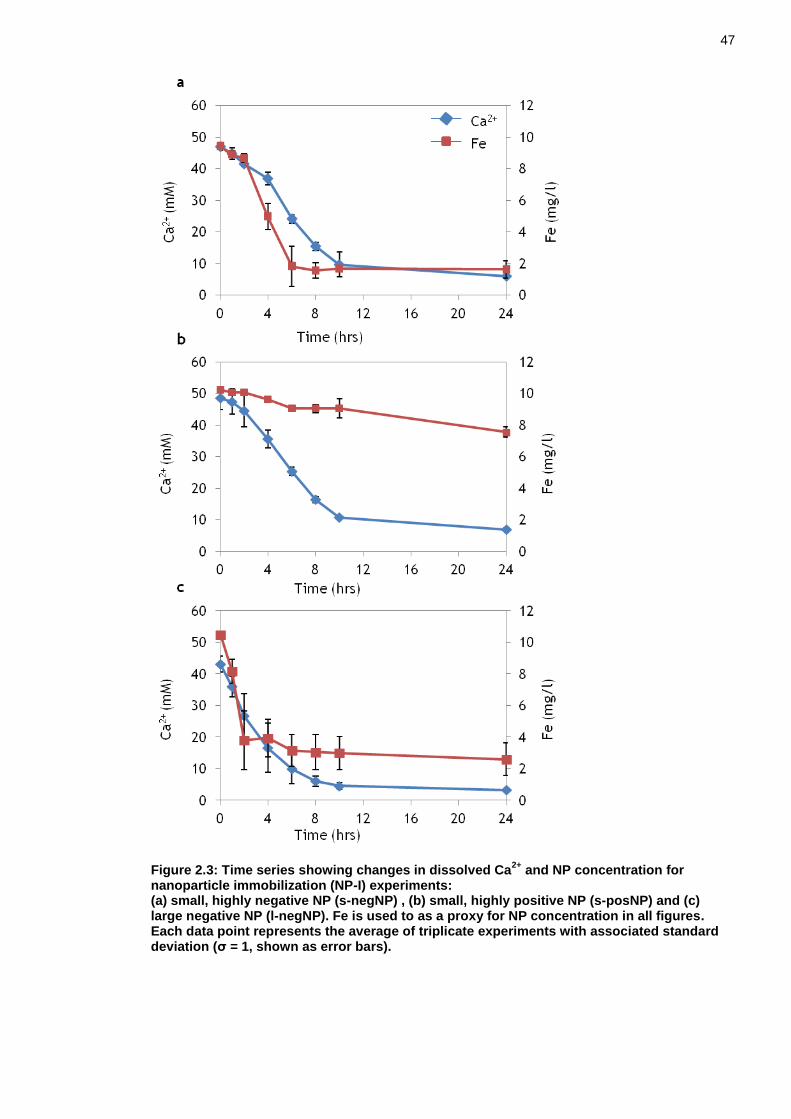
47
Figure 2.3: Time series showing changes in dissolved Ca2+
and NP concentration for nanoparticle immobilization (NP-I) experiments: (a) small, highly negative NP (s-negNP) , (b) small, highly positive NP (s-posNP) and (c) large negative NP (l-negNP). Fe is used to as a proxy for NP concentration in all figures. Each data point represents the average of triplicate experiments with associated standard deviation (σ = 1, shown as error bars).

48
Figure 2.4: Time series showing changes in Fe (NP) concentration for the (a) biotic and (b) abiotic control for all NP types tested.
2.4.2 Immobilisation of small positively charged nanoparticles (s-posNP)
In order to compare the capture efficiency of NPs with different surface
charges, s-posNPs were also tested (zeta potential: +48 mV). Apart from surface
charge, these NPs were identical to the s-negNPs discussed above. In these
experiments, rates of urea hydrolysis, pH increase and removal of dissolved Ca2+
(as a result of calcite precipitation) were almost identical to those observed for
the s-negNP experiment (Figure 2.1 - 3). However, the Fe trajectory for the s-
posNP remediation experiment exhibited intriguingly different results (Figure
2.4b). Poor NP capture was observed with only 26% of the s-posNPs removed
compared to the removal of 83% of the s-negNPs (Figure 2.4a - b). The
contrasting results of s-neg and s-pos NPs capture are further illustrated in
Figure 2.5, where the % NP capture is compared against % precipitated calcium
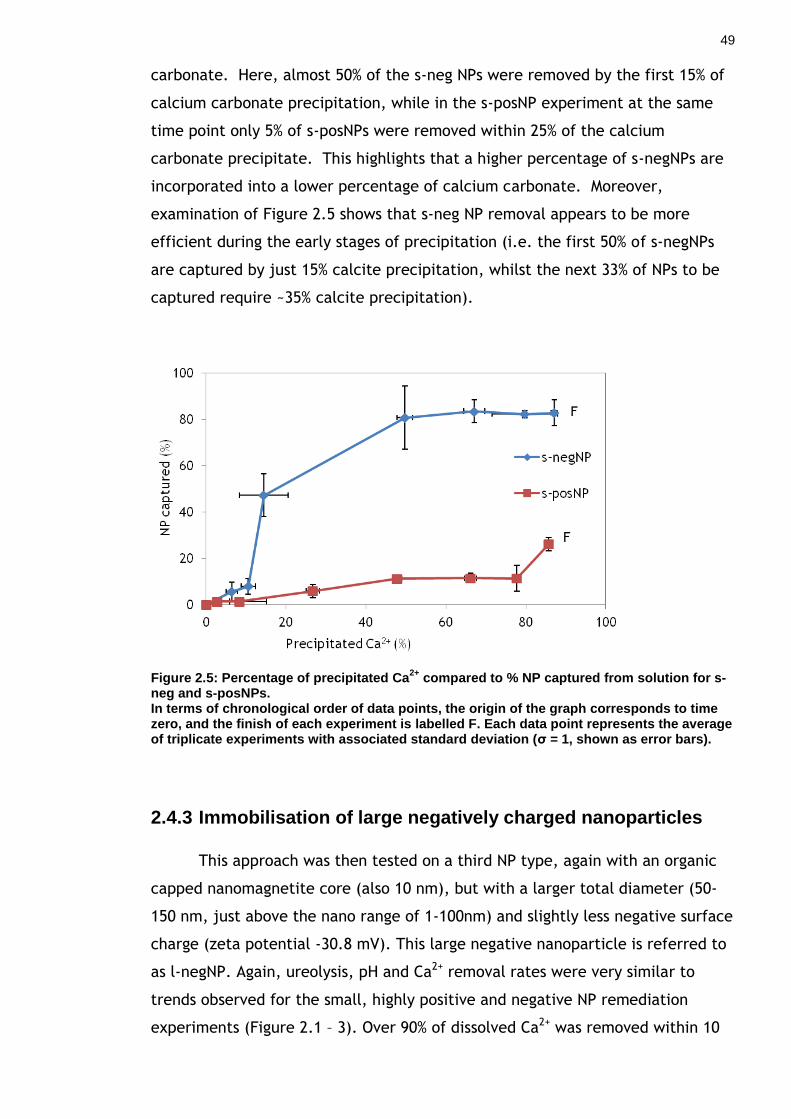
49
carbonate. Here, almost 50% of the s-neg NPs were removed by the first 15% of
calcium carbonate precipitation, while in the s-posNP experiment at the same
time point only 5% of s-posNPs were removed within 25% of the calcium
carbonate precipitate. This highlights that a higher percentage of s-negNPs are
incorporated into a lower percentage of calcium carbonate. Moreover,
examination of Figure 2.5 shows that s-neg NP removal appears to be more
efficient during the early stages of precipitation (i.e. the first 50% of s-negNPs
are captured by just 15% calcite precipitation, whilst the next 33% of NPs to be
captured require ~35% calcite precipitation).
Figure 2.5: Percentage of precipitated Ca2+
compared to % NP captured from solution for s-neg and s-posNPs. In terms of chronological order of data points, the origin of the graph corresponds to time zero, and the finish of each experiment is labelled F. Each data point represents the average of triplicate experiments with associated standard deviation (σ = 1, shown as error bars).
2.4.3 Immobilisation of large negatively charged nanoparticles
This approach was then tested on a third NP type, again with an organic
capped nanomagnetite core (also 10 nm), but with a larger total diameter (50-
150 nm, just above the nano range of 1-100nm) and slightly less negative surface
charge (zeta potential -30.8 mV). This large negative nanoparticle is referred to
as l-negNP. Again, ureolysis, pH and Ca2+ removal rates were very similar to
trends observed for the small, highly positive and negative NP remediation
experiments (Figure 2.1 – 3). Over 90% of dissolved Ca2+ was removed within 10

50
hours capturing 75% of the l-negNPs (Figure 2.3c), which was 8% less than for the
s-negNP experiment. As shown in Figure 2.4a and c, a large percentage of
negative NPs were captured with a small percentage remaining in solution.
Following this, another experiment was devised to determine whether the
remaining l-neg NPs in solution could be captured if the system was re-doped
with CaCl2 and urea to stimulate further calcium carbonate precipitation. Figure
2.6 shows that with a second injection of CaCl2 and urea (yielding final
concentrations of 50 mM each), further calcium carbonate precipitation
occurred thereby capturing the remaining suspended NPs by solid phase capture.
Notably, this suggests that 100% NP removal may be achieved with repeated
injections of CaCl2 and urea.
Figure 2.6: Time series showing Fe (NP) concentration during the double dose experiment for the l-negNP. The red arrow highlights when the second dose of CaCl2 and urea was injected.
2.5 Mineral analysis by Transmission Electron Microscopy (TEM)
Calcium carbonate precipitated in the NP-I experiments adhered to the
walls of the glass beakers and any surfaces within them (such a glass slides to
capture precipitates for SEM and TEM analysis). With negative NPs precipitates
formed were brown-orange in colour due to the incorporation of the red
coloured NPs (Figure 2.7a). In contrast, calcite precipitated by the same
method but in the absence of NPs produced a near-white precipitate (Figure
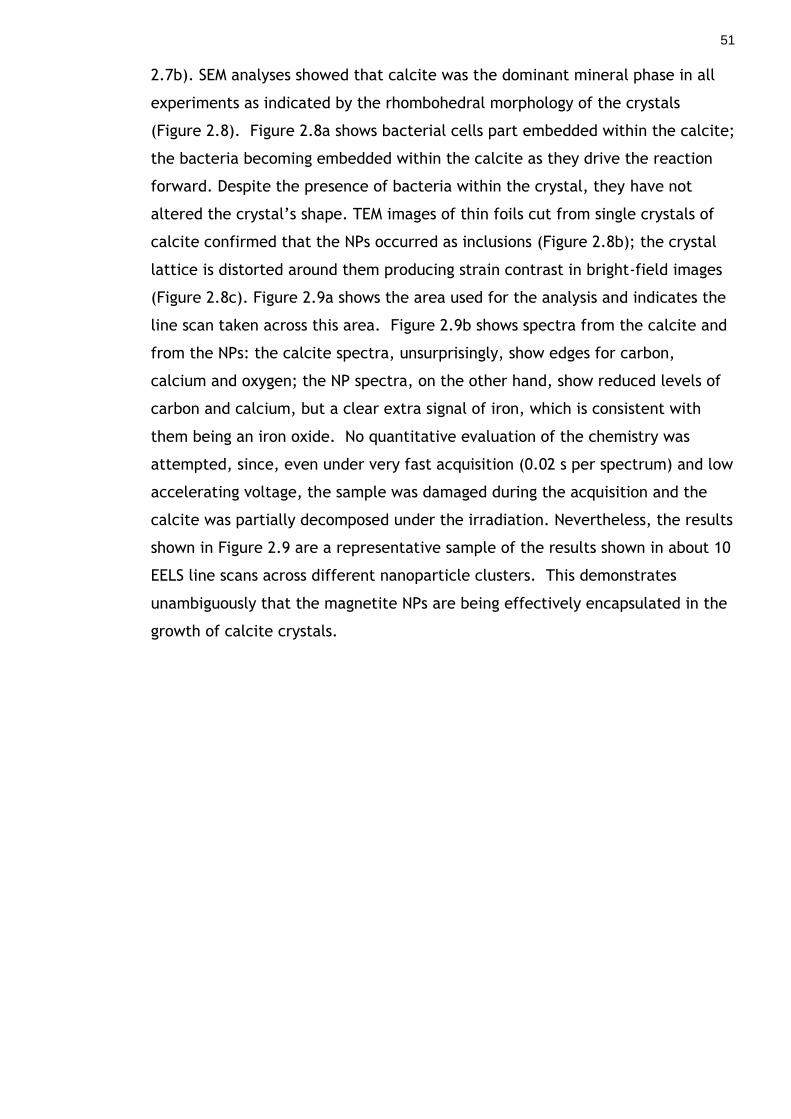
51
2.7b). SEM analyses showed that calcite was the dominant mineral phase in all
experiments as indicated by the rhombohedral morphology of the crystals
(Figure 2.8). Figure 2.8a shows bacterial cells part embedded within the calcite;
the bacteria becoming embedded within the calcite as they drive the reaction
forward. Despite the presence of bacteria within the crystal, they have not
altered the crystal’s shape. TEM images of thin foils cut from single crystals of
calcite confirmed that the NPs occurred as inclusions (Figure 2.8b); the crystal
lattice is distorted around them producing strain contrast in bright-field images
(Figure 2.8c). Figure 2.9a shows the area used for the analysis and indicates the
line scan taken across this area. Figure 2.9b shows spectra from the calcite and
from the NPs: the calcite spectra, unsurprisingly, show edges for carbon,
calcium and oxygen; the NP spectra, on the other hand, show reduced levels of
carbon and calcium, but a clear extra signal of iron, which is consistent with
them being an iron oxide. No quantitative evaluation of the chemistry was
attempted, since, even under very fast acquisition (0.02 s per spectrum) and low
accelerating voltage, the sample was damaged during the acquisition and the
calcite was partially decomposed under the irradiation. Nevertheless, the results
shown in Figure 2.9 are a representative sample of the results shown in about 10
EELS line scans across different nanoparticle clusters. This demonstrates
unambiguously that the magnetite NPs are being effectively encapsulated in the
growth of calcite crystals.

52
Figure 2.7: Photographs of glass slides placed at the bottom of the microcosms showing (a) brown – orange coloured calcium carbonate precipitates in the presence of negatively charged NPs (l-negNPs in this example), and (b) white calcium carbonate precipitated in the absence of NPs and. Scale bars both 10 mm.
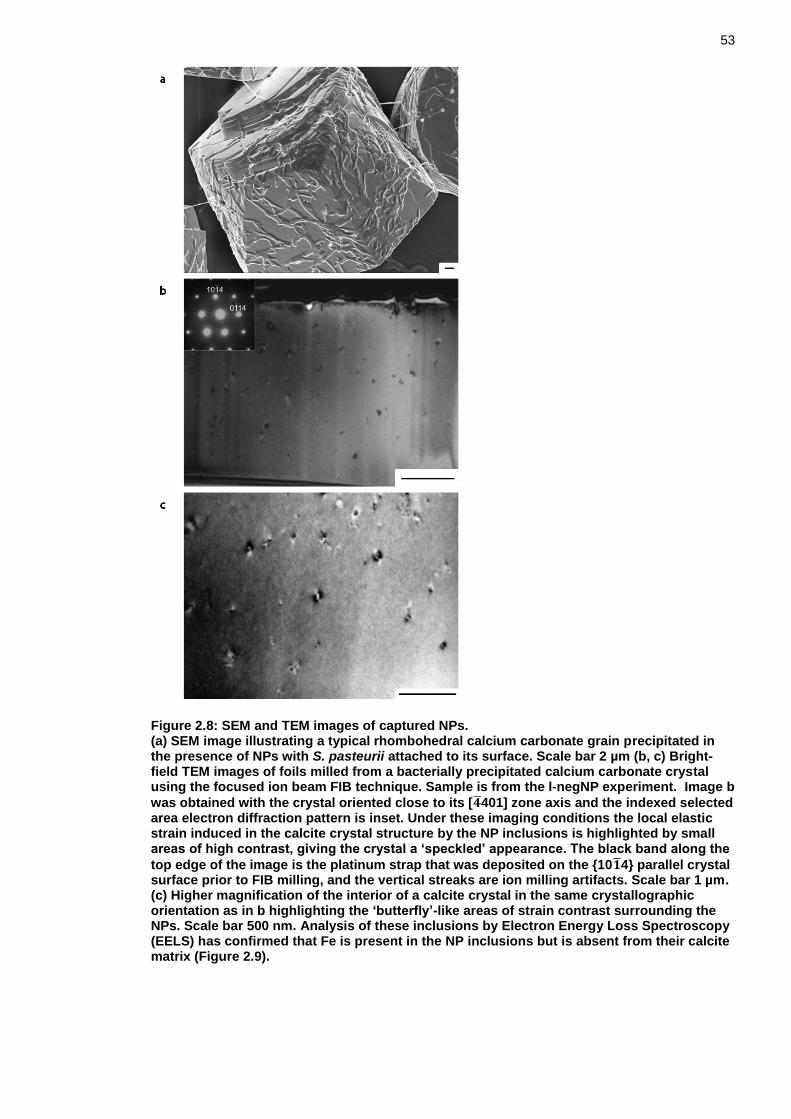
53
Figure 2.8: SEM and TEM images of captured NPs. (a) SEM image illustrating a typical rhombohedral calcium carbonate grain precipitated in the presence of NPs with S. pasteurii attached to its surface. Scale bar 2 µm (b, c) Bright-field TEM images of foils milled from a bacterially precipitated calcium carbonate crystal using the focused ion beam FIB technique. Sample is from the l-negNP experiment. Image b
was obtained with the crystal oriented close to its [ 401] zone axis and the indexed selected area electron diffraction pattern is inset. Under these imaging conditions the local elastic strain induced in the calcite crystal structure by the NP inclusions is highlighted by small areas of high contrast, giving the crystal a ‘speckled’ appearance. The black band along the
top edge of the image is the platinum strap that was deposited on the {10 4} parallel crystal surface prior to FIB milling, and the vertical streaks are ion milling artifacts. Scale bar 1 µm. (c) Higher magnification of the interior of a calcite crystal in the same crystallographic orientation as in b highlighting the ‘butterfly’-like areas of strain contrast surrounding the NPs. Scale bar 500 nm. Analysis of these inclusions by Electron Energy Loss Spectroscopy (EELS) has confirmed that Fe is present in the NP inclusions but is absent from their calcite matrix (Figure 2.9).

54
Figure 2.9: (a) STEM image of an area of calcite crystal containing a cluster of NPs (black dots). An EELS line scan was taken along the line indicated; (b) two EELS spectra calculated from the data in the line scan, the blue spectrum comes from summing the spectra for the blue part of the line scan indicated in (a) in the calcite, the orange spectrum comes from summing the spectra in the orange part of the line scan indicated in (a) in the NP region.
2.6 Discussion
In this study, NPs with a negative surface charge (s-neg NPs and l-neg) were
successfully captured, whilst the immobilisation of positively charged NPs (s-
posNP) was less effective. Unlike solid-phase capture of dissolved ions such as
Sr90, NPs will not be incorporated into the crystal lattice by isomorphic
replacement of calcium. Instead, NPs must be smothered and trapped within
the mineral as it precipitates, immobilising the NP within the precipitate.
The large variations in capture efficiency between the positive and
negative NPs may be attributed to electrostatic interactions controlling either
nucleation, nanoparticle occlusion, or indeed both. The immobilisation of
negative NPs is extremely efficient. This could, for example, be due to Ca2+ ions
binding to their charged surfaces. The bound Ca2+ could then react with
carbonate anions, facilitating calcium carbonate nucleation upon the NP. The
negative NPs would therefore facilitate nucleation of mineral phases by
providing preferential nucleation sites which act to lower the activation energy
for nucleation. However, the calculated critical saturation (Scrit) required for
calcite nucleation yielded similar values for all NP types tested (Table 2.2). If
NPs were acting as nucleation sites it would be expected that Scrit values for the
s-neg and l-negNPs would be lower than for the s-posNPs. This, however, was not
observed. Certainly, where fits (R2 values) are better than 0.9, Scrit values are
similar and considering the spread of values (note that some of the spread of Scrit
55
values is due to poorer fits), no significant evidence of NP type impacting Scrit is
evident using this approach. Instead, it is suggested here that due to the
oversaturation of calcium carbonate under these experimental conditions (high
pH and excess of Ca2+ and CO32- ions), it is likely that homogenous nucleation
(i.e., nucleation without a surface catalyst) was the predominant route for
calcium carbonate nucleation to occur.
Table 2.2: Summary of kinetic parameters. For calcite precipitation rate constant (kp, in mM d
-1) and critical saturation state at which
calcite precipitates (Scrit)
NP Exp kp (R2 values) Scrit (R
2 values)
s-negNP 1 0.11 (0.93) 2.02 (0.93)
s-negNP 2 0.02 (0.66) 2.17 (0.66)
s-negNP 3 0.09 (0.73) 2.21 (0.73)
s-posNP 1 -a -a
s-posNP 2 0.09 (0.96) 2.12 (0.96)
s-posNP 3 0.04 (0.81) 2.25 (0.81)
l-negNP 1 0.12 (0.92) 2.11 (0.92)
l-negNP 2 0.02 (0.55) 2.45 (0.55)
l-negNP 3 -a -a
a Parameter estimation failed
As nucleation of calcium carbonate upon NPs does not appear to be key to
the capture process, then NP capture is likely dominated by NP attachment onto
growing calcite surfaces; the NP eventually becoming overtaken by the growing
solidification front and thus occluded. This process has been explored in non-
biologically driven encapsulation of foreign particles, motivated by the desire to
develop novel composite materials and control mineral growth (Kim et al.,
2010b, Lu et al., 2005). The successful incorporation of a foreign particle is
determined by the interactions which occur between a particle and the
56
advancing solidification front (Asthana and Tewari, 1993, Rempel and Worster,
1999). These interactions determine whether a particle becomes occluded by
the solid or whether it is pushed ahead of the solid-liquid interface and thus
remains untrapped. At the pH range in this study, calcite exhibits a positive
surface charge (Eriksson et al., 2007). Here, electrostatic attraction between
the negative nanoparticle and positive calcite surface would facilitate occlusion,
while electrostatic repulsion between positive NP and positive calcite surface
would inhibit occlusion. The finding here that negative NPs were captured with
greater efficiency is consistent with previous studies that have examined
occlusion of functionlised latex colloids (220 – 250 nm in diameter) into non-
biogenically precipitated calcite (Kim et al., 2010b). Their work reported
greater incorporation of particles with higher abundances of anionic surface
groups. In addition to electrostatic interactions, viscous drag (generated by the
particle being pushed ahead of the solidification front) and van der Waals forces
play an important role in mediating occlusion. Viscous drag on the particle and
attractive van der Waals forces facilitate particle entrapment, while repulsive
van der Waals forces inhibit entrapment (Kim et al., 2010b). In the case of the
negatively charged NPs in this study, electrostatic attraction combined with
viscous drag must have dominated over repulsive forces to facilitate occlusion of
negatively charged NPs. Conversely, the dominance of electrostatic repulsion
ensured the positive NPs were incorporated less effectively. Any removal of
positively charged NPs must be attributed to viscous drag and attractive van der
Waals forces.
The potential for NP attachment to calcite precipitates can be evaluated
using the classical Derjaguin-Landau-Verwey-Overbeek (DLVO) model. The total
interaction (Vtotal) between two charged surfaces can be described as the sum of
the van der Waals (VvdW) and electrostatic energy (Velec):
The equations presented here assume that the NP is a sphere of dextran as
opposed to magnetite because the 10 nm magnetite core is surrounded by a 25
nm thick layer of dextran, thus surface interactions will be between calcite and
dextran. Moreover, the carboxyl and amine functional groups which impart the
nanoparticle charge are on the dextran, not the magnetite. The system
modelled here is represented by the Lifshitz-van der Waals attraction energy for
57
a sphere – plate interaction with the NP assigned as a sphere and calcite
precipitate the flat plate as the NP is infinitely smaller than the calcite
precipitate. The Debye length ( ) is inversely related to the thickness of the
diffuse double layer and was calculated using the equation adapted from
(Bradford and Torkzaban, 2008):
here is the permittivity of free space (8.854x10⁻¹²F/m), is the dielectric
constant of water (78.5), is the Boltzmann constant, is the temperature
(298 K), is the Avogadro’s number, is the electronic charge(1.6 x10⁻²³C),
and is the ionic strength of the medium (as the ionic strength of the medium
changed throughout the duration of the experiment, only the starting ionic
strength was calculated as 150 M/m3).
The sum of the interaction energies is described bellow as documented by
(Hong et al., 2009):
where is the NP radius, and are the zeta potentials of the NP and
calcite precipitates respectively and is the characteristic wavelength of the
medium (100 nm). denotes the Hamaker constant for the system described
as follows:
= (
where is the Hamaker constant of NPs, is the Hamaker constant for
calcite and is the Hamaker constant for water. All tested parameters can be
seen in

58
Table 2.3.

59
Table 2.3: Summary of the parameters for used in DLVO equations
Parameter Unit Value Reference
S-neg/pos NP
radius ( )
m 1.75 x10⁻⁸ Manufacturers
guidelines
(Biopal, Inc.™)
L-negNP radius
( )
m 5.25 x10⁻⁸ Manufacturers
guidelines
(Biopal, Inc.™)
S-negNP zeta
potential
V -0.038 Manufacturers
guidelines
(Biopal, Inc.™)
S-posNP zeta
potential
V
0.048
Manufacturers
guidelines
(Biopal, Inc.™)
S-negNP zeta
potential
V -0.030 Manufacturers
guidelines
(Biopal, Inc.™)
Calcite zeta
potential
V 0.04 (Eriksson et al.,
2007)
Ionic strength M/m3 150 Calculated
Debye length ( ) m-1 7.93 x 10⁻¹⁰ Calculated
Hamaker
constant of NPs
( )
J 1.8 x 10⁻¹⁹ (Hu et al., 2010)
Hamaker
constant of
calcite ( )
J 8.02 x 10⁻²⁰ (Tufenkji and
Elimelech, 2003)
Hamaker
constant of water
J 3.07 x 10⁻²⁰ (Tufenkji and
Elimelech, 2003)
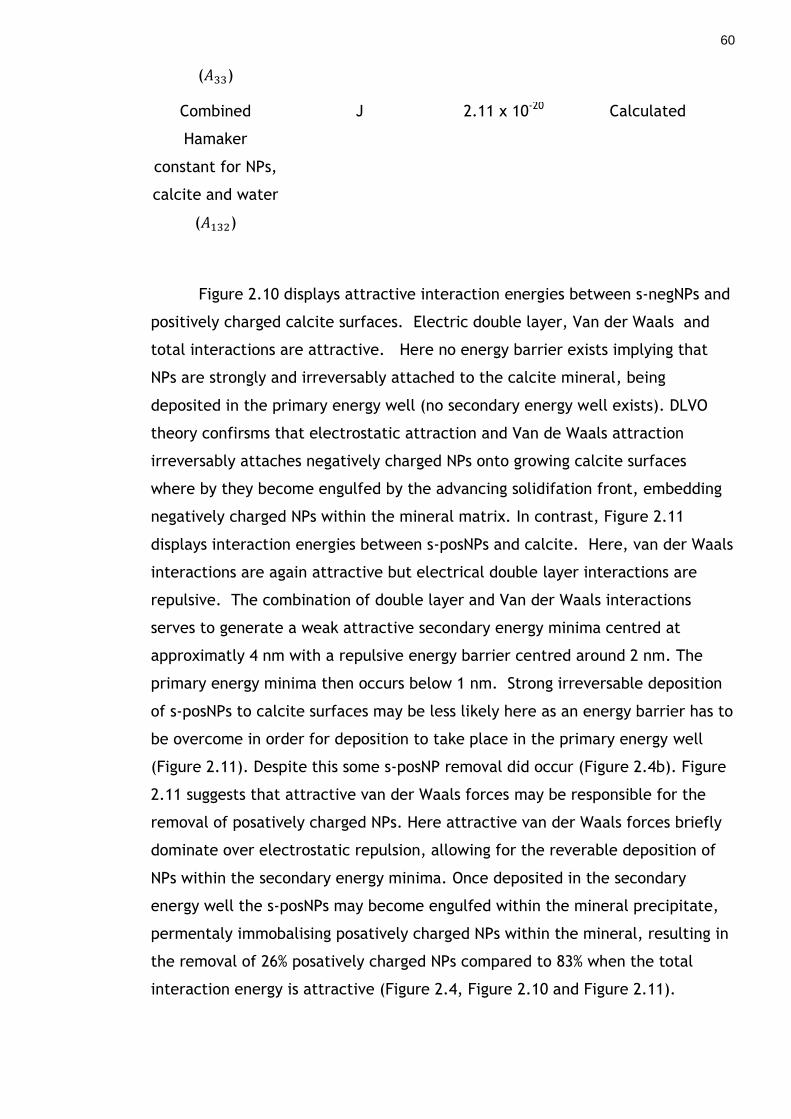
60
( )
Combined
Hamaker
constant for NPs,
calcite and water
( )
J 2.11 x 10⁻²⁰ Calculated
Figure 2.10 displays attractive interaction energies between s-negNPs and
positively charged calcite surfaces. Electric double layer, Van der Waals and
total interactions are attractive. Here no energy barrier exists implying that
NPs are strongly and irreversably attached to the calcite mineral, being
deposited in the primary energy well (no secondary energy well exists). DLVO
theory confirsms that electrostatic attraction and Van de Waals attraction
irreversably attaches negatively charged NPs onto growing calcite surfaces
where by they become engulfed by the advancing solidifation front, embedding
negatively charged NPs within the mineral matrix. In contrast, Figure 2.11
displays interaction energies between s-posNPs and calcite. Here, van der Waals
interactions are again attractive but electrical double layer interactions are
repulsive. The combination of double layer and Van der Waals interactions
serves to generate a weak attractive secondary energy minima centred at
approximatly 4 nm with a repulsive energy barrier centred around 2 nm. The
primary energy minima then occurs below 1 nm. Strong irreversable deposition
of s-posNPs to calcite surfaces may be less likely here as an energy barrier has to
be overcome in order for deposition to take place in the primary energy well
(Figure 2.11). Despite this some s-posNP removal did occur (Figure 2.4b). Figure
2.11 suggests that attractive van der Waals forces may be responsible for the
removal of posatively charged NPs. Here attractive van der Waals forces briefly
dominate over electrostatic repulsion, allowing for the reverable deposition of
NPs within the secondary energy minima. Once deposited in the secondary
energy well the s-posNPs may become engulfed within the mineral precipitate,
permentaly immobalising posatively charged NPs within the mineral, resulting in
the removal of 26% posatively charged NPs compared to 83% when the total
interaction energy is attractive (Figure 2.4, Figure 2.10 and Figure 2.11).
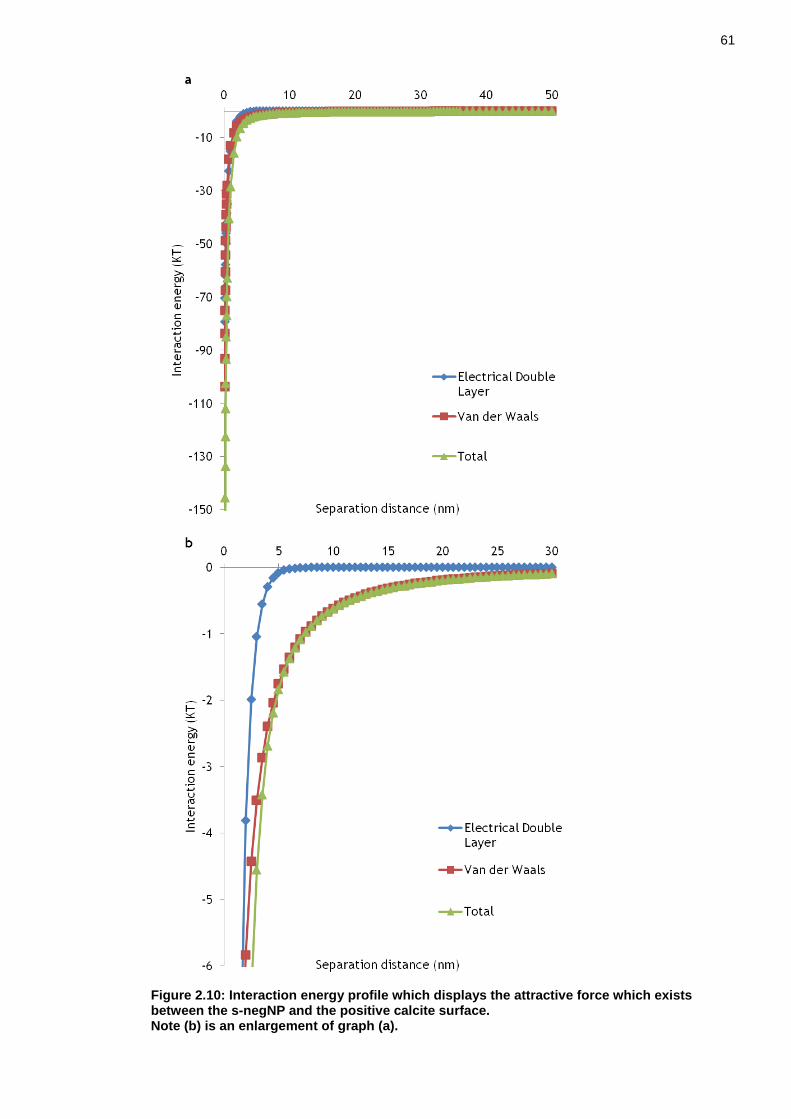
61
Figure 2.10: Interaction energy profile which displays the attractive force which exists between the s-negNP and the positive calcite surface. Note (b) is an enlargement of graph (a).
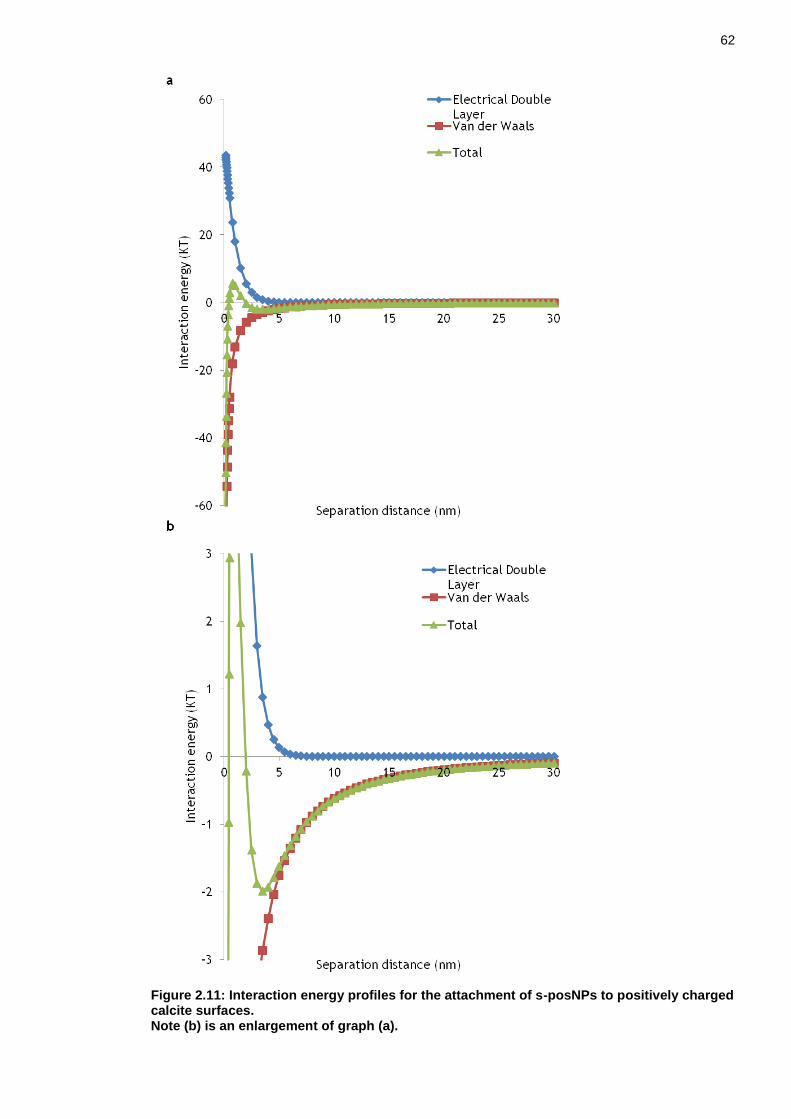
62
Figure 2.11: Interaction energy profiles for the attachment of s-posNPs to positively charged calcite surfaces. Note (b) is an enlargement of graph (a).

63
Figure 2.12: Interaction energy profiles for the attachment of l-negNPs to positively charged calcite surfaces. Note (b) is an enlargement of graph (a).
64
In this study, the l-negNP was incorporated marginally less effectively
than the s-negNP. 75% of the l-negNPs were removed through solid phase
capture versus 83% for the s-negNP (Figure 2.4a and c). This difference may be
due to the smaller negative charge on the l-negNP (-30.8 mV) compared to the s-
negNP (-38 mV). However, according to the DLVO model presented here, (Figure
2.12) does not agree with the observed findings. Instead, attraction between the
l-negNPs and the positive calcite surface is stronger under these conditions, with
attraction occurring from as far as 25-30 nm separation distance compared to 5-
10 nm for the s-negNP. This combined with greater viscous drag acting on the
larger NP which acts to facilitate occlusion fails to account for why fewer l-
negNPs were incorporated compared to s-negNPs. Some other unknown
mechanism must be operating here.
Despite the greater occlusion of negative NPs into calcite compared to
positive NPs, this did not appear to have a notable impact on kp, the calcite
precipitation rate constant. Considering only those with fits (R2 values) better
than 0.9, the kp values are broadly similar between NP types (Table 2.2). This is
consistent with the lack of notable difference in Scrit. Again, it would appear
calcite supersaturation is sufficiently high enough to drive precipitation
uninfluenced by NP presence.
In this study, kp and Scrit which describe CaCO3 precipitation show little or
no dependence on NP type. While this must be explored at higher NP
concentrations and for other NP types, the relative invariability between
systems could make implementation in the field simpler. Calcite precipitation
would be independent of NP type and therefore easier to predict.
The observation that s-negNPs are removed at a faster rate during the
early stages of calcium carbonate precipitation (Figure 2.5) may be explained by
invoking a shift from homogeneous to heterogeneous nucleation during the
experiment. During the early stages, calcite nuclei are forming homogenously
and consequently growing in suspension. It is during this early stage of
crystallisation that most NPs are being removed. However, during the later
stages of the experiment, the saturation state with respect to calcite is greatly
reduced (due to calcite precipitation) and thus precipitation may occur
preferentially on pre-formed precipitates, i.e. those crystals that have already
settled to the bottom of the reaction flask or adhered to its walls. Thus

65
homogenous nucleation and growth in suspension is greatly reduced, leaving
uncaptured NPs in solution. At this point a reinjection of calcium carbonate and
urea is required allowing for further calcite precipitation to occur
homogeneously in suspension. Figure 2.6 shows that stimulating another
homogeneous nucleation event results in 100% removal of l-negNPs through solid
phase capture. If this hypothesis is correct, it has implications for possible in-
field application of this method, i.e. NP immobilisation would be improved by
multiple injections.
Ureolytic bacteria such as S. pasteurii have been proposed as being
suitable for a number of subsurface applications. The urease enzyme (urea
amidohydrolase) can be produced by many groundwater bacteria and as a
consequence the natural indigenous community may be manipulated for such
applications (Tobler et al., 2011). However, where bacterial communities are
not sufficiently active to produce the rates of ureolysis required to precipitate
sufficient volumes of calcite, the indigenous ureolytic community may be
stimulated by a carbon source to increase biomass and encourage ureolysis.
Such an option has been explored for the solid-phase capture of 90Sr from
contaminated aquifers (Fujita et al., 2008). Alternatively, an ex-situ cultured
ureolytic bacterium such as S. pasteurii may be injected into the site of interest
(Cuthbert et al., 2012, Tobler et al., 2011).
Notably, biotic and abiotic controls all remained stable, with regards to
NP removal, except for the biotic control of the s-posNP (Figure 2.4). In those
control experiments where no NP removal occurs, NPs are free from aggregation
and do not adhere to the bacterial surface. Whilst in the biotic control of the s-
posNP, despite the lack of calcite precipitation (due to the absence of Ca2+),
rapid loss of NPs occurred with over 60% being removed within 12 hours. The cell
surface of S. pasteurii and almost all bacteria is negatively charged over the pH
range of these experiments (Yee et al., 2004), which evidently led to a strong
electrostatic attraction for positive nanoparticles. As the bacteria settled from
solution they concomitantly removed s-posNPs. This process highlights the
potential of bacterial surfaces to immobilize NPs in the natural environment and
engineered wastewater treatment systems (Limbach et al., 2008, Brar et al.,
2010). We speculate similar attachment of positive NPs did not occur in the
reaction where calcite precipitation occurred due to masking of the bacterial
surface, either by bound Ca2+ or precipitated calcite.
66
While this study has focused upon bacterially driven calcite precipitation,
there are numerous other microbially driven mineral precipitation systems which
have the potential for solid phase capture of NPs, such as the oxidation of Mn(II)
(Sujith and Bharathi, 2011) and Fe(II) (Glasauer et al., 2002), or enzymatic
precipitation of phosphate minerals (Schulz and Schulz, 2005). Critically, the
variety of minerals that can be precipitated by bacteria display a range of
surface charges at typical groundwater pHs (Harding et al., 2005, Gray et al.,
1978, Glasauer et al., 2001) enabling them to interact with a wide variety of NP
surface charges. Thus it may be possible to choose a remediation system to
specifically target the NPs surface character.
2.7 Conclusion
The results presented here demonstrate that microbially mediated calcite
precipitation successfully captured negatively charged NPs whilst positively
charged NPs were captured much less successfully. DLVO theory indicated this
was due to electrostatic attraction generating a strong primary energy minima
between calcite and negative NPs, while electrostatic repulsion generated a
week secondary energy minima and repulsive energy barrier between calcite and
positive nanoparticles. kp and Scrit values were broadly similar for all NP types
tested suggesting NPs were not acting as nucleation sites for calcium carbonate
and that NP type did not impact precipitation rate S-posNPs were removed from
solution due to the sorption of NPs to the negative charge of the bacterial
surface. Microbially mediated calcite precipitation has the potential to
immobilise NPs, impacting their transport and fate in environmental systems.

67
3 Immobilisation of nanoparticles through porous media by calcium carbonate precipitation
3.1 Summary
Experiments presented in Chapter 2 demonstrated that microbially
mediated calcium carbonate precipitation successfully removed negatively
charged nanoparticles (NPs) through solid phase capture in batch reactors. Here
we demonstrate the potential for microbially mediated calcium carbonate
precipitation to remove negatively charged NPs in porous media. Negatively
charged NPs were shown to be highly mobile through sand and glass packed
columns when suspended in sterile deionised water. Inducing calcite
precipitation within the columns resulted in reduced NP mobility in all porous
media types tested. It is hypothesised that as ureolysis commenced, calcium
carbonate precipitation occurred around the NPs, on grain boundaries and also
possibly heterogeneously in solution. Continual calcite growth occluded NPs.
Gravitational settling from suspension of NP-mineral composites resulted in the
cementation of NPs within the column. These findings demonstrate that
microbially mediated calcium carbonate precipitation may be used as a tool to
reduce NP mobility in environmental systems.
3.2 Introduction
The mobility of NPs through porous media has been intensely studied due
to the possibility of NP pollution in the subsurface. Research has shown that
particle specific properties (e.g. size, shape, surface charge and the presence of
capping agents) as well as solution chemistry (e.g. pH, ionic strength, ionic
strength and natural organic content) strongly influence NP mobility through
environmental systems, see Chapter 1.1.4 for further details (El Badawy et al.,
2013, Petosa et al., 2010, Franchi and O'Melia, 2003). Other factors influencing
NP mobility include Brownian diffusion (Dunphy Guzman et al., 2006),
gravitational sedimentation and straining effects (Bradford et al., 2002). Under
favourable, i.e. non-repulsive conditions, NP-NP and NP-surface interactions
result in the deposition of NPs onto collector surfaces, thus significantly reducing
NP mobility. Despite this, long-range transport within the subsurface is possible
68
(Wiesner et al., 2006). NPs are increasingly designed to exhibit enhanced
stability through surface modifications such as capping agents (see chapter 1.1.4
for more details on stabilising NPs, Kvitek et al., 2008, Lecoanet et al., 2004).
NPs with enhanced stability have greater potential for exposure to aquatic
organisms and humans (Wiesner et al., 2006). Furthermore, NPs have the ability
to bind and transport pre-existing contaminants within the subsurface,
dispersing contaminants over a large area (Moore, 2006).
Much work is being done to determine the fate and transport of NPs within
the environment. However, none have looked at the possibility of reducing NP
mobility or indeed immobilising NPs within the subsurface. This knowledge gap
requires attention as technologies which can prevent pollutant NPs from
migrating through groundwater and contaminating natural and drinking water
resources is required. In this study we investigate the potential for biologically
induced calcite precipitation to immobilise NPs within porous media. Chapter 2
demonstrated that ureolysis driven calcite precipitation was extremely effective
in immobilising negatively charged NPs in batch reactors. Here, we wish to
examine the potential of ureolysis driven calcite precipitation to immobilise NPs
in porous matrices thereby inhibiting further transport.
3.3 Materials and methods
3.3.1 and porous media
Here, the transport and immobilisation of negatively charged NPs (these
are the s-negNPs referred to in Chapter 2) in porous matrices as a function of
grain size and type was tested. Note that the positively charged NPs (as used in
chapter 2) were not tested here as they are poorly captured by ureolysis driven
calcite precipitation.
Four different porous media were investigated which included 3 different
size fractions of glass beads (fine: 0.1-0.25 mm, medium: 0.6-1.8 mm, and
coarse: 2 mm) and a quartz sand (0.1-0.4 mm). SiO2 – based porous matrices
were chosen as they exhibit negatively charged surfaces (Behrens and Grier,
2001), thus the electrostatic repulsion between the SiO2 grains and the
negatively charged NPs would enhance NP mobility through the columns, and
reduce attachment to grains. The relatively high mobility of NPs in these systems

69
would thus enable us to detect any immobilisation by solid-phase capture.
Moreover, the SiO2 based porous matrices used here are analogous to the sands
and sandstones of many aquifer systems.
Spherical glass beads (Retsch, Germany) with different grain sizes were
utilised. The grain size was measured using a light-scattering particle size
analyzer (Coulter LS 2300). The glass beads ranged from fine with a size range of
0.1-0.25 mm with a mean size of 0.17 mm, medium range from 0.6-1.8 mm with
a mean of 1 mm and coarse beads 2 mm (too large to be measured by the
particle size analyser, these were instead sieved to determine grain size). The
beads were cleaned with 50 % hydrochloric acid, washed repeatedly with sterile
deionised water (SDW) and oven dried at 40°C overnight. Quartz sand was
obtained from Fisher Scientific with a grain size ranging from 0.1-0.4 mm, with a
mean of 0.26 mm. The sand was washed thoroughly with SDW and oven dried
overnight at 40°C. All porous media types exhibited a porosity of approximately
34% as determined by comparing water saturated versus dry mass.
3.3.2 Nanoparticle transport experiments
Experiments were first performed to determine the mobility of NPs within
the different porous media types. 10 mg/l NPs (Fe concentration) were
suspended in 10 ml of either sterile deionised water (SDW) or 50 mM CaCl2
solution. As ionic strength impacts NP mobility, experimentally relevant ionic
strength values were chosen, that is 50 mM CaCl2 at the start of the experiment
reducing to 0 mM with the completion of urea hydrolysis in the NP
immobilisation (NP-I) experiments. Column experiments for each porous media
type were set up vertically in 15 ml plastic tubes (diameter 2 cm, length 7.5 cm)
with a sintered glass disk (100-160 µm pore size) placed at the bottom of the
tube to prevent porous media from falling out. First, one pore volume (8 ml) of
the NP solution was added to the empty column (with closed off inlet), followed
by about 15 ml of either glass beads or quartz sand. This was left in a vertical
position for 24 hours. Sterile deionised water (SDW) was then pumped through
the columns for approximately half an hour at 1 ml min-1, with bottom to top
flow (Figure 3.1). Samples were collected from the outlet every 4 minutes for
later NP analysis with atomic absorption spectroscopy (AAS). Note that in these
transport experiments, the NPs were mixed in with the porous media, rather
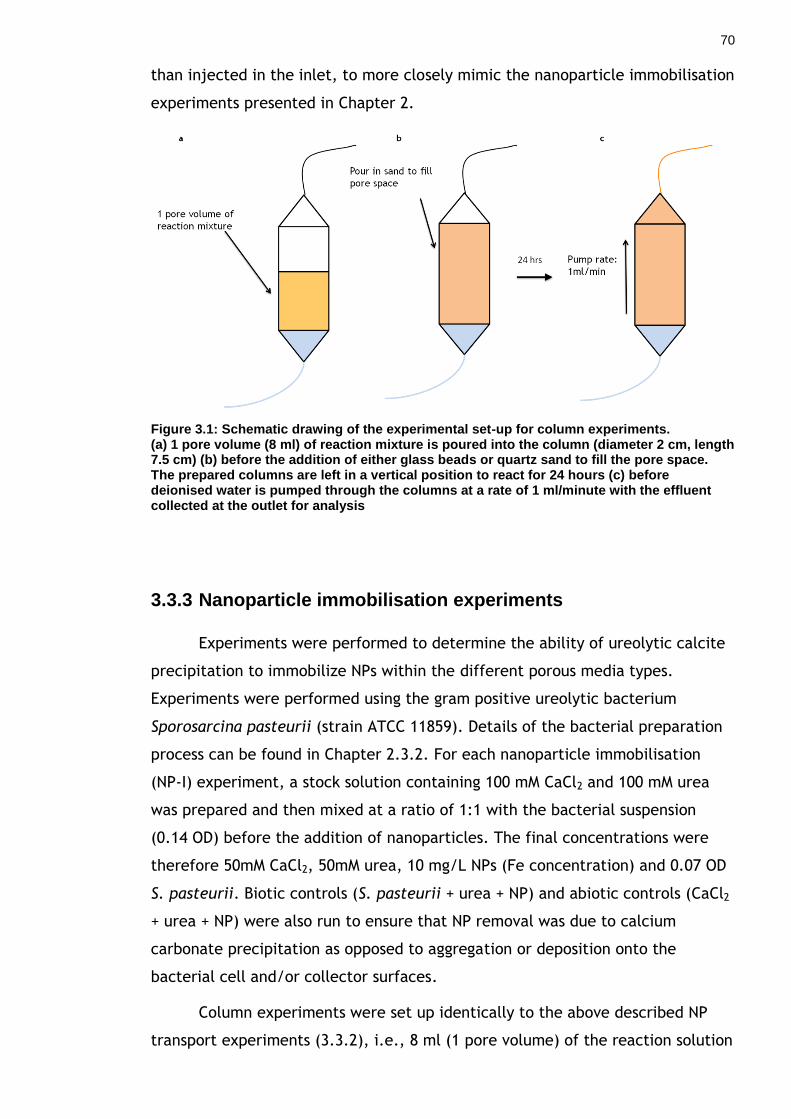
70
than injected in the inlet, to more closely mimic the nanoparticle immobilisation
experiments presented in Chapter 2.
Figure 3.1: Schematic drawing of the experimental set-up for column experiments. (a) 1 pore volume (8 ml) of reaction mixture is poured into the column (diameter 2 cm, length 7.5 cm) (b) before the addition of either glass beads or quartz sand to fill the pore space. The prepared columns are left in a vertical position to react for 24 hours (c) before deionised water is pumped through the columns at a rate of 1 ml/minute with the effluent collected at the outlet for analysis
3.3.3 Nanoparticle immobilisation experiments
Experiments were performed to determine the ability of ureolytic calcite
precipitation to immobilize NPs within the different porous media types.
Experiments were performed using the gram positive ureolytic bacterium
Sporosarcina pasteurii (strain ATCC 11859). Details of the bacterial preparation
process can be found in Chapter 2.3.2. For each nanoparticle immobilisation
(NP-I) experiment, a stock solution containing 100 mM CaCl2 and 100 mM urea
was prepared and then mixed at a ratio of 1:1 with the bacterial suspension
(0.14 OD) before the addition of nanoparticles. The final concentrations were
therefore 50mM CaCl2, 50mM urea, 10 mg/L NPs (Fe concentration) and 0.07 OD
S. pasteurii. Biotic controls (S. pasteurii + urea + NP) and abiotic controls (CaCl2
+ urea + NP) were also run to ensure that NP removal was due to calcium
carbonate precipitation as opposed to aggregation or deposition onto the
bacterial cell and/or collector surfaces.
Column experiments were set up identically to the above described NP
transport experiments (3.3.2), i.e., 8 ml (1 pore volume) of the reaction solution

71
was added to the empty column first and immediately followed by about 15 ml
of glass bead or quartz sand (Figure 3.1). The column was left in a vertical
position overnight for the reaction to complete. After 24 hours (the time taken
for total urea hydrolysis to occur as determined by batch experiments, see
Chapter 2.4) SDW was pumped continuously at a rate of 1 ml min-1 for half an
hour with bottom to top flow. Samples were collected at the outlet every 4
minutes to determine concentrations of NH4+ (by the Nessler assay), dissolved
Ca2+, and Fe; the Fe used as a proxy for NP concentration (both Ca2+ and Fe
were determined by AAS). pH was analysed at the beginning and end of all
experiments.
The stock solution pH, dissolved Ca2+ and NP concentrations were determined
before setting up the column experiments.
3.4 Results
3.4.1 Nanoparticle transport experiments
With the onset of pumping after 24 hrs, NPs were immediately detected
at the outlet in all systems where NPs had been suspended in SDW (Figure 3.2a-
d). Grain size and porous media type caused relatively little difference in the
transport of NPs through the column for SDW suspended NPs. 100% of the NPs
added were recovered at the outlet for the glass beads (all sizes) while 93 %
were recovered in the quartz column (Figure 3.2a-d). The shape of the
breakthrough curves indicates some retardation of NP transport; i.e. the NP
concentration quickly decreased during the first 8 minutes of pumping (1 pore
volume), then after 1 pore volume was flushed through there was a gradual
decrease in NP concentration, approaching zero in all columns, after 16 minutes
(~2 pore volumes). Without retardation, one would expect a more square or
top-hat shaped breakthrough curve. In the experiments where the NPs were
suspended in 50 mM CaCl2, notable differences in transport were observed
compared to NPs suspended in SDW (Figure 3.2a-d). In glass bead systems, the
percentage of NPs detected at the outlet decreased by 8-28 % compared to SDW
suspended NPs, whilst a drastic decrease was observed in the quartz sand with
only 18 % NPs being detected at the outlet (Figure 3.2d). NP retention followed
the order of quartz sand > medium glass beads> fine glass beads > coarse glass

72
beads for NPs dispersed in 50 mM CaCl2. For all glass bead columns, NP
concentrations at the outlet in general took longer to reach zero concentration
(i.e. they exhibited a longer tail) in CaCl2 suspended systems compared to SDW
suspended system. This is suggestive of greater retardation in the CaCl2
suspended system. The quartz sand exhibited an entirely different NP recovery
curve. Here, no NPs were detected at the outlet with the onset of pumping.
After 4 minutes of pumping NP concentration increased slightly until 8-10
minutes before gradually decreasing again.
Figure 3.2: Transport of NPs suspended in SDW (diamonds) and 50 mM CaCl2 (squares) through: (a) fine, (b) medium, and (c) coarse glass beads and (d) quartz sand (equivalent in size to fine glass beads). (8 minutes = 1 pore volume)
3.4.1.1 Nanoparticle immobilisation through glass bead packed columns
NH4+, Ca2+ and NP concentrations in the effluent of the glass bead packed
columns allowed the progress of ureolysis, calcite precipitation and NP mobility
within the columns to be monitored. After 24 hours reaction time, SDW was
pumped through the columns, immediately NH4+ was detected in the effluents of
all NP-I experiments and biotic controls (Figure 3.3). NH4+ recovery for the NP-I
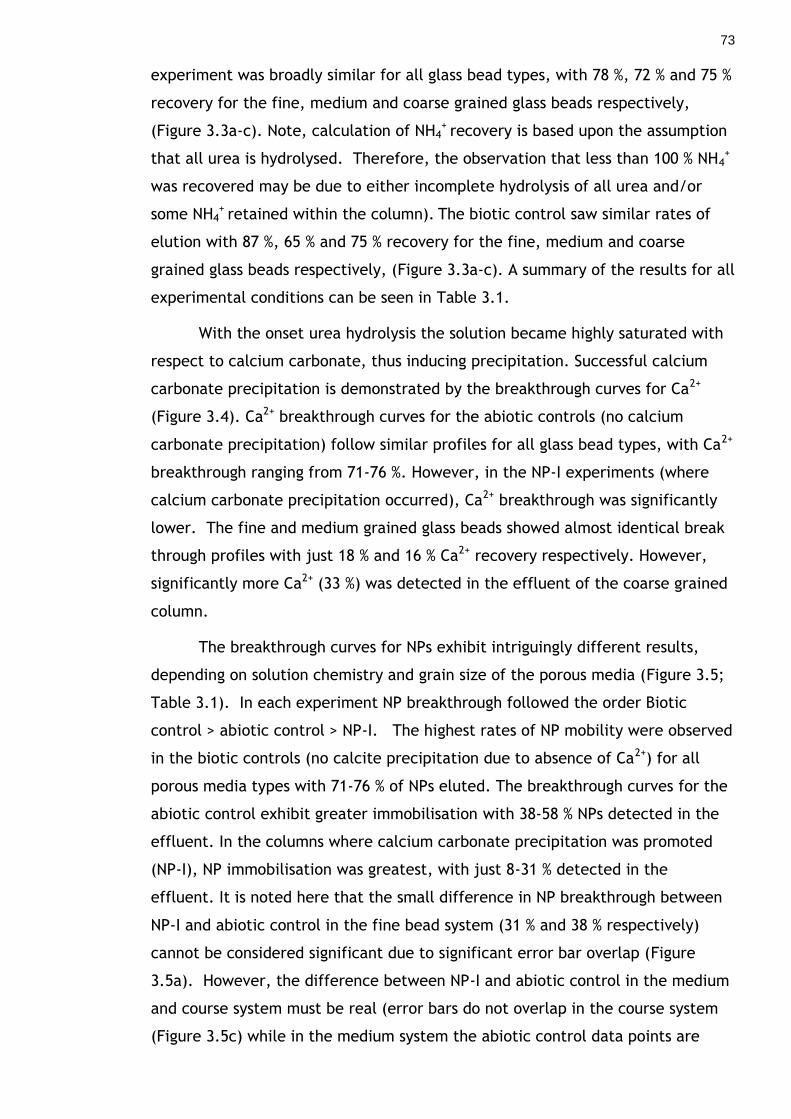
73
experiment was broadly similar for all glass bead types, with 78 %, 72 % and 75 %
recovery for the fine, medium and coarse grained glass beads respectively,
(Figure 3.3a-c). Note, calculation of NH4+ recovery is based upon the assumption
that all urea is hydrolysed. Therefore, the observation that less than 100 % NH4+
was recovered may be due to either incomplete hydrolysis of all urea and/or
some NH4+ retained within the column). The biotic control saw similar rates of
elution with 87 %, 65 % and 75 % recovery for the fine, medium and coarse
grained glass beads respectively, (Figure 3.3a-c). A summary of the results for all
experimental conditions can be seen in Table 3.1.
With the onset urea hydrolysis the solution became highly saturated with
respect to calcium carbonate, thus inducing precipitation. Successful calcium
carbonate precipitation is demonstrated by the breakthrough curves for Ca2+
(Figure 3.4). Ca2+ breakthrough curves for the abiotic controls (no calcium
carbonate precipitation) follow similar profiles for all glass bead types, with Ca2+
breakthrough ranging from 71-76 %. However, in the NP-I experiments (where
calcium carbonate precipitation occurred), Ca2+ breakthrough was significantly
lower. The fine and medium grained glass beads showed almost identical break
through profiles with just 18 % and 16 % Ca2+ recovery respectively. However,
significantly more Ca2+ (33 %) was detected in the effluent of the coarse grained
column.
The breakthrough curves for NPs exhibit intriguingly different results,
depending on solution chemistry and grain size of the porous media (Figure 3.5;
Table 3.1). In each experiment NP breakthrough followed the order Biotic
control > abiotic control > NP-I. The highest rates of NP mobility were observed
in the biotic controls (no calcite precipitation due to absence of Ca2+) for all
porous media types with 71-76 % of NPs eluted. The breakthrough curves for the
abiotic control exhibit greater immobilisation with 38-58 % NPs detected in the
effluent. In the columns where calcium carbonate precipitation was promoted
(NP-I), NP immobilisation was greatest, with just 8-31 % detected in the
effluent. It is noted here that the small difference in NP breakthrough between
NP-I and abiotic control in the fine bead system (31 % and 38 % respectively)
cannot be considered significant due to significant error bar overlap (Figure
3.5a). However, the difference between NP-I and abiotic control in the medium
and course system must be real (error bars do not overlap in the course system
(Figure 3.5c) while in the medium system the abiotic control data points are

74
consistently higher than the NP-I with barely touching error bars (Figure 3.5b).
Overall this suggests NP-I experiments do immobilize NPs more than abiotic
controls.
NP transport in the NP-I experiments did not appear to be related to bead
size. The medium grained porous media saw the lowest rates of NP transport,
with only 8 % NPs detected in the effluent, followed by 14 % in the coarse
grained media (both profiles fall within the margin of error). Whilst significantly
higher rates of NP transport was observed in the fine grained media with 31 %
NPs eluted.
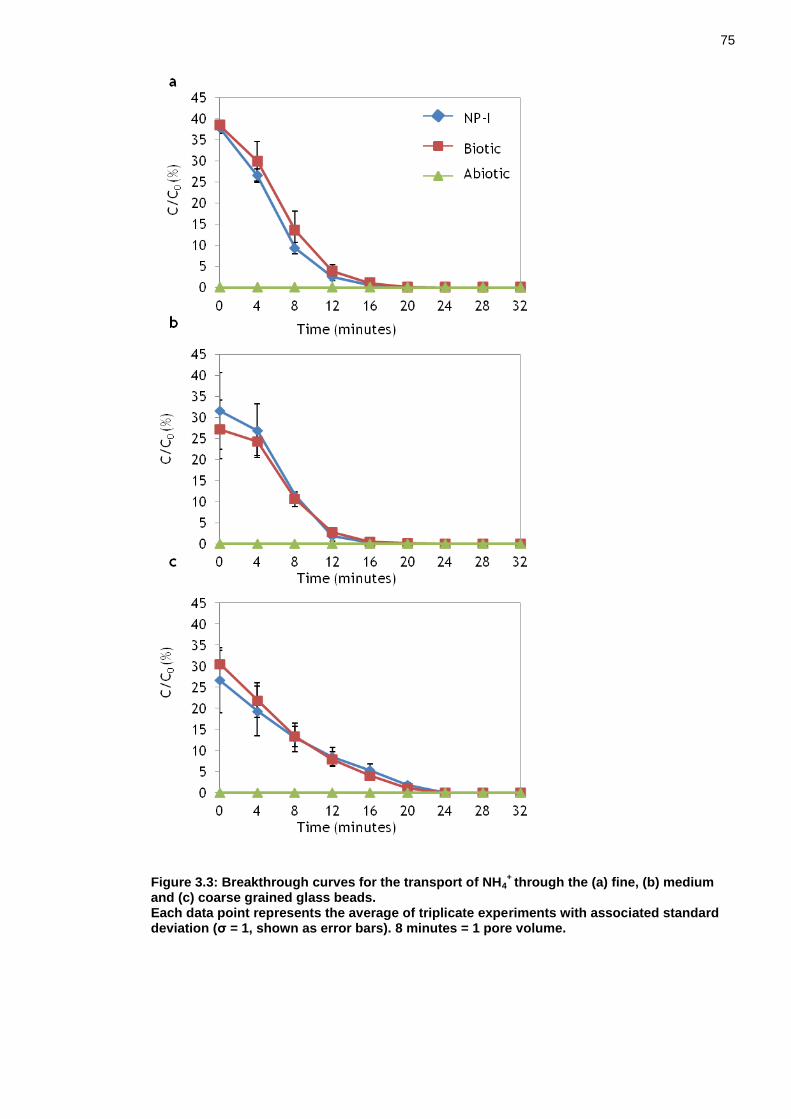
75
Figure 3.3: Breakthrough curves for the transport of NH4+
through the (a) fine, (b) medium and (c) coarse grained glass beads. Each data point represents the average of triplicate experiments with associated standard deviation (σ = 1, shown as error bars). 8 minutes = 1 pore volume.
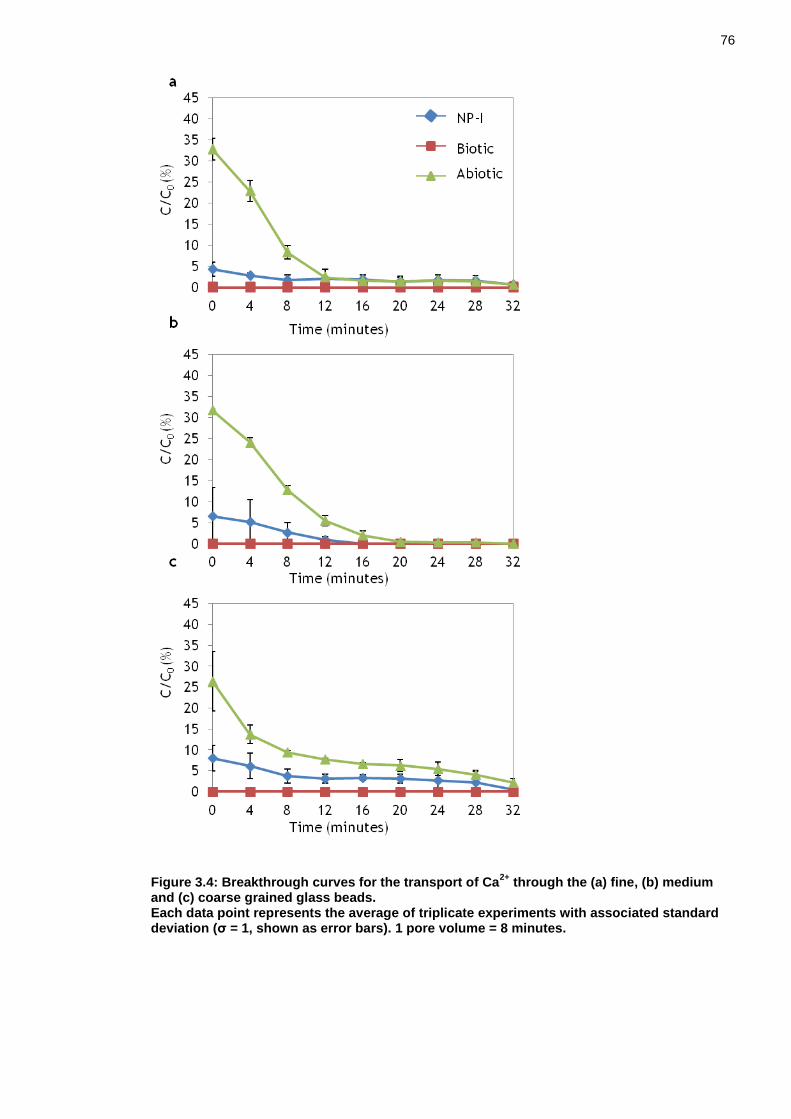
76
Figure 3.4: Breakthrough curves for the transport of Ca2+
through the (a) fine, (b) medium and (c) coarse grained glass beads. Each data point represents the average of triplicate experiments with associated standard deviation (σ = 1, shown as error bars). 1 pore volume = 8 minutes.
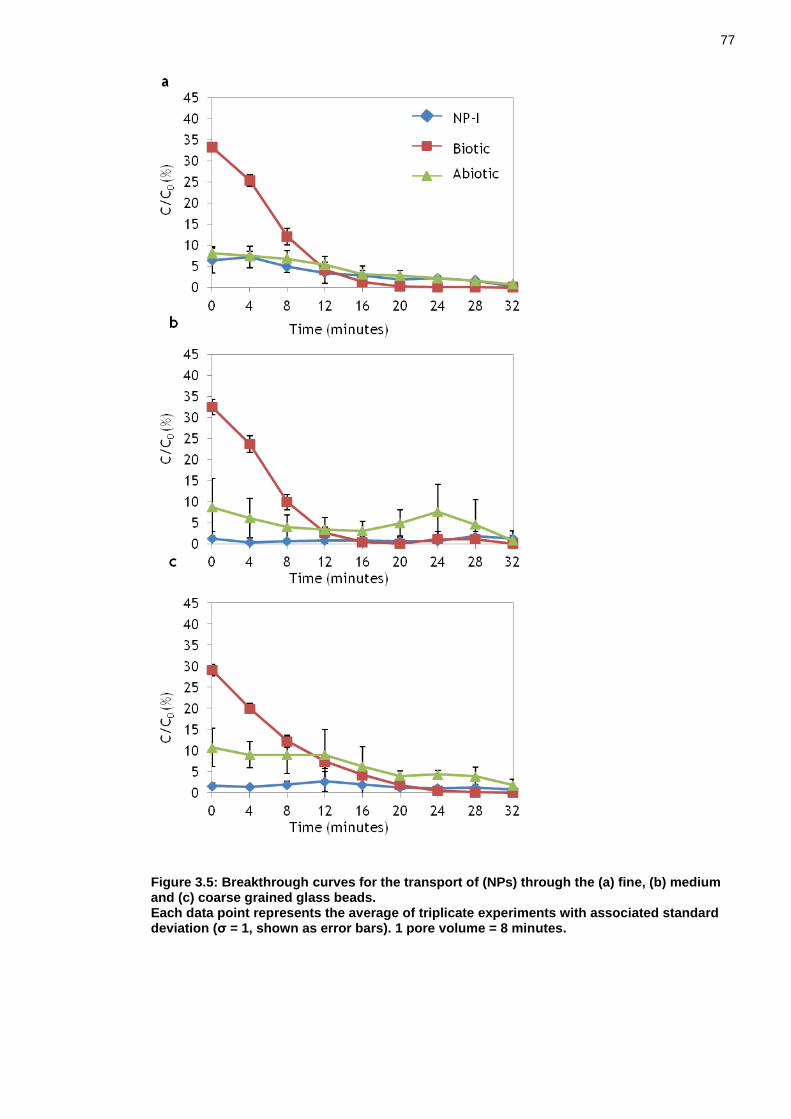
77
Figure 3.5: Breakthrough curves for the transport of (NPs) through the (a) fine, (b) medium and (c) coarse grained glass beads. Each data point represents the average of triplicate experiments with associated standard deviation (σ = 1, shown as error bars). 1 pore volume = 8 minutes.

78
3.4.1.2 Nanoparticle immobilisation through packed sand columns
Although trends were broadly similar, breakthrough profiles for quartz
sand columns exhibit somewhat different results compared to glass beads. In the
NP-I experiment 53 % NH4+ was detected in the effluent, whilst 63 % was
detected in the effluent for the biotic control; although overlapping errors bars
indicate these were not significantly different (Figure 3.6a). Both values are
lower than those of the glass bead experiments (Table 3.1). Figure 3.6b exhibits
the breakthrough curves for dissolved Ca2+ concentration. In the NP-I experiment
only 9 % of the added Ca2+ was detected at the outlet compared to 75 % in the
abiotic control, again indicating Ca2+ removal due to precipitation. The NP-I
experiment saw the greatest reduction in the mobility of NPs through the
column. Here, only 2 % NPs were detected at the outlet compared to 13 % in the
abiotic control (note, however, that the error bars for the the NP-I and abiotic
control overlap and so this difference is not statistically significant). The biotic
control saw the highest rates of NP mobility with 50 % NP recovery (Figure 3.6c).
Similar to the glass bead experiments, the order of NP breakthrough followed
the order Biotic control > abiotic control > NP-I. A comparison of all porous
media types can be seen in Table 3.1.
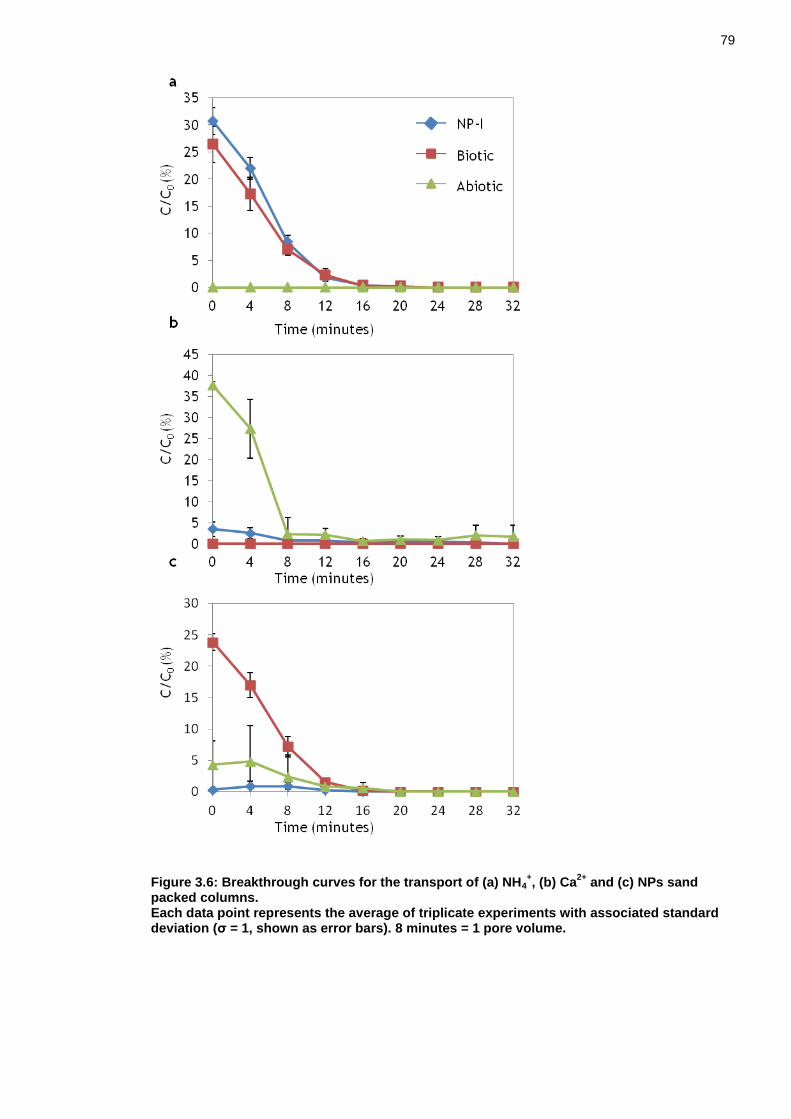
79
Figure 3.6: Breakthrough curves for the transport of (a) NH4+, (b) Ca
2+ and (c) NPs sand
packed columns. Each data point represents the average of triplicate experiments with associated standard deviation (σ = 1, shown as error bars). 8 minutes = 1 pore volume.
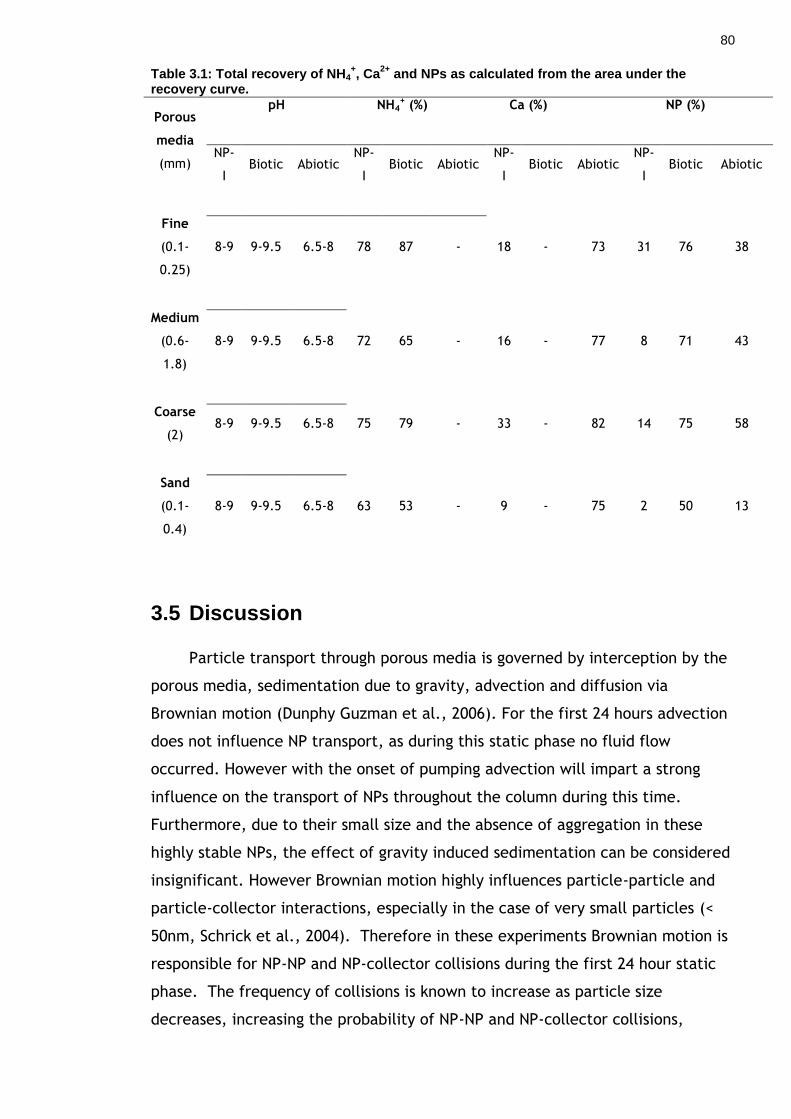
80
Table 3.1: Total recovery of NH4+, Ca
2+ and NPs as calculated from the area under the
recovery curve.
Porous
media
(mm)
pH NH4+ (%) Ca (%) NP (%)
NP-
I Biotic Abiotic
NP-
I Biotic Abiotic
NP-
I Biotic Abiotic
NP-
I Biotic Abiotic
Fine
(0.1-
0.25)
8-9 9-9.5 6.5-8 78 87 - 18 - 73 31 76 38
Medium
(0.6-
1.8)
8-9 9-9.5 6.5-8 72 65 - 16 - 77 8 71 43
Coarse
(2) 8-9 9-9.5 6.5-8 75 79 - 33 - 82 14 75 58
Sand
(0.1-
0.4)
8-9 9-9.5 6.5-8 63 53 - 9 - 75 2 50 13
3.5 Discussion
Particle transport through porous media is governed by interception by the
porous media, sedimentation due to gravity, advection and diffusion via
Brownian motion (Dunphy Guzman et al., 2006). For the first 24 hours advection
does not influence NP transport, as during this static phase no fluid flow
occurred. However with the onset of pumping advection will impart a strong
influence on the transport of NPs throughout the column during this time.
Furthermore, due to their small size and the absence of aggregation in these
highly stable NPs, the effect of gravity induced sedimentation can be considered
insignificant. However Brownian motion highly influences particle-particle and
particle-collector interactions, especially in the case of very small particles (<
50nm, Schrick et al., 2004). Therefore in these experiments Brownian motion is
responsible for NP-NP and NP-collector collisions during the first 24 hour static
phase. The frequency of collisions is known to increase as particle size
decreases, increasing the probability of NP-NP and NP-collector collisions,

81
regardless of external factors such as pH, ionic strength etc (Iijima and Kamiya,
2009). If such collisions during the static phase result in permanent attachment
(deposition) NP transport will be reduced during the flushing phase.
Physiochemical interactions acting between the NPs and collector surface govern
particle attachment (see Chapter 1.1.4 for further detail on NP physiochemical
interactions). Attractive van der Waals forces have a strong influence on NP
attachment; hence a potential barrier is required to maintain dispersed highly
mobile NPs (Iijima and Kamiya, 2009). This may come in the form of
electrostatic interactions where by the electric double layer (EDL) provides
electrostatic repulsion between particles. However, electrostatic interactions
are greatly affected by solution chemistry and cannot necessarily prevent
attachment or NP-NP aggregation alone. To overcome this issue NPs are capped
with various surface coatings which provide long ranged, robust electrosteric
repulsion even at high ionic strengths (Saleh et al., 2008). The NPs used in this
study display both electrostatic (zeta potential of -38 mv due to the
carboxylated terminations repel from the negative quartz or glass surface) and
electrosteric repulsions (provided by the dextran coating).
The first set of experiments aimed to investigate the attachment behaviour
of negatively charged NPs in porous media as a function of grain size (fine,
medium, and coarse grained) and grain type (quartz vs glass). NPs dispersed in
SDW displayed high mobility upon flushing as indicated by 100% and 93% NP
recovery in glass beads and quartz sand columns, respectively (Figure 3.2).
Under these conditions the highly negative NPs (-38mV) are electrostatically
repelled from the negative charge of the collector surfaces (both glass beads
and sand grains, Behrens and Grier, 2001). In contrast, in the presence of 50 mM
CaCl2 significantly reduced NP mobility under all tested conditions (Figure 3.2).
This is best explained by a reduction in repulsive EDL forces between NPs and
grain surfaces in the presence of divalent electrolyte such as Ca2+ (see chapter
1.1.4). As a result, the energy barrier required for particles to attach is lower,
allowing for enhanced particle-particle and particle-collector interaction
(Lecoanet and Wiesner, 2004). Such interactions promote NP aggregation within
the pore spaces and deposition onto the collector grains. It is important to note
that during batch experiments (Chapter 2) NP aggregation did not occur in the
abiotic control (contains 50 mM CaCl2). Thus deposition onto collector grains
rather than aggregation is likely the key mechanism here.
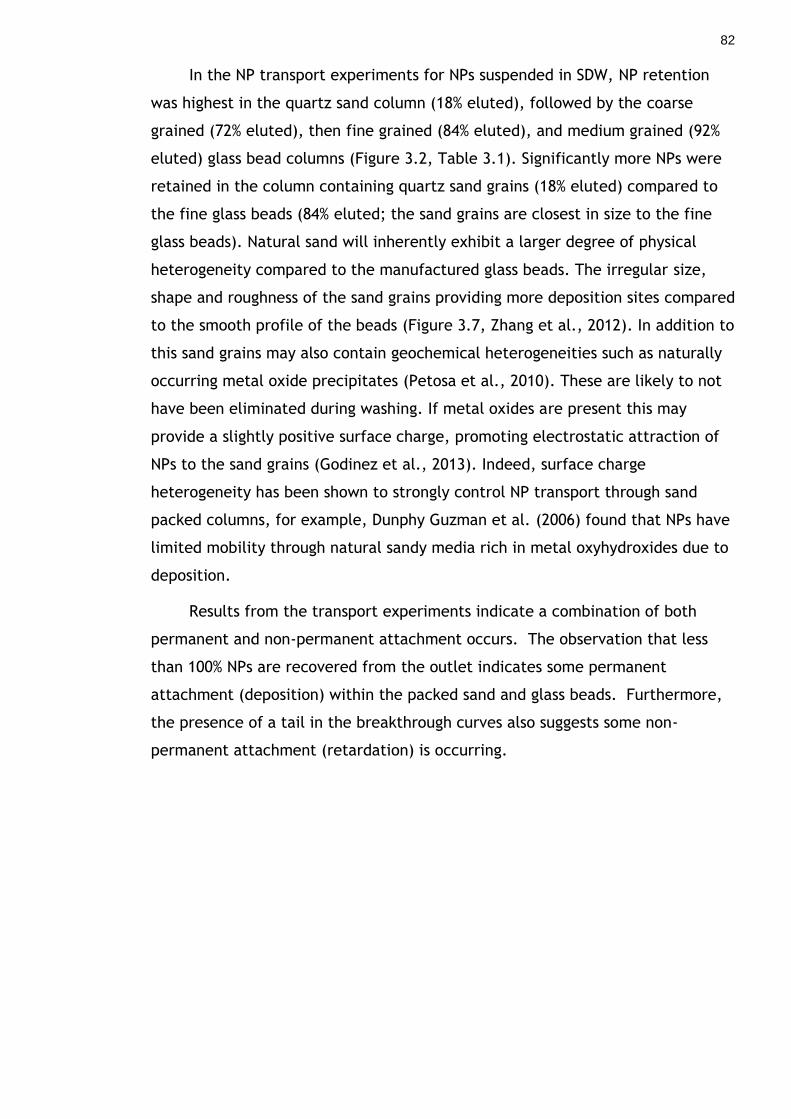
82
In the NP transport experiments for NPs suspended in SDW, NP retention
was highest in the quartz sand column (18% eluted), followed by the coarse
grained (72% eluted), then fine grained (84% eluted), and medium grained (92%
eluted) glass bead columns (Figure 3.2, Table 3.1). Significantly more NPs were
retained in the column containing quartz sand grains (18% eluted) compared to
the fine glass beads (84% eluted; the sand grains are closest in size to the fine
glass beads). Natural sand will inherently exhibit a larger degree of physical
heterogeneity compared to the manufactured glass beads. The irregular size,
shape and roughness of the sand grains providing more deposition sites compared
to the smooth profile of the beads (Figure 3.7, Zhang et al., 2012). In addition to
this sand grains may also contain geochemical heterogeneities such as naturally
occurring metal oxide precipitates (Petosa et al., 2010). These are likely to not
have been eliminated during washing. If metal oxides are present this may
provide a slightly positive surface charge, promoting electrostatic attraction of
NPs to the sand grains (Godinez et al., 2013). Indeed, surface charge
heterogeneity has been shown to strongly control NP transport through sand
packed columns, for example, Dunphy Guzman et al. (2006) found that NPs have
limited mobility through natural sandy media rich in metal oxyhydroxides due to
deposition.
Results from the transport experiments indicate a combination of both
permanent and non-permanent attachment occurs. The observation that less
than 100% NPs are recovered from the outlet indicates some permanent
attachment (deposition) within the packed sand and glass beads. Furthermore,
the presence of a tail in the breakthrough curves also suggests some non-
permanent attachment (retardation) is occurring.
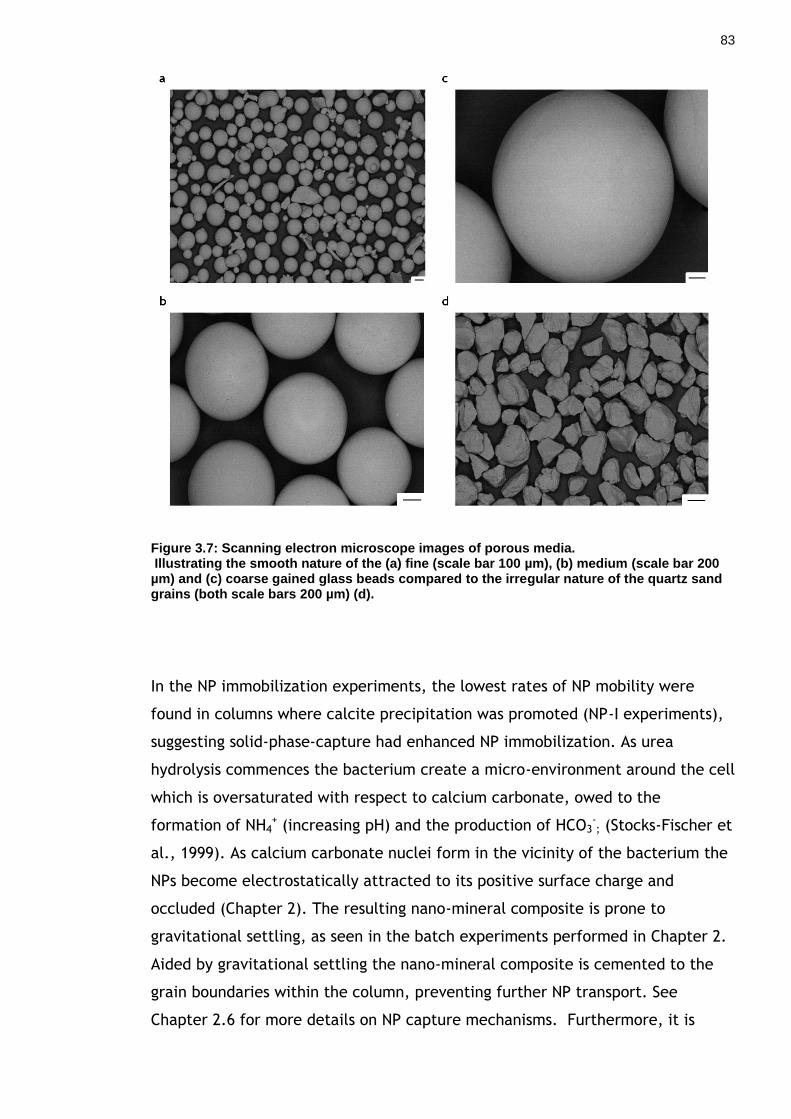
83
Figure 3.7: Scanning electron microscope images of porous media. Illustrating the smooth nature of the (a) fine (scale bar 100 µm), (b) medium (scale bar 200 µm) and (c) coarse gained glass beads compared to the irregular nature of the quartz sand grains (both scale bars 200 µm) (d).
In the NP immobilization experiments, the lowest rates of NP mobility were
found in columns where calcite precipitation was promoted (NP-I experiments),
suggesting solid-phase-capture had enhanced NP immobilization. As urea
hydrolysis commences the bacterium create a micro-environment around the cell
which is oversaturated with respect to calcium carbonate, owed to the
formation of NH4+ (increasing pH) and the production of HCO3
-; (Stocks-Fischer et
al., 1999). As calcium carbonate nuclei form in the vicinity of the bacterium the
NPs become electrostatically attracted to its positive surface charge and
occluded (Chapter 2). The resulting nano-mineral composite is prone to
gravitational settling, as seen in the batch experiments performed in Chapter 2.
Aided by gravitational settling the nano-mineral composite is cemented to the
grain boundaries within the column, preventing further NP transport. See
Chapter 2.6 for more details on NP capture mechanisms. Furthermore, it is

84
important to note that 100% Ca2+ elution from the column does not occur in the
abiotic control for all experiments, (see Table 3.1) this suggests that Ca2+ ions
bind to collector surfaces negative charge. Therefore calcite may also nucleate
directly on grain boundaries and occlude NPs as it grows away from the grains.
Bacteria (which possess a negative surface charge) may become entombed
within the mineral precipitate (Tobler et al., 2012), as do the NPs. However if
any bacterial entombment did occur this did not significantly impact urea
hydrolysis as the breakthrough curve profiles for NH4+ for the NP-I and biotic
control experiments are almost identical for all porous media types (Figure 3.3
and Figure 3.6a).The process of NP immobilisation is illustrated in Figure 3.8.
It is important to note that the effluent samples were not filtered prior to
analysis. Therefore the observation that small amounts of Ca2+ and NP eluted
form the column in the NP-I experiments (Figure 3.5, Table 3.1) may be due to
the flushing out of small NP-containing precipitates which were not cemented to
the collector surfaces. The aim of this research was to immobilise NPs within
bacterially mediated calcium carbonate in order to prevent NP transport.
Therefore NPs which are sufficiently mobile, whether trapped within calcite or
not, are deemed as unsuccessfully captured. Despite this, the process of
occlusion would cover the surface of any toxic NPs in a benign calcite coating,
isolating the NPs toxic surface from the environment. Thus we speculate here
that even mobile NPs, if coated in calcite, may have reduced toxicity.

85
Figure 3.8: Simplified sketch detailing the immobilisation of NPs within porous media. (a) Bacterial cells exist within the pore spaces, being electrostatically repulsed by the NPs and collector surfaces. Ca ions are attracted to the negative charge of the NPs and collector surfaces. As carbonate is produced by ureolysis, calcite precipitates onto available surfaces (b), i.e. the NPs, collector surfaces and the bacteria cells. NPs are also electrostatically attracted to the growing calcite surface (c) With further calcite precipitation NPs and bacteria cells become entrapped within the mineral precipitate, immobilised within the pore spaces and on the collector surfaces.
Aside from the NP-I experiments the abiotic control saw significantly low
rates of NP transport compared to the biotic controls. Here, ionic strength
(50mM CaCl2) in the pore water had a marked influence on the retention of NPs
in the column (as demonstrated my NP transport experiments, Figure 3.2). The
high salt concentration exhibited in the abiotic control acts to reduce the
repulsive EDL forces, allowing for more particle-collector interaction, resulting
86
in the deposition of NPs on collector surfaces (Figure 3.2a-c). This electrokinetic
effect may also come into play for the NP-I experiments. However the ionic
strength of the solution, where calcite precipitation is occurring, will change as
hydrolysis progresses. The ionic strength ( ) of the solution was calculated
according to the following equation:
where c is the molar concentration and z is the charge of each of the ions in
solution. The total ionic strength of the reaction solution at the start of the
experiment is 150 M/m3 due to the presence of 50 mM CaCl2. However, as the
bacteria hydrolyse urea, ammonium and bicarbonate ions are produced. The
bicarbonate ions will immediately bond with the calcium to form calcium
carbonate nuclei in solution. Hence the concentration of calcium in solution will
decrease as hydrolysis progresses, decreasing the ionic strength of the solution.
Whilst the concurrent production of ammonium ions will act to increase the ionic
strength of the solution. It is important to note that calcium is a divalent ion,
whilst ammonium is monovalent. Hence, a reduction in the calcium
concentration imparts a strong influence on the EDL forces acting on the NP and
collector surfaces compared to the monovalent ammonium ion. By the time
column solution chemistry is analysed, after 24 hours, the net ionic strength has
decreased to 100 M/m3, that is if total urea hydrolysis occurs, i.e. 100 mM NH4+
produced. A reduction in the total ionic strength in the NP-I experiments
promotes electrostatic repulsion, aiding NP transport through the column.
Hence, NP attachment via solid phase capture must be the dominant removal
mechanism in columns where calcite precipitation is promoted.
The highest rates of NP transport for all porous media types were found in
the biotic control experiments. Here the concentration of NPs eluted range from
50-76%. The high rates of NP transport exhibited here are in part due to
electrostatic repulsion between the negatively charged NPs, bacterium and
collector surfaces. More importantly, this electrostatic repulsion is maintained
due to the low ionic strength of the solution (no CaCl2). Despite this NP retention
did occur. NP transport through porous media is highly influenced by Brownian
motion (Dunphy Guzman et al., 2006). Importantly as particle size decreases the
rate of Brownian motion increases, hence particle-collector collisions are highly

87
likely for very small NPs (<50nm) (Schrick et al., 2004). In addition to this NPs
may be transported to collector surfaces due to advection which occurs when
pumping commences. Here NPs move with the bulk movement of the fluid,
transporting NPs to collector surfaces. It appears that a proportion of the NPs
had the ability to overcome the energy barrier required for deposition, becoming
attached to collector surfaces. Aside from this a physical straining mechanism
may act on the NPs, even though the NPs are significantly smaller than the
media pore space. If physical straining is the dominant mechanism of NP removal
here it would be expected that the fine grained glass beads would show the
highest rates of NP removal. However this was not the case, instead the medium
grained beads slowed the lowest rates of NP removal with 71% elution whilst the
fine grained beads saw the highest rates of NP transport with 76% elution.
Furthermore, the spread of data for the glass bead experiments is very narrow
with the breakthrough profiles all falling within error of each other. Therefore
straining mechanisms are not supported by the data.
Electrokinetic effects play a major role in determining the fate of NPs
within the environment. Importantly the ionic strength used here is not
representative of the chemistry of natural waters. Instead this was chosen to
allow a direct comparison to the chemistry of the NP-I experiments. Typical
groundwaters display 1-10 mM monovalent cations (Na+, K+) and 0.1-2 mM
divalent cations (Ca2+, Mg2+) (Saleh et al., 2008). Under such conditions Saleh et
al. found polymer-modified particles to be highly mobile. In such instances
induced calcite precipitation may be employed to immobilise NP pollutants
within the subsurface. This may be implemented by drilling strategic injection
points where by one well injects the bacterial suspension and another urea and
CaCl2. When the two fluids mix within the target zone (NP plume) urea
hydrolysis will commence stimulating the precipitation of calcium carbonate,
resulting in the in-situ immobilisation of NPs.
3.6 Conclusion
In this study ureolytically driven calcium carbonate precipitation was
shown to successfully immobilise negatively charged NPs within porous media.
Although NP mobility was reduced under all experimental conditions tested, the
lowest rates of NP mobility were consistently found in columns where calcium

88
carbonate precipitation was promoted. The results presented here suggest that
bacterially induced calcite precipitation may be used as a tool to significantly
reduce NP mobility in environmental systems.
89
4 Immobilisation of nanoparticles by bacterially precipitated struvite
While an array of techniques are available for in situ remediation of
numerous groundwater contaminants, there are currently none for in situ
remediation of nanoparticles (NPs). Experiments presented in chapter 3 showed
that bacterially driven calcite precipitation can be used as a tool to immobilise
nanoparticles within calcite crystals through solid phase capture. In this
process, electrostatic interactions between the growing calcite surface and the
NP greatly controlled the degree of NP capture; NPs with a negative surface
charge were captured with greater efficiency than those with a positive surface
charge, due to stronger electrostatic attachment of negative NPS to positive
calcite surfaces. This indicated that in order to immobilise NPs with a positive
surface charge, a mineral with a negative surface charge would be required.
Struvite (MgNH4PO4.6H2O) is such a mineral, commonly forming in high nutrient
waters, leading to the deposition of scale deposits on wastewater pipes (Ali,
2007). The struvite precipitating system tested here showed high success rates
at capturing positively charged NPs. However, the key mechanism of
immobilization appeared to be attachment to the stuvite surface, as opposed to
occlusion within the growing mineral (as reported for calcite in chapter 3).
Results indicated that changes in pH and ionic strength have considerable impact
on NP attachment and detachment due to their impact on the surface charge of
the mineral and NP with less attachment occurring as pH decreased and ionic
strength increased. Overall, these findings suggest that the mineral precipitating
system can be specifically tailored to suit the surface character of the NP
targeted. NP attachment onto mineral matrices has the potential to be used as a
tool to prevent NP mobility in contaminated groundwaters and to remove NPs
from wastewater treatment systems.
4.1 Introduction
The potential of bacterially driven solid phase capture to immobilise NP
pollutants within the subsurface has yielded promising results. Chapter 2 showed
that calcite precipitation driven by bacterial ureolysis is very effective at
capturing highly stable and negatively charged NPs within the growing calcite

90
crystal. This process was underpinned by attractive forces between oppositely
charged calcite (positive) and NP (negative) surfaces. Conversely, NPs with a
positive surface charge showed poor attachment to calcite surfaces due to
electrostatic repulsion and remained in suspension, i.e., could not be
immobilised using this approach. Here, we hypothesise that for capturing
positively charged NPs within a growing crystal, a mineral possessing a negative
surface charge is required.
Struvite (MgNH4PO46H2O) has been specifically selected as a possible
candidate for such a system as it exhibits a negative surface charge (Bouropoulos
and Koutsoukos, 2000). In addition to this, it is also used as a remediation
technique for excess nitrogen (ammonia) and phosphorus in industrial
wastewater (Zhou and Wu, 2012, Ryu and Lee, 2010, Ryu et al., 2008, Pastor et
al., 2008, Doyle and Parsons, 2002). This is of particular interest here as the
process of bacterial ureolysis (as used to induce calcite precipitation),
undesirably, produces ammonia as a by-product, thus the precipitation of
struvite could potentially be used in conjunction to ureolysis-driven technologies
to remove excess ammonium from environmental systems.
Struvite (MgNH4PO46H2O) is a white orthorhombic mineral containing
equimolar concentrations of magnesium, ammonia and phosphate (Eqn.1).
Struvite precipitation is strongly dependant on pH, the ratio of NH4+:Mg2+:PO4
3-,
temperature and the presence of foreign ions such as calcium (Doyle et al.,
2003, Doyle and Parsons, 2002). Generally, the solubility of struvite decreases
with increasing pH up to pH 9 (Nelson et al., 2003). Above this, struvite
solubility increases proportionally with phosphate concentration, but inversely to
ammonia concentration (Doyle and Parsons, 2002).
Mg2+ + NH4+ + PO4
3- + 6H2O MgNH4PO46H2O (Eqn. 1)
Historically struvite precipitation has been extensively studied due to its
formation on waste water pipes form industrial wastewater. The hard deposit
causes a range of operational problems ranging from increased pumping costs to
the replacement of sections of pipe work (Doyle and Parsons, 2002, Ohlinger et
al., 1998, Doyle et al., 2003). Recently the problem mineral has gained positive
attention due to its potential use a slow release fertiliser (Desmidt et al., 2013,
Doyle et al., 2003). Traditionally the agricultural industry produces fertiliser
from mined phosphate rock (Desmidt et al., 2013). However increasing global
91
demand for fertiliser is putting pressure on this finite resource and so alternative
sources of phosphate are required (Uludag-Demirer et al., 2005). This has
provided an economic incentive to recover phosphate from nutrient rich
wastewater though controlling the precipitation struvite. Sales of struvite
within the UK have the potential to provide revenue of up to £20,000 a year
(Jaffer et al., 2002). In addition struvite precipitation has received attention
from a wide range of fields, including such as the veterinary (Osborne et al.,
1999), medical (Clapham et al., 1990) and the food and beverage industry
(Foletto et al., 2013, Johns, 1995).
In this study we investigate the potential of struvite precipitation to
immobilise positively charged NPs while simultaneously removing excess NH4+
produced by bacterial ureolysis. It is expected that positively charged NPs
electrostatically bind to the negatively charged growing struvite surfaces. As
mineral growth proceeds, these NPs become immobilised within the mineral
matrix, thereby removing them from the aqueous phase.
4.2 Materials and methods
4.2.1 Nanoparticles
The positively charged NPs (S-posNPs) were prepared in the same manner
as in Chapter 2.3.1.
4.2.2 Struvite precipitation experiments
First, struvite precipitation experiments were undertaken in the absence
of NPs. These experiments were performed to determine optimal conditions for
struvite precipitation. A summary of all the tested experimental conditions are
shown in Table 4.1.
Two different types of batch experiments were carried out: S1) struvite
precipitation during bacterial ureolysis, i.e., Mg2+ and PO43- are added at the
beginning and NH4+ is being continuously produced through ureolysis, and S2)
struvite precipitation following ureolysis, i.e., all NH4+ is produced first by
ureolysis, before Mg2+ and PO43- are added in four steps.

92
Both types of experiments were performed using the gram positive
ureolytic bacterium Sporosarcina pasteurii (strain ATCC 11859). Details of the
preparation of bacteria are given in Chapter 2.3.2. For S1a experiments the
bacterial pellet was re-suspended in a solution containing 20 mM K2HPO4, diluted
to an optical density (OD) of 0.14 (as determined spectrophotometrically at 600
nm). Separately, a solution containing 10 mM urea and 20 mM MgCl2 was
prepared. To start the experiment, the urea and MgCl2 solution were mixed at a
ratio of 1:1 with the bacterial and K2HPO4 suspension. The final concentrations
for experiment S1a were 5 mM urea, 10 mM K2HPO4 and MgCl2 and 0.07 OD S.
pasteurii. Biotic controls, S1b (S.pasteurii + urea + K2HPO4; the absence of MgCl2
preventing struvite precipitation) were done to track the progress of ureolysis,
while abiotic controls S1c (K2HPO4 + MgCl2) were run to ensure that Mg2+/PO43-
removal would result only as a consequence of NH4+ production. Concentrations
of K2HPO4 and MgCl2 were intentionally kept low in order to prevent the
precipitation of magnesium phosphate minerals instead of struvite.
For the S2 experiment the bacterial pellet was re-suspended and diluted
in sterile deionised water (SDW). The bacterial solution (0.14 OD S.pasteurii)
was mixed with a 100 mM urea solution to give a final concentration of 50 mM
urea and 0.07 OD S. pasteurii. These concentrations were chosen to follow the
concentrations used for calcite precipitation in Chapters 2 and 3. This mix was
left for 24 hours for urea hydrolysis to complete, giving a final concentration of
100 mM NH4+. A concentration of 100 mM NH4 was chosen to simulate the level
of NH4+ produced by bacterial ureolysis in Chapter 3 and 4. To initiate struvite
precipitation, 25 mM Mg2+ and PO43- injections were added as dry solids (using
MgCl2 and K2HPO4 salts) in 4 stages. Adding Mg2+ and PO43- sources as dry solids
and in 4 stages prevented the premature precipitation of magnesium phosphate
minerals.
4.2.3 Nanoparticle capture by struvite precipitation
S2 experiments (staged approach) yielded best conditions for struvite
precipitation (see section 4.3.1), thus an identical set-up was chosen for the
nanoparticle remediation experiments (N1 and N2, both experiments are
identical other than solution pH is maintained between 8 and 9 in the N2
experiment). These were the same as the S2 experiments except that prior to

93
the addition of the Mg2+ and PO43-
salts, the solution was filtered (using sterile
0.2µm membrane filters) to remove bacterial cells that could immobilise the
positively charged NPs (as observed in Chapter 2). This was done to ensure that
NP removal could only result from struvite precipitation. Following filtration, 10
mg/l NPs were added to the experiment. Biotic and abiotic control experiments
were also run (see Table 4.1). All nanoparticle remediation experiments were
carried out in triplicate in glass beakers that were covered with parafilm® to
prevent evaporation.
Table 4.1: Summary of tested experimental conditions.
Run S. pasteurii (OD600)
Urea/NH4
(mM) MgCl2
(mM) K2HPO4
(mM) NP (mg/l)
Struvite precipitation experiments S1a 0.07 5/10 10 10 - S1b 0.07 5/10 - 10 - S1c - - 10 10 S2 0.07 50/100 25* 25* - NP immobilisation experiments N1a 0.07 50/100 25* 25* 10 N1b 0.07 50/100 - 25* 10 N1c - - 25* 25* 10 N2a 0.07 50/100 25* 25* 10 N2b 0.07 50/100 - 25* 10 N2c - - 25* 25* 10 *concentrations of MgCl2 and K2HPO4 added 4 times to give a final concentration of 100 mM. The N2 experiments were controlled between pH 8 and 9.
4.2.4 Nanoparticle removal by pre-formed struvite
A NP sorption experiment was devised to determine the effect of ionic
strength on the attachment of positively charged NPs on to the struvite surface.
For this, struvite was precipitated using the same approach as for S2
experiments. Once precipitated the mineral was separated via centrifugation
and washed 3 times in SDW to remove excess salts. Equal quantities (0.6 g wet
weight) of struvite were weighed and suspended in 10 ml KCl solutions at 4
different concentrations (0, 50, 150 and 250 mM). KCl was used as these are the
ions that remain in solution once struvite has precipitated in experiments tested
here. NPs were then added to give a concentration of 5 mg/l (Fe concentration).
The concentration of NPs was reduced here to save on experimental costs.
94
4.2.5 Chemical analysis
Solution pH and concentrations of NH4+, Mg2+, PO4
3- and Fe (iron used as a
proxy for nanoparticle concentration) were determined at time zero and at
regular intervals thereafter. At each sampling time 10 ml aliquots were removed
from the experiment; 5 ml were used for pH measurement, 0.5 ml to determine
NH4+ by the Nessler assay and 4.5 ml were mixed with 1 ml 50% HCl for Mg2+, PO4
-
and Fe measurements. PO4- concentrations were determined using the
molybdenum blue method (Murphy and Riley, 1958) whilst Mg2+ and Fe
concentrations were analysed using atomic absorption spectroscopy. For Mg2+
analysis calibration standards of 0.3, 0.5, 0.7 and 1 mg/l were prepared prior to
each analysis using MgCl2. An air-acetylene flame was used for all Mg2+
determinations at a flow rate of 0.9 – 1.2 l/min. The spectrometer was operated
at a wavelength of 285.2 nm and a spectral band pass of 0.5 nm with the lamp
current running at 75%. The analytical limit detected under these conditions is
0.003 mg/l. For details on Fe analysis by AAS see Chapter 2.3.3.
4.2.6 Zeta potential analysis
The zeta potential of struvite was investigated as a function of pH and
ionic strength. Preformed struvite crystals (struvite was precipitated using the
same approach as for S2 experiments) were separated via centrifugation and
washed 3 times in SDW to remove excess salts. The cleaned struvite crystals
were separated via centrifugation before equal quantities (0.6 g wet weight) of
struvite were weighed and suspended in 10 ml KCl solutions at 4 different
concentrations (0, 50, 150 and 200 mM). KCl was used as these are the ions that
remain in solution once struvite has precipitated in experiments tested here.
The pH of the reaction solution was then adjusted using NaOH and HCl over the
pH range of 6 to 12. Zeta potential measurements were immediately run using
Zetasizer Nano ZS (Malvern Instruments) at 25°C.
4.2.7 Scanning Electron and Raman Microscopy
Mineral identification was performed by SEM and Raman analysis. Once the
reactions were completed, precipitates were removed by centrifugation, washed
three times with SDW, and then dried for 24 hours at 30°C. Dried precipitates
were mounted on aluminium stubs, carbon coated and imaged using a Zeiss
Sigma Field-Emission Scanning Electron Microscope with a beam intensity of 20

95
kV. Raman spectroscopy was carried out to gather additional chemical
information of the struvite crystals. Uncoated precipitates were analysed using
Renishaw Invia Raman Microscope with Wire 3.2 software. Samples were excited
using a 514-nm edge green laser, and spectra were obtained using a static scan
with a centre of 920 xm-1.
4.3 Results
4.3.1 Struvite precipitation experiments
In the first set of struvite precipitation experiments (S1: struvite
precipitation during ureolysis) bacterial ureolysis led to an increase in NH4+ in
both the struvite precipitation experiment (S1a) and biotic control (S1b, 4.1b-c,
Table 4.1). With the onset of ureolysis in S1a, it was expected that the increase
in NH4+ would lead to struvite supersaturation and hence struvite precipitation.
This in turn would result in a decrease in NH4+, Mg2+ and PO4
3-. However, this
was not observed. Instead, NH4+ increased at almost identical rates in the
struvite precipitation and in the biotic control experiment (4.1b-c), 95% of the
initially added urea was hydrolysed within only 8 hours. The absence of NH4+
removal showed that struvite precipitation did not occur. Nevertheless, a white
coloured precipitate was observed at the bottom of the reaction vessel. The
simultaneous decrease in dissolved Mg2+ and PO43- from 100 to 40% over the
duration of the experiment (4.1b) indicated this precipitate was some form of
Mg-phosphate. In the biotic control (S1b; 4.1c) no precipitation was observed
due to the absence of Mg2+. Similarly, no precipitation was observed in the
abiotic control (S1c; 4.1d) despite the presence of both Mg2+ and PO43- ions
(although Mg2+ and PO43- concentrations did decrease slightly over the duration of
the experiment).

96
4.1: Time series showing changes in pH, NH4+, Mg2+, PO4
3- concentration for the S1 experiment. (a) pH over time for the struvite precipitation experiment, the biotic (S1b) and the abiotic control (S1c). (b,c and d) NH4
+, Mg2+ and PO43- concentration profiles for (b) S1a struvite
precipitation experiment which contained 0.07 OD S.pasteurii, 5 mM urea giving 10 mM NH4
+, and 10 mM Mg2+ and PO43- (c) S1b contained all components except MgCl2 and (d) S1c
contained all components except bacteria and urea. For the S1 experiment each data point
represents the average of triplicate experiments with associated standard deviation (σ = 1, shown as error bars).
In the second struvite precipitation experiment (S2; struvite precipitated
after ureolysis, Table 4.1), urea hydrolysis was completed before adding Mg2+
and PO43- sources. Upon S.pasteurii addition urea hydrolysis was completed
within 24 hours producing 100 mM NH4+. In order to prevent precipitation of
magnesium phosphate phases, Mg2+ and PO43- were added in 4 stages of 25 mM
(added as dry solids to prevent dilution of the NH4+ solution) to equal the NH4
+
concentration of 100 mM. After the first addition of Mg2+ and PO43- an immediate
decrease in NH4+ by 25% was observed (Figure 4.2). The concentration of Mg2+
and PO43- was also noted to return to zero (Figure 4.2), indicating a
stochiometric 1:1:1 ratio of NH4+, Mg2+ and PO4
3- had been removed from
solution. This was accompanied by the formation of a white coloured precipitate
(4.5a), which considering the 1:1:1 stoichiometry was likely to be struvite. After
the second Mg2+ and PO43- addition, no decrease in NH4
+ was observed. However,
after the third addition, NH4+ decreased to 60% (Figure 4.2). Following the fourth
addition, NH4+ continued to decrease to give a final concentration of 2% NH4
+,
indicating that almost all NH4+ was removed. By this stage, all Mg2+ and PO4
3-

97
had also been removed, again indicating a stochiometric removal of 1:1:1 for
NH4+, Mg2+ and PO4
3-, consistent with struvite formation. It is important to note
that the concentration of Mg2+/PO43- at each sample point shown in Figure 4.2 is
a percentage of the total Mg2+/PO43- that was added prior to the sampling point.
For example sample point 2 reads 3 % Mg2+, that is 3 % of the 25 mM Mg2+ added
remained in solution. Similarly the sample point at 1.5 hrs reads 20 % Mg2+,
meaning that 20 % of the total 100 mM Mg2+ added remained in solution. The
erratic removal of NH4+ may be explained as Mg2+/PO4
3- salts were added as dry
solids (in order to prevent dilution), and so all of the added Mg2+/PO43- may not
have fully dissolved before the subsequent sampling point (this would be
difficult to observe due to the immediate precipitation of struvite creating a
cloudy appearance to the reaction solution). Therefore, as the experiment
progresses more Mg2+/PO43- is becoming available through dissolution, allowing
for the continual precipitation of struvite. This method of struvite precipitation
has shown much better success compared to the S1a experiment, where no
struvite formed. This experimental approach was therefore used for the NP
immobilisation experiments.
Figure 4.2: Time series showing changes in pH, NH4+, PO4
3- and Mg
2+ concentration for
experiment S2. Experiment S2 contained 0.07 OD S.pasteurii and 50 mM urea, giving 100 mM NH4
+, once
total urea hydrolysis was achieved 25 mM K2HPO4 and MgCl2 were added 4 times to give a final concentration of 100 mM. The graph here shows data points after total urea hydrolysis had occurred (i.e. it shows the period of time during which K2HPO4 and MgCl2 were added). The Mg
2+/PO4
3- concentration at each sample point is a percentage of the total Mg
2+/PO4
3-
that was added prior to that sampling point. The purple circles represent the time points at which PO4
3- and Mg
2+ sources were added giving a total Mg
2+/PO4
3- concentration of (*1) 25
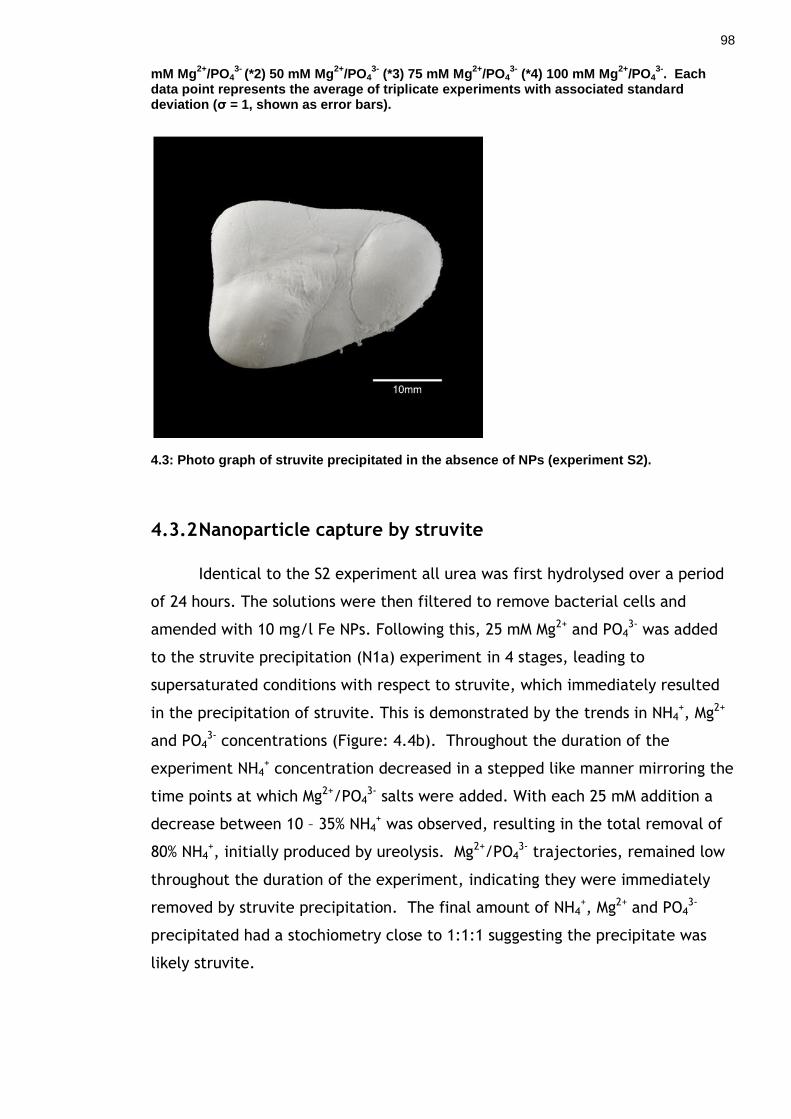
98
mM Mg2+
/PO43-
(*2) 50 mM Mg2+
/PO43-
(*3) 75 mM Mg2+
/PO43-
(*4) 100 mM Mg2+
/PO43-
. Each data point represents the average of triplicate experiments with associated standard deviation (σ = 1, shown as error bars).
4.3: Photo graph of struvite precipitated in the absence of NPs (experiment S2).
4.3.2 Nanoparticle capture by struvite
Identical to the S2 experiment all urea was first hydrolysed over a period
of 24 hours. The solutions were then filtered to remove bacterial cells and
amended with 10 mg/l Fe NPs. Following this, 25 mM Mg2+ and PO43- was added
to the struvite precipitation (N1a) experiment in 4 stages, leading to
supersaturated conditions with respect to struvite, which immediately resulted
in the precipitation of struvite. This is demonstrated by the trends in NH4+, Mg2+
and PO43- concentrations (Figure: 4.4b). Throughout the duration of the
experiment NH4+ concentration decreased in a stepped like manner mirroring the
time points at which Mg2+/PO43- salts were added. With each 25 mM addition a
decrease between 10 – 35% NH4+ was observed, resulting in the total removal of
80% NH4+, initially produced by ureolysis. Mg2+/PO4
3- trajectories, remained low
throughout the duration of the experiment, indicating they were immediately
removed by struvite precipitation. The final amount of NH4+, Mg2+ and PO4
3-
precipitated had a stochiometry close to 1:1:1 suggesting the precipitate was
likely struvite.

99
Figure: 4.4: Time series showing changes in pH, NH4+, Mg2+, PO4
3- and Fe (NP) concentration (%) for experiment N1.
(a) Change in pH for the struvite (N1a), biotic (N1b) and abiotic (N1c) experiments. (b) Experiment N1a contained 0.07 OD S.pasteurii and 50 mM urea, giving 100 mM NH4
+. Once
total urea hydrolysis was achieved, bacteria were removed by filtration and 10 mg/l Fe (NPs) were injected before 25 mM MgCl2 and K2HPO4 were added 4 times to give a final concentration of 100 mM; The graph shown here shows data points after total urea hydrolysis had occurred (i.e. it shows the period of time during which K2HPO4 and MgCl2
were added) (c) N1b contained all components except MgCl2; (d) N1c contained all components except bacteria and urea. The Mg
2+/PO4
3- concentration at each sample point is
a percentage of the total Mg2+
/PO43-
that was added prior to that sampling point. The purple circles represent the time points at which PO4
3- and Mg
2+ sources were added giving a total

100
Mg2+
/PO43-
concentration of (*1) 25 mM Mg2+
/PO43-
(*2) 50 mM Mg2+
/PO43-
(*3) 75 mM Mg
2+/PO4
3- (*4) 100 mM Mg
2+/PO4
3-. For the N1 experiment each data point represents the
average of triplicate experiments with associated standard deviation (σ = 1, shown as error bars).
* Note key shown at the bottom of d refers to Figures b-d.
As struvite precipitated, the percentage of suspended NPs initially
decreased similarly to the NH4+ trend. After the second Mg2+/PO4
3- injection 60%
of the NPs were successfully immobilised (Figure: 4.4b). However, unexpectedly
the third and fourth injections led to an increase in NP concentration by 40%
despite the continuation of struvite precipitation (Figure: 4.4b). Thus, at the
end of the experiment 80% of the positive NPs were re-suspended while only 20%
NPs were immobilised through struvite precipitation. The re-suspension of NPs
in the latter half of the experiment may be influenced by the decrease in pH
over the duration of the experiment. Figure: 4.4a demonstrates that after the
first Mg2+/PO43- addition little pH change was observed in the struvite
precipitation (N1a) experiment. However, the second and third addition led to a
pH drop from pH 9 to pH 7 and 6.5, respectively. The final addition induced
little decrease in pH, remaining at around 6.5. Interestingly, the pH decrease
from 9 to 7 corresponded with a slower removal of NPs: only 25% NP removal was
observed compared to 35% when the pH was highest at pH 9. Critically, once the
pH drops below 7, an increase in NP concentration was observed, coinciding with
the re-suspension of 40% of the previously immobilised NPs. These variations in
NP removal may relate to pH dependent changes in the zeta potential of the
struvite surface, as discussed later in 4.3.4.
In the biotic control (N1b) experiment, NPs and ammonium were not
removed during the course of the experiment (Figure: 4.4c) and no precipitates
were observed. There was also no PO43- removal by the end of the experiment
(despite unexplained fluctuations). The lack of precipitate and lack of NP
removal indicates NPs are not removed by, for example, aggregation or
attachment to reaction vessel walls. This supports the suggestion that NP
removal in experiment N1a occurred due to struvite precipitation. In the abiotic
control (N1c) 85% and 58% of the added Mg2+ and PO43- (respectively) were
removed over the course of the experiment (Figure: 4.4d). This corresponded
with the removal of 49% NPs after the second Mg2+/PO43 addition. As with the NP
immobilisation experiment, N1a, the third and fourth Mg2+/PO43 additions saw

101
the resuspension of all the previously captured NPs. By the end of the
experiments 100% of the NPs remained in solution despite the precipitation of
some form of magnesium phosphate.
In order to improve NP immobilisation this experiment was re-run with the
aim to maintain pH between 8 and 9, as it appeared that lower pHs may inhibit
NP removal by struvite. In this experiment (N2a), struvite precipitation was more
efficient, removing 92% NH4+ (Figure 4.6b) compared to 80% NH4
+ in N1a
experiment. Mg2+ and PO43- concentrations also remained low, indicating
efficient removal. Again removal of NH4+, Mg2+ and PO4
3 displayed a
stochiometry close to 1:1:1, indicating the precipitate was likely struvite.
Struvite precipitation was accompanied by the removal of significantly more NPs
during the first two Mg2+/PO43- additions, immobilising 80% of the suspended NPs
(Figure 4.6b), compared to just 60% in the N1a experiment where pH was not
adjusted. However, the third Mg2+/PO43- addition saw no further decrease in NP
concentration, whilst the fourth saw an NP increase by 30% (Figure 4.6b). At the
end of the experiment, struvite precipitation immobilised 50% of the NPs. Figure
4.6: Time series showing changes in pH, NH4+, Mg2+, PO4
3- and Fe (NP)
concentration.b portrays struvite precipitates removed after the second
Mg2+/PO43- injection where maximum NP removal occurred, note the dark
orange-brown colour indicating the presence of NPs. Whilst Figure 4.6: Time
series showing changes in pH, NH4+, Mg2+, PO4
3- and Fe (NP) concentration.c
depicts struvite precipitates removed at the end of the experiment. The struvite
precipitates here are much whiter in colour indicating that less NPs are present.
SEM combined with Raman analysis showed that struvite was the dominant
mineral phase (Figure 4.7a and Figure 4.8a).
Again, no precipitation occurred in the biotic control (N2b; Figure 4.6c),
however a small decrease in NP concentration was observed. Here, 20% NP
removal was observed however as no precipitation occurred it is not clear what
the removal mechanism may be (note this drop has not been seen in biotic
control before). In contrast the abiotic control (N2c; Figure 4.6d) saw the
precipitation of some form of magnesium phosphate. The first addition of
Mg2+/PO43- sources saw no decrease in Mg2+/PO4
3-, however the following
additions saw a drastic decrease in Mg2+/PO43- by 92%/88% respectively (Figure
4.6d). This was accompanied by the instantaneous precipitation of magnesium
phosphate as indicated by the continual low levels of Mg2+/PO43- concentration,
102
(Figure 4.6d). By the end of the experiment approximately 10% of the Mg2+/PO43-
ions added remained in solution (Figure 4.6d). SEM and Raman analysis was
performed for these precipitates (Figure 4.7b and Figure 4.8b). Identical to the
struvite precipitation experiment (N2a), this form of magnesium phosphate
mineralisation concurrently removed NPs from solution in a step like manner
(Figure 4.6d) throughout the duration of the experiment, producing a lightly
orange coloured precipitate (4.5c). By the end of the experiment almost
identical removal rates were recorded, the struvite precipitation experiment
(N2a) removed 52% NPs, whilst the abiotic control which precipitated magnesium
phosphate (N2c) saw the removal of 49% NPs (Figure 4.6b and d). Figure 4.7b
highlights the morphological differences between the minerals struvite and
magnesium phosphate sampled from these sets of experiments.

103
4.5: Photographs of struvite and magnesium phosphate precipitates. (a) struvite precipitate in the presence of NPs sampled after the second Mg
2+/PO4
3- addition
for the N2 experiment where NP removal was greatest, (b) struvite precipitated in the presence of NPs at the end of the N2a experiment and (c) magnesium phosphate precipitated in the presence of NPs at the end of experiment N2c. Scale bar 10 mm.
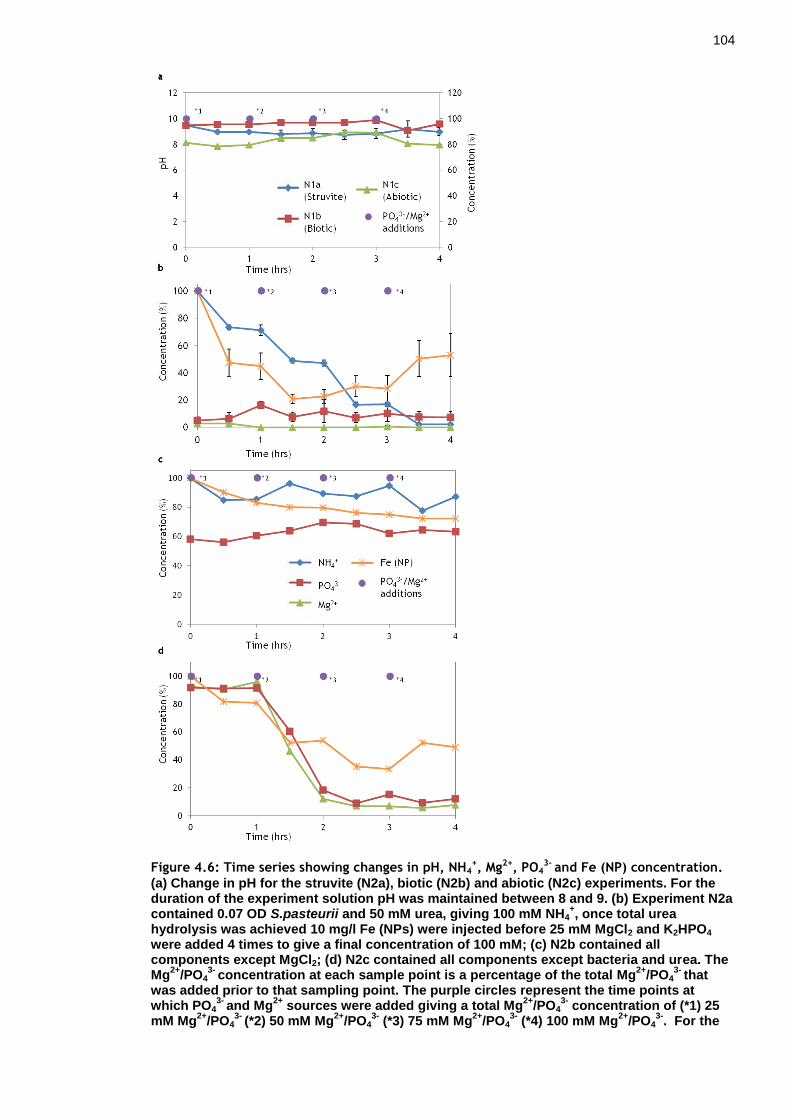
104
Figure 4.6: Time series showing changes in pH, NH4+, Mg2+, PO4
3- and Fe (NP) concentration.
(a) Change in pH for the struvite (N2a), biotic (N2b) and abiotic (N2c) experiments. For the duration of the experiment solution pH was maintained between 8 and 9. (b) Experiment N2a contained 0.07 OD S.pasteurii and 50 mM urea, giving 100 mM NH4
+, once total urea
hydrolysis was achieved 10 mg/l Fe (NPs) were injected before 25 mM MgCl2 and K2HPO4
were added 4 times to give a final concentration of 100 mM; (c) N2b contained all components except MgCl2; (d) N2c contained all components except bacteria and urea. The Mg
2+/PO4
3- concentration at each sample point is a percentage of the total Mg
2+/PO4
3- that
was added prior to that sampling point. The purple circles represent the time points at which PO4
3- and Mg
2+ sources were added giving a total Mg
2+/PO4
3- concentration of (*1) 25
mM Mg2+
/PO43-
(*2) 50 mM Mg2+
/PO43-
(*3) 75 mM Mg2+
/PO43-
(*4) 100 mM Mg2+
/PO43-
. For the
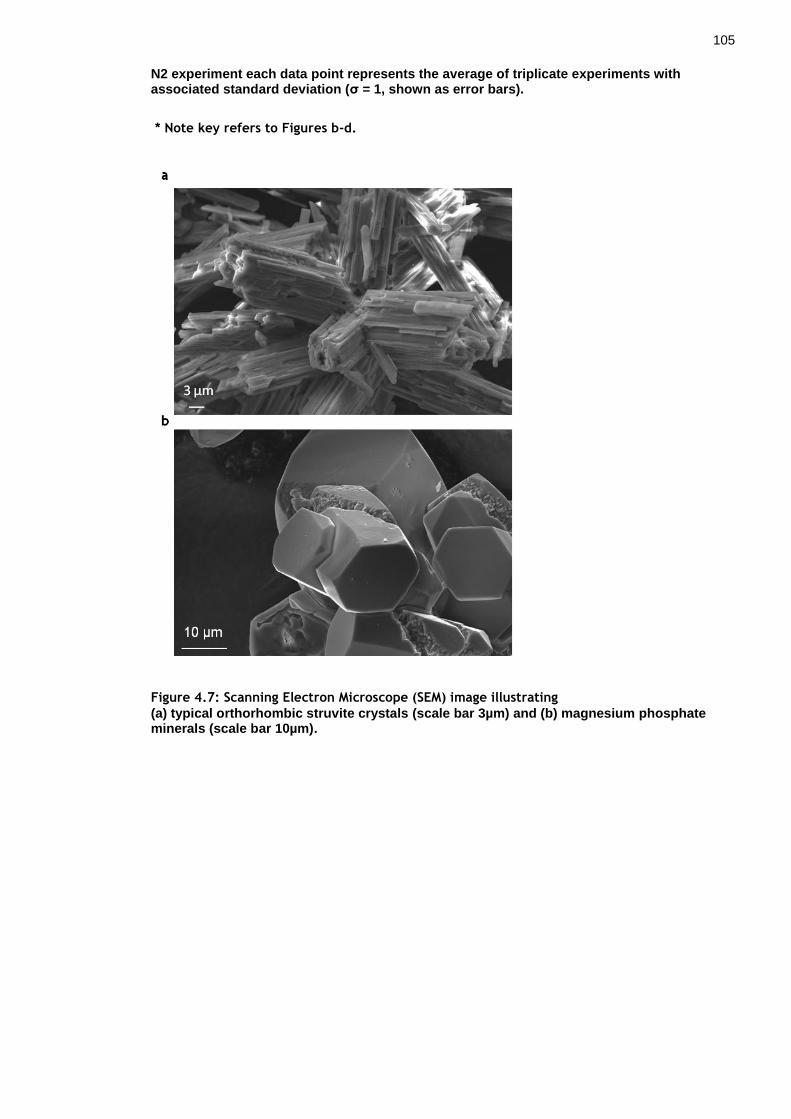
105
N2 experiment each data point represents the average of triplicate experiments with associated standard deviation (σ = 1, shown as error bars).
* Note key refers to Figures b-d.
Figure 4.7: Scanning Electron Microscope (SEM) image illustrating
(a) typical orthorhombic struvite crystals (scale bar 3µm) and (b) magnesium phosphate minerals (scale bar 10µm).
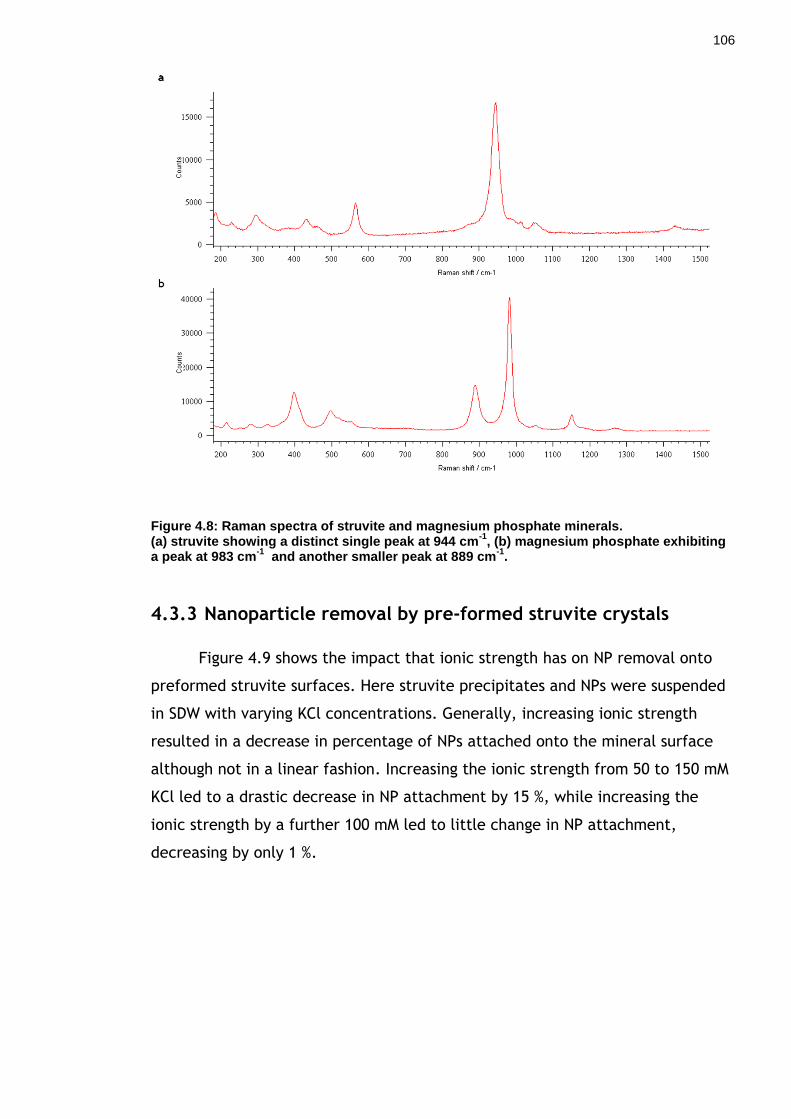
106
Figure 4.8: Raman spectra of struvite and magnesium phosphate minerals. (a) struvite showing a distinct single peak at 944 cm
-1, (b) magnesium phosphate exhibiting
a peak at 983 cm-1
and another smaller peak at 889 cm-1
.
4.3.3 Nanoparticle removal by pre-formed struvite crystals
Figure 4.9 shows the impact that ionic strength has on NP removal onto
preformed struvite surfaces. Here struvite precipitates and NPs were suspended
in SDW with varying KCl concentrations. Generally, increasing ionic strength
resulted in a decrease in percentage of NPs attached onto the mineral surface
although not in a linear fashion. Increasing the ionic strength from 50 to 150 mM
KCl led to a drastic decrease in NP attachment by 15 %, while increasing the
ionic strength by a further 100 mM led to little change in NP attachment,
decreasing by only 1 %.
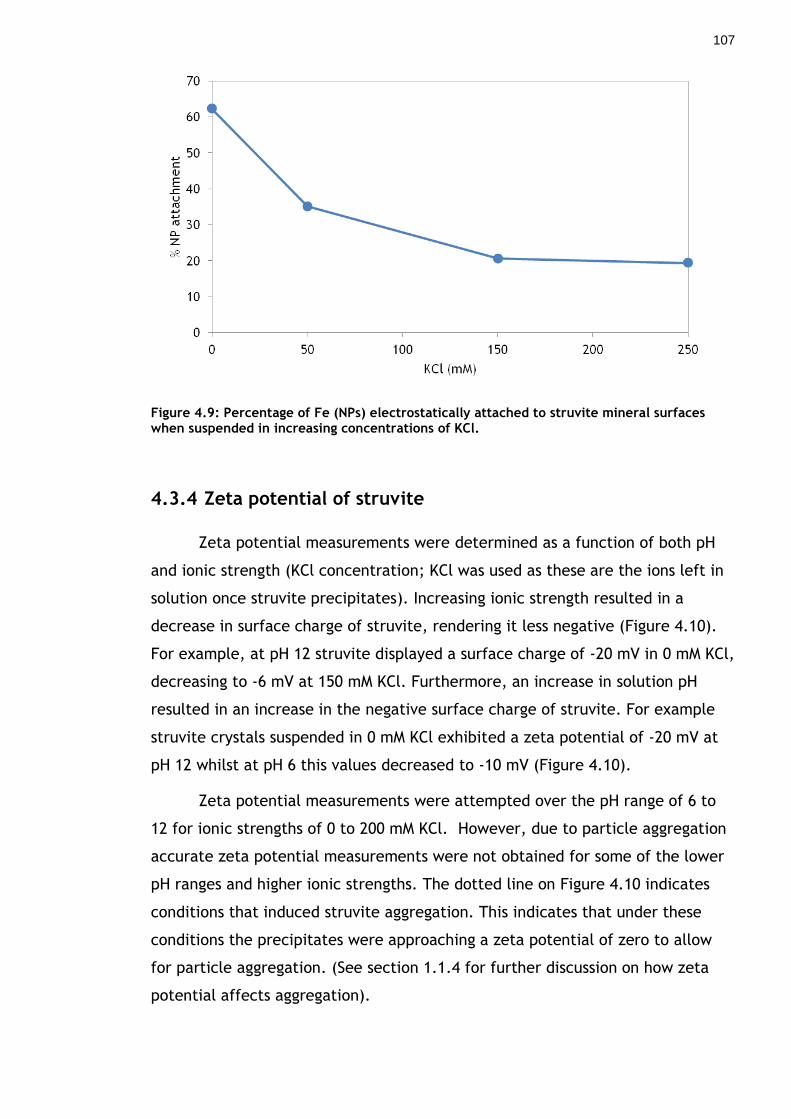
107
Figure 4.9: Percentage of Fe (NPs) electrostatically attached to struvite mineral surfaces when suspended in increasing concentrations of KCl.
4.3.4 Zeta potential of struvite
Zeta potential measurements were determined as a function of both pH
and ionic strength (KCl concentration; KCl was used as these are the ions left in
solution once struvite precipitates). Increasing ionic strength resulted in a
decrease in surface charge of struvite, rendering it less negative (Figure 4.10).
For example, at pH 12 struvite displayed a surface charge of -20 mV in 0 mM KCl,
decreasing to -6 mV at 150 mM KCl. Furthermore, an increase in solution pH
resulted in an increase in the negative surface charge of struvite. For example
struvite crystals suspended in 0 mM KCl exhibited a zeta potential of -20 mV at
pH 12 whilst at pH 6 this values decreased to -10 mV (Figure 4.10).
Zeta potential measurements were attempted over the pH range of 6 to
12 for ionic strengths of 0 to 200 mM KCl. However, due to particle aggregation
accurate zeta potential measurements were not obtained for some of the lower
pH ranges and higher ionic strengths. The dotted line on Figure 4.10 indicates
conditions that induced struvite aggregation. This indicates that under these
conditions the precipitates were approaching a zeta potential of zero to allow
for particle aggregation. (See section 1.1.4 for further discussion on how zeta
potential affects aggregation).

108
Figure 4.10: Zeta potential of struvite crystals measured as a function of pH and KCl concentration.
4.4 Discussion
In this study pH exerted a control over struvite supersaturation. In
experiment S1a (where Mg2+ and PO43- sources were added prior to urea
hydrolysis), magnesium phosphate minerals precipitated instead of struvite,
despite the production of NH4+. This is due to urea hydrolysis inducing an
extremely rapid pH rise from 6.5 to 8 (4.1a). Figure 4.11a, demonstrates that
above pH 7.25, both struvite and magnesium phosphate minerals are
supersaturated. Above pH 8 Mg3(PO4)2 exhibits a higher saturation index than
struvite (Figure 4.11a). Therefore as the reaction solution rapidly increases from
6.5 to 8, the pH were struvite exhibits the greatest saturation is passed and the
system quickly enters and then remains at a pH where Mg3(PO4)2 exhibits the
greatest saturation. Hence the dominance of magnesium phosphate
precipitation in this experiment. In the case of the biotic control experiment,
no Mg2+ was added and no precipitation (e.g., struvite, Mg-phosphates) was
observed (4.1b). In contrast the abiotic control (S. 1c) contains both MgCl2 and
K2HPO4, yet magnesium phosphate precipitation did not occur. Here, due to the
absence of bacteria and urea, ammonium production did not occur and thus
solution pH remained low (between pH 6 and 6.6, 4.1a), keeping the solution
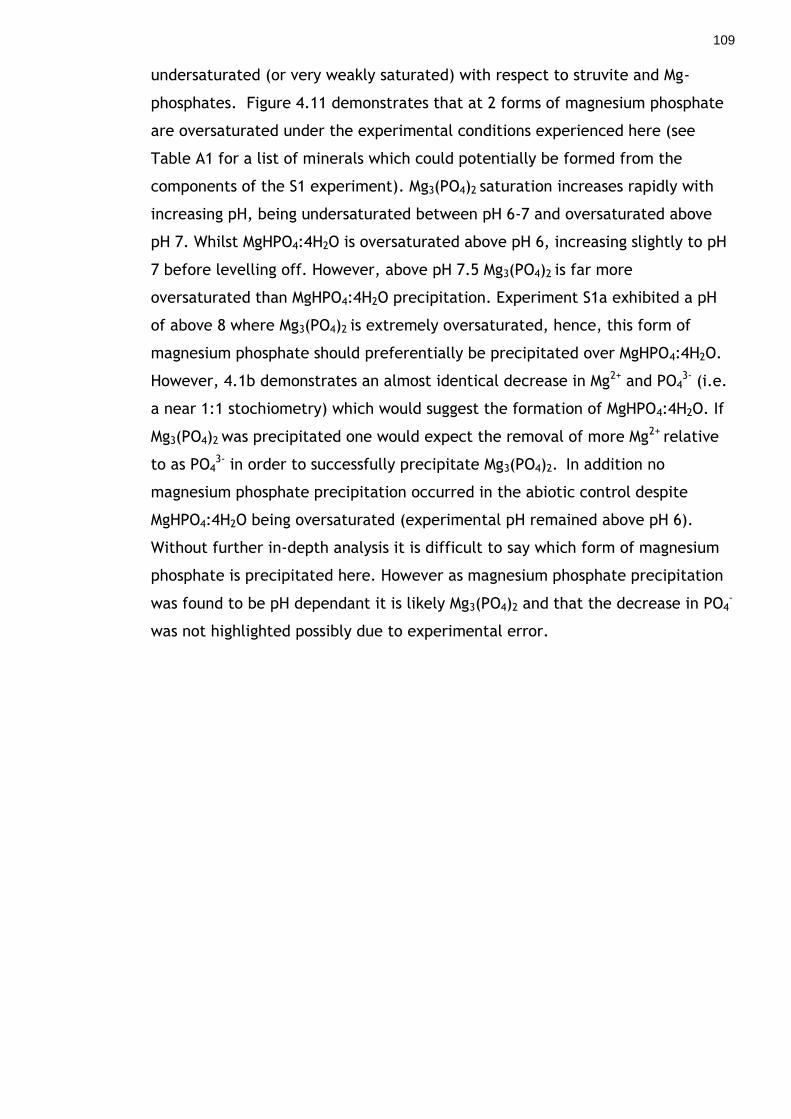
109
undersaturated (or very weakly saturated) with respect to struvite and Mg-
phosphates. Figure 4.11 demonstrates that at 2 forms of magnesium phosphate
are oversaturated under the experimental conditions experienced here (see
Table A1 for a list of minerals which could potentially be formed from the
components of the S1 experiment). Mg3(PO4)2 saturation increases rapidly with
increasing pH, being undersaturated between pH 6-7 and oversaturated above
pH 7. Whilst MgHPO4:4H2O is oversaturated above pH 6, increasing slightly to pH
7 before levelling off. However, above pH 7.5 Mg3(PO4)2 is far more
oversaturated than MgHPO4:4H2O precipitation. Experiment S1a exhibited a pH
of above 8 where Mg3(PO4)2 is extremely oversaturated, hence, this form of
magnesium phosphate should preferentially be precipitated over MgHPO4:4H2O.
However, 4.1b demonstrates an almost identical decrease in Mg2+ and PO43- (i.e.
a near 1:1 stochiometry) which would suggest the formation of MgHPO4:4H2O. If
Mg3(PO4)2 was precipitated one would expect the removal of more Mg2+ relative
to as PO43- in order to successfully precipitate Mg3(PO4)2. In addition no
magnesium phosphate precipitation occurred in the abiotic control despite
MgHPO4:4H2O being oversaturated (experimental pH remained above pH 6).
Without further in-depth analysis it is difficult to say which form of magnesium
phosphate is precipitated here. However as magnesium phosphate precipitation
was found to be pH dependant it is likely Mg3(PO4)2 and that the decrease in PO4-
was not highlighted possibly due to experimental error.
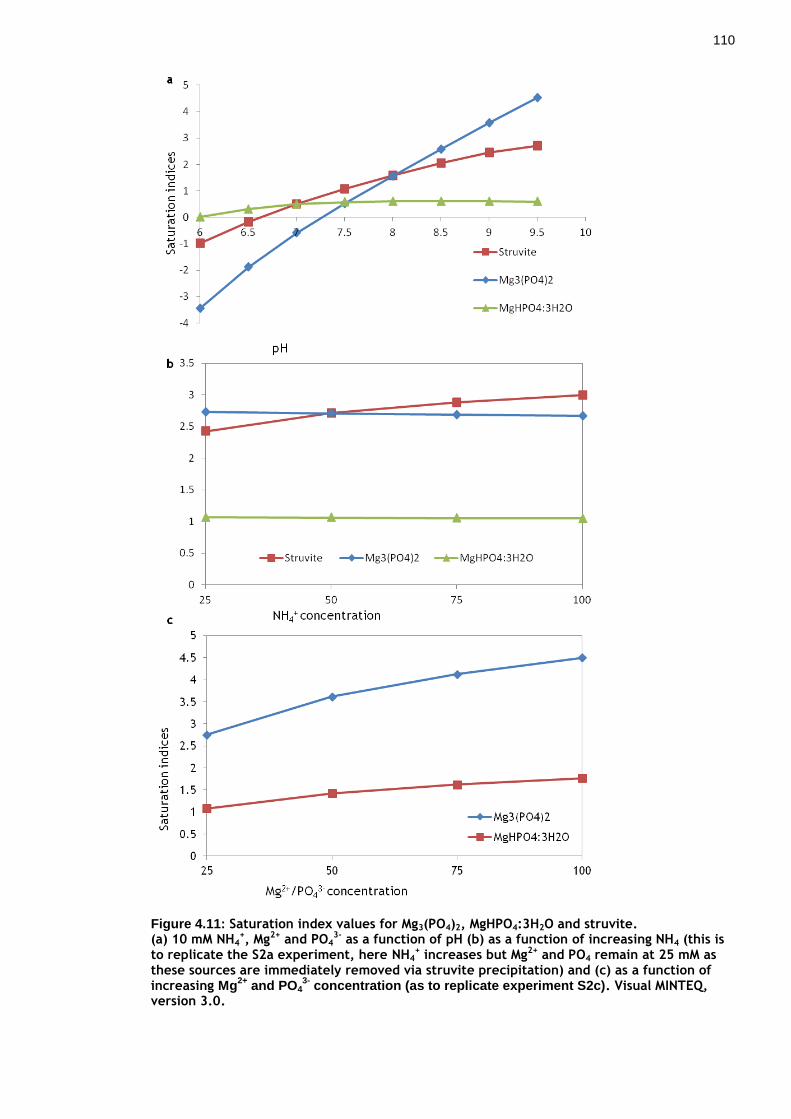
110
Figure 4.11: Saturation index values for Mg3(PO4)2, MgHPO4:3H2O and struvite. (a) 10 mM NH4
+, Mg2+ and PO43- as a function of pH (b) as a function of increasing NH4 (this is
to replicate the S2a experiment, here NH4+ increases but Mg2+ and PO4 remain at 25 mM as
these sources are immediately removed via struvite precipitation) and (c) as a function of increasing Mg
2+ and PO4
3- concentration (as to replicate experiment S2c). Visual MINTEQ,
version 3.0.
111
In order to promote struvite precipitation more NH4+ ions must be present
relative to Mg2+ and PO43- to ensure struvite exhibits a higher saturation index
than magnesium-phosphate (as in experiment S2). Figure 4.11b demonstrates
that at >50 mM NH4+ struvite exhibits a higher saturation index than magnesium
phosphate at pH 8. Bellow this threshold, theoretically, magnesium phosphate
minerals should preferentially precipitate over struvite. Notably, however,
Figure 4.2 demonstrates that all of the 100 mM NH4+ produced by ureolysis was
removed by struvite precipitation. This is surprising as one may expect struvite
precipitation to occur until just under 50 mM NH4+ is left in solution, at which
point Mg-phosphate would precipitate. A possible explanation for the total
removal of NH4+ may be that preformed struvite crystals already exist, acting as
templates for the precipitation of struvite rather than magnesium phosphate.
Struvite precipitation was extremely effective in removing positively
charged NPs from solution during the initial stages of the experiments. However,
by the third Mg2+/PO43- addition, i.e., precipitation event, NP resuspension
occurred. As with a calcite precipitating system electrostatic interactions
control the success of NP immobilisation (Chapter 2). However, the re-
suspension of NPs elucidates an important process of NP immobilisation via
struvite precipitation. In both cases NPs are electrostatically attracted to the
mineral surface. However, the ability of NPs to be released at increasing ionic
strength and decreasing pH in the struvite system, suggests they are merely
attached to the struvite surface, rather than occluded within the struvite
crystal. This is likely because the calcite precipitating system is driven during
bacterial ureolysis, and so the process of precipitation is much slower. Slower
mineral growth allows the NP to be overtaken by the advancing solidification
front, entrapping the NP within the mineral precipitate. Conversely, the
struvite precipitation system developed and applied here leads to instantaneous
homogeneous nucleation of struvite crystals through which struvite precipitation
was observed within matter of seconds (after Mg2+/PO43- additions). As such NPs
have not had time to attach and become occluded within the quickly forming
crystals. Instead NPs simply sorb onto the surface of the mineral once they
formed and start to settle out. This process occurs with every addition of
Mg2+/PO43-, initiating struvite precipitation followed by NP sorption. This occurs
until a certain pH/ionic strength is reached where the mineral and NP surface
112
charge are dulled to the point where NPs are no longer attracted to the mineral
surface, and start to desorb.
This phenomenon is demonstrated by the changes in pH induced by the
removal of NH4+ via struvite formation induced by the addition Mg2+/PO4
3- salts
(Figure: 4.4a). In the N1a experiment the solution pH decreased from pH 9 at
the start of the experiment to pH 6.5 after the removal of 82% NH4+ (Figure:
4.4a). Solution pH has long been known to exert a strong control on mineral
surface charge in aqueous solution (Van Cappellen et al., 1993, Carre and
Lacarriere, 2006, Hazen and Sverjensky, 2010). Typically, at lower pH mineral
surfaces become protonated, thus becoming increasingly positively charged (or
less negatively charged). Conversely, with increasing pH mineral surfaces
become progressively more negative due to deprotonation (Hazen and
Sverjensky, 2010). This is demonstrated by Figure 4.10. Here the zeta potential
of struvite decreases from -20 mV to -10 mV when the pH of the solution is
reduced from pH 12 to 6 respectively (when suspended in 0 mM KCl). With this
the mineral becomes less negative, resulting in a weakening of the electrostatic
attraction of the positively charged NP to the mineral surface and thus
facilitating the release of nanoparticles back into solution. It should be noted
here that the amine groups on the positively charged nanoparticle likely exhibit
pKa’s between 8-9 (Phoenix et al., 2002). From this we can approximate that as
pH drops through pH 8 or 9, the amine groups are protonating and becoming
more positively charged. This may counteract the loss of negative charge on the
struvite, to assist electrostatic attraction, although evidently not sufficiently
enough to prevent NP remobilization.
With the aim of increasing the electrostatic attraction between the
positively charged NP and the negatively charged mineral surface, the NP
immobilisation experiments were repeated with solution pH controlled between
pH 8-9. Maintaining a high pH showed a marked improvement by enhancing NP
removal by 30%. This is likely due to an increased surface charge on the mineral
(struvite) surface enhancing electrostatic attraction (this also indicates that at
these pHs the NP was still positively charged and had not deprotonated).
However, this increase in NP capture may also be attributed to the formation of
a larger mineral surface area, due to the formation of more crystallites. As pH
increases, the saturation index for struvite also increases (Figure 4.11a), and so
at pH 9, 98% of the NH4+ produced by ureolysis was removed through struvite
113
precipitation compared to 80% when the pH dropped below 7 (compare Figure:
4.4b and Figure 4.6b). Here, an increase in the mineral surface area available
for NPs to attach may also explain the increase in NP immobilisation. Either way,
a higher pH was favourable for increased NP attachment.
Intriguingly, despite maintaining a high pH NP re-suspension still occurred.
Aside from pH, solution ionic strength also exerts a strong control on surface
charge with increasing ionic strength reducing surface charge (see Chapter
1.1.3). Here, it is the increase in ionic strength, which accounts for the re-
suspension of NPs in the NP immobilisation experiment (N2a, Figure 4.6b). Each
addition of Mg2+/PO43- leads to an increase in the ionic strength of the solution,
as the K+ and Cl- ions are left over from the added salts,(MgCl2 and K2HPO4)
whilst Mg2+ and PO43- ions are removed by struvite precipitation. With each
addition, dissolved K+ and Cl- concentration increases by 50 mM, giving a final
concentration of 200 mM KCl. Increasing solution ionic strength results in a
decrease in the EDL for the mineral surface and the NP, weakening the
electrostatic attraction between these two surfaces leading to the re-suspension
of previously immobilised NPs. Figure 4.10 highlights this phenomenon. Here
preformed struvite precipitates were suspended in 50, 100, 150mM and 200 mM
KCl and zeta potential was measured using Zeta Potential Analyser (Zetasizer
Nano ZS, Malvern). With increasing KCl concentration the zeta potential of the
mineral surface decreased from -20 to -6 with an increase in KCl from 0 to
150mM KCl respectively when measured at pH 12. Figure 4.6b shows significant
re-suspension of NPs after the final addition of Mg2+/PO43-, here the
concentration of K+ and Cl- increases from 150 to 200 mM, with this final
addition a tipping point is reached, compressing the EDL to such an extent that
NPs are no longer bound to the mineral surface by electrostatic attraction. This
is further confirmed by Figure 4.10 as an accurate zeta potential measurement
could not be obtained at this ionic strength and pH (200 mM KCl, pH 8-9) due to
aggregation of struvite crystals. This indicates that the precipitates were
approaching a zeta potential of zero which led to particle aggregation (during
the zeta potential measurement) and resuspension of NPs (in the NP
immobilisation experiments). The role that ionic strength plays in influencing
the sorption of NP onto the mineral surface is displayed in Figure 4.9 which
shows NP sorption onto struvite. Here, with increasing ionic strength the
percentage of attached NPs decreases.
114
The potential for NP attachment to struvite precipitates was modelled
using the calssical Derjaguin-Landau-Verwey-Overbeek (DLVO) model. This is
described in full in Chapter 2.6. The tested parameters used are identical for
those used in Chapter 2 aside from the Hamaker constant for struvite (A22) which
was calculated as 1.54x10⁻²⁰ using the Hamaker constant calculator published by
Overney (2009), see Appendix B. This generates a combined NP-struvite-water
(A132) Hamaker constant of -1.58 x10⁻²⁰. The DLVO model was run for the N2
experiment where the pH was maintained between pH 8 and 9. Figure 4.12
demonstrates interaction energy profiles between the positively charged NPs and
the negatively charged struvite precipitates. Here, a repulsive van der Waals
interaction is counteracted by an attractive electrical double layer resulting in a
complex total interaction energy profile (Figure 4.12). As the two surfaces
approach, a small repulsive energy exists. Once this repulsive interaction energy
is passed an attractive well exists at less than 5 nm separation distance. This
results from the dominance of the attractive electrical double layer, that is,
until a few 10ths of an nm are reached where a very strong repulsive interaction
energy exists due to the dominance of the repulsive van der Waals interaction.
The Debye length used for Figure 4.12 was calculated based on the second
Mg2+/PO43- addition, i.e. 50 mM KCl and 75 mM NH4
+. Under these conditions NP
sorption onto struvite precipitates is observed. Based on the DLVO model
observed here, this would suggest NPs are attached due to the small energy
well. Whilst Figure 4.13 demonstrates that with increasing ionic strength (due to
the addition of K+ and Cl- ions left over from the added salts, MgCl2 and K2HPO4)
the depth of the attractive energy well decreases until at 200 M/m3 the total
interaction energy profile becomes repulsive. This agrees with what is observed
experimentally for the N2a experiment where after the final Mg2+/PO43- addition
NP concentration increased by 30% Figure 4.6b. Confirming that increasing
solution ionic strength results from a weakening of the electrostatic attraction
resulting from the attractive EDL between the mineral and the NPs, leading to
the re-suspension of previously immobilised NPs. Overall, the DLVO model
produced here is interesting in that the interaction energies are largely repulsive
(apart from the energy well), despite NP and mineral surfaces exhibiting
opposite charges. This repulsive interaction energy results from a negative
combined Hamaker constant (A132) of -1.58 x10⁻²⁰ produced from the interaction
of the positively charged NPs, struvite precipitates and the dispersing medium
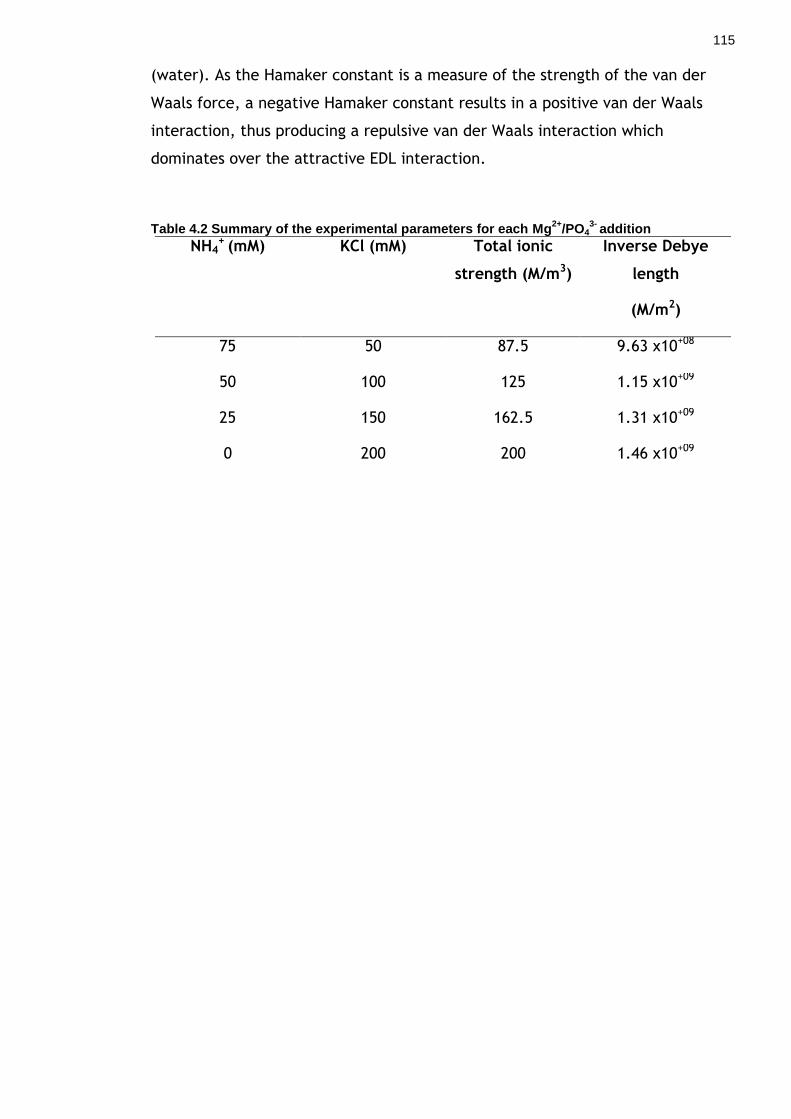
115
(water). As the Hamaker constant is a measure of the strength of the van der
Waals force, a negative Hamaker constant results in a positive van der Waals
interaction, thus producing a repulsive van der Waals interaction which
dominates over the attractive EDL interaction.
Table 4.2 Summary of the experimental parameters for each Mg2+
/PO43-
addition
NH4+ (mM) KCl (mM) Total ionic
strength (M/m3)
Inverse Debye
length
(M/m2)
75 50 87.5 9.63 x10+08
50 100 125 1.15 x10+09
25 150 162.5 1.31 x10+09
0 200 200 1.46 x10+09
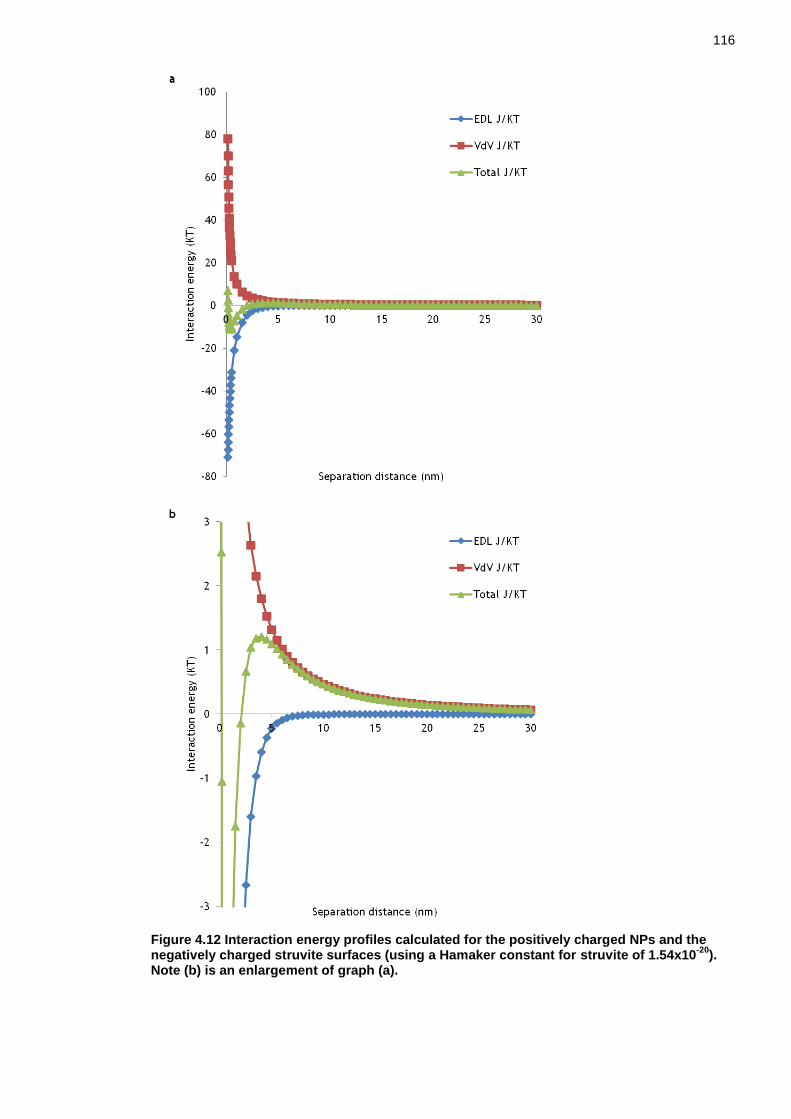
116
Figure 4.12 Interaction energy profiles calculated for the positively charged NPs and the negatively charged struvite surfaces (using a Hamaker constant for struvite of 1.54x10
-20).
Note (b) is an enlargement of graph (a).

117
Figure 4.13: Total interaction energy profile for positively charged NPs interacting with struvite surfaces as a function of increasing KCl concentrations from 87.5 to 200 M/m
3.
Unexpectedly the abiotic control resulted in the precipitation of magnesium
phosphate minerals in both NP immobilisation experiments (N1c and N2c). Here,
with every addition of Mg2+/PO43- magnesium phosphate is becoming increasingly
oversaturated, (Figure 4.11c) resulting in the precipitation of magnesium
phosphate. The precipitation of magnesium phosphate also resulted in a
decrease in NP concentration, indicating the magnesium phosphate also exhibits
a negative surface charge and thus can capture NPs. As with the struvite
precipitating system, NP resuspension occurred in the latter half of the
experiment for the first NP immobilisation experiment, N1c (Figure: 4.4d). This
suggests NPs were captured by surface adsorption rather than occlusion. Here,
all of the immobilised NPs desorbed from the Mg-phosphate mineral surfaces
resulting in no NP removal by the end of the experiment. However, in the
second NP immobilisation experiment, N2c, maintaining solution pH between 8
and 9 showed a noticeable improvement in NP capture. By the third addition 65%
NPs were removed by electrostatic attraction onto the Mg-phosphate surfaces
(Figure 4.6d). However, with the fourth addition 15% of the adsorbed NP
desorbed again, resulting in the immobilisation of 49% NPs (Figure 4.6d). Under
these conditions almost identical rates of NP immobilisation occurred under both
the struvite (immobilised 52% NPs) and magnesium phosphate (immobilised 49%
NPs) precipitation systems.
118
4.5 Conclusion
Struvite has shown to not only immobilise positively charged NPs from
solution but also successfully remove close to 100% NH4+ produced by bacterial
ureolysis. NP immobilisation was found to be highly dependent on both pH and
ionic strength. Maintaining solution between pH 8 and 9 showed a marked
improvement in NP immobilisation, removing 80% Fe NPs. However once the
ionic strength exceeds 100 mM KCl NP resuspension occurs, indicating that NPs
are reversibly attached to the mineral surface by electrostatic attraction. Under
certain environmental conditions struvite may be used as a tool to immobilise
toxic NPs from environmental and wastewater treatment systems.

119
5 Bacterial biosorption of nanoparticles
5.1 Summary
Bacteria and biofilms are widely used to adsorb and degrade numerous
contaminants and are commonly used as a treatment step in many wastewater
treatments plants. Here, we test the ability of B. subtilis, a common
groundwater bacterium, and wastewater treatment biofilms to adsorb and
remove NPs from solution. Both biosorbent materials were highly efficient at
removing positively charged NPs from solution, while failed to adsorb negatively
charged NPs. Adsorption of positive NPs onto B. subtilis was found to be
dependent on pH, with greater adsorption at higher pH. This pH dependence
must result from the greater negative surface charge exhibited by bacteria at
higher pH. Desorption studies, however, revealed adsorption was only partly
reversible. In addition, the presence of slower adsorption kinetics in biofilms
compared to planktonic biofilms suggests diffusion of NPs through the porous
structure of the biofilm. Overall, these findings highlight that planktonic
bacteria and biofilms are highly efficient biosorbants for NPs, this holds
implications for NP transport in environmental systems and through wastewater
treatment plants.
5.2 Introduction
The ability for bacteria to adsorb/immobilise NPs from solution was briefly
highlighted when testing the ability of bacterially driven solid phase capture to
immobilise NPs (Chapter 3). Here, positively charged NPs (S-posNPs) were shown
to adsorb onto the negative bacterial surface of S. pasteurii while negatively
charged NPs (S-negNPs) remained in suspension. To date, a significant amount of
geomicrobial research has focused adsorption of cations by bacteria (Gorman-
Lewis et al., 2005, Yee and Fein, 2001, Yee et al., 2004, Ngwenya et al., 2003,
Small et al., 2001, Fein et al., 1997). Despite this, the potential for bacteria to
adsorb nanoparticles (NPs) has received little attention.
Bacteria, ubiquitous to all ecosystems, have the ability to adsorb an array
of cations from environmental systems. The cell wall of gram positive bacteria
contain several organic functional groups; such as amine, carboxyl, hydroxyl and
phosphoryl groups (Fein et al., 1997). The ionisation of these proton active
120
functional groups (namely carboxyl, phosphoryl and hydroxyl functional groups)
creates a negative charge which surrounds the cell (Yee et al., 2004). The
electric field surrounding the bacterium determines the distribution of the ions
and counterions at the cell-water interface, strongly influencing the metal
binding capacity of the cell wall (Yee et al., 2004). Potential bacterial
biosorbents include the genre of Bacillus, Pseudomonas and Streptomyces
(Vijayaraghavan and Yun, 2008). Such biosorbants have the ability to bind
significant quantities of toxic metals from environmental systems, for example
Ziagova (2007) saw the successful biosorption of 278 mg g-1 cadmium by the
organism Pseudomonas sp.
Currently municipal wastewater treatment plants (WWTP) take advantage
of the biosorbent properties of bacteria, using them as part of their treatment
system. Biofilm reactors such as fluidised beds, up flow sludge blankets and
granular sludge blankets contain dense bacterial flocs (activated sludge) which
sorb and degrade an array of pollutants (Nicolella et al., 2000, Lazarova and
Manem, 1995, Vijayaraghavan and Yun, 2008). Bacterial flocs or granules are
capable of operating both anaerobically and aerobically. Anaerobic granulation
has been extensively studied and is most commonly used by wastewater
treatment plants (Liu et al., 2004, Liu and Tay, 2004). Hence, in this study only
anaerobic granules were tested. Biogranules are more complex than their single
celled counterparts, being composed of multiple communities bound by
extracellular polymeric substances (EPS) via a process of self immobilisation (Liu
and Tay, 2004).The process of self immobilisation is initiated by the introduction
of inorganic nuclei and is carefully controlled by the reactors operating
conditions (Tay et al., 2004, Liu and Tay, 2004). In addition the filamentous
bacterium Methanothrix has been suggested to play a key role in binding the
microbial components together, creating a dense floc composed of millions of
organisms per gram of biomass (Quarmby and Forster, 1995, Liu and Tay, 2004).
Flocs offer key advantages, such as high biomass retention, cell-liquid separation
via sedimentation and can withstand high-strength wastewater and shock
loadings due to their regular, dense and strong structural properties (Nicolella et
al., 2000, Liu and Tay, 2004). With the increasing use of nanomaterials, WWTPs
are likely to play a key role in determining pathways for NP pollutants. Indeed
Kiser et al. (2010) reports the detection of titanium dioxide NPs of up to 3000 µg
Ti/L in raw sewage at a full scale municipal WWTP in Arizona (USA). Kiser et al.
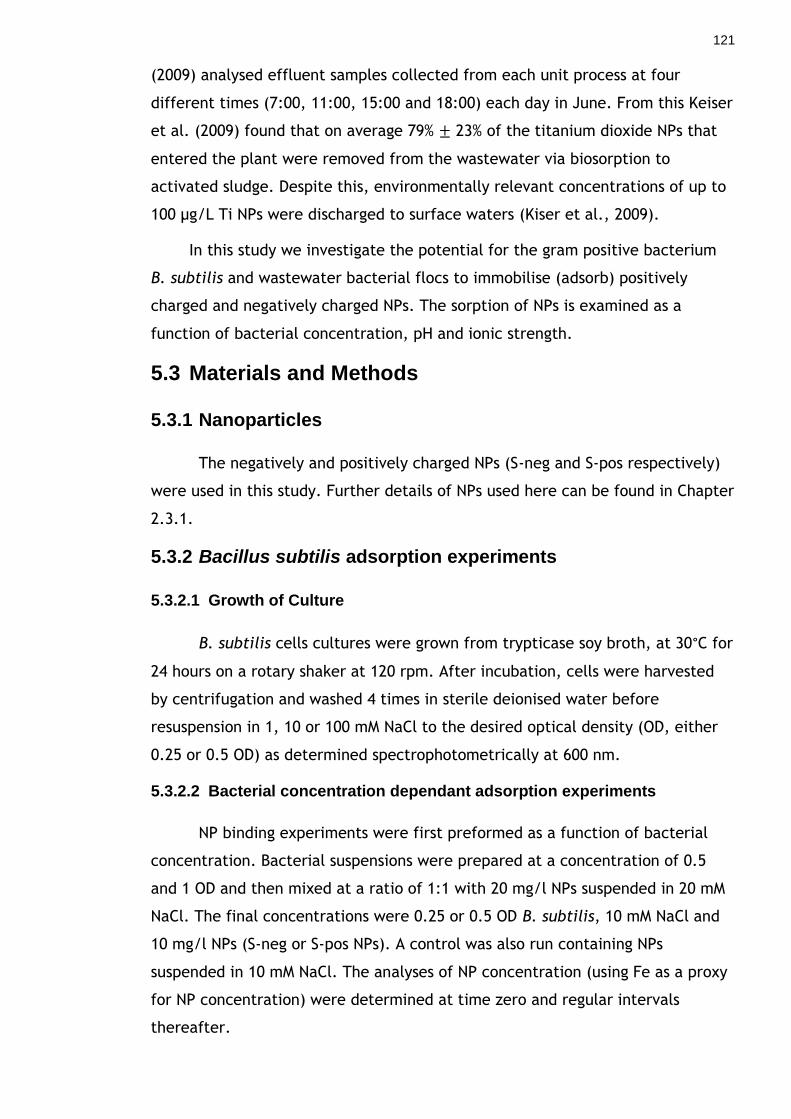
121
(2009) analysed effluent samples collected from each unit process at four
different times (7:00, 11:00, 15:00 and 18:00) each day in June. From this Keiser
et al. (2009) found that on average 79% 23% of the titanium dioxide NPs that
entered the plant were removed from the wastewater via biosorption to
activated sludge. Despite this, environmentally relevant concentrations of up to
100 µg/L Ti NPs were discharged to surface waters (Kiser et al., 2009).
In this study we investigate the potential for the gram positive bacterium
B. subtilis and wastewater bacterial flocs to immobilise (adsorb) positively
charged and negatively charged NPs. The sorption of NPs is examined as a
function of bacterial concentration, pH and ionic strength.
5.3 Materials and Methods
5.3.1 Nanoparticles
The negatively and positively charged NPs (S-neg and S-pos respectively)
were used in this study. Further details of NPs used here can be found in Chapter
2.3.1.
5.3.2 Bacillus subtilis adsorption experiments
5.3.2.1 Growth of Culture
B. subtilis cells cultures were grown from trypticase soy broth, at 30°C for
24 hours on a rotary shaker at 120 rpm. After incubation, cells were harvested
by centrifugation and washed 4 times in sterile deionised water before
resuspension in 1, 10 or 100 mM NaCl to the desired optical density (OD, either
0.25 or 0.5 OD) as determined spectrophotometrically at 600 nm.
5.3.2.2 Bacterial concentration dependant adsorption experiments
NP binding experiments were first preformed as a function of bacterial
concentration. Bacterial suspensions were prepared at a concentration of 0.5
and 1 OD and then mixed at a ratio of 1:1 with 20 mg/l NPs suspended in 20 mM
NaCl. The final concentrations were 0.25 or 0.5 OD B. subtilis, 10 mM NaCl and
10 mg/l NPs (S-neg or S-pos NPs). A control was also run containing NPs
suspended in 10 mM NaCl. The analyses of NP concentration (using Fe as a proxy
for NP concentration) were determined at time zero and regular intervals
thereafter.

122
5.3.2.3 pH and ionic strength dependant adsorption experiments
NP sorption experiments were preformed as a function of pH (pH 2-10) in
1, 10 and 100 mM NaCl. A bacterial concentration of 0.25 OD and the S-pos NP
were chosen for the pH experiments. The pH of the bacterial solution was
adjusted using NaOH and HCl before addition of the NP-NaCl solution and left to
react for 90 minutes before sampling (this sample period was chosen based on
the kinetic data obtained from experiments presented in section 5.4.1.1. Note
that the experiments were performed as batch reactions (each analysed pH is an
individual experiment).
5.3.2.4 Desorption experiments
Desorption experiments were performed to determine the reversibility of
NP adsorption onto the surface of B. subtilis. The pH of the bacterial - NaCl
solution was adjusted to pH 10 using NaOH before addition of NPs. The solution
was left to react for 20 minutes before the pH was dropped using HCl in a
stepwise fashion, sampling at every pH, until pH 2.
5.3.3 Wastewater biofilm adsorption experiments
5.3.3.1 Wastewater Biofilm samples
Anaerobic wastewater biofilms were sampled from 485 m3 expanded
granular sludge bed treating distillery wastewater in Edinburgh, UK. The Biofilm
flocs ranged from 1 to 3 mm in diameter and were composed of an
agglomeration of several bacterial species (Figure 5.1). Biofilm flocs were
washed 4 times with sterile deionised water SDW to remove any impurities.
123
Figure 5.1: Image of wastewater biofilm flocs.
5.3.3.2 Concentration dependant adsorption experiments
NP binding experiments were first preformed as a function of biofilm
concentration. Two and 4 g of biofilm (wet weight) were weighed and added to
10 mg/l S-pos NPs suspended in 10 mg/l NaCl. The biofilm-NP solutions were
gently agitated on a rotary shaker at 50 rpm to ensure the biofilm flocs remain
in suspension throughout the duration of the experiment, yet remained intact.
The analyses of Fe (NP) concentration were determined at time zero and regular
intervals thereafter.
5.3.3.3 pH and ionic strength dependant adsorption experiments
NP adsorption experiments were then preformed as a function of pH (pH
3-10) in 1, 10 and 100 mM NaCl. pH and ionic strength dependent adsorption
experiments were not preformed at pH 2 due to the release of Fe (possibly
obtained from the distillery) from the biofilm under such acidic conditions. A
biofilm concentration of 2 g was chosen for the pH dependant experiments. The
biofilm samples were suspended in the desired NaCl solutions and the pH of the
solution was adjusted using NaOH and HCl. Once the desired pH was reached, 10
mg/l Fe NPs were directly added to the biofilm-NaCl solution and left to react
for 90 minutes before sampling. The biofilm-NP solutions were gently agitated
on a rotary shaker at 50 rpm to ensure the biofilm flocs remain in suspension

124
throughout the duration of the experiment. Note that each pH is an individual
experiment (i.e. batch reaction).
A summary of all the tested experimental conditions can be seen in
125
Table 5.1.
5.3.4 Chemical analysis
At each sampling time 5 ml aliquots were removed from the experiment.
After pH measurement 3 ml of the sample was mixed with 1 ml 50% HCl for Fe
(NP) measurement by atomic absorption spectroscopy.
5.3.5 Transmission Electron Microscopy (TEM)
Bacteria and biofilms were examined by Transmission Electron Microscopy
(TEM) to confirm the presence of attached nanoparticles. After reaction with
NPs, bacteria and biofilms were first fixed overnight in 2.5% glutaraldehyde in
0.05M HEPES buffer at pH 7. These were then washed in phopshate buffer three
times, dehydrated through an ethanol series (30%, 50%, 70%, 90%, 4x100%), then
embedded in Epon812 resin and cured at 60oC. Once the resin had cured,
samples were section into ultra-thin sections using a diamond knife and
ultramicrotome. Note that during processing samples were split into three
groups to receive different levels of contrast staining. One set was pre-stained
with 1% Osmium tetroxide (1 hour) followed by post-staining with 2% uranyl
acetate (1 hour). A second set was only post-stained in uranyl acetate, while a
third set was not stained at all. Note that pre- staining occurs before
embedding in resin, while post-staining occurs after the embedded samples have
been microtomed into ultra-thin sections. Different levels of staining were done
to provide different levels of contrast in the TEM. Staining is useful as the heavy
metal stains bind to the bacterial cell, giving it contrast in TEM and thus making
cells easier to see. However, as the NPs have magnetite cores, this mineral will
already exhibit strong contrast and thus NPs will be easily visible, and indeed
easier to spot, without staining. Sections were viewed on a FEI Tecnai T20 TEM
operating at 120 kv.
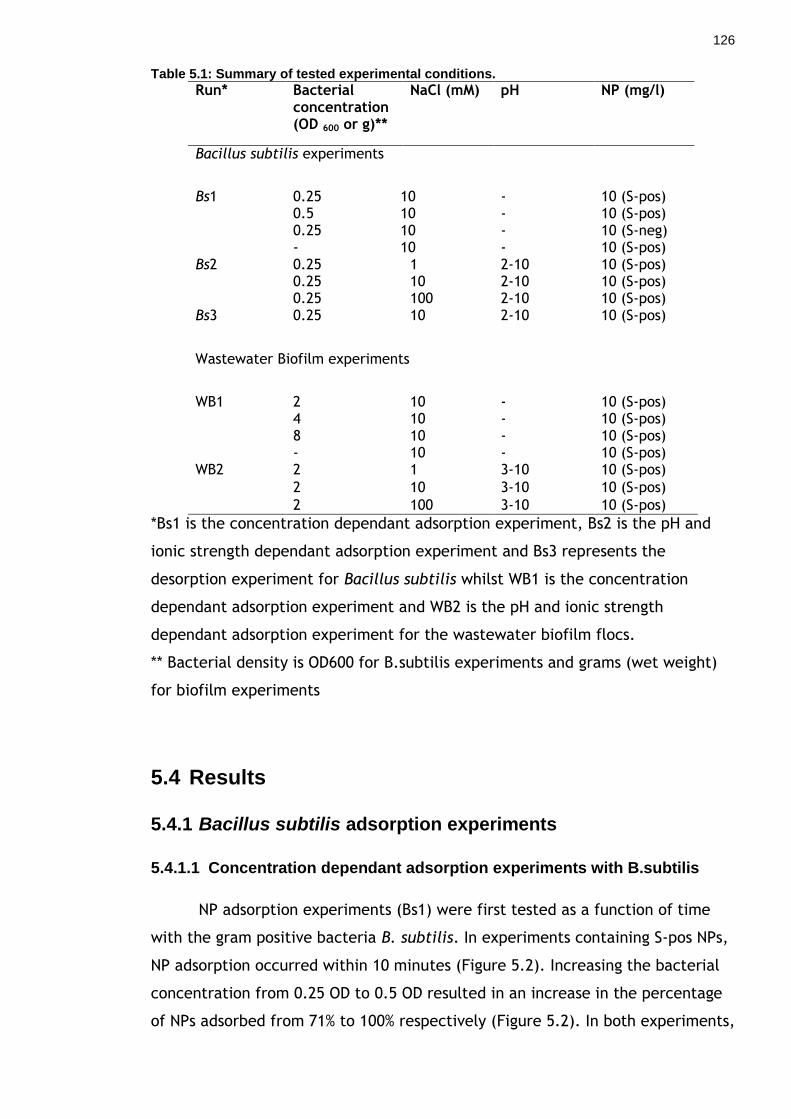
126
Table 5.1: Summary of tested experimental conditions.
Run* Bacterial concentration (OD 600 or g)**
NaCl (mM) pH NP (mg/l)
Bacillus subtilis experiments
Bs1 0.25 10 - 10 (S-pos) 0.5 10 - 10 (S-pos) 0.25 10 - 10 (S-neg) - 10 - 10 (S-pos)
Bs2 0.25 1 2-10 10 (S-pos) 0.25 10 2-10 10 (S-pos) 0.25 100 2-10 10 (S-pos)
Bs3 0.25 10 2-10 10 (S-pos)
Wastewater Biofilm experiments
WB1 2 10 - 10 (S-pos) 4 10 - 10 (S-pos) 8 10 - 10 (S-pos) - 10 - 10 (S-pos)
WB2 2 1 3-10 10 (S-pos)
2 10 3-10 10 (S-pos)
2 100 3-10 10 (S-pos)
*Bs1 is the concentration dependant adsorption experiment, Bs2 is the pH and
ionic strength dependant adsorption experiment and Bs3 represents the
desorption experiment for Bacillus subtilis whilst WB1 is the concentration
dependant adsorption experiment and WB2 is the pH and ionic strength
dependant adsorption experiment for the wastewater biofilm flocs.
** Bacterial density is OD600 for B.subtilis experiments and grams (wet weight)
for biofilm experiments
5.4 Results
5.4.1 Bacillus subtilis adsorption experiments
5.4.1.1 Concentration dependant adsorption experiments with B.subtilis
NP adsorption experiments (Bs1) were first tested as a function of time
with the gram positive bacteria B. subtilis. In experiments containing S-pos NPs,
NP adsorption occurred within 10 minutes (Figure 5.2). Increasing the bacterial
concentration from 0.25 OD to 0.5 OD resulted in an increase in the percentage
of NPs adsorbed from 71% to 100% respectively (Figure 5.2). In both experiments,
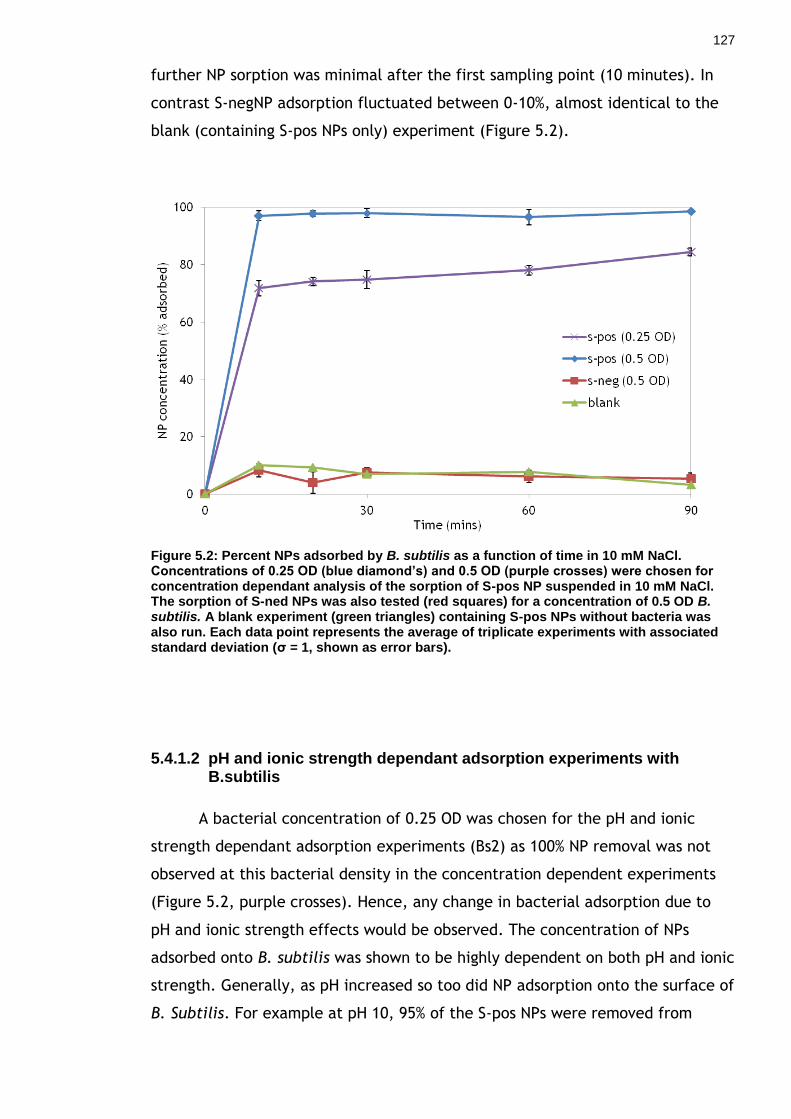
127
further NP sorption was minimal after the first sampling point (10 minutes). In
contrast S-negNP adsorption fluctuated between 0-10%, almost identical to the
blank (containing S-pos NPs only) experiment (Figure 5.2).
Figure 5.2: Percent NPs adsorbed by B. subtilis as a function of time in 10 mM NaCl. Concentrations of 0.25 OD (blue diamond’s) and 0.5 OD (purple crosses) were chosen for concentration dependant analysis of the sorption of S-pos NP suspended in 10 mM NaCl. The sorption of S-ned NPs was also tested (red squares) for a concentration of 0.5 OD B. subtilis. A blank experiment (green triangles) containing S-pos NPs without bacteria was also run. Each data point represents the average of triplicate experiments with associated standard deviation (σ = 1, shown as error bars).
5.4.1.2 pH and ionic strength dependant adsorption experiments with
B.subtilis
A bacterial concentration of 0.25 OD was chosen for the pH and ionic
strength dependant adsorption experiments (Bs2) as 100% NP removal was not
observed at this bacterial density in the concentration dependent experiments
(Figure 5.2, purple crosses). Hence, any change in bacterial adsorption due to
pH and ionic strength effects would be observed. The concentration of NPs
adsorbed onto B. subtilis was shown to be highly dependent on both pH and ionic
strength. Generally, as pH increased so too did NP adsorption onto the surface of
B. Subtilis. For example at pH 10, 95% of the S-pos NPs were removed from

128
solution when suspended 10 mM NaCl, whereas at pH 2 only 25% NP adsorption
occurred (Figure 5.3, red squares). In addition to this, increasing the ionic
strength of the solution resulted in a decrease in the percentage of NPs adsorbed
by B. subtilis. At pH 8, 95% of the NPs added were adsorbed by B. subtilis, when
suspended in 1 mM NaCl (Figure 5.3, blue diamond’s). In comparison only 55% NP
adsorption occurred when suspended in a solution of 100 mM NaCl at the same
pH (Figure 5.3, green triangles). Similarly the influence pH exerts on NP
adsorption is controlled by ionic strength, resulting in pH dependent adsorption
trends exhibiting a steeper slope at lower ionic strengths (at least between pH 2-
9, Figure 5.3).
Figure 5.3: NP sorption as a function of pH and ionic strength. NP sorption onto 0.25 OD B. subtilis was tested as a function of pH in 1 mM (blue triangles), 10 mM (red squares) and 100 mM (green triangles) NaCl electrolyte concentration. Each data point represents the average of triplicate experiments with associated standard deviation (σ = 1, shown as error bars).
5.4.1.3 Desorption experiments with B.subtilis
Desorption experiments were performed to test the reversibility of NP
adsorption onto the surface of B. subtilis. The bacteria-NaCl (10 mM) suspension
was adjusted to pH 10 before addition of S-pos NPs. At this pH 91% S-Pos NPs
were removed from solution; this is in excellent agreement with the adsorption
experiment whereby 95% NPs were adsorbed from solution (Figure 5.4).
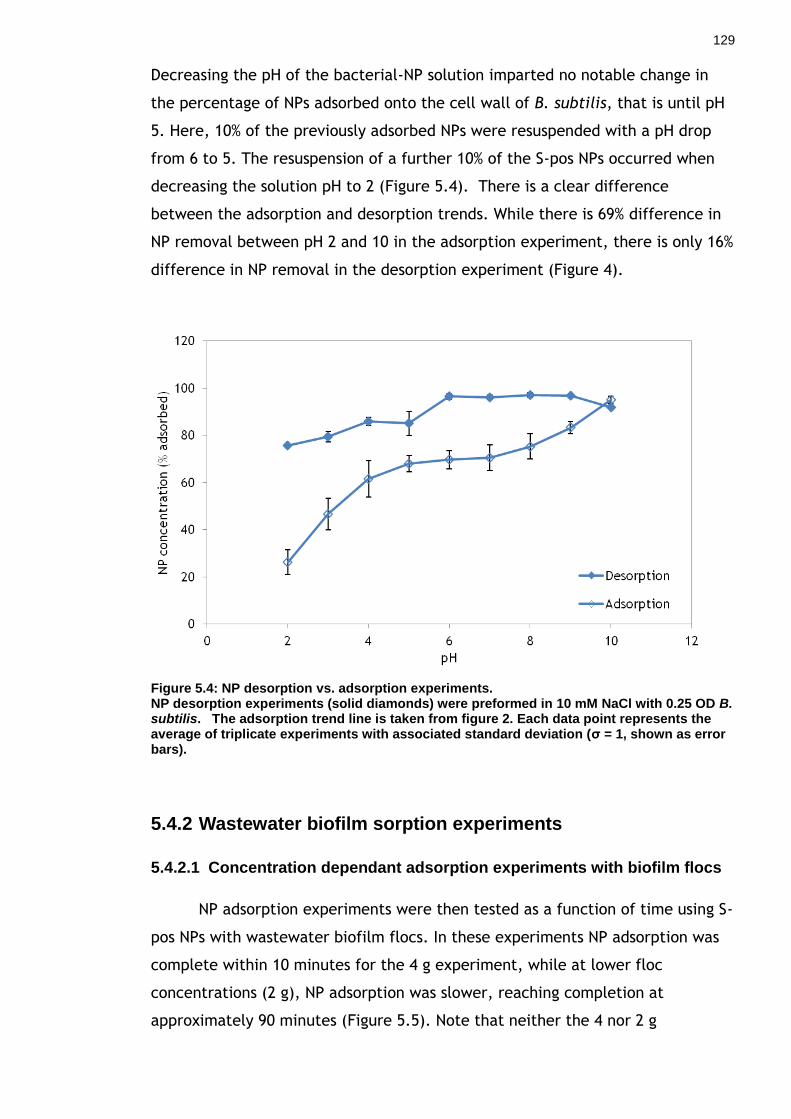
129
Decreasing the pH of the bacterial-NP solution imparted no notable change in
the percentage of NPs adsorbed onto the cell wall of B. subtilis, that is until pH
5. Here, 10% of the previously adsorbed NPs were resuspended with a pH drop
from 6 to 5. The resuspension of a further 10% of the S-pos NPs occurred when
decreasing the solution pH to 2 (Figure 5.4). There is a clear difference
between the adsorption and desorption trends. While there is 69% difference in
NP removal between pH 2 and 10 in the adsorption experiment, there is only 16%
difference in NP removal in the desorption experiment (Figure 4).
Figure 5.4: NP desorption vs. adsorption experiments. NP desorption experiments (solid diamonds) were preformed in 10 mM NaCl with 0.25 OD B. subtilis. The adsorption trend line is taken from figure 2. Each data point represents the average of triplicate experiments with associated standard deviation (σ = 1, shown as error bars).
5.4.2 Wastewater biofilm sorption experiments
5.4.2.1 Concentration dependant adsorption experiments with biofilm flocs
NP adsorption experiments were then tested as a function of time using S-
pos NPs with wastewater biofilm flocs. In these experiments NP adsorption was
complete within 10 minutes for the 4 g experiment, while at lower floc
concentrations (2 g), NP adsorption was slower, reaching completion at
approximately 90 minutes (Figure 5.5). Note that neither the 4 nor 2 g

130
experiment had reached equilibrium at the concentrations texted here.
Increasing the bacterial concentration from 2 g to 4 g did not result in an
increase in the final percentage of NPs adsorbed as total adsorption of NPs
occurred with 98% and 96% adsorbed respectively (Figure 5.5). In contrast little
removal was observed in the blank (containing S-pos NPs only), fluctuating
between 0-10% for the duration of the experiment (Figure 5.5).
Figure 5.5: Percent Fe (NPs) adsorbed by wastewater biofilm as a function of time in 10 mM NaCl. Biofilm concentrations of 2 g (blue diamond’s) and 4 g (red squares) were chosen to determine the impact of biofilm concentration on the sorption of S-pos NP suspended in 10 mM NaCl. A blank experiment (green triangles) containing S-pos NPs without biofilm was also run. Each data point represents the average of triplicate experiments with associated standard deviation (σ = 1, shown as error bars).
5.4.2.2 pH and ionic strength dependant adsorption experiments with biofilm flocs
A biofilm concentration of 2 g was chosen for the pH and ionic strength
dependant experiments. The concentration of NPs adsorbed onto the biofilm
flocs was highly dependent on ionic strength, with greater adsorption occurring
at lower ionic strengths (Figure 5.6). In contrast, pH imparted no significant
effect on the adsorption of NPs in solutions containing 1 mM and 100 mM NaCl
(Figure 5.6). Notably, pH exerted a significant control on the adsorption of NP
onto biofilm flocs when suspended in 10 mM NaCl. Generally as pH increased the
percentage of NPs adsorbed onto the biofilm increased. However, as with the B.
subtilis pH and ionic strength experiments, this was not a linear trend (Figure

131
5.3 and Figure 5.6). Figure 5.6 illustrates the pH dependence of the biofilm flocs
suspended in 10 mM NaCl (red squares). At pH 10 95% NPs are adsorbed.
Decreasing the pH to 8 results in a sharp decrease in the percentage of NPs
adsorbed by 15%. Whilst decreasing the pH further to 5 caused little change,
decreasing NP adsorption by a mere 5%. A final decrease by 10% occurred with a
pH drop to 4, with no change thereafter.
Figure 5.6: NP sorption onto 2 g wastewater biofim as a function of pH in 1 mM (blue triangles), 10 mM (red squares) and 100 mM (green triangles) NaCl electrolyte concentration. Each data point represents the average of triplicate experiments with associated standard deviation (σ = 1, shown as error bars).
5.4.3 Transmission Electron Microscopy (TEM)
TEM of B.subtilis cells reacted with s-posNPs are shown in Figure 5.7.
Samples that are both pre- and post-stained (Figure 5.7a) and samples that are
just post-stained (Figure 5.7b) show similarly good contrast of the cytoplasm and
cell walls. As expected, the cytoplasm and cell wall lacks contrast in the
unstained samples (Figure 5.7c). The cells appear to be surrounded by a layer of
nanoparticles up to 200 nm thick. In samples that were pre- and post-stained
(Figure 5.7a), the nanoparticles do not stand out so clearly as they appear to be
embedded in material that exhibits contrast. However, when either just post-
stained or non-stained the nanopartices stand out more clearly as any material

132
they are embedded in exhibits no contrast (Figure 5.7b,c,d). It is possible the
nanoparticles are embedded in a diffuse extracellular polymeric substance (EPS)
layer that is only picked up by the double staining approach. Alternatively, the
nanoparticles may have aggregated on the surface to form the thick layer of
nanoparticles. However, as these nanoparticles do not aggregate, this seems
unlikely. It is also notable that intracellular NPs were not observed, indicating
the NPs could not be transported across the cell wall.
Figure 5.7: TEM micrographs of B.subtilis cells reacted with s-posNPs. (a) pre- and post-stained sample, (b) post staned sample, (c) and (d) unstained sample. NPs = nanoparticles, CP = cytoplasm, CW = cell wall.
TEM of biofilm reacted with s-posNPs is shown in Figure 5.8. The biofilm is
composed of a dense pack of cells, some intact and likely viable as evidenced by
their intact cytoplasm and cell walls, while others had clearly lysed and only
NPs
CW
CP
a) b) NPs
CW
CP
c)
NPs
CW CP
CP
NPs
d)

133
distorted cell walls remained (Figure 5.8a,b). Pre-and-post and just post-stained
samples exhibited identical levels of contrast. They also exhibited possible
nanoparticles attached to EPS (Figure 5.8, c,d), however, as these could not be
found in non-stained samples it is not possible to confirm if these were
nanoparticles. Problematically, the condition of the TEM filament at the time of
analysis was not sufficient for chemical analysis by EELS, and thus further
examination of these potential NPs was not possible. The difficulty in finding
nanoparticles in the biofilm compared to the B.subtilis cells is likely due to two
reasons. Either areas of the biofilm imaged did not come into contact with the
NPs (possibly because the NPs could not diffuse to that region, e.g. NPs were
bound to the biofilm surface and these images are not of the surface), or
because the NPs were highly dispersed to a low density among the voluminous
biofilm such that they were hard to find.
Figure 5.8: TEM images of biofilm reacted with s-posNPs. All images are post-stained. Arrows indicate possible NPs.
a) b)
c) d)
134
5.4.4 Discussion
In this study both the single celled bacteria B. subtilis and multi-
community wastewater biofilm flocs showed significant adsorption of the s-pos
NPs under most conditions. In contrast no adsorption of s-neg NPs occurred.
However the degree to which pH and ionic strength affects the biosorbant
properties of each agent varied. Here, the B. subtilis system was found to be
highly dependent on pH, with greater pH sensitivity at lower ionic strengths. In
contrast the biofilm flocs were found to be highly ionic strength dependant with
any change in pH having less influence on the adsorption properties of the
biofilm.
In the case of the B. subtilis system the bacterial cell wall is the first
component that comes into contact with NPs. The cell wall of B. subtilis and
other gram positive bacteria are primarily composed of a thick peptidoglycan
layer (Doyle et al., 1980, Vijayaraghavan and Yun, 2008). Several functional
groups which exist on the outer surface of the bacterial cell wall have long been
known to control metal cation adsorption by a variety of microorganisms (Fein et
al., 1997, Doyle et al., 1980, Beveridge, 1989, Ngwenya et al., 2003). These
include carboxyl, phosphoryl, amine and hydroxyl groups. It is the ionisation
(deprotonation) of these functional groups which imparts a negative charge
surrounding the cell. The reaction for the deprotonation of carboxyl, phosphoryl
and hydroxyl groups are as follows:
(1)
(2)
(3)
(4)
where R represents the bacterial membrane to which (from top to bottom) the
carboxyl, phosphoryl, hydroxyl and amine functional groups are attached (after
Fein et al. (1997).
This process induces an electrostatic attraction between the positively
charged NPs and the negatively charged bacterial cell, resulting in the

135
adsorption of up to 100% of the positively charged NPs, depending on pH, ionic
strength and bacterial density. In the case of the s-neg NPs an electrostatic
barrier between the bacterium and the NP exists due to electrostatic repulsion,
preventing adsorption of the negatively charged NPs. TEM analysis of B. subtilis
cells reacted with s-posNPs suggested the NPs may be embedded within a thin
(up to 200 nm) layer of EPS surrounding the cell wall. Similar to the cell wall,
this EPS layer could also exhibit functional groups imparting it with a negative
charge.
The adsorption of positively charged NPs onto the surface of B. subtilis
was found to be highly pH and ionic strength dependant. Generally, NP
adsorption increases with increasing pH, and decreases with increasing
electrolyte concentration. The deprotonation of surface functional groups with
increasing pH results in an increasingly negative cell surface charge at higher
pH’s, increasing attractive electrostatic interactions between the NP and
bacterial cell. Notably this is not a linear trend. For intermediate and low
electrolyte concentration (1 and 10 mM NaCl) a steepening of the adsorption
profile can be seen between pH 2 to 4 (Figure 5.3). The ionisation of carboxyl
functional groups are likely responsible for NP adsorption within the lower pH
range of 2 to 4. Carboxylic functional groups have been shown to become active
over a pH range of 2 to 6, with a mean pKa of 4.5 (Cox et al., 1999). Within this
range the carboxylic functional groups deprotonate, increasing the negative
charge surrounding them. This would appear to result in an increased affinity for
the positively charged NPs, as demonstrated by a steep increase in NP adsorption
from 25% at pH 2 to 60% at pH 4 for intermediate and low electrolyte
concentration (Figure 5.3). A similar trend is visible in the 100 mM NaCl
experiment however here NP adsorption increased by only 10% when solution pH
increased from pH 2 to 4 (Figure 5.3). The deprotonation of the carboxylic
functional groups had less of an electrostatic effect here as the increased
electrolyte concentration resulted in a dulling of the negative charge on the
bacteria, hence weakening the electrostatic attraction between the NP and
bacterial surface. Increasing solution pH from 4 to 8 caused a smaller rate of
change in NP adsorption. Within this range phosphoryl sites become active.
Again higher ionic strengths caused the rate of change in NP adsorption to be
reduced compared to at lower ionic strengths. It is important to note that the
NPs are surrounded by amine functional groups, imparting a positive charge
136
around the particle. Since amine functional groups begin to deprotonate at pH 9
(Cox et al., 1999), the positive charge surrounding the NP will decrease from
around pH 9 upwards. However, there is no clear evidence from the adsorption
profiles that this has any impact on NP adsorption (for example, while a
decrease in NP adsorption is seen between pH 8-10 at 1 mM NaCl, an increase is
seen at 10mM NaCl)
Increasing solution ionic strength had a marked impact on the adsorption
of NPs onto the cell surface of B. subtilis. Overall increasing electrolyte
concentration resulted in a decrease in NP adsorption. Here, increasing solution
electrolyte concentration masks the negative charge of the bacterium and the
positive charge on the NP, resulting in a dulled electrostatic attraction between
the NP and the bacterial cell wall. Figure 5.3 demonstrates that 95% NP
adsorption occurred at pH 10 when suspended in 10 mM NaCl, however when the
electrolyte concentration increased to 100 mM NaCl, NP adsorption onto the cell
decreased to 53% due to the masking effect of the Na+ and Cl- ions acting on the
NP and bacterial surface.
It is important to note the ‘meeting’ point of the curves in Figure 5.3.
Here all three curves cross at pH 3, this is close to the isoelectric point for B.
subtilis bacterial cells which occurs at approximately pH 2.4 (Yee et al., 2004).
This is consistent with work carried out by Yee at al. (2004) where metal
biosorption experiments were performed using B. subtilis. Here, Ca2+ Sr2+ and
Ba2+ ions suspended in three different electrolyte concentrations all converge at
pH 3.
However, unlike in most cation adsorption experiments, NP adsorption
here was largely irreversible. Figure 5.4 displays the desorption of only 15% NPs
when solution was dropped from pH 10 to 2. These findings are notably
different from desorption experiments using B.subtilis and metal cations. When
metal cations are bound to bacterial cell wall, desorption curves follow very
similar profiles to the adsorption curves (i.e. almost no hysteresis) (Fowle and
Fein, 2000). It is clear then that while metal cation adsorption is fully reversible
(Fowle and Fein, 2000), NP adsorption displays relatively little reversibility.
Permanent attachment of NPs confirms that electrostatic interactions are not
the only force controlling NP adsorption onto the bacterial surfaces. Another
force must be responsible for the permanent attachment of NPs as if

137
electrostatic interactions were the sole force acting on the NP and bacterium
then NP binding would be expected to be fully reversible. NP uptake by B.
subtilis is suggested to occur as a two step process. The first step involves
electrostatic forces attracting the NP to the cell surface to allow for initial
electrostatic attachment to take place. The second step results in the largely
irreversible attachment of NPs onto the cell surface. A combination of electrical
and non-electrical interactions occurring between the outer cell surface and the
outer surface of the NP may be responsible for such attachment. These
electrosteric interactions may be repulsive or attractive (Rijnaarts et al., 1999).
Repulsive forces dominate if the cell surface is hydrophilic and has no affinity
for the substratum whilst irreversible bridging may occur if attractive forces
exist, this is likely to result if both particles are hydrophobic and some attractive
force exist (Rijnaarts et al., 1999). The hydrophobic properties of microbial cells
have been well reported. It is widely agreed that microbial cell surface
hydrophobicity is the dominant control of microbial adhesion to surfaces,
educing biofilm formation (Ahimou et al., 2000). Microbial adhesion has been
found to be ionic strength dependant, with steric interactions becoming stronger
as ionic strength increases, enhancing bacterial attachment to surfaces
(Rijnaarts et al., 1999). Hydrophobic interactions may therefore account for NP
adsorption under high ionic strength conditions (Figure 5.3Figure 5.6). In
addition , Ahimou et al (2000) determined that the production of lipopeptide by
B. subtilis increases the hydrophobicity of the cell, increasing the attractive van
der Waals interaction (van Loosdrecht et al., 1990). It is important to note that
the NPs are also surrounded by hydrophobic amine terminations
(cyclohexylamine), these may form bridges with the hydrophobic bacterial
surface polymers, permanently attaching NPs to the cell surface of the bacteria.
Indeed, based on TEM, this may not just occur upon the cell surface but possibly
within a matrix of EPS which surrounds the cell. Despite this some desorption
did occur. Figure 5.4 highlights the resuspension of only 15% of previously
adsorbed NPs due to decreasing solution pH from 10 to 2, indicating that not all
NPs are permanently attached to the bacterial surface. Clearly some NPs are not
influenced by the irreversible electrosteric interactions; instead they are
electrostatically controlled, allowing for reversible adsorption onto the bacterial
cell.

138
Wastewater biofiom flocs were shown to be highly successful bisorbents,
showing 100 % NP adsorption for the 2 and 4 g/10 ml adsorption experiments
(Figure 5.5). As with the B. subtilis system NP adsorption first occurs through
electrostatic attraction. Then, based on the B.subtilis experiments, permanent
attachment occurs on the cell wall of individual bacterium and EPS in the
biofilm. In the case of the wastewater biofilm NP binding will occur on the
bacteria on the outer perimeter of the floc. In addition to this diffusion and
advection of NPs into the bacterial pellet may also occur, embedding NPs within
the bacterial floc. Evidence for diffusion of NPs into the flocs was revealed by
determining the total quantity NPs immobilized per unit of biomass. Results
show that typically 0.057 mg NPs/mg dry mass of biofilm were adsorbed, while
0.079 mg NPs/mg dry mass B. subtilis were adsorped. If only the surface of the
flocs was available for NP binding, one would expect orders of magnitude less NP
adsorption compared to B. subtilis, as the flocs are orders of magnitude larger
than B. subtilis and therefore will have orders of magnitude less surface area.
However, the fact that total NP immobilization is broadly similar in both B.
subtilis and floc experiments, suggests NPs are diffusing into the flocs to access
other surfaces (i.e. cells and EPS inside the biofilm). Diffusion is the dominant
process for solute transport within biofilm flocs (Stewart, 2003, Stoodley and
Lewandowski, 1994, de Beer et al., 1997). The production of EPS has been shown
to be an important factor in the retention of colloids (Leon Morales et al., 2007).
Leon Morales et al. (2007) determined that the production of extracellular
proteins resulted in the increased retention of colloids through sand columns
inoculated with Pseudomonas aeruginosa. The porosity and diffusive properties
exhibited by biofilm flocs are predominantly controlled by the production of EPS
in a biofilm (Golmohamadi et al., 2013). NP transport studies determined that
NP size is the dominant control for NP uptake by biofilms via diffusion
(Golmohamadi et al., 2013, Peulen and Wilkinson, 2011). Peulen et al. (2011)
found that NPs smaller than 50 nm were readily adsorbed by biofilm coated sand
grains via diffusion, however those larger than 50 nm were poorly incorporated.
This finding is in agreement with Golmohamadi et al. (2013) whereby 66 nm
titanium dioxide NPs did not penetrate biofilms produced from a strain of
Pseudomonas fluorescens, i.e. NPs were larger than the pore size exhibited by
EPS, thus completely excluding the NPs from the biofilm. The porous structure of
the biofilm flocs may be responsible for slow uptake of NPs by the 2g/10 ml

139
biomass system as the NPs used here fall within this size range (<66 nm, Figure
5.6) i.e., they are small enough to diffuse into the biofilm but their transport is
slow. Slow uptake kinetics are not observed in the 4g system as there is more
biomass and therefore NP immobilization is faster. In addition, cellular uptake
of NPs by the biofilm is possible via facilitated transport. This process occurs as
channel like transmembrane proteins transport NPs across the membrane (Kiser
et al., 2010). Crucially, the largest transmembrane porins exhibit an opening
diameter of 6 nm (Kiser et al., 2010) and so the NPs used here are unlikely to
exhibit cellular uptake by the biofilm. However, NPs <10 nm have been reported
to penetrate bacterial cells (Choi and Hu, 2008). In contrast, NP adsorption
exhibited here likely occurs via a process of self-diffusion where by the NPs are
influenced by Brownian motion within the biofilm matrix, rather than the
cellular uptake of NPs. Hence, diffusion aided by electrostatic attraction is
thought to be the dominant transport mechanism for NP immobilisation by
wastewater biofilms.
The adsorption of NPs onto the biofilm was found to be pH and ionic
strength dependant for intermediate electrolyte concentration; however pH did
not significantly influence NP adsorption for the low and high electrolyte
concentration experiments (Figure 5.6). As with the single celled B. subtilis
adsorption experiments NP adsorption increased with increasing pH (for
intermediate electrolyte concentration) and decreased with increased ionic
strength. The pH effect can be clearly seen in the intermediate electrolyte
experiment (10 mM NaCl, Figure 5.6,). Here as pH increased NP adsorption
increased due to the deprotonation of functional groups on the cell wall of the
bacterium and EPS, resulting in an increase from 55% at pH 2 to 95% NP
adsorption at pH 10. However any change in pH has little effect on the low and
high ionic strength adsorption experiments. This may be expected in the high
ionic strength experiments as the increased electrolyte concentrations masks the
surface charge upon the NPs and biofilm flocs. However for NPs and biofilm
suspended in 1 mM NaCl any change in pH should be clearly observed, however
this was not the case with all sample points falling within error of each other
(Figure 5.6, blue triangles). This may be explained by the fact that the 1mM
system exhibited close to100% adsorption at pH 2, and therefore there was
insufficient ‘head-room’ in the system to demonstrate greater adsorption at
higher pH’s.

140
5.4.5 Conclusion
In this study the removal of NPs by B. subtilis and wastewater biofilm
flocs was examined. Both biosorbent agents were highly efficient at removing
positively charged NPs, whilst negatively charged NPs were poorly adsorbed by
B. subtilis, being electrostatically repelled from the bacterial surface. For both
biosorbent materials the removal of positively charged NPs is facilitated by the
electrostatic attraction of positively charged NPs to the negative bacterial
cell/floc. In the case of single celled bacteria permanent attachment occurred
due to attractive van der Waals interactions, combined with the strong bridging
between the NP’s hydrophobic amine terminations (cyclohexylamine) and
hydrophobic bacterial surface polymers. A key difference in the adsorption
mechanism of NPs by B. subtilis and wastewater biofilm flocs is diffusion into
the porous structure of the biofilm occurs. The results indicate that NP
biosorption via B. subtilis was highly pH and ionic strength dependant. Whilst
wastewater biofilm flocs were ionic strength dependant, whilst varying solution
pH offered little change in the sorption properties of the flocs in 1 and 100 mM
NaCl. The results presented here indicate that both single celled B. subtilis and
wastewater biofilm flocs are successful biosorbents for positively charged NPs
whilst negatively charged NPs are repelled from the cell of B. subtilis and would
require alternative methods of immobilisation. Overall, these findings highlight
that planktonic bacteria and biofilms are highly efficient biosorbants for NP’s,
this holds implications for NP transport in environmental systems and through
wastewater treatment plants.
141
6 Conclusion
6.1 Summary
The aim of this PhD was to develop mechanisms to reduce and ultimately
immobilise nanoparticles within water and waste water in order to prevent the
transport of nanoparticles to sites where they have the potential to cause harm.
Over recent years intense research has focused on the toxicity of manufactured
nanoparticles and their effects on human health and the natural environment. A
growing body of evidence indicates that nanoparticles have the potential to
exhibit toxicity to aquatic organisms and have the potential for bioaccumulation
in the food chain (Lasagna-Reeves et al., 2010, Zhu et al., 2010, Lee et al.,
2008). As the nanotechnology industry continues to expand NPs will inevitably be
release into the natural environment. Hence, developing methods to deal with
nano-pollution is essential to prevent future environmental pollution incidents
and to ensure the safe development of the nanotechnology industry. This was
achieved by inducing mineral precipitation in the presence of NPs. The
electrostatic interactions occurring between the NP and the mineral surface
determined whether the NP became occluded within the mineral precipitate or
whether they remained in solution. In addition to mineral precipitating systems,
NP immobilisation by bacteria (B. subtilis and wastewater treatment biofilm)
was also investigated.
This chapter presents a summary of the main finding from each research
chapter, highlighting potential future work in this area of research.
6.2 Immobilisation of nanoparticles by mineral precipitating systems
An array of techniques exists for the remediation of numerous groundwater
contaminants yet none have been specifically designed to deal with NPs. Here
we address this fundamental technology gap by developing mechanisms to
immobilise and remove NPs from solution. Microbially mediated calcite
precipitation was first tested as this process has been extensively studied over
recent years due to its potential in a diverse array of applications. These range

142
from soil stabilisation (Whiffin et al., 2007) to the solid phase capture of heavy
metals and radionuclides (Warren et al., 2001).
This method showed great success in removing negatively charged
nanoparticles in batch experiments whilst positively charged nanoparticles
remained in solution. Electrostatic interactions greatly controlled the degree of
nanoparticle capture. It was hypothesised that negatively charged nanoparticles
act as nucleation sights for the precipitating calcite. However the kinetic
analysis of calcite precipitation rates determined that the nanoparticle type
(surface charge) had no impact on nucleation. Instead nanoparticles attach to
growing calcite surfaces in solution, eventually becoming overtaken by the
growing solidification front and thus occluded. Negatively charged nanoparticles
exert a strong electrostatic attraction to the positively charged calcite surface,
facilitating particle entrapment. Whilst in the case of positively charged
nanoparticles an electrostatic repulsion exists. DLVO modelling confirms these
observations, with attractive energy well acting between the calcite and
negative nanoparticles, whilst a repulsive energy barrier exists between the
calcite and the positive nanoparticles.
As electrostatic interactions acting between the mineral and nanoparticle
determine whether or not the nanoparticle becomes occluded within the
mineral, the mineral precipitating system could therefore be specifically
tailored to suit the nanoparticle surface character. Thus, in order to capture
positively charged nanoparticles, a mineral possessing a negative surface charge
would be required. Struvite was chosen not only because it exhibits a negative
surface charge but it also requires ammonia to form as it is a magnesium
ammonium phosphate mineral. Hence the precipitation of struvite has the
potential to remove the undesirable concentrations of ammonia produced as a
by-product of ureolysis, whist also removing positively charged nanoparticles
from solution.
Struvite precipitation was first tested in the absence of nanoparticles in
order to determine the optimal condition for struvite precipitation. Struvite
precipitation was initially tested during ureolysis. That is magnesium and
phosphorus are added at the beginning of the experiment so that when
ammonium is produced by ureolysis struvite would immediately form. However
this was not the case, instead some form of magnesium phosphate mineral was
143
precipitated despite the production of ammonium. Following this, struvite
precipitation was tested again with total urea hydrolysis complete before the
addition of magnesium and phosphorus sources in four stages of 25 mM each.
This method showed great success, removing 100% of the ammonium produced
by ureolysis. This approach was therefore used for the nanoparticle
immobilisation experiments. As the mineral precipitates nanoparticles were
concurrently removed from solution, up until a point. Nanoparticle removal was
found to be highly pH and ionic strength dependant. As the solution pH
decreased and ionic strength increased nanoparticle concentration increased.
These findings suggest that nanoparticles are electrostatically attached to the
mineral surface as opposed to occlusion within the growing mineral (as reported
in the calcite precipitating system). Hence, any change in solution pH and ionic
strength will greatly affect the surface charge of the nanoparticle and mineral
surface. This has the potential to weaken the electrostatic attraction between
the nanoparticle and mineral surface, allowing for the resuspension of previously
immobilised nanoparticles from solution. The findings here suggest that struvite
precipitation removes 100% of the ammonia produced by ureolysis. In addition
struvite precipitation successfully removed positively charged nanoparticles from
solution. Here the nanoparticles are reversibly attached to the mineral surface
and so solution pH and ionic strength must be carefully controlled in order to
ensure the removal of positively charged nanoparticles. The fact that
nanoparticles are electrostatically attached to the mineral surface could be
advantageous. This approach has the potential to be used to recycle
nanoparticles by separating them from solution, altering the solution chemistry
to resuspend the nanoparticles for secondary use.
The results presented here indicate that the mineral precipitation system
may be specifically tailored to treat the NP surface character. Inducing mineral
precipitation has the potential to immobilise nanoparticles from contaminated
groundwater systems, impacting their transport and fate in environmental
systems.
144
6.3 Immobilisation of nanoparticles through porous media by calcium carbonate precipitation
Following the successful immobilisation of negatively charged nanoparticles
by calcium carbonate precipitation in batch experiments this method was tested
again through porous media. This was done to in order to increase the
complexity of the system, replicating a more real life scenario such as a sand
aquifer. Immobilisation was tested as a function of porous media type (glass
beads and sand) and grain size (fine, medium and large).
Negatively charged nanoparticles displayed high mobility through all porous
media types tested when suspended in deionised water. Nanoparticle mobility
was reduced under all experimental conditions tested, however, the lowest
rates of nanoparticle mobility were consistently found in columns where calcium
carbonate precipitation was promoted. As ureolysis commenced, calcium
carbonate precipitation occurred around the nanoparticles, on grain boundaries
and within the pore spaces. As in chapter 3, nanoparticles become occluded
within the mineral precipitate. In addition, gravitational settling of the nano-
calcite composite allows nanoparticles to become cemented to the grain
boundaries within the column. The findings from this chapter suggest that
microbially mediated calcite precipitation may be used as a tool to significantly
reduce nanoparticle mobility in environmental systems.
6.4 Bacterial biosorption of nanoparticles
Bacteria and biofilms are commonly used to adsorb and degrade an array of
pollutants, being commonly used as a treatment step in wastewater treatment
plants. Here, we tested the ability of B subtilis, a common groundwater
bacterium, and wastewater biofilm to remove nanoparticles from solution.
The experiments presented here suggest that B. subtilis and wastewater
biofilm are highly effective at removing positively charged nanoparticles whilst
negatively charged nanoparticles remained in solution. The positively charged
nanoparticles are electrostatically attracted to the negative charge of the
bacterial cell/floc. A key difference in the adsorption mechanism of
nanoparticles by B. subtilis and wastewater bioflm flocs is that nanoparticles
have the ability to diffuse into the porous structure of the biofilm. Both
145
biosorbent materials were found to be ionic strength dependant, with fewer
nanoparticles being removed at higher ionic strength. B. subtilis was found to be
highly pH dependant, with greater sorption at higher pH, due to the ionisation of
surface functional groups increasing the negative charge on the bacterial
surface. In contrast any change in pH offered little difference in the sorption
properties of the wastewater granules in solutions of 1 and 100mM NaCl.
The results presented here highlight that planktonic bacteria and
wastewater treatment biofilm are highly effective sorbents of positively charged
nanoparticles. These findings suggest that current municipal wastewater
treatment works have the potential to remove positively charged nanoparticles
during the biological treatment stage of the process. Wastewater treatment
biofilm and activated sludge are removed from the treatment process as
settlement sludge. Currently settlement sludge is processed and in some cases is
sold as fertiliser to farmers. In such instances it is crucial to monitor this sludge
for toxic elements before handing it over to a third party. In the case of
negatively charged nanoparticles alternative methods would be required. The
removal of negatively charge nanoparticles may be facilitated by the
precipitation of calcium carbonate where by the calcite-nano composites are
settle and removed. They may then be treated separately or disposed of
responsibly.
6.5 Future work
The research presented here demonstrates that nanoparticle
immobilisation mechanisms may be specifically tailored to suit the nanoparticle
surface properties. In addition current wastewater treatment technologies may
be successful sorbents of positively charged nanoparticles whilst negatively
charged nanoparticles have the potential to discharge from wastewater
treatment works into environmental systems. To ensure the safe development of
the nanotechnology industry the immobilisation methods developed throughout
this thesis must be explored further. Future work must therefore focus on 1)
establishing the current and predicted future environmental concentrations of
NPs in the UK and globally; 2) the mineral precipitating systems discussed in this
thesis must be scaled up to field scale application; 3) the mineral precipitating
systems must be tested with a variety of NP types and concentrations.
146
Current NP concentrations may be investigated through 24 hour sampling at
significant wastewater treatment works to determine the current NP
concentration in waste streams. A major flaw of many NP toxicity and transport
studies is that researchers do not perform their experiments with
environmentally relevant concentrations NPs. This is due to a lack of information
regarding the environmental concentration of NPs. However, some estimates of
future NP concentrations have been published. These are based on models which
look at information such as production volume of NPs, particle release from
products and environmental conditions (Mueller and Nowack, 2008). Such studies
have rarely been conducted due to the complexity nature of the nanotechnology
industry. More needs to be done in this field for researchers and regulatory
bodies to fully understand the risk associated with the expansion of the
nanotechnology industry.
The bench scale experiments presented here showed great success.
However these need to be scaled up in order to increase the complexity of the
systems, with the intention of deploying field scale tests. In the case of
microbially mediated calcium carbonate precipitation it would be of interest to
design a larger scale experiment which exhibits mixing of the reacting fluids,
instead of simply bottom to top flow which occurred in the column experiments.
A sand box for example could be used. Through this the optimum injection
strategy of the reaction fluids could also be tested to ensure the maximum
removal of negatively charged nanoparticles. Once an optimum strategy is
developed field scale trials may be employed. Such trials may be performed in
areas which already have bore holes emplaced such as a disused quarry.
Performing field trials in locations such as this would reduce operational costs
and to limit environmental damages.
In order to develop the immobilisation of positively charged nanoparticles
by struvite precipitation, column experiments must be performed. Here a porous
media exhibiting a positive surface charge (such as calcite or dolomite) would be
required to ensure that the positively charged nanoparticles are sufficiently
mobile. If the column experiments prove to be successful a similar escalation
procedure could be followed for the struvite as precipitation experiments as was
done for the calcite experiments.
147
The nanoparticle concentration remained constant at 10 mg/l for all
experiments preformed in this thesis. It would be of interest to determine
whether varying the nanoparticle concentration would impact the removal
efficiency of nanoparticles for the methods tested. It would also be of
importance to test the technologies presented here with a variety of
nanoparticle types, shapes and sizes. For example does nanoparticle shape
influence nanoparticle immobilisation by microbially mediated calcium
carbonate precipitation? The incorporation of carbon nanotubes for example
could be compared to the results presented in chapter 2. In addition silver
nanoparticles are specifically tailored for their antimicrobial properties (Rai et
al., 2009). Thus it would be of interest to determine if their presence would
exhibit toxicity to the bacterial strains utilised in this thesis.

148
Appendix A
Table A 1: Saturation indices for minerals which could potentially be formed from 10 mM NH4, MgCl2 and K2HPO4 at pH 8 as exhibited in the S1 experiment. (Visual MINTEQ, version 3.0).
Mineral Saturation Index
Struvite 1.587
Mg3(PO4)2 1.569
MgHPO4:4H2O 0.606
Brucite -3.672
KCl -4.484
Mg2+(OH)2 -5.366
Mg2(OH)3Cl:4H2O -8.935
Periclase -8.157

149
Appendix B
The Hamaker constant for 2 phases interacting across a medium (3) was
calculated according to the equation by Overney (2009):
where is the dielectric constant, n the refractive indices and Ve the
absorption frequency.
2
3
2
2
2
3
2
1
2
3
2
2
2
3
2
1
2
3
2
2
2
3
2
1
32
32
31
31
28
3
4
3
nnnnnnnn
nnnnhkTA e
150
List of references
AHIMOU, F., JACQUES, P. & DELEU, M. 2000. Surfactin and iturin A effects on Bacillus subtilis surface hydrophobicity. Enzyme and Microbial Technology, 27, 749-754.
ALI, M. I. 2007. Struvite Crystallization in Fed-Batch Pilot Scale and Description of Solution Chemistry of Struvite. Chemical Engineering Research and Design, 85, 344-356.
ALLOTROPES, C. 2013. SINGLE-WALL CARBON NANOTUBES [Online]. Available: http://www.carbonallotropes.com/carbon-nanotubes/39-single-wall-carbon-nanotubes.html [Accessed 07/09/14].
ASTHANA, R. & TEWARI, S. N. 1993. The Engulfment Of Foreign Particles By a Freezing Interface. Journal of Materials Science, 28, 5414-5425.
BAKER, B. J. & BANFIELD, J. F. 2003. Microbial communities in acid mine drainage. FEMS Microbiology Ecology, 44, 139-152.
BALL, J. & NORDSTROM, D. 1992. Geochemical model to calculate speciation of major, trace and redox elements in natural waters. US Geological Survey, International Groundwater Modeling Centre.
BANFIELD, J. F. & NEALSON, K. H. 1997. Geomicrobiology: Interactions between microbes and minerals, Mineralogical Society of Amer.
BAR‐ILAN, O., ALBRECHT, R. M., FAKO, V. E. & FURGESON, D. Y. 2009. Toxicity assessments of multisized gold and silver nanoparticles in zebrafish embryos. Small, 5, 1897-1910.
BAZYLINSKI, D. A. & FRANKEL, R. B. 2003. Biologically controlled mineralization in prokaryotes. Reviews in Mineralogy and Geochemistry, 54, 217-247.
BEHRENS, S. H. & GRIER, D. G. 2001. The charge of glass and silica surfaces. The Journal of Chemical Physics, 115, 6716-6721.
BEN-MOSHE, T., DROR, I. & BERKOWITZ, B. 2010. Transport of metal oxide nanoparticles in saturated porous media. Chemosphere, 81, 387-393.
BEVERIDGE, T. J. 1989. Role of cellular design in bacterial metal accumulation and mineralization. Annual Reviews in Microbiology, 43, 147-171.
BOARD, T. S. 2009. Nanoscale Technologies Strategy 2009-12. In: BOARD, T. S. (ed.). Innovate UK.
BOUROPOULOS, N. C. & KOUTSOUKOS, P. G. 2000. Spontaneous precipitation of struvite from aqueous solutions. Journal of Crystal Growth, 213, 381-388.
BRADFORD, S. A. & TORKZABAN, S. 2008. Colloid Transport and Retention in Unsaturated Porous Media: A Review of Interface-, Collector-, and Pore-Scale Processes and Models All rights reserved. No part of this periodical may be reproduced or transmitted in any form or by any means, electronic or mechanical, including photocopying, recording, or any information storage and retrieval system, without permission in writing from the publisher. Vadose Zone J., 7, 667-681.
BRADFORD, S. A., YATES, S. R., BETTAHAR, M. & SIMUNEK, J. 2002. Physical factors affecting the transport and fate of colloids in saturated porous media. Water Resources Research, 38, 1327.
BRAR, S. K., VERMA, M., TYAGI, R. D. & SURAMPALLI, R. Y. 2010. Engineered nanoparticles in wastewater and wastewater sludge – Evidence and impacts. Waste Management, 30, 504-520.
BRITANNICA, E. 2014. Bacteria. BYSTRZEJEWSKA-PIOTROWSKA, G., GOLIMOWSKI, J. & URBAN, P. L. 2009.
Nanoparticles: Their potential toxicity, waste and environmental management. Waste Management, 29, 2587-2595.

151
CARRE, A. & LACARRIERE, V. 2006. Study of surface charge properties of minerals and surface-modified substrates by wettability measurements. Contact Angle, Wettability and Adhesion, 4, 1.
CHATTERJEE, R. 2008. The Challenge of Regulating Nanomaterials. Environmental Science & Technology, 42, 339-343.
CHEN, H., ROCO, M. C., SON, J., JIANG, S., LARSON, C. A. & GAO, Q. 2013. Global nanotechnology development from 1991 to 2012: patents, scientific publications, and effect of NSF funding. Journal of Nanoparticle Research, 15, 1-21.
CHOI, O. & HU, Z. 2008. Size dependent and reactive oxygen species related nanosilver toxicity to nitrifying bacteria. Environmental Science & Technology, 42, 4583-4588.
CLAPHAM, L., MCLEAN, R., NICKEL, J., DOWNEY, J. & COSTERTON, J. 1990. The influence of bacteria on struvite crystal habit and its importance in urinary stone formation. Journal of Crystal Growth, 104, 475-484.
COLMAN, B. P., ARNAOUT, C. L., ANCIAUX, S., GUNSCH, C. K., HOCHELLA JR, M. F., KIM, B., LOWRY, G. V., MCGILL, B. M., REINSCH, B. C. & RICHARDSON, C. J. 2013. Low concentrations of silver nanoparticles in biosolids cause adverse ecosystem responses under realistic field scenario. PloS one, 8, e57189.
COX, J. S., SMITH, D. S., WARREN, L. A. & FERRIS, F. G. 1999. Characterizing Heterogeneous Bacterial Surface Functional Groups Using Discrete Affinity Spectra for Proton Binding. Environmental Science & Technology, 33, 4514-4521.
COYLE, S., WU, Y., LAU, K.-T., DE ROSSI, D., WALLACE, G. & DIAMOND, D. 2007. Smart nanotextiles: a review of materials and applications. MRS bulletin, 32, 434-442.
CUTHBERT, M. O., RILEY, M. S., HANDLEY-SIDHU, S., RENSHAW, J. C., TOBLER, D. J., PHOENIX, V. R. & MACKAY, R. 2012. Controls on the rate of ureolysis and the morphology of carbonate precipitated by S. Pasteurii biofilms and limits due to bacterial encapsulation. Ecological Engineering, 41, 32-40.
DE BEER, D., STOODLEY, P. & LEWANDOWSKI, Z. 1997. Measurement of local diffusion coefficients in biofilms by microinjection and confocal microscopy. Biotechnology and bioengineering, 53, 151-158.
DE MUYNCK, W., DE BELIE, N. & VERSTRAETE, W. 2010. Microbial carbonate precipitation in construction materials: A review. Ecological Engineering, 36, 118-136.
DEFRA 2011. Characterising the Potential Risks posed by Engineered Nanoparticles. In: ENVIRONMENT, F. A. R. A. (ed.) A Second UK Government Research Report ed.
DELLA PINA, C., FALLETTA, E., PRATI, L. & ROSSI, M. 2008. Selective oxidation using gold. Chemical Society reviews, 37, 2077-2095.
DESMIDT, E., GHYSELBRECHT, K., MONBALLIU, A., RABAEY, K., VERSTRAETE, W. & MEESSCHAERT, B. D. 2013. Factors influencing urease driven struvite precipitation. Separation and Purification Technology, 110, 150-157.
DEVOUARD, B., POSFAI, M., HUA, X., BAZYLINSKI, D. A., FRANKEL, R. B. & BUSECK, P. R. 1998. Magnetite from magnetotactic bacteria: Size distributions and twinning. American Mineralogist, 83, 1387-1398.
DHAWAN, A. & SHARMA, V. 2010. Toxicity assessment of nanomaterials: methods and challenges. Analytical and Bioanalytical Chemistry, 398, 589-605.
DONLAN, R. M. 2002. Biofilms: microbial life on surfaces. Emerging infectious diseases, 8, 881-90.

152
DOYLE, J., OLDRING, K., CHURCHLEY, J., PRICE, C. & PARSONS, S. 2003. Chemical Control of Struvite Precipitation. Journal of Environmental Engineering, 129, 419-426.
DOYLE, J. D. & PARSONS, S. A. 2002. Struvite formation, control and recovery. Water Research, 36, 3925-3940.
DOYLE, R. J., MATTHEWS, T. H. & STREIPS, U. N. 1980. Chemical basis for selectivity of metal ions by the Bacillus subtilis cell wall. Journal of bacteriology, 143, 471-480.
DUNPHY GUZMAN, K. A., FINNEGAN, M. P. & BANFIELD, J. F. 2006. Influence of Surface Potential on Aggregation and Transport of Titania Nanoparticles. Environmental Science & Technology, 40, 7688-7693.
DUPRAZ, S., PARMENTIER, M., MÉNEZ, B. & GUYOT, F. 2009. Experimental and numerical modeling of bacterially induced pH increase and calcite precipitation in saline aquifers. Chemical Geology, 265, 44-53.
EBY, D. M., LUCKARIFT, H. R. & JOHNSON, G. R. 2009. Hybrid antimicrobial enzyme and silver nanoparticle coatings for medical instruments. ACS applied materials & interfaces, 1, 1553-1560.
EEA 2002. Late lessons from early warnings: the precautionary principle 1896-2000. . In: AGENCY, E. E. (ed.).
EL-DEAB, M. S. & OHSAKA, T. 2003. Electrocatalysis by nanoparticles: oxygen reduction on gold nanoparticles-electrodeposited platinum electrodes. Journal of Electroanalytical Chemistry, 553, 107-115.
EL BADAWY, A. M., ALY HASSAN, A., SCHECKEL, K. G., SUIDAN, M. T. & TOLAYMAT, T. M. 2013. Key Factors Controlling the Transport of Silver Nanoparticles in Porous Media. Environmental Science & Technology, 47, 4039-4045.
ENGINEERING, R. S. A. R. A. O. 2004. Nanoscience and nanotechnologies:opportunities and uncertainties [Online]. London. Available: http://www.nanotec.org.uk/report/chapter5.pdf [Accessed 09.08.2011 2011].
ENGINEERING., R. S. A. R. A. O. 2004. Nanoscience and nanotechnologies:opportunities and uncertainties [Online]. London. Available: http://www.nanotec.org.uk/report/chapter5.pdf [Accessed 09.08.2011 2011].
ERIKSSON, R., MERTA, J. & ROSENHOLM, J. B. 2007. The calcite/water interface: I. Surface charge in indifferent electrolyte media and the influence of low-molecular-weight polyelectrolyte. Journal of Colloid and Interface Science, 313, 184-193.
ESQUIVEL, E. V. & MURR, L. E. 2004. A TEM analysis of nanoparticulates in a Polar ice core. Materials Characterization, 52, 15-25.
FABREGA, J., TANTRA, R., AMER, A., STOLPE, B., TOMKINS, J., FRY, T., LEAD, J. R., TYLER, C. R. & GALLOWAY, T. S. 2011. Sequestration of zinc from zinc oxide nanoparticles and life cycle effects in the sediment dweller amphipod Corophium volutator. Environmental Science & Technology, 46, 1128-1135.
FANG, J., SHAN, X.-Q., WEN, B., LIN, J.-M. & OWENS, G. 2009. Stability of titania nanoparticles in soil suspensions and transport in saturated homogeneous soil columns. Environmental Pollution, 157, 1101-1109.
FEIN, J. B., BOILY, J.-F., YEE, N., GORMAN-LEWIS, D. & TURNER, B. F. 2005. Potentiometric titrations of Bacillus subtilis cells to low pH and a comparison of modeling approaches. Geochimica et Cosmochimica Acta, 69, 1123-1132.
153
FEIN, J. B., DAUGHNEY, C. J., YEE, N. & DAVIS, T. A. 1997. A chemical equilibrium model for metal adsorption onto bacterial surfaces. Geochimica et Cosmochimica Acta, 61, 3319-3328.
FERRIS, F. G., PHOENIX, V., FUJITA, Y. & SMITH, R. W. 2004. Kinetics of calcite precipitation induced by ureolytic bacteria at 10 to 20°C in artificial groundwater. Geochimica et Cosmochimica Acta, 68, 1701-1710.
FOLETTO, E. L., SANTOS, W. R. B. D., MAZUTTI, M. A., JAHN, S. L. & GÜNDEL, A. 2013. Production of struvite from beverage waste as phosphorus source. Materials Research, 16, 242-245.
FOWLE, D. A. & FEIN, J. B. 2000. Experimental measurements of the reversibility of metal–bacteria adsorption reactions. Chemical Geology, 168, 27-36.
FRANCHI, A. & O'MELIA, C. R. 2003. Effects of Natural Organic Matter and Solution Chemistry on the Deposition and Reentrainment of Colloids in Porous Media. Environmental Science & Technology, 37, 1122-1129.
FREY, N. A., PENG, S., CHENG, K. & SUN, S. 2009. Magnetic nanoparticles: synthesis, functionalization, and applications in bioimaging and magnetic energy storage. Chemical Society reviews, 38, 2532-2542.
FUJITA, Y., REDDEN, G. D., INGRAM, J. C., CORTEZ, M. M., FERRIS, F. G. & SMITH, R. W. 2004. Strontium incorporation into calcite generated by bacterial ureolysis. Geochimica et Cosmochimica Acta, 68, 3261-3270.
FUJITA, Y., TAYLOR, J. L., GRESHAM, T. L. T., DELWICHE, M. E., COLWELL, F. S., MCLING, T. L., PETZKE, L. M. & SMITH, R. W. 2008. Stimulation Of Microbial Urea Hydrolysis In Groundwater To Enhance Calcite Precipitation. Environmental Science & Technology, 42, 3025-3032.
GLASAUER, S., LANGLEY, S. & BEVERIDGE, T. J. 2001. Sorption of Fe (hydr)oxides to the surface of Shewanella putrefaciens: cell-bound fine-grained minerals are not always formed de novo. Applied and environmental microbiology, 67, 5544-50.
GLASAUER, S., LANGLEY, S. & BEVERIDGE, T. J. 2002. Intracellular Iron Minerals in a Dissimilatory Iron-Reducing Bacterium. Science, 295, 117-119.
GODINEZ, I. G., DARNAULT, C. J. G., KHODADOUST, A. P. & BOGDAN, D. 2013. Deposition and release kinetics of nano-TiO2 in saturated porous media: Effects of solution ionic strength and surfactants. Environmental Pollution, 174, 106-113.
GOGOS, A., KNAUER, K. & BUCHELI, T. D. 2012. Nanomaterials in plant protection and fertilization: current state, foreseen applications, and research priorities. Journal of agricultural and food chemistry, 60, 9781-9792.
GOLMOHAMADI, M., CLARK, R. J., VEINOT, J. G. & WILKINSON, K. J. 2013. The role of charge on the diffusion of solutes and nanoparticles (silicon nanocrystals, nTiO2, nAu) in a biofilm. Environmental Chemistry, 10, 34-41.
GOPAL, M., KUMAR, R. & GOSWAMI, A. 2012. Nano-pesticides-a recent approach for pest control. The Journal of Plant Protection Sciences, 4, 1-7.
GORMAN-LEWIS, D., FEIN, J. B., SODERHOLM, L., JENSEN, M. P. & CHIANG, M. H. 2005. Experimental study of neptunyl adsorption onto Bacillus subtilis. Geochimica et Cosmochimica Acta, 69, 4837-4844.
GRAY, M. J., MALATI, M. A. & ROPHAEL, M. W. 1978. The point of zero charge of manganese dioxides. Journal of Electroanalytical Chemistry and Interfacial Electrochemistry, 89, 135-140.
GUCZI, L., BECK, A. & PÁSZTI, Z. 2012. Gold catalysis: Effect of particle size on reactivity towards various substrates. Catalysis Today, 181, 26-32.
154
HAMMES, F., SEKA, A., VAN HEGE, K., VAN DE WIELE, T., VANDERDEELEN, J., SICILIANO, S. D. & VERSTRAETE, W. 2003. Calcium removal from industrial wastewater by bio-catalytic CaCO3 precipitation. Journal of Chemical Technology & Biotechnology, 78, 670-677.
HANDY, R., VON DER KAMMER, F., LEAD, J., HASSELLÖV, M., OWEN, R. & CRANE, M. 2008a. The ecotoxicology and chemistry of manufactured nanoparticles. Ecotoxicology, 17, 287-314.
HANDY, R. D., OWEN, R. & VALSAMI-JONES, E. 2008b. The ecotoxicology of nanoparticles and nanomaterials: current status, knowledge gaps, challenges, and future needs. Ecotoxicology (London, England), 17, 315-325.
HARDING, I. S., RASHID, N. & HING, K. A. 2005. Surface charge and the effect of excess calcium ions on the hydroxyapatite surface. Biomaterials, 26, 6818-6826.
HAZEN, R. M. & SVERJENSKY, D. A. 2010. Mineral surfaces, geochemical complexities, and the origins of life. Cold Spring Harbor perspectives in biology, 2, a002162.
HE, F. & ZHAO, D. 2005. Preparation and Characterization of a New Class of Starch-Stabilized Bimetallic Nanoparticles for Degradation of Chlorinated Hydrocarbons in Water. Environmental Science & Technology, 39, 3314-3320.
HOCHELLA JR, M. F. 2002. Nanoscience and technology: the next revolution in the Earth sciences. Earth and Planetary Science Letters, 203, 593-605.
HOCHELLA, M. F., LOWER, S. K., MAURICE, P. A., PENN, R. L., SAHAI, N., SPARKS, D. L. & TWINING, B. S. 2008. Nanominerals, Mineral Nanoparticles, and Earth Systems. Science, 319, 1631-1635.
HONG, Y., HONDA, R. J., MYUNG, N. V. & WALKER, S. L. 2009. Transport of iron-based nanoparticles: role of magnetic properties. Environmental Science & Technology, 43, 8834-8839.
HORWELL, C. J. & BAXTER, P. J. 2006. The respiratory health hazards of volcanic ash: a review for volcanic risk mitigation. Bulletin of Volcanology, 69, 1-24.
HU, J.-D., ZEVI, Y., KOU, X.-M., XIAO, J., WANG, X.-J. & JIN, Y. 2010. Effect of dissolved organic matter on the stability of magnetite nanoparticles under different pH and ionic strength conditions. Science of The Total Environment, 408, 3477-3489.
IIJIMA, M. & KAMIYA, H. 2009. Surface modification for improving the stability of nanoparticles in liquid media. Kona Powder Particle J, 27, 119-129.
ILLÉS, E. & TOMBÁCZ, E. 2003. The role of variable surface charge and surface complexation in the adsorption of humic acid on magnetite. Colloids and Surfaces A: Physicochemical and Engineering Aspects, 230, 99-109.
INSTRUMENTS, M. 2011. Zeta potential: An Introduction in 30 minutes. Zetasizer Nano Serles Technical Note. MRK654-01.
JAFFER, Y., CLARK, T. A., PEARCE, P. & PARSONS, S. A. 2002. Potential phosphorus recovery by struvite formation. Water Research, 36, 1834-1842.
JIANG, W., MASHAYEKHI, H. & XING, B. 2009. Bacterial toxicity comparison between nano-and micro-scaled oxide particles. Environmental Pollution, 157, 1619-1625.
JOHNS, M. 1995. Developments in wastewater treatment in the meat processing industry: A review. Bioresource Technology, 54, 203-216.

155
JU-NAM, Y. & LEAD, J. R. 2008. Manufactured nanoparticles: An overview of their chemistry, interactions and potential environmental implications. Science of The Total Environment, 400, 396-414.
KANEL, S., NEPAL, D., MANNING, B. & CHOI, H. 2007. Transport of surface-modified iron nanoparticle in porous media and application to arsenic(III) remediation. Journal of Nanoparticle Research, 9, 725-735.
KARN, B., KUIKEN, T. & OTTO, M. 2011. Nanotechnology and in situ remediation: a review of the benefits and potential risks. Ciencia & Saude Coletiva, 16, 165-178.
KELLEY, D. S., KARSON, J. A., BLACKMAN, D. K., FRUÈH-GREEN, G. L., BUTTERFIELD, D. A., LILLEY, M. D., OLSON, E. J., SCHRENK, M. O., ROE, K. K. & LEBON, G. T. 2001. An off-axis hydrothermal vent field near the Mid-Atlantic Ridge at 30 N. Nature, 412, 145-149.
KIM, J., PARK, Y., YOON, T. H., YOON, C. S. & CHOI, K. 2010a. Phototoxicity of CdSe/ZnSe quantum dots with surface coatings of 3-mercaptopropionic acid or tri-< i> n</i>-octylphosphine oxide/gum arabic in< i> Daphnia magna</i> under environmentally relevant UV-B light. Aquatic toxicology, 97, 116-124.
KIM, Y.-Y., RIBEIRO, L., MAILLOT, F., WARD, O., EICHHORN, S. J. & MELDRUM, F. C. 2010b. Bio-Inspired Synthesis and Mechanical Properties of Calcite–Polymer Particle Composites. Advanced Materials, 22, 2082-2086.
KISER, M. A., RYU, H., JANG, H., HRISTOVSKI, K. & WESTERHOFF, P. 2010. Biosorption of nanoparticles to heterotrophic wastewater biomass. Water Research, 44, 4105-4114.
KISER, M. A., WESTERHOFF, P., BENN, T., WANG, Y., PE REZ-RIVERA, J. & HRISTOVSKI, K. 2009. Titanium Nanomaterial Removal and Release from Wastewater Treatment Plants. Environmental Science & Technology, 43, 6757-6763.
KONHAUSER, K. O. 2009. Introduction to geomicrobiology, John Wiley & Sons. KUMAR, P., ROBINS, A., VARDOULAKIS, S. & BRITTER, R. 2010. A review of the
characteristics of nanoparticles in the urban atmosphere and the prospects for developing regulatory controls. Atmospheric Environment, 44, 5035-5052.
KURAHATTI, R., SURENDRANATHAN, A., KORI, S., SINGH, N., KUMAR, A. R. & SRIVASTAVA, S. 2010. Defence applications of polymer nanocomposites. Defence Science Journal, 60, 551-563.
KVITEK, L., PANAC EK, A., SOUKUPOVA, J., KOLAR, M., VEC EROVA, R., PRUCEK, R., HOLECOVA, M. & ZBORIL, R. 2008. Effect of Surfactants and Polymers on Stability and Antibacterial Activity of Silver Nanoparticles (NPs). The Journal of Physical Chemistry C, 112, 5825-5834.
LASAGA, A. Kinetic theory in the Earth Sciences, 1998. Princeton University Press.
LASAGNA-REEVES, C., GONZALEZ-ROMERO, D., BARRIA, M. A., OLMEDO, I., CLOS, A., SADAGOPA RAMANUJAM, V. M., URAYAMA, A., VERGARA, L., KOGAN, M. J. & SOTO, C. 2010. Bioaccumulation and toxicity of gold nanoparticles after repeated administration in mice. Biochemical and Biophysical Research Communications, 393, 649-655.
LAZAROVA, V. & MANEM, J. 1995. Biofilm characterization and activity analysis in water and wastewater treatment. Water Research, 29, 2227-2245.
LECOANET, H. F., BOTTERO, J.-Y. & WIESNER, M. R. 2004. Laboratory Assessment of the Mobility of Nanomaterials in Porous Media. Environmental Science & Technology, 38, 5164-5169.
156
LECOANET, H. F. & WIESNER, M. R. 2004. Velocity Effects on Fullerene and Oxide Nanoparticle Deposition in Porous Media. Environmental Science & Technology, 38, 4377-4382.
LEE, W. M., AN, Y. J., YOON, H. & KWEON, H. S. 2008. Toxicity and bioavailability of copper nanoparticles to the terrestrial plants mung bean (Phaseolus radiatus) and wheat (Triticum aestivum): Plant agar test for water‐insoluble nanoparticles. Environmental Toxicology and Chemistry, 27, 1915-1921.
LEON MORALES, C. F., STRATHMANN, M. & FLEMMING, H.-C. 2007. Influence of biofilms on the movement of colloids in porous media. Implications for colloid facilitated transport in subsurface environments. Water Research, 41, 2059-2068.
LESLEY A. WARREN, PATRICIA A. MAURICE, NAGINA PARMAR & FERRIS, F. G. 2001. Microbially Mediated Calcium Carbonate Precipitation: Implications for Interpreting Calcite Precipitation and for Solid-Phase Capture of Inorganic Contaminants. Geomicrobiology Journal, 18, 93-115.
LEVARD, C., HOTZE, E. M., LOWRY, G. V. & BROWN, G. E. 2012. Environmental Transformations of Silver Nanoparticles: Impact on Stability and Toxicity. Environmental Science & Technology, 46, 6900-6914.
LI, X.-Q., ELLIOTT, D. W. & ZHANG, W.-X. 2006. Zero-Valent Iron Nanoparticles for Abatement of Environmental Pollutants: Materials and Engineering Aspects. Critical Reviews in Solid State and Materials Sciences, 31, 111-122.
LI, Z., ALY HASSAN, A., SAHLE-DEMESSIE, E. & SORIAL, G. A. Transport of nanoparticles with dispersant through biofilm coated drinking water sand filters. Water Research.
LI, Z., ALY HASSAN, A., SAHLE-DEMESSIE, E. & SORIAL, G. A. 2013. Transport of nanoparticles with dispersant through biofilm coated drinking water sand filters. Water Research, 47, 6457-6466.
LIMBACH, L. K., BEREITER, R., MU LLER, E., KREBS, R., GA LLI, R. & STARK, W. J. 2008. Removal of Oxide Nanoparticles in a Model Wastewater Treatment Plant: Influence of Agglomeration and Surfactants on Clearing Efficiency. Environmental Science & Technology, 42, 5828-5833.
LIU, Y. & TAY, J.-H. 2004. State of the art of biogranulation technology for wastewater treatment. Biotechnology Advances, 22, 533-563.
LIU, Y., YANG, S.-F., TAY, J.-H., LIU, Q.-S., QIN, L. & LI, Y. 2004. Cell hydrophobicity is a triggering force of biogranulation. Enzyme and Microbial Technology, 34, 371-379.
LOWRY, G. V., ESPINASSE, B. P., BADIREDDY, A. R., RICHARDSON, C. J., REINSCH, B. C., BRYANT, L. D., BONE, A. J., DEONARINE, A., CHAE, S. & THEREZIEN, M. 2012a. Long-term transformation and fate of manufactured Ag nanoparticles in a simulated large scale freshwater emergent wetland. Environmental Science & Technology, 46, 7027-7036.
LOWRY, G. V., GREGORY, K. B., APTE, S. C. & LEAD, J. R. 2012b. Transformations of Nanomaterials in the Environment. Environmental Science & Technology, 46, 6893-6899.
LU, C. H., QI, L. M., CONG, H. L., WANG, X. Y., YANG, J. H., YANG, L. L., ZHANG, D. Y., MA, J. M. & CAO, W. X. 2005. Synthesis of calcite single crystals with porous surface by templating of polymer latex particles. Chemistry of Materials, 17, 5218-5224.
LUO, X., MORRIN, A., KILLARD, A. J. & SMYTH, M. R. 2006. Application of Nanoparticles in Electrochemical Sensors and Biosensors. Electroanalysis, 18, 319-326.

157
MAHIAN, O., KIANIFAR, A., KALOGIROU, S. A., POP, I. & WONGWISES, S. 2013. A review of the applications of nanofluids in solar energy. International Journal of Heat and Mass Transfer, 57, 582-594.
MAILLARD, F., SAVINOVA, E. R. & STIMMING, U. 2007. CO monolayer oxidation on Pt nanoparticles: Further insights into the particle size effects. Journal of Electroanalytical Chemistry, 599, 221-232.
MARTIN, D., DODDS, K., NGWENYA, B. T., BUTLER, I. B. & ELPHICK, S. C. 2012. Inhibition of Sporosarcina pasteurii under Anoxic Conditions: Implications for Subsurface Carbonate Precipitation and Remediation via Ureolysis. Environmental Science & Technology, 46, 8351-8355.
MARTINEZ, R. E. & FERRIS, F. G. 2005. Review of the surface chemical heterogeneity of bacteriogenic iron oxides: Proton and cadmium sorption. American Journal of Science, 305, 854-871.
MARTINEZ, R. E., PEDERSEN, K. & FERRIS, F. G. 2004. Cadmium complexation by bacteriogenic iron oxides from a subterranean environment. Journal of Colloid and Interface Science, 275, 82-89.
MAYNARD, A. D., WARHEIT, D. B. & PHILBERT, M. A. 2011. The New Toxicology of Sophisticated Materials: Nanotoxicology and Beyond. Toxicological Sciences, 120, S109-S129.
MISRA, S. K., DYBOWSKA, A., BERHANU, D., CROTEAU, M. N., LUOMA, S. N., BOCCACCINI, A. R. & VALSAMI-JONES, E. 2011. Isotopically Modified Nanoparticles for Enhanced Detection in Bioaccumulation Studies. Environmental Science & Technology, 46, 1216-1222.
MITCHELL, A. C., DIDERIKSEN, K., SPANGLER, L. H., CUNNINGHAM, A. B. & GERLACH, R. 2010. Microbially Enhanced Carbon Capture and Storage by Mineral-Trapping and Solubility-Trapping. Environmental Science & Technology, 44, 5270-5276.
MITCHELL, A. C. & FERRIS, F. G. 2005. The coprecipitation of Sr into calcite precipitates induced by bacterial ureolysis in artificial groundwater: Temperature and kinetic dependence. Geochimica Et Cosmochimica Acta, 69, 4199-4210.
MOORE, M. N. 2006. Do nanoparticles present ecotoxicological risks for the health of the aquatic environment? Environment International, 32, 967-976.
MUELLER, N., BRAUN, J., BRUNS, J., ČERNÍK, M., RISSING, P., RICKERBY, D. & NOWACK, B. 2012. Application of nanoscale zero valent iron (NZVI) for groundwater remediation in Europe. Environmental Science and Pollution Research, 19, 550-558.
MUELLER, N. C. & NOWACK, B. 2008. Exposure Modeling of Engineered Nanoparticles in the Environment. Environmental Science & Technology, 42, 4447-4453.
MURPHY, J. & RILEY, J. P. 1958. A Single-Solution Method for the Determination of Soluble Phosphate in Sea Water. Journal of the Marine Biological Association of the United Kingdom, 37, 9-14.
MUSEE, N. 2011. Nanowastes and the environment: Potential new waste management paradigm. Environment International, 37, 112-128.
NEL, A., XIA, T., MÄDLER, L. & LI, N. 2006. Toxic Potential of Materials at the Nanolevel. Science, 311, 622-627.
NELSON, N. O., MIKKELSEN, R. L. & HESTERBERG, D. L. 2003. Struvite precipitation in anaerobic swine lagoon liquid: effect of pH and Mg:P ratio and determination of rate constant. Bioresource Technology, 89, 229-236.

158
NETWORK, N. K. T. 2010. Nanotechnology: a UK Industry View [Online]. Available: http://www.matuk.co.uk/docs/Nano_report.pdf [Accessed 09/08/2011 2011].
NGWENYA, B. T., SUTHERLAND, I. W. & KENNEDY, L. 2003. Comparison of the acid-base behaviour and metal adsorption characteristics of a gram-negative bacterium with other strains. Applied Geochemistry, 18, 527-538.
NICOLELLA, C., VAN LOOSDRECHT, M. C. M. & HEIJNEN, J. J. 2000. Wastewater treatment with particulate biofilm reactors. Journal of Biotechnology, 80, 1-33.
NOWACK, B. & BUCHELI, T. D. 2007. Occurrence, behavior and effects of nanoparticles in the environment. Environmental Pollution, 150, 5-22.
O'DOWD, C. D., SMITH, M. H., CONSTERDINE, I. E. & LOWE, J. A. 1997. Marine aerosol, sea-salt, and the marine sulphur cycle: a short review. Atmospheric Environment, 31, 73-80.
O'TOOLE, G., KAPLAN, H. B. & KOLTER, R. 2000. Biofilm formation as microbial development. Annual Reviews in Microbiology, 54, 49-79.
OHLINGER, K. N., YOUNG, T. M. & SCHROEDER, E. D. 1998. Predicting struvite formation in digestion. Water Research, 32, 3607-3614.
OSBORNE, C. A., LULICH, J. P., POLZIN, D. J., ALLEN, T. A., KRUGER, J. M., BARTGES, J. W., KOEHLER, L. A., ULRICH, L. K., BIRD, K. A. & SWANSON, L. L. 1999. Medical dissolution and prevention of canine struvite urolithiasis. Twenty years of experience. The Veterinary clinics of North America. Small animal practice, 29, 73-111, xi.
OVERNEY, R. M. 2009. Nanoscience on the tip. University of Washington. PALMER, J., FLINT, S. & BROOKS, J. 2007. Bacterial cell attachment, the
beginning of a biofilm. Journal of industrial microbiology & biotechnology, 34, 577-588.
PALMER JR, R. J. & WHITE, D. C. 1997. Developmental biology of biofilms: implications for treatment and control. Trends in microbiology, 5, 435-440.
PARKHURST, D. L. & APPELO, C. A. J. 1999. User's guide to PHREEQC (Version 2) : a computer program for speciation, batch-reaction, one-dimensional transport, and inverse geochemical calculations. U.S. Geological Survey Water-Resources Investigations Report.
PARKIN, I. P. & PALGRAVE, R. G. 2005. Self-cleaning coatings. Journal of Materials Chemistry, 15, 1689-1695.
PASTOR, L., MANGIN, D., BARAT, R. & SECO, A. 2008. A pilot-scale study of struvite precipitation in a stirred tank reactor: Conditions influencing the process. Bioresource Technology, 99, 6285-6291.
PAUTLER, M. & BRENNER, S. 2010. Nanomedicine: promises and challenges for the future of public health. International journal of nanomedicine, 5, 803.
PEI, Z., LI, L., SUN, L., ZHANG, S., SHAN, X.-Q., YANG, S. & WEN, B. 2013. Adsorption characteristics of 1,2,4-trichlorobenzene, 2,4,6-trichlorophenol, 2-naphthol and naphthalene on graphene and graphene oxide. Carbon, 51, 156-163.
PERALTA-VIDEA, J. R., ZHAO, L., LOPEZ-MORENO, M. L., DE LA ROSA, G., HONG, J. & GARDEA-TORRESDEY, J. L. 2011. Nanomaterials and the environment: A review for the biennium 2008–2010. Journal of Hazardous Materials, 186, 1-15.

159
PETOSA, A. R., BRENNAN, S. J., RAJPUT, F. & TUFENKJI, N. 2012. Transport of two metal oxide nanoparticles in saturated granular porous media: Role of water chemistry and particle coating. Water Research, 46, 1273-1285.
PETOSA, A. R., JAISI, D. P., QUEVEDO, I. R., ELIMELECH, M. & TUFENKJI, N. 2010. Aggregation and Deposition of Engineered Nanomaterials in Aquatic Environments: Role of Physicochemical Interactions. Environmental Science & Technology, 44, 6532-6549.
PEULEN, T.-O. & WILKINSON, K. J. 2011. Diffusion of nanoparticles in a biofilm. Environmental Science & Technology, 45, 3367-3373.
PHOENIX, V. R., MARTINEZ, R. E., KONHAUSER, K. O. & FERRIS, F. G. 2002. Characterization and Implications of the Cell Surface Reactivity of Calothrix sp. Strain KC97. Appl. Environ. Microbiol., 68, 4827-4834.
PILOTEK, S. & TABELLION, F. 2005. Nanoparticles in coatings. Eur. Coat. J, 4, 170-176.
POWELL, M., GRIFFIN, M. A. & TAI, S. 2008. Bottom-Up Risk Regulation? How Nanotechnology Risk Knowledge Gaps Challenge Federal and State Environmental Agencies. Environmental Management, 42, 426-443.
PRICE, P. B. 2000. A habitat for psychrophiles in deep Antarctic ice. Proceedings of the National Academy of Sciences, 97, 1247-1251.
QUARMBY, J. & FORSTER, C. F. 1995. An examination of the structure of UASB granules. Water Research, 29, 2449-2454.
RAI, M., YADAV, A. & GADE, A. 2009. Silver nanoparticles as a new generation of antimicrobials. Biotechnology Advances, 27, 76-83.
RAO, C. N. R., KULKARNI, G. U., THOMAS, P. J. & EDWARDS, P. P. 2002. Size-Dependent Chemistry: Properties of Nanocrystals. Chemistry – A European Journal, 8, 28-35.
REMPEL, A. W. & WORSTER, M. G. 1999. The interaction between a particle and an advancing solidification front. Journal of Crystal Growth, 205, 427-440.
RIETMEIJER, F. J. & MACKINNON, I. D. 1997. Bismuth oxide nanoparticles in the stratosphere. Journal of Geophysical Research: Planets (1991–2012), 102, 6621-6627.
RIJNAARTS, H. H., NORDE, W., LYKLEMA, J. & ZEHNDER, A. J. 1999. DLVO and steric contributions to bacterial deposition in media of different ionic strengths. Colloids and Surfaces B: Biointerfaces, 14, 179-195.
RODUNER, E. 2006. Size Matters: Why Nanomaterials Are Different. ChemInform, 37, no-no.
RYU, H.-D., KIM, D. & LEE, S.-I. 2008. Application of struvite precipitation in treating ammonium nitrogen from semiconductor wastewater. Journal of Hazardous Materials, 156, 163-169.
RYU, H.-D. & LEE, S.-I. 2010. Application of struvite precipitation as a pretreatment in treating swine wastewater. Process Biochemistry, 45, 563-572.
SALEH, N., KIM, H.-J., PHENRAT, T., MATYJASZEWSKI, K., TILTON, R. D. & LOWRY, G. V. 2008. Ionic Strength and Composition Affect the Mobility of Surface-Modified Fe0 Nanoparticles in Water-Saturated Sand Columns. Environmental Science & Technology, 42, 3349-3355.
SCHRICK, B., HYDUTSKY, B. W., BLOUGH, J. L. & MALLOUK, T. E. 2004. Delivery vehicles for zerovalent metal nanoparticles in soil and groundwater. Chemistry of Materials, 16, 2187-2193.
SCHULZ, H. N. & SCHULZ, H. D. 2005. Large Sulfur Bacteria and the Formation of Phosphorite. Science, 307, 416-418.
160
SHI, L.-N., ZHANG, X. & CHEN, Z.-L. 2011. Removal of Chromium (VI) from wastewater using bentonite-supported nanoscale zero-valent iron. Water Research, 45, 886-892.
SILVER-COLLOIDS. 2012. The Influence of Zeta Potential [Online]. Available: http://www.silver-colloids.com/Tutorials/Intro/pcs18.html [Accessed 2014].
SIMONET, B. M. & VALCÁRCEL, M. 2009. Monitoring nanoparticles in the environment. Analytical and Bioanalytical Chemistry, 393, 17-21.
SMALL, T. D., WARREN, L. A. & FERRIS, F. G. 2001. Influence of ionic strength on strontium sorption to bacteria, Fe(III) oxide, and composite bacteria-Fe(III) oxide surfaces. Applied Geochemistry, 16, 939-946.
SMITH, C. J., SHAW, B. J. & HANDY, R. D. 2007. Toxicity of single walled carbon nanotubes to rainbow trout,(< i> Oncorhynchus mykiss</i>): Respiratory toxicity, organ pathologies, and other physiological effects. Aquatic toxicology, 82, 94-109.
SPERANZA, A., LEOPOLD, K., MAIER, M., TADDEI, A. R. & SCOCCIANTI, V. 2010. Pd-nanoparticles cause increased toxicity to kiwifruit pollen compared to soluble Pd (II). Environmental Pollution, 158, 873-882.
STANKUS, D. P., LOHSE, S. E., HUTCHISON, J. E. & NASON, J. A. 2010. Interactions between natural organic matter and gold nanoparticles stabilized with different organic capping agents. Environmental Science & Technology, 45, 3238-3244.
STANLEY, N. R. & LAZAZZERA, B. A. 2004. Environmental signals and regulatory pathways that influence biofilm formation. Molecular microbiology, 52, 917-924.
STEWART, P. S. 2003. Diffusion in biofilms. Journal of bacteriology, 185, 1485-1491.
STOCKS-FISCHER, S., GALINAT, J. K. & BANG, S. S. 1999. Microbiological precipitation of CaCO3. Soil Biology and Biochemistry, 31, 1563-1571.
STOODLEY, P. & LEWANDOWSKI, Z. 1994. Liquid flow in biofilm systems. Applied and environmental microbiology, 60, 2711-2716.
STOODLEY, P., SAUER, K., DAVIES, D. & COSTERTON, J. W. 2002. Biofilms as complex differentiated communities. Annual Reviews in Microbiology, 56, 187-209.
SUJITH, P. P. & BHARATHI, P. A. L. 2011. Manganese Oxidation by Bacteria: Biogeochemical Aspects
Molecular Biomineralization. In: MÜLLER, W. E. G. (ed.). Springer Berlin Heidelberg.
TAY, J.-H., PAN, S., HE, Y. & TAY, S. T. L. 2004. Effect of organic loading rate on aerobic granulation. I: Reactor performance. Journal of Environmental Engineering, 130, 1094-1101.
TENG, H. H., DOVE, P. M. & DE YOREO, J. J. 2000. Kinetics of calcite growth: surface processes and relationships to macroscopic rate laws. Geochimica et Cosmochimica Acta, 64, 2255-2266.
TIRAFERRI, A. & SETHI, R. 2009. Enhanced transport of zerovalent iron nanoparticles in saturated porous media by guar gum. Journal of Nanoparticle Research, 11, 635-645.
TOBLER, D. J., CUTHBERT, M. O., GRESWELL, R. B., RILEY, M. S., RENSHAW, J. C., HANDLEY-SIDHU, S. & PHOENIX, V. R. 2011. Comparison of rates of ureolysis between Sporosarcina pasteurii and an indigenous groundwater community under conditions required to precipitate large volumes of calcite. Geochimica et Cosmochimica Acta, 75, 3290-3301.

161
TOBLER, D. J., MACLACHLAN, E. & PHOENIX, V. R. 2012. Microbially mediated plugging of porous media and the impact of differing injection strategies. Ecological Engineering, 42, 270-278.
TROUILLER, B., RELIENE, R., WESTBROOK, A., SOLAIMANI, P. & SCHIESTL, R. H. 2009. Titanium Dioxide Nanoparticles Induce DNA Damage and Genetic Instability In vivo in Mice. Cancer Research.
TUFENKJI, N. & ELIMELECH, M. 2003. Correlation Equation for Predicting Single-Collector Efficiency in Physicochemical Filtration in Saturated Porous Media. Environmental Science & Technology, 38, 529-536.
ULUDAG-DEMIRER, S., DEMIRER, G. N. & CHEN, S. 2005. Ammonia removal from anaerobically digested dairy manure by struvite precipitation. Process Biochemistry, 40, 3667-3674.
VAN CAPPELLEN, P., CHARLET, L., STUMM, W. & WERSIN, P. 1993. A surface complexation model of the carbonate mineral-aqueous solution interface. Geochimica et Cosmochimica Acta, 57, 3505-3518.
VAN LOOSDRECHT, M. C., NORDE, W., LYKLEMA, J. & ZEHNDER, A. J. 1990. Hydrophobic and electrostatic parameters in bacterial adhesion. Aquatic sciences, 52, 103-114.
VERCHOVSKY, A. B., FISENKO, A. V., SEMJONOVA, L. F., BRIDGES, J., LEE, M. R. & WRIGHT, I. P. 2006. Nanodiamonds from AGB stars: A new type of presolar grain in meteorites. The Astrophysical Journal, 651, 481.
VIDOJKOVIC, S., RODRIGUEZ-SANTIAGO, V., FEDKIN, M. V., WESOLOWSKI, D. J. & LVOV, S. N. 2011. Electrophoretic mobility of magnetite particles in high temperature water. Journal Name: Chemical Engineering Science; Journal Volume: 66; Journal Issue: 18, Medium: X; Size: 4029.
VIJAYARAGHAVAN, K. & YUN, Y.-S. 2008. Bacterial biosorbents and biosorption. Biotechnology Advances, 26, 266-291.
VILLALOBOS, M., ESCOBAR-QUIROZ, I. N. & SALAZAR-CAMACHO, C. 2014. The influence of particle size and structure on the sorption and oxidation behavior of birnessite: I. Adsorption of As(V) and oxidation of As(III). Geochimica et Cosmochimica Acta, 125, 564-581.
W., B. J. & K., N. D. 1992. Geochemical model to calculate speciation of major trace and redox elements in natural waters. US Geological Survey, International groundwater modeling centre.
WANG, J., GERLACH, J. D., SAVAGE, N. & COBB, G. P. 2013. Necessity and approach to integrated nanomaterial legislation and governance. Science of The Total Environment, 442, 56-62.
WARREN, L. A. & FERRIS, F. G. 1998. Continuum between sorption and precipitation of Fe (III) on microbial surfaces. Environmental Science & Technology, 32, 2331-2337.
WARREN, L. A., MAURICE, P. A., PARMAR, N. & FERRIS, F. G. 2001. Microbially mediated calcium carbonate precipitation: implications for interpreting calcite precipitation and for solid-phase capture of inorganic contaminants. Geomicrobiology Journal, 18, 93-115.
WEIR, A., WESTERHOFF, P., FABRICIUS, L., HRISTOVSKI, K. & VON GOETZ, N. 2012. Titanium Dioxide Nanoparticles in Food and Personal Care Products. Environmental Science & Technology, 46, 2242-2250.
WHIFFIN, V. S., VAN PAASSEN, L. A. & HARKES, M. P. 2007. Microbial Carbonate Precipitation as a Soil Improvement Technique. Geomicrobiology Journal, 24, 417-423.
WIESNER, M. R., LOWRY, G. V., ALVAREZ, P., DIONYSIOU, D. & BISWAS, P. 2006. Assessing the Risks of Manufactured Nanomaterials. Environmental Science & Technology, 40, 4336-4345.
162
WILSON, B., DEWERS, T., RECHES, Z. E. & BRUNE, J. 2005. Particle size and energetics of gouge from earthquake rupture zones. Nature, 434, 749-752.
WONG, M. S., ALVAREZ, P. J. J., FANG, Y.-L., AKÇIN, N., NUTT, M. O., MILLER, J. T. & HECK, K. N. 2009. Cleaner water using bimetallic nanoparticle catalysts. Journal of Chemical Technology & Biotechnology, 84, 158-166.
YANG, C.-M., KALWEI, M., SCHÜTH, F. & CHAO, K.-J. 2003. Gold nanoparticles in SBA-15 showing catalytic activity in CO oxidation. Applied Catalysis A: General, 254, 289-296.
YEE, J. Y. 2007. Ag-Au Core-Shell Nanoparticles. YEE, N. & FEIN, J. 2001. Cd adsorption onto bacterial surfaces: A universal
adsorption edge? Geochimica et Cosmochimica Acta, 65, 2037-2042. YEE, N., FOWLE, D. A. & FERRIS, F. G. 2004. A Donnan potential model for metal
sorption onto Bacillus subtilis. Geochimica et Cosmochimica Acta, 68, 3657-3664.
ZEREINI, F., WISEMAN, C., ALT, F., MESSERSCHMIDT, J., MÜLLER, J. & URBAN, H. 2001. Platinum and rhodium concentrations in airborne particulate matter in Germany from 1988 to 1998. Environmental Science & Technology, 35, 1996-2000.
ZHANG, L., HOU, L., WANG, L., KAN, A. T., CHEN, W. & TOMSON, M. B. 2012. Transport of Fullerene Nanoparticles (nC60) in Saturated Sand and Sandy Soil: Controlling Factors and Modeling. Environmental Science & Technology, 46, 7230-7238.
ZHOU, S. & WU, Y. 2012. Improving the prediction of ammonium nitrogen removal through struvite precipitation. Environmental Science and Pollution Research, 19, 347-360.
ZHU, G., LIN, Z.-H., JING, Q., BAI, P., PAN, C., YANG, Y., ZHOU, Y. & WANG, Z. L. 2013. Toward large-scale energy harvesting by a nanoparticle-enhanced triboelectric nanogenerator. Nano Letters, 13, 847-853.
ZHU, X., CHANG, Y. & CHEN, Y. 2010. Toxicity and bioaccumulation of TiO< sub> 2</sub> nanoparticle aggregates in< i> Daphnia magna</i>. Chemosphere, 78, 209-215.
ZIAGOVA, M., DIMITRIADIS, G., ASLANIDOU, D., PAPAIOANNOU, X., LITOPOULOU TZANNETAKI, E. & LIAKOPOULOU-KYRIAKIDES, M. 2007. Comparative study of Cd(II) and Cr(VI) biosorption on Staphylococcus xylosus and Pseudomonas sp. in single and binary mixtures. Bioresource Technology, 98, 2859-2865.