Embed Size (px)
Citation preview
Skyweb Express Feasibility Study
RESULTS SUMMARY
Copyright©2007Taxi2000Corporation
Page2 Copyright©2007Taxi2000Corporation
Taxi 2000 Corporation NTS Feasibility Report
ConTEnTS EXECUTIVE SUMMARY ....................................................................................................31. InTRoDUCTIon ................................................................................................................7
1.1 Background ..............................................................................................................71.2 Objective ..................................................................................................................8
2. RIDERSHIP AnALYSIS .....................................................................................................102.1 Introduction ..............................................................................................................102.2 Network ....................................................................................................................112.3 Trip Generation Model .............................................................................................112.4 Trip Distribution Model .............................................................................................112.5 Mode Choice Model .................................................................................................112.6 TrafficAssignment ...................................................................................................122.7 MeasurementsofEffectiveness(MOE) ...................................................................122.8 RidershipFeeAnalysis ............................................................................................152.9 ComparisontoExistingTransportationSystems .....................................................222.11 SystemSimulation(s) ...............................................................................................22
3. SKYWEB EXPRESS SYSTEM ..........................................................................................243.1 Introduction ..............................................................................................................243.2 Customization .........................................................................................................253.3 ProfessionalEvaluationofControlSystem ..............................................................253.4 RideComfortParameters ........................................................................................263.5 Vehicle .....................................................................................................................263.6 Guideway .................................................................................................................293.7 CommunicationsSystem .........................................................................................313.8 Safety .......................................................................................................................32
4. FIXED FACILITIES ............................................................................................................334.1 Introduction ..............................................................................................................334.2 Stations ....................................................................................................................334.3 Off-Line Vehicle Storage ..........................................................................................374.4 Maintenance Facilities .............................................................................................37
5. SYSTEM PoWER ..............................................................................................................386. FInAnCIAL MoDEL ..........................................................................................................39
6.1 Introduction ..............................................................................................................396.2 Assumptions ............................................................................................................406.4 OperatingandMaintenanceExpenditureScenarios ...............................................406.5 ScenariosforSystemImplementation .....................................................................41
7. RECoMMEnDATIonS ......................................................................................................427.1 Introduction ..............................................................................................................427.2 PilotScheme ............................................................................................................427.3 The Municipality Phase 1 .........................................................................................427.4 The Municipality Build-Out .......................................................................................42
8. CoMPARISon To ALTERnATIVE TRAnSPoRTATIon .................................................438.1 Introduction ..............................................................................................................438.2 Comparison..............................................................................................................43
Copyright©2007Taxi2000Corporation Page�
NTS Feasibility Report Taxi 2000 Corporation
EXECUTIVE SUMMARY “PRT represents a new option for sustainable, effective urban transportation providing higher access and service at a lower cost than current transit options.” – Booz Allen Hamilton �
“The European Commission has studied four potential schemes, and concluded that hesitant local authorities are the only significant obstacle.” The Economist - March 10, 2007, Technology pp 10-12
The government officials of the Municipality contracted Taxi 2000 to perform a study of the feasibility of implementing Taxi 2000’s Skyweb Express Personal Rapid Transit (PRT) system in the Municipality. The study’s two main objectives were to evaluate the commercial viability of the technology behind Skyweb Express, and how that technology would best be implemented in the Municipality.
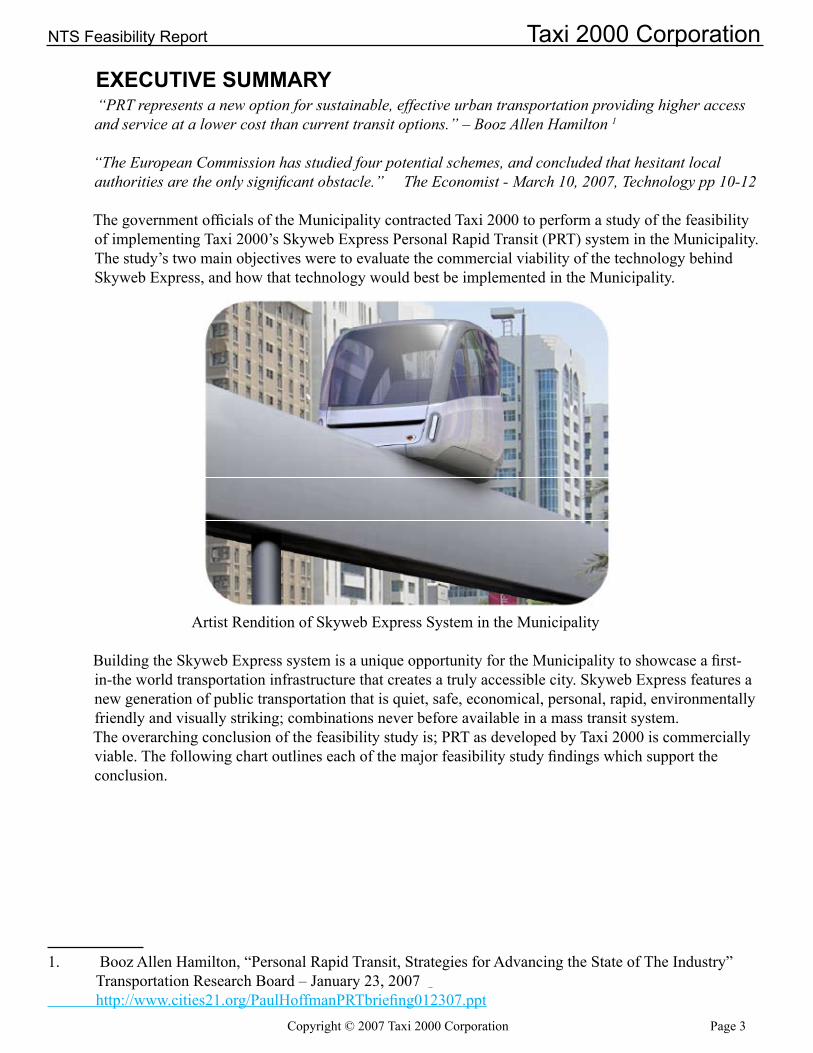
Artist Rendition of Skyweb Express System in the Municipality
Building the Skyweb Express system is a unique opportunity for the Municipality to showcase a first-in-the world transportation infrastructure that creates a truly accessible city. Skyweb Express features a new generation of public transportation that is quiet, safe, economical, personal, rapid, environmentally friendly and visually striking; combinations never before available in a mass transit system.The overarching conclusion of the feasibility study is; PRT as developed by Taxi 2000 is commercially viable. The following chart outlines each of the major feasibility study findings which support the conclusion.
1. Booz Allen Hamilton, “Personal Rapid Transit, Strategies for Advancing the State of The Industry” Transportation Research Board – January 23, 2007 http://www.cities21.org/PaulHoffmanPRTbriefing012307.ppt
Page� Copyright©2007Taxi2000Corporation
Taxi 2000 Corporation NTS Feasibility Report
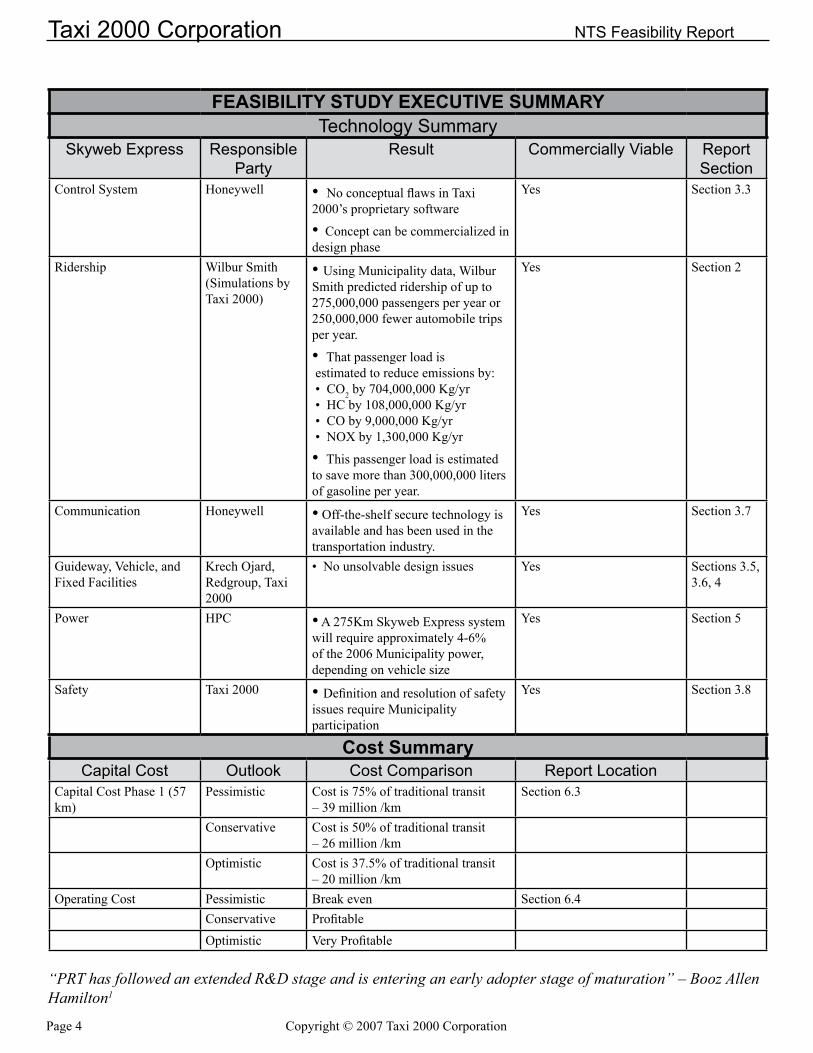
FEASIBILITY STUDY EXECUTIVE SUMMARYTechnologySummary
SkywebExpress Responsible Party
Result CommerciallyViable Report Section
Control System Honeywell • No conceptual flaws in Taxi 2000’s proprietary software
• Concept can be commercialized in design phase
Yes Section 3.3
Ridership Wilbur Smith(Simulations by Taxi 2000)
•Using Municipality data, Wilbur Smith predicted ridership of up to 275,000,000 passengers per year or 250,000,000 fewer automobile trips per year.
• That passenger load is estimated to reduce emissions by:•CO2 by 704,000,000 Kg/yr • HC by 108,000,000 Kg/yr • CO by 9,000,000 Kg/yr • NOX by 1,300,000 Kg/yr
• This passenger load is estimated to save more than 300,000,000 liters of gasoline per year.
Yes Section 2
Communication Honeywell • Off-the-shelf secure technology is available and has been used in the transportation industry.
Yes Section 3.7
Guideway, Vehicle, and Fixed Facilities
Krech Ojard, Redgroup, Taxi 2000
• No unsolvable design issues Yes Sections 3.5, 3.6, 4
Power HPC • A 275Km Skyweb Express system will require approximately 4-6% of the 2006 Municipality power, depending on vehicle size
Yes Section 5
Safety Taxi2000 •Definition and resolution of safety issues require Municipality participation
Yes Section 3.8
Cost SummaryCapital Cost Outlook CostComparison Report Location
Capital Cost Phase 1 (57 km)
Pessimistic Cost is 75% of traditional transit – 39 million /km
Section 6.3
Conservative Cost is 50% of traditional transit – 26 million /km
Optimistic Cost is 37.5% of traditional transit – 20 million /km
Operating Cost Pessimistic Break even Section 6.4Conservative ProfitableOptimistic Very Profitable
“PRT has followed an extended R&D stage and is entering an early adopter stage of maturation” – Booz Allen Hamilton�
Copyright©2007Taxi2000Corporation Page�
NTS Feasibility Report Taxi 2000 Corporation
Control System
The commercial and technical viability of Taxi 2000’s control system was a major area of focus in the study, and is a critical aspect to the successful deployment of a commercial system. The control system architecture has been implemented on a concept basis (Simulation Programs) and has been demonstrated on a 1/15th scale model system running at Taxi 2000. Honeywell Aerospace was tasked with providing a third party professional opinion of the control system. Their objective was to evaluate the existing operational control system for conceptual flaws that would inhibit the successful development of a commercial system. Their opinion, as stated in their formal report is: “After a thorough evaluation of the Concept, Honeywell concludes there are no conceptual flaws in the current version of the Taxi 2000 control system.” Quoting from their report: “there are no inherent limitations in the control system architecture or algorithmic complexities that preclude the ability to achieve a headway as low as 0.5 seconds.”
Ridership
Ridership traffic demand data supplied by the Municipality for the year 2020 predicts 3.9 million point-to-point trips per day for all forms of transportation in the greater Municipality area. A mode choice ridership analysis of that traffic demand data estimates that up to 24% of those 3.9 million trips would be served by a 275 Km Skyweb Express PRT system.
This feasibility study confirms the commercial and technical viability of Skyweb Express and describes how Skyweb Express will exceed the 5% of public transit traffic volume goal for the year 2020 set by the Municipality.
Financial Summary
Part of the feasibility study was a financial evaluation. The government authority dictated the format of the Taxi 2000 financial model. For the purposes of the feasibility study, and since the study did not include a design aspect, the capital, and operation and maintenance costs, were required to have an accuracy of +/- 20%. Several financial scenarios were produced by varying the system capacity (ridership) and the fare. (The differences in these scenarios were provided to the Municipality, but are not included in this abridged version). The models were included in Excel for use by the local government. The estimated cost for a Skyweb Express system was $19,600,000 per kilometer ($31,500,000/mile). According to a Booz Allen Hamilton (BAH) report, LRT transit has an average cost range of $31- $43.5 million /km ($50-$70 million/mile) and a high cost of $121 million/km ($195 million/mile). In a study of PRT by BAH, they estimate that PRT average cost is $12.4 million to $21.7 million /km ($20-$35 million/mile) with a high estimate of $31 million /km ($50 million/mile). The capital cost estimates in this study are within the BAH estimates.
Page 6 Copyright © 2007 Taxi 2000 Corporation
Taxi 2000 Corporation NTS Feasibility Report
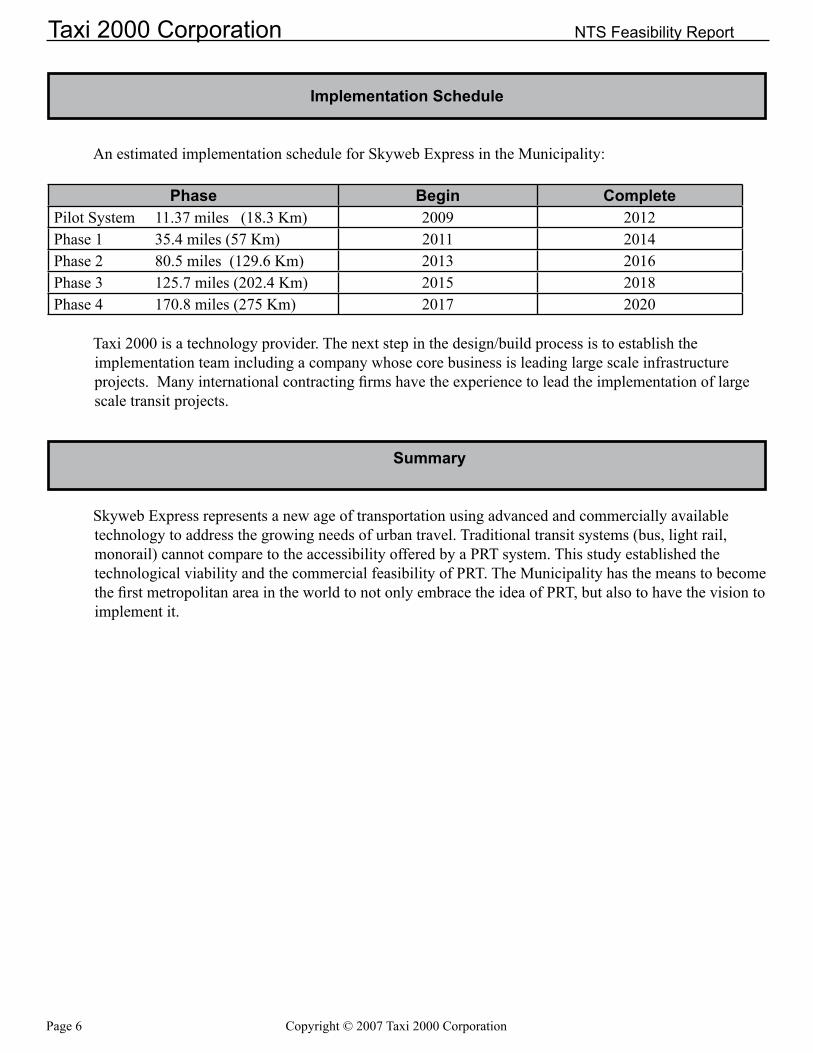
Implementation Schedule
An estimated implementation schedule for Skyweb Express in the Municipality:
Phase Begin CompletePilot System 11.37 miles (18.3 Km) 2009 2012Phase 1 35.4 miles (57 Km) 2011 201�Phase 2 80.5 miles (129.6 Km) 201� 2016Phase 3 125.7 miles (202.4 Km) 201� 2018Phase 4 170.8 miles (275 Km) 2017 2020
Taxi 2000 is a technology provider. The next step in the design/build process is to establish the implementation team including a company whose core business is leading large scale infrastructure projects. Many international contracting firms have the experience to lead the implementation of large scale transit projects.
Summary
Skyweb Express represents a new age of transportation using advanced and commercially available technology to address the growing needs of urban travel. Traditional transit systems (bus, light rail, monorail) cannot compare to the accessibility offered by a PRT system. This study established the technological viability and the commercial feasibility of PRT. The Municipality has the means to become the first metropolitan area in the world to not only embrace the idea of PRT, but also to have the vision to implement it.
Copyright©2007Taxi2000Corporation Page7
NTS Feasibility Report Taxi 2000 Corporation
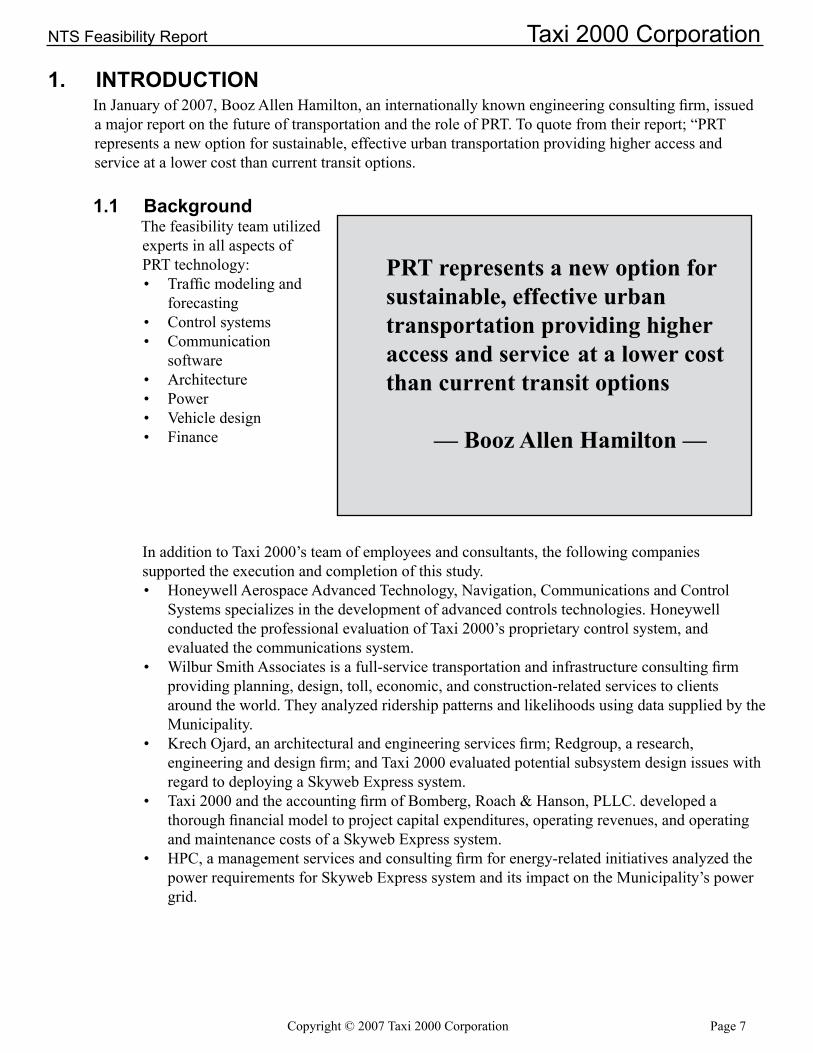
1. InTRoDUCTIonIn January of 2007, Booz Allen Hamilton, an internationally known engineering consulting firm, issued a major report on the future of transportation and the role of PRT. To quote from their report; “PRT represents a new option for sustainable, effective urban transportation providing higher access and service at a lower cost than current transit options.
1.1 BackgroundThe feasibility team utilized experts in all aspects of PRT technology:
Traffic modeling and forecasting Control systemsCommunication software ArchitecturePowerVehicle designFinance
In addition to Taxi 2000’s team of employees and consultants, the following companies supported the execution and completion of this study.
Honeywell Aerospace Advanced Technology, Navigation, Communications and Control Systems specializes in the development of advanced controls technologies. Honeywell conducted the professional evaluation of Taxi 2000’s proprietary control system, and evaluated the communications system.Wilbur Smith Associates is a full-service transportation and infrastructure consulting firm providing planning, design, toll, economic, and construction-related services to clients around the world. They analyzed ridership patterns and likelihoods using data supplied by the Municipality.Krech Ojard, an architectural and engineering services firm; Redgroup, a research, engineering and design firm; and Taxi 2000 evaluated potential subsystem design issues with regard to deploying a Skyweb Express system.Taxi 2000 and the accounting firm of Bomberg, Roach & Hanson, PLLC. developed a thorough financial model to project capital expenditures, operating revenues, and operating and maintenance costs of a Skyweb Express system.HPC, a management services and consulting firm for energy-related initiatives analyzed the power requirements for Skyweb Express system and its impact on the Municipality’s power grid.
•
••
••••
•
•
•
•
•
PRT represents a new option for sustainable, effective urban transportation providing higher access and service at a lower cost than current transit options
— Booz Allen Hamilton —
Page 8 Copyright © 2007 Taxi 2000 Corporation
Taxi 2000 Corporation NTS Feasibility Report
A set of basic assumptions influenced every element of this feasibility study: Preliminary design development and manufacturing activities for a commercial system were not part of this feasibility study.The 2020 traffic projections, as provided by the Municipality, were the foundation for the ridership projections.The Municipality’s goal is to have at least 5% of the 2020 traffic volume accomplished with public transit.The initial financial modeling assumptions were based on a three passenger vehicle, a 57 Km first phase system, and a standard transit fare. However, the model was designed to accommodate different assumptions and scenarios such as network layouts, fare differentials, and a 5- passenger vehicle.An 18 Km pilot system will be constructed prior to the first phase.A first phase commercial system of 57 kilometers will be constructed in the downtown area of the Municipality.The financial assumptions for the 57 kilometer system are based on accommodating 20,500 trips each peak hour for the first phase, representing approximately 5.25% of the ridership for all modes of transportation in the greater Municipality area.A full build out of the system by 2020 will be 275 kilometers.Capital and operating costs are presented as estimates and do not represent design based costs at this time.
1.2 objectiveThe technology of Skyweb Express and the feasibility of placing Skyweb Express in the Municipality were the two main objectives of the feasibility study.
The technology of Skyweb Express:The commercial viability of the Taxi 2000 control systemThe commercial viability of the Taxi 2000 hardware technology
2. Feasibility of placing Skyweb Express in the Municipality:The capacity of Skyweb Express to handle the area’s 2020 ridership goals. Financial viability of the Municipality’s Skyweb Express system.
•
•
•
•
••
•
••
1.a.b.
a.b.
Copyright © 2007 Taxi 2000 Corporation Page 9
NTS Feasibility Report Taxi 2000 Corporation
2. RIDERSHIP AnALYSIS
2.1 IntroductionA travel demand forecast model is vital to planning adequate transportation systems for any city. Traffic congestion can be alleviated by constructing more parking lots, highways, bridges, tunnels, and widening existing streets. Or, traffic congestion can be reduced by implementing transportation management strategies that include public transit.
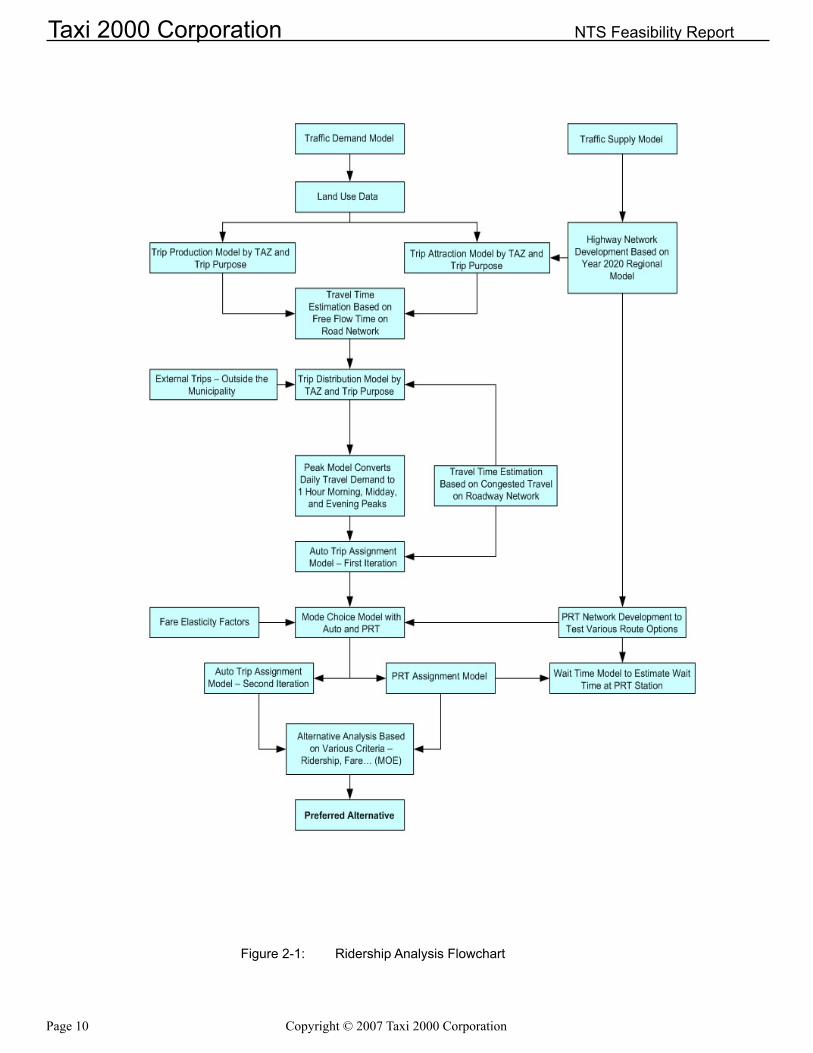
This Ridership Analysis section outlines the process used for the PRT travel demand forecast model. The PRT model is based on the municipal regional transportation model, EMME/2, developed by the Municipality.
The process of forecasting travel demand, including mode of transportation (mode choice), involves the following steps.
Define and organize travel demand into a network of zones. For this feasibility study, the network is the greater Municipality.
Estimate the total number of trips that start or end in the zone, regardless of trip route or type of transportation used.
Estimate the zone-to-zone trip distribution and flow, regardless of route or type of transportation.
Estimate the type (mode) of travel being used.Calculate the available network roads and transit routes including volumes and constraints. Converge on a solution to optimize travel time for each mode of transportation.Estimate the effectiveness, or percentage of ridership, for each mode of transportation
including the sensitivity of ridership to changes in variables such as public transit fares.
1.
2.
3.
4.5.6.7.
Page10 Copyright©2007Taxi2000Corporation
Taxi 2000 Corporation NTS Feasibility Report
Figure2-1: RidershipAnalysisFlowchart
Copyright©2007Taxi2000Corporation Page11
NTS Feasibility Report Taxi 2000 Corporation
2.2 networkThe PRT ridership analysis uses data created by the Municipality for the year 2020. The data is the Municipality’s projections of the city’s future growth and infrastructure requirements. It consists of population residence and job location projections organized into “Traffic Assignment Zones” (TAZ). Each zone is treated as an individual unit in the travel demand analysis. The greater Municipality area is a travel demand network with 981 unique traffic assignment zones.
2.3 Trip Generation ModelThe purpose of the trip generation model is to predict the total number of trips that originate or end in each traffic assignment zone, regardless of the transportation mode (auto or PRT) used, or the route taken. The trip generation model predicts demand for three peak hours; AM, mid-day, and PM. The majority of daily work trips occur during morning or evening peaks.
The trip generation model factors in trip purpose using rates extracted from a Municipality household survey. Trip purposes include work, school, and various other purposes. The trip production input variables used for calculating trip generation in the Municipality model are a function of the total population. These variables are estimated using the Municipality baseline survey data and then extrapolated to the year 2020.
2.4 Trip Distribution ModelTrip distribution models use the trip generation output (number of trips starting or ending in each zone) to estimate the zone of origin or destination for every generated trip that originates or ends in a particular zone. The models estimate where trips start, where they end, and how they flow. The Municipality model assumes trips are a function of the zone of origin and the accessibility of the destination zone.
The Municipality model estimates the trip time and purpose between origin and destination zones to create a trip distribution matrix.
2.5 Mode Choice ModelThe objective of a mode choice model is to define the share of passengers for different modes of transportation. The current Municipality regional transportation model lacks a reliable mode choice model. The Municipality is aware of this and recently drafted a request for proposals to add a reliable mode choice to their regional transportation model.
The Municipality’s public transit share for the year 2020 is an estimate based on a simplified approach that allocates fixed shares of public transit to different areas. The primary drawback to the current fixed share model is it does not reflect certain mode attributes. The mode choice model reflects additional important variables such as travel time, cost, and demographics. This makes the mode choice model more accurate.
Page12 Copyright©2007Taxi2000Corporation
Taxi 2000 Corporation NTS Feasibility Report
This feasibility study applied a similar choice model developed in a 1999 Stated Preference Survey and is justified for the following reasons:
The transit dependent population has the same characteristics regardless of distance from home to work or school.The mode choice survey was based on Stated Preference (SP) versus Revealed Preference (RP). Travel behaviors and characteristics are very similar and consistent from place to place. Sensitivity analysis was used throughout the process to account for any possible margin of error that may exist.The share of public transit was approximately the same as the current share in the Municipality.
The mode choice model added to the regional model factors in auto travel time, parking cost, walk time to a PRT station, waiting time for PRT at a station, PRT journey time, and bus fare. Based on the weighted variables, utilization of both auto and PRT can be estimated along with the probability of use.
2.6 TrafficAssignmentTraffic assignment allocates trips to different routes to estimate auto or transit volume. Traffic assignments within the mode choice models are based on an equilibrium algorithm that converges to a solution where no travelers can improve their travel times by shifting routes. Auto trips are assigned to their corresponding network of roads. Volume delay functions from the Municipality model replicate traffic flow and congestion constraints. PRT trips are assigned to their corresponding network of elevated guideways. For PRT, operating speed is constant because there are no flow or congestion constraints. Average walking time to a PRT station is included.
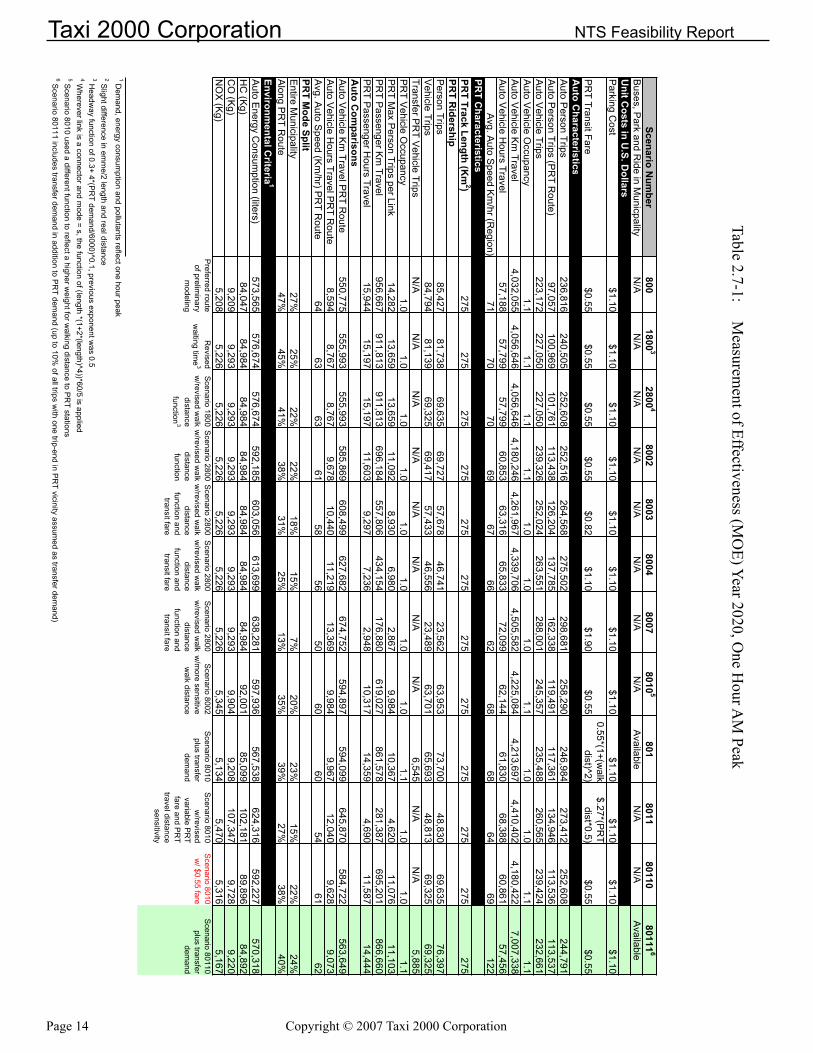
2.7 Measurements of Effectiveness (MoE)The PRT and auto travel demand mode choice model is sensitive to PRT alignment (the route). The model evaluates various alternative alignment options to converge on an optimized route that maximizes PRT ridership while minimizing cost. Defining different options followed a systematic approach by first defining hypothetical PRT routes everywhere in the municipal region with unlimited PRT vehicle availability. This exercise defined the potential ridership across the region without any other constraints. Based on those results, high ridership locations were pinpointed and routes were developed accordingly.
A series of Measurement of Effectiveness (MOE) scenarios were developed to simulate autos and PRT performance on the overall transportation system. The impact of various route options on energy consumption and pollutants were studied and the corresponding MOEs reported. The results lead to a preferred alignment (route) location.
Once a route was selected, further refinement to the demand model assured the reliability of previous results and tested the elasticity of demand as a function of transit fare changes. The effect of transfers from planned bus feeders in the Municipality was included. Among the model variables refined in this step was a more robust function for waiting time, a weighting factor for traveler walking distance, and fare options including a flat fare system and a distanced based PRT fare. Table 2.7-1 presents Measurement of Effectiveness (MOE) for various alternatives.
•
•
••
•
Copyright©2007Taxi2000Corporation Page1�
NTS Feasibility Report Taxi 2000 Corporation
Scenario number 80111 is the final result presenting the preferred ridership option based on maximizing ridership at a fee similar to other transit options. (See section 2.8 for a discussion of how the fee structure impacts ridership choice.) The following features are characteristics of scenario 80111:
275 Km PRT track length $.55 PRT fare 24% PRT mode choice for the entire region
Scenario number 8004 is the final result presenting the preferred revenue option based on maximizing revenue with a fee of double the normal transit fee. (See section 2.8 for a discussion of how the fee structure impacts ridership choice.) The following are characteristics of scenario 8004:
275 Km PRT track length$1.10 PRT fare15% PRT mode choice for the entire region
As shown in table 2.7-1, PRT vehicle occupancy follows auto occupancy trends – over 90% of trips have vehicle occupancy of 1 person. The occupancy level is extracted from the Municipality’s regional model which applied an occupancy function dependent upon distance. The auto oriented system they have, along with the lack of any Transportation Demand Management (TDM) strategies, has resulted in Municipality traffic consisting of primarily solo drivers.
Peak times are the main target for any network planning. The roads at peak hours in the Municipality, like many other regions, are predominately congested by commuters. There are few shopping or other non-work related trips during peak hours. In particular, work trips are even more inclined to have low vehicle occupancy. Various studies show most transit dependent trips are regular work trips. Shoppers may have higher vehicle occupancy, but are usually hesitant to use public transit due to multiple destinations and the inconvenience associated with carrying shopping bags when using public transit.
•••
•••
Page1� Copyright©2007Taxi2000Corporation
Taxi 2000 Corporation NTS Feasibility Report
Table 2.7-1: M
easurement of Effectiveness (M
OE) Year 2020, O
ne Hour A
M Peak
Scenario num
ber800
18003
28004
80028003
80048007
80105
8018011
8011080111
6
Buses, P
ark and Ride in M
unicpalityN/A
N/A
N/A
N/A
N/A
N/A
N/A
N/A
Available
N/A
N/A
Available
Unit C
osts in U.S. D
ollarsP
arking Cost
$1.10 $1.10
$1.10 $1.10
$1.10 $1.10
$1.10 $1.10
$1.10 $1.10
$1.10 $1.10
PR
T Transit Fare$0.55
$0.55$0.55
$0.55$0.82
$1.10$1.90
$0.550.55*(1+(w
alkdist)^2)
$.27*(PRT
dist*0.5)$0.55
$0.55 A
uto Characteristics
AutoP
ersonTrips236,816
240,505252,608
252,516264,568
275,502298,681
258,290246,984
273,412252,608
244,791AutoP
ersonTrips(PRTR
oute)97,057
100,969101,761
113,438126,204
137,785162,338
119,491117,361
134,946113,536
113,537AutoV
ehicleTrips223,172
227,050227,050
239,326252,024
263,551288,001
245,357235,488
260,565239,424
232,661AutoV
ehicleOccupancy
1.11.1
1.11.1
1.01.0
1.01.1
1.01.0
1.11.1
AutoV
ehicleKmTravel
4,032,055 4,056,646 4,056,646
4,180,246 4,261,967
4,339,706 4,505,582 4,225,084 4,213,697
4,410,402 4,180,422
7,007,338 AutoV
ehicleHoursTravel
57,18857,799
57,79960,853
63,31665,833
72,09962,144
61,83068,388
60,86157,456
Avg.A
utoSpeedK
m/hr(R
egion)71
7070
6967
6662
6868
6469
122PR
T Characteristics
PRT Track Length (K
m2)
275275
275275
275275
275275
275275
275275
PRT R
idershipP
erson Trips85,427
81,73869,635
69,72757,678
46,74123,562
63,95373,700
48,83069,635
76,397V
ehicle Trips84,794
81,13969,325
69,41757,433
46,55623,489
63,70165,693
48,81369,325
69,325Transfer P
RT V
ehicle TripsN/A
N/A
N/A
N/A
N/A
N/A
N/A
N/A
6,545N/A
N/A
5,885P
RT V
ehicle Occupancy
1.01.0
1.01.0
1.01.0
1.01.0
1.11.0
1.01.1
PR
T Max P
erson Trips per Link14,282
13,65913,659
11,0928,930
6,9802,867
9,98410,367
4,62011,076
11,103PRTP
assengerKmTravel
956,667911,813
911,813696,184
557,806434,154
176,880619,027
861,578281,387
695,201866,660
PRTP
assengerHoursTravel
15,94415,197
15,19711,603
9,2977,236
2,94810,317
14,3594,690
11,58714,444
Auto C
omparisons
AutoV
ehicleKmTravelP
RTR
oute550,775
555,993555,993
585,869608,499
627,682674,752
594,897594,099
645,870584,722
563,649AutoV
ehicleHoursTravelP
RTR
oute8,594
8,7678,767
9,67810,440
11,21913,369
9,9849,967
12,0409,628
9,073Avg.A
utoSpeed(K
m/hr)P
RTR
oute64
6363
6158
5650
6060
5461
62PR
T Mode Split
EntireM
unicipality27%
25%22%
22%18%
15%7%
20%23%
15%22%
24%AlongP
RTR
oute47%
45%41%
38%31%
25%13%
35%39%
27%38%
40%Environm
ental Criteria
1
AutoE
nergyConsum
ption(liters)573,565
576,674576,674
592,185603,056
613,699638,281
597,936567,538
624,316592,227
570,318HC(K
g)84,047
84,98484,984
84,98484,984
84,98484,984
92,00185,099
102,18189,896
84,892CO(K
g)9,209
9,2939,293
9,2939,293
9,2939,293
9,9049,208
107,3479,728
9,220NOX(K
g)5,208
5,2265,226
5,2265,226
5,2265,226
5,3455,134
5,4705,316
5,167P
referred route ofprelim
inarymodeling
Revised
waitingtim
e3
Scenario 1800
w/revised w
alk distancefunction
3
Scenario 2800
w/revised w
alk distancefunction
Scenario 2800
w/revised w
alk distance
function and transit fare
Scenario 2800
w/revised w
alk distance
function and transit fare
Scenario 2800
w/revised w
alk distance
function and transit fare
Scenario 8002
w/moresensitive
walk distance
Scenario 8010 plus transfer
demand
Scenario 8010
w/revised
variable PR
T fare and P
RT
travel distance sensitivity
Scenario 8010 w
/ $0.55 fareS
cenario 80110 plus transfer
demand
1Dem
and,energyconsumptionandpollutantsreflectonehourpeak
2Slightdifferenceinem
me/2lengthandrealdistance
3Headw
ayfunctionof0.3+4*(PRTdem
and/6000)^0.1,previousexponentwas0.5
4Whereverlinkisaconnectorandm
ode=s,thefunctionof(length*(1+2*(length)^4))*60/5isapplied5 S
cenario 8010 used a different function to reflect a higher weight for w
alking distance to PR
T stations6S
cenario80111includestransferdemandinadditiontoP
RTdem
and(upto10%ofalltripsw
ithonetrip-endinPRTvicinityassum
edastransferdemand)
Copyright©2007Taxi2000Corporation Page1�
NTS Feasibility Report Taxi 2000 Corporation
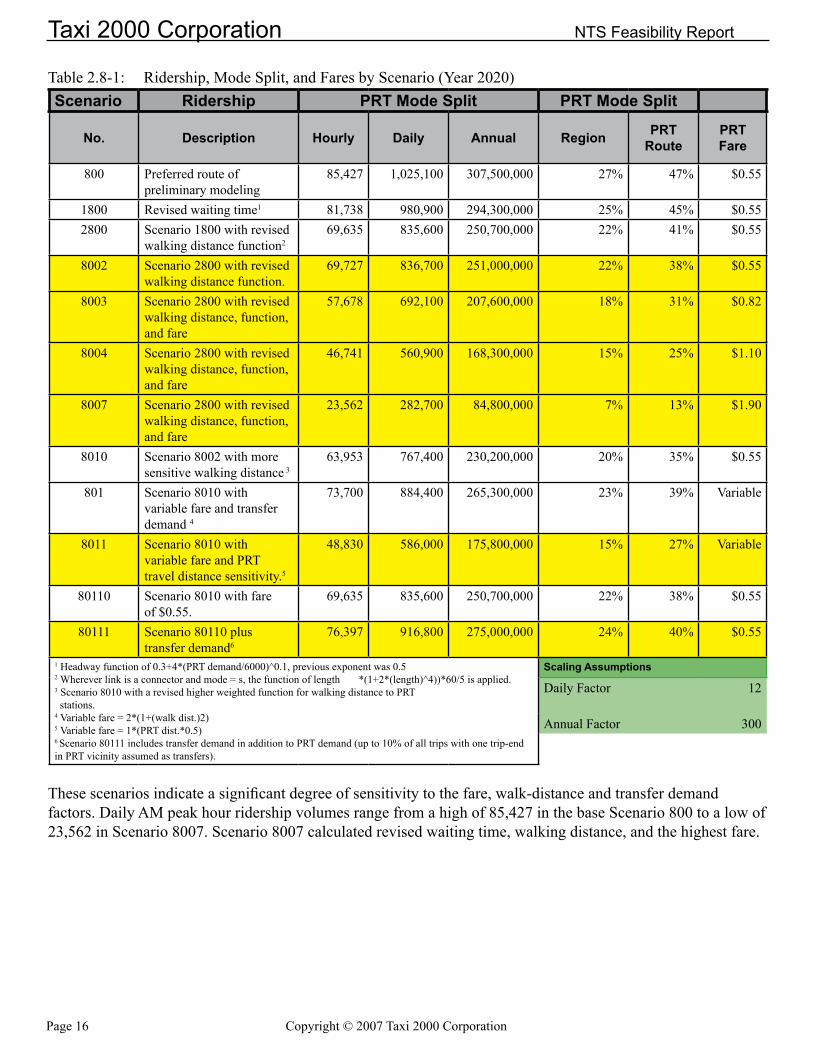
2.8 Ridership Fee AnalysisThis PRT fee and revenue analysis is based on ridership estimates as outlined in the Municipality’s PRT travel demand forecasts. Specifically, the forecasts provide AM peak hour ridership volumes in year 2020 given various assumptions such as trip origin/destination, walking distance to/from PRT stations, parking charges and PRT fares. These variables provide a means to understand ridership sensitivity to individual factors as well as several combined factors. The AM peak hour ridership forecasts are scaled to total daily and annual volumes based on previous surveys in the region, documented flows in the U.S., and Wilbur Smith Associates’ professional experience. The daily ridership volumes and their associated fares are used to forecast daily revenues, which are then annualized for the various scenarios of the preferred alternative (i.e. the 800 series scenarios in Table 2.7-1).
The Municipality travel demand model evaluates morning peak hour flows between 7:30-8:30 AM. Scaling the AM peak hour PRT person trips to daily and annual volumes is an essential component of the revenue forecasts. These AM peak hour ridership volumes, along with PRT Mode Split and fares for the 12 scenarios under the 800 series are summarized in table 2.8-1.
Page 16 Copyright©2007Taxi2000Corporation
Taxi 2000 Corporation NTS Feasibility Report
Table 2.8-1: Ridership, Mode Split, and Fares by Scenario (Year 2020)Scenario Ridership PRT Mode Split PRT Mode Split
no. Description Hourly Daily Annual Region PRT Route
PRT Fare
800 Preferred route of preliminary modeling
85,427 1,025,100 307,500,000 27% 47% $0.55
1800 Revised waiting time1 81,738 980,900 294,300,000 25% 45% $0.552800 Scenario 1800 with revised
walking distance function269,635 835,600 250,700,000 22% 41% $0.55
8002 Scenario 2800 with revised walking distance function.
69,727 836,700 251,000,000 22% 38% $0.55
8003 Scenario 2800 with revised walking distance, function, and fare
57,678 692,100 207,600,000 18% 31% $0.82
8004 Scenario 2800 with revised walking distance, function, and fare
46,741 560,900 168,300,000 15% 25% $1.10
8007 Scenario 2800 with revised walking distance, function, and fare
23,562 282,700 84,800,000 7% 13% $1.90
8010 Scenario 8002 with more sensitive walking distance�
63,953 767,400 230,200,000 20% 35% $0.55
801 Scenario 8010 with variable fare and transfer demand �
73,700 884,400 265,300,000 23% 39% Variable
8011 Scenario 8010 with variable fare and PRT travel distance sensitivity.�
48,830 586,000 175,800,000 15% 27% Variable
80110 Scenario 8010 with fare of $0.55.
69,635 835,600 250,700,000 22% 38% $0.55
80111 Scenario 80110 plus transfer demand6
76,397 916,800 275,000,000 24% 40% $0.55
1 Headway function of 0.3+4*(PRT demand/6000)^0.1, previous exponent was 0.52 Wherever link is a connector and mode = s, the function of length *(1+2*(length)^4))*60/5 is applied.� Scenario 8010 with a revised higher weighted function for walking distance to PRT stations.� Variable fare = 2*(1+(walk dist.)2)� Variable fare = 1*(PRT dist.*0.5)6 Scenario 80111 includes transfer demand in addition to PRT demand (up to 10% of all trips with one trip-end in PRT vicinity assumed as transfers).
Scaling Assumptions
Daily Factor 12
Annual Factor �00
These scenarios indicate a significant degree of sensitivity to the fare, walk-distance and transfer demand factors. Daily AM peak hour ridership volumes range from a high of 85,427 in the base Scenario 800 to a low of 23,562 in Scenario 8007. Scenario 8007 calculated revised waiting time, walking distance, and the highest fare.
Copyright©2007Taxi2000Corporation Page17
NTS Feasibility Report Taxi 2000 Corporation
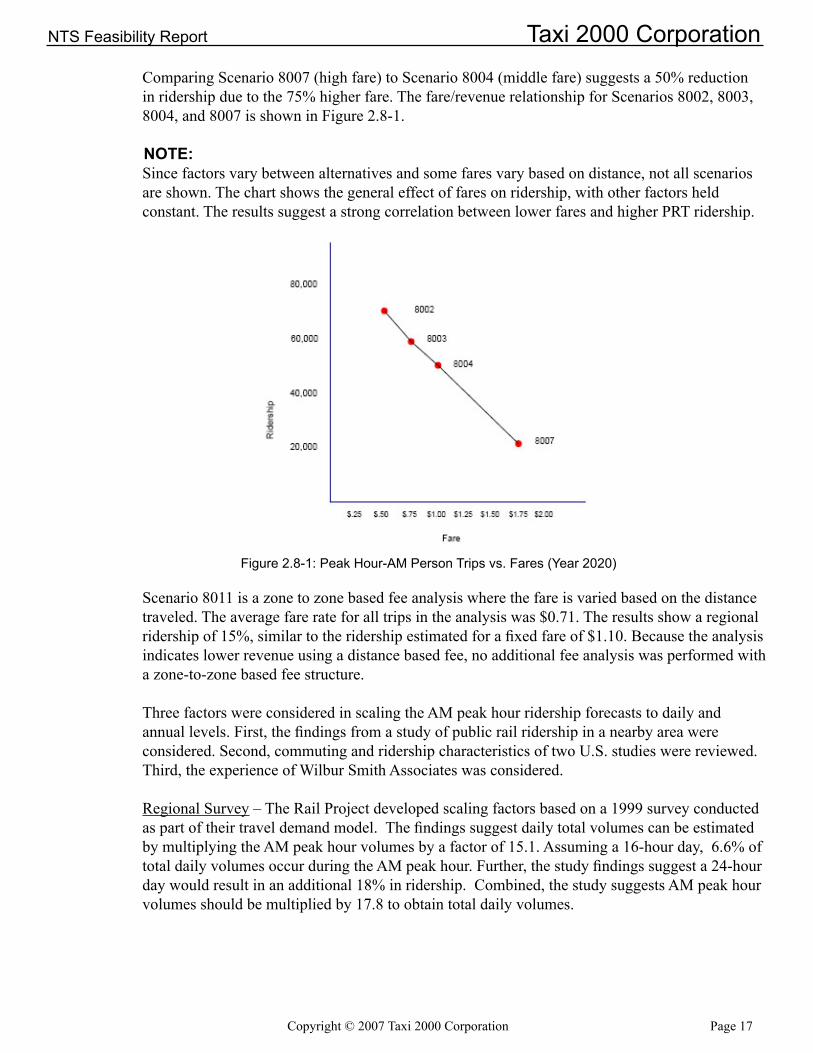
Comparing Scenario 8007 (high fare) to Scenario 8004 (middle fare) suggests a 50% reduction in ridership due to the 75% higher fare. The fare/revenue relationship for Scenarios 8002, 8003, 8004, and 8007 is shown in Figure 2.8-1.
noTE:Since factors vary between alternatives and some fares vary based on distance, not all scenarios are shown. The chart shows the general effect of fares on ridership, with other factors held constant. The results suggest a strong correlation between lower fares and higher PRT ridership.
Figure2.8-1:PeakHour-AMPersonTripsvs.Fares(Year2020)
Scenario 8011 is a zone to zone based fee analysis where the fare is varied based on the distance traveled. The average fare rate for all trips in the analysis was $0.71. The results show a regional ridership of 15%, similar to the ridership estimated for a fixed fare of $1.10. Because the analysis indicates lower revenue using a distance based fee, no additional fee analysis was performed with a zone-to-zone based fee structure.
Three factors were considered in scaling the AM peak hour ridership forecasts to daily and annual levels. First, the findings from a study of public rail ridership in a nearby area were considered. Second, commuting and ridership characteristics of two U.S. studies were reviewed. Third, the experience of Wilbur Smith Associates was considered.
Regional Survey – The Rail Project developed scaling factors based on a 1999 survey conducted as part of their travel demand model. The findings suggest daily total volumes can be estimated by multiplying the AM peak hour volumes by a factor of 15.1. Assuming a 16-hour day, 6.6% of total daily volumes occur during the AM peak hour. Further, the study findings suggest a 24-hour day would result in an additional 18% in ridership. Combined, the study suggests AM peak hour volumes should be multiplied by 17.8 to obtain total daily volumes.
Page 18 Copyright©2007Taxi2000Corporation
Taxi 2000 Corporation NTS Feasibility Report
U.S. NPTS – The National Personal Transportation Surveys (NPTS) conducted in the U.S. for the years 1990 and 1995 suggest a different relationship between AM peak hour and total daily ridership levels. Review of U.S. AM peak hour factors indicates a greater share of passenger traffic occurs during the AM peak hour than assumed in the above project analysis. (This results in a lower daily-hour factor than the 15.1 or 17.8 suggested in the study). The 1990 NPTS survey estimates as much as 15% of total daily commuter traffic occurs during the AM peak hour . However, the 1995 NPTS combines the 6:00-9:00 travel times and includes non-commuter trips. Based on these more recent and inclusive 1995 data, an alternative factor of 7.9% is assumed to reflect the share of total daily trips in the U.S. that occur during the AM peak hour.
Wilbur Smith Associates – A “10% rule” is often used to understand the relationship of AM peak hour commuter trips to total daily volume. This suggests a factor of 10 should be applied to the AM peak hour forecasts to estimate total daily commuting ridership. However, this excludes other non-commuting trips. Each individual study of traffic commute patterns suggests variances between the AM peak hour and total daily traffic factor due to infrastructure, socioeconomic, geographical and other factors.
For this study, a daily-hour factor of 12 and an annual-daily factor of 300 is assumed for the revenue analysis based on previous modeling experience, review of the project study findings and the NPTS, as well as consideration of the specific characteristics of the Municipality environs. The results, as previously presented in Exhibit 1, suggest annual ridership varies from a low of 84.8 million (Scenario 8007) to a high of 307.5 million (Scenario 800).
noTE: The sensitivity analysis in section 3 addresses an optimistic and pessimistic scenario in which the two key assumptions are adjusted, in part, on the factors observed in review of the surveys.
The daily and annual revenue estimates for the 12 scenarios are presented below for the year 2020, and are compared between alternatives.
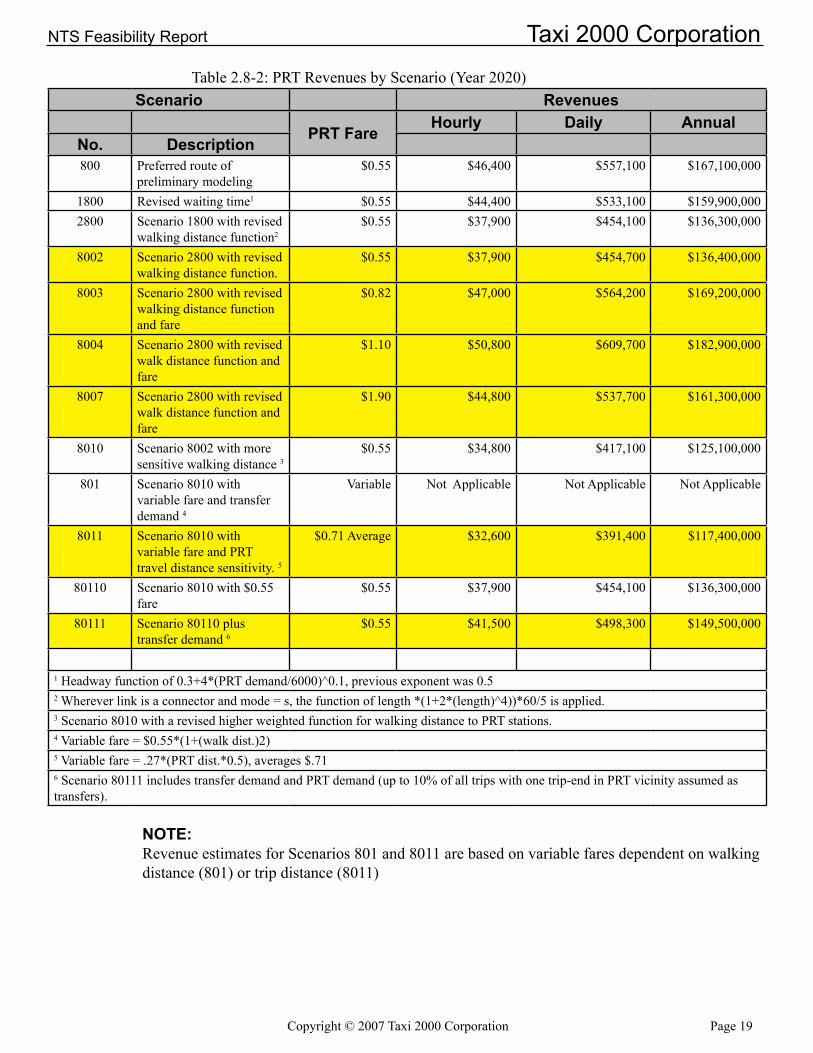
Daily Revenues – The revenue estimates for the 12 scenarios of table 2-1 are based on the fares assumed for each scenario, and are annualized assuming a 300-day year. The average daily and annual revenue estimates for each scenario are presented in table 2.8-2. Daily revenues range from a low of $400,000 in Scenario 8011, to a high of $600,000 in Scenario 8004.
noTE:
The daily revenue variance between the high and low scenarios is considerably smaller (46%) than the high and low ridership variance (263%). This smaller revenue variance reflects the trade-off between higher fares and ridership.
noTE:Revenue estimates are not available for Scenario 801 because of the way the calculation was performed. Varying walking distance within each traffic analysis zone inhibits accurate revenue calculations.
Copyright © 2007 Taxi 2000 Corporation Page 19
NTS Feasibility Report Taxi 2000 Corporation
Table 2.8-2: PRT Revenues by Scenario (Year 2020) Scenario Revenues
PRT FareHourly Daily Annual
no. Description800 Preferred route of
preliminary modeling $0.55 $46,400 $557,100 $167,100,000
1800 Revised waiting time1 $0.55 $44,400 $533,100 $159,900,0002800 Scenario 1800 with revised
walking distance function2$0.55 $37,900 $454,100 $136,300,000
8002 Scenario 2800 with revised walking distance function.
$0.55 $37,900 $454,700 $136,400,000
8003 Scenario 2800 with revised walking distance function and fare
$0.82 $47,000 $564,200 $169,200,000
8004 Scenario 2800 with revised walk distance function and fare
$1.10 $50,800 $609,700 $182,900,000
8007 Scenario 2800 with revised walk distance function and fare
$1.90 $44,800 $537,700 $161,300,000
8010 Scenario 8002 with more sensitive walking distance �
$0.55 $34,800 $417,100 $125,100,000
801 Scenario 8010 with variable fare and transfer demand �
Variable Not Applicable Not Applicable Not Applicable
8011 Scenario 8010 with variable fare and PRT travel distance sensitivity. �
$0.71 Average $32,600 $391,400 $117,400,000
80110 Scenario 8010 with $0.55 fare
$0.55 $37,900 $454,100 $136,300,000
80111 Scenario 80110 plus transfer demand 6
$0.55 $41,500 $498,300 $149,500,000
1 Headway function of 0.3+4*(PRT demand/6000)^0.1, previous exponent was 0.52 Wherever link is a connector and mode = s, the function of length *(1+2*(length)^4))*60/5 is applied.� Scenario 8010 with a revised higher weighted function for walking distance to PRT stations.� Variable fare = $0.55*(1+(walk dist.)2)� Variable fare = .27*(PRT dist.*0.5), averages $.716 Scenario 80111 includes transfer demand and PRT demand (up to 10% of all trips with one trip-end in PRT vicinity assumed as transfers).
noTE:Revenue estimates for Scenarios 801 and 8011 are based on variable fares dependent on walking distance (801) or trip distance (8011)
Page20 Copyright©2007Taxi2000Corporation
Taxi 2000 Corporation NTS Feasibility Report
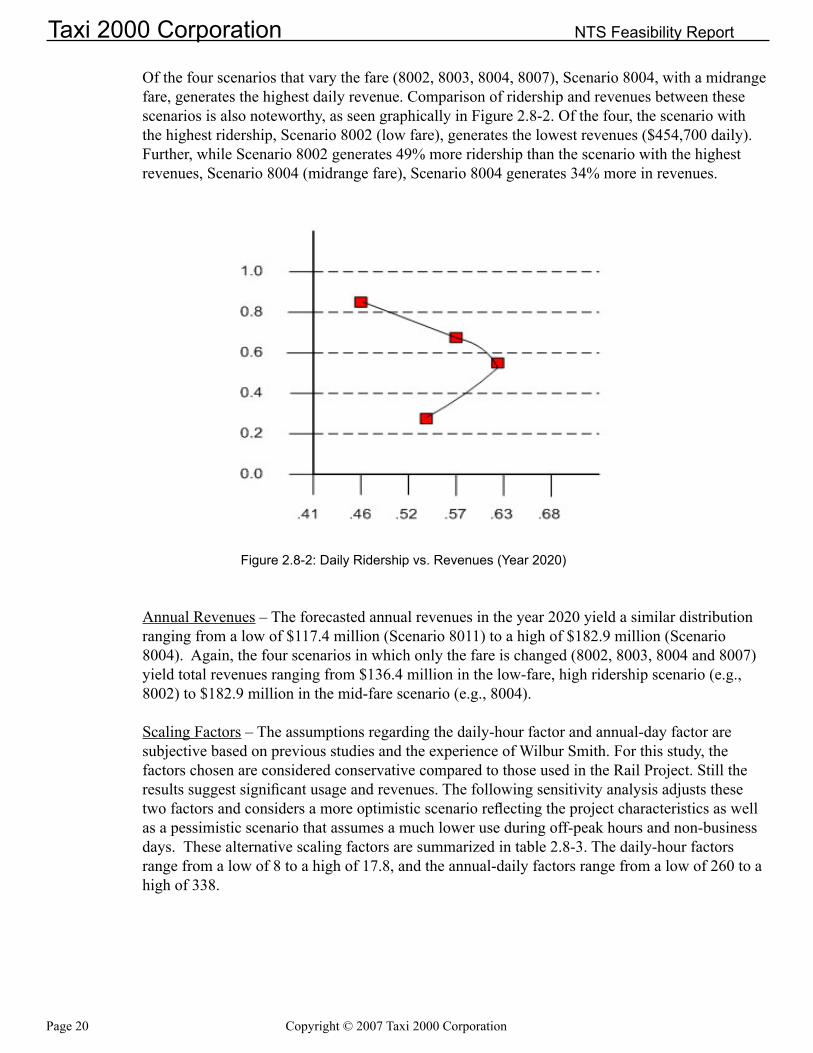
Of the four scenarios that vary the fare (8002, 8003, 8004, 8007), Scenario 8004, with a midrange fare, generates the highest daily revenue. Comparison of ridership and revenues between these scenarios is also noteworthy, as seen graphically in Figure 2.8-2. Of the four, the scenario with the highest ridership, Scenario 8002 (low fare), generates the lowest revenues ($454,700 daily). Further, while Scenario 8002 generates 49% more ridership than the scenario with the highest revenues, Scenario 8004 (midrange fare), Scenario 8004 generates 34% more in revenues.
Figure2.8-2:DailyRidershipvs.Revenues(Year2020)
Annual Revenues – The forecasted annual revenues in the year 2020 yield a similar distribution ranging from a low of $117.4 million (Scenario 8011) to a high of $182.9 million (Scenario 8004). Again, the four scenarios in which only the fare is changed (8002, 8003, 8004 and 8007) yield total revenues ranging from $136.4 million in the low-fare, high ridership scenario (e.g., 8002) to $182.9 million in the mid-fare scenario (e.g., 8004).
Scaling Factors – The assumptions regarding the daily-hour factor and annual-day factor are subjective based on previous studies and the experience of Wilbur Smith. For this study, the factors chosen are considered conservative compared to those used in the Rail Project. Still the results suggest significant usage and revenues. The following sensitivity analysis adjusts these two factors and considers a more optimistic scenario reflecting the project characteristics as well as a pessimistic scenario that assumes a much lower use during off-peak hours and non-business days. These alternative scaling factors are summarized in table 2.8-3. The daily-hour factors range from a low of 8 to a high of 17.8, and the annual-daily factors range from a low of 260 to a high of 338.
Copyright©2007Taxi2000Corporation Page21
NTS Feasibility Report Taxi 2000 Corporation
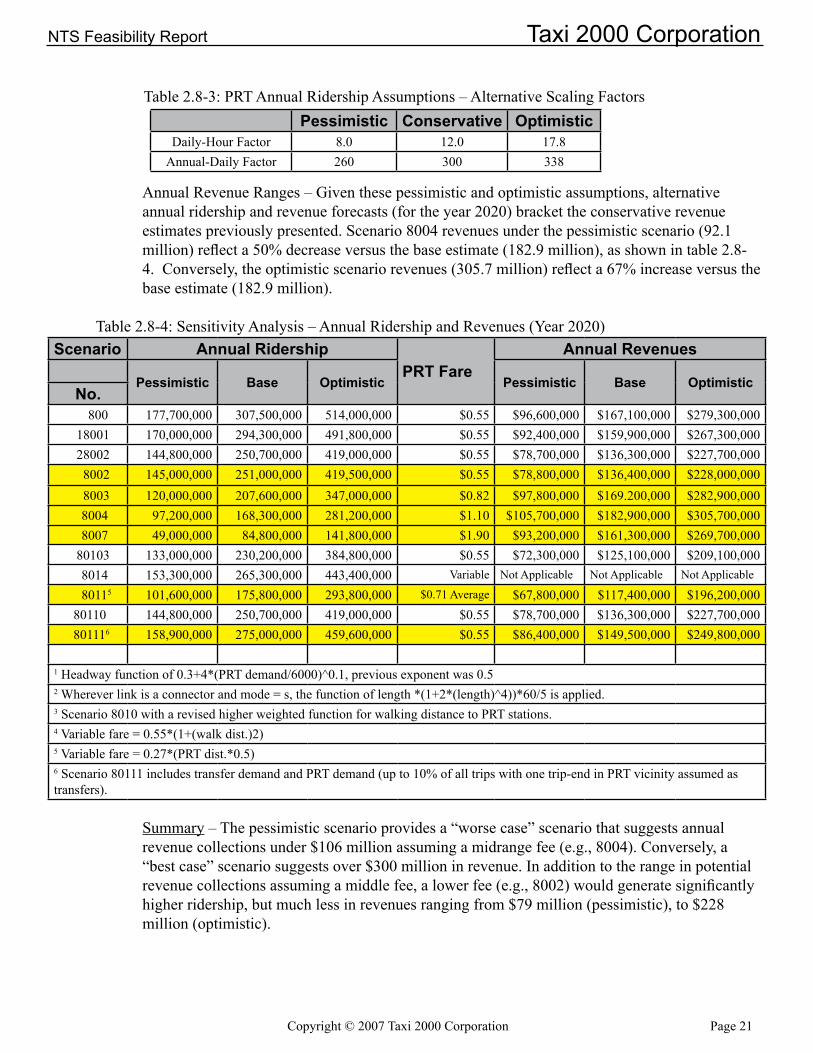
Table 2.8-3: PRT Annual Ridership Assumptions – Alternative Scaling Factors
Annual Revenue Ranges – Given these pessimistic and optimistic assumptions, alternative annual ridership and revenue forecasts (for the year 2020) bracket the conservative revenue estimates previously presented. Scenario 8004 revenues under the pessimistic scenario (92.1 million) reflect a 50% decrease versus the base estimate (182.9 million), as shown in table 2.8-4. Conversely, the optimistic scenario revenues (305.7 million) reflect a 67% increase versus the base estimate (182.9 million).
Table 2.8-4: Sensitivity Analysis – Annual Ridership and Revenues (Year 2020)Scenario Annual Ridership
PRT FareAnnual Revenues
Pessimistic Base optimistic Pessimistic Base optimisticno.
800 177,700,000 307,500,000 514,000,000 $0.55 $96,600,000 $167,100,000 $279,300,000 18001 170,000,000 294,300,000 491,800,000 $0.55 $92,400,000 $159,900,000 $267,300,000 28002 144,800,000 250,700,000 419,000,000 $0.55 $78,700,000 $136,300,000 $227,700,000 8002 145,000,000 251,000,000 419,500,000 $0.55 $78,800,000 $136,400,000 $228,000,000 8003 120,000,000 207,600,000 347,000,000 $0.82 $97,800,000 $169.200,000 $282,900,000 8004 97,200,000 168,300,000 281,200,000 $1.10 $105,700,000 $182,900,000 $305,700,000 8007 49,000,000 84,800,000 141,800,000 $1.90 $93,200,000 $161,300,000 $269,700,000 80103 133,000,000 230,200,000 384,800,000 $0.55 $72,300,000 $125,100,000 $209,100,000 8014 153,300,000 265,300,000 443,400,000 Variable Not Applicable Not Applicable Not Applicable
8011� 101,600,000 175,800,000 293,800,000 $0.71 Average $67,800,000 $117,400,000 $196,200,000 80110 144,800,000 250,700,000 419,000,000 $0.55 $78,700,000 $136,300,000 $227,700,000
801116 158,900,000 275,000,000 459,600,000 $0.55 $86,400,000 $149,500,000 $249,800,000 1 Headway function of 0.3+4*(PRT demand/6000)^0.1, previous exponent was 0.52 Wherever link is a connector and mode = s, the function of length *(1+2*(length)^4))*60/5 is applied.� Scenario 8010 with a revised higher weighted function for walking distance to PRT stations.� Variable fare = 0.55*(1+(walk dist.)2)� Variable fare = 0.27*(PRT dist.*0.5)6 Scenario 80111 includes transfer demand and PRT demand (up to 10% of all trips with one trip-end in PRT vicinity assumed as transfers).
Summary – The pessimistic scenario provides a “worse case” scenario that suggests annual revenue collections under $106 million assuming a midrange fee (e.g., 8004). Conversely, a “best case” scenario suggests over $300 million in revenue. In addition to the range in potential revenue collections assuming a middle fee, a lower fee (e.g., 8002) would generate significantly higher ridership, but much less in revenues ranging from $79 million (pessimistic), to $228 million (optimistic).
Pessimistic Conservative optimisticDaily-Hour Factor 8.0 12.0 17.8
Annual-Daily Factor 260 �00 338
Page22 Copyright©2007Taxi2000Corporation
Taxi 2000 Corporation NTS Feasibility Report
2.9 Comparison to Existing Transportation SystemsThe Municipality currently has no public transit system in place for direct comparison to Skyweb Express. Transportation within the greater downtown area is either by private auto or by taxi.
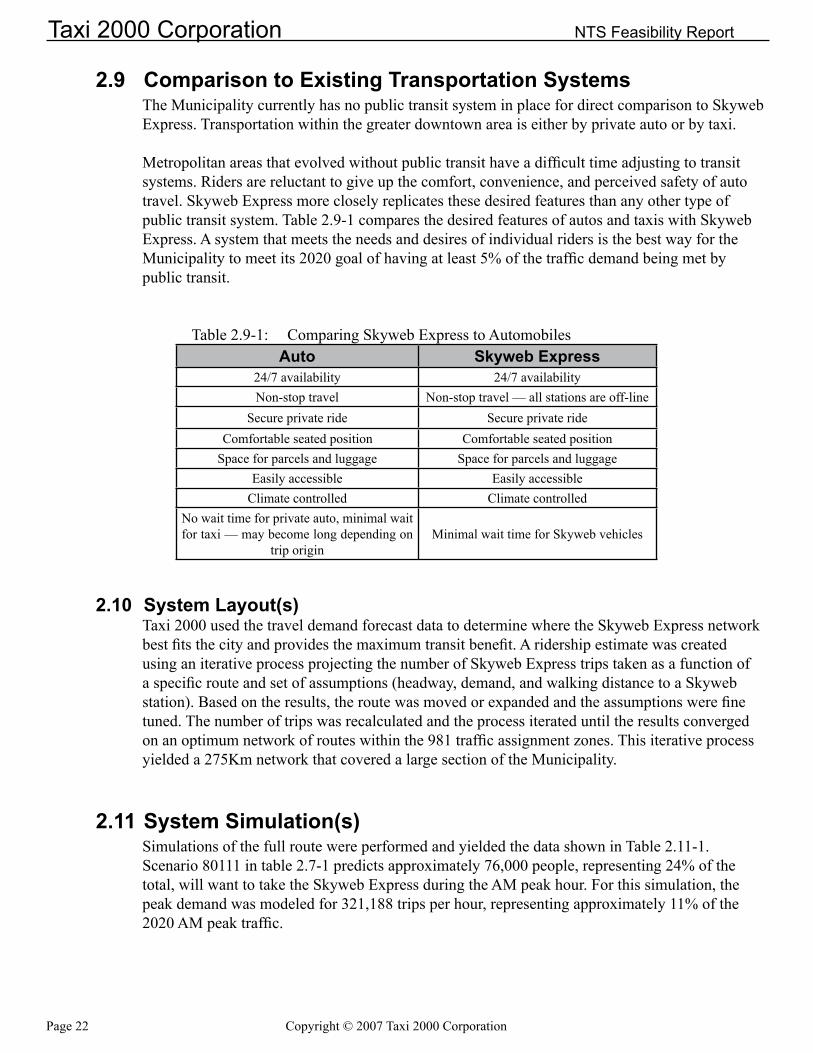
Metropolitan areas that evolved without public transit have a difficult time adjusting to transit systems. Riders are reluctant to give up the comfort, convenience, and perceived safety of auto travel. Skyweb Express more closely replicates these desired features than any other type of public transit system. Table 2.9-1 compares the desired features of autos and taxis with Skyweb Express. A system that meets the needs and desires of individual riders is the best way for the Municipality to meet its 2020 goal of having at least 5% of the traffic demand being met by public transit.
Table 2.9-1: Comparing Skyweb Express to Automobiles
2.10 System Layout(s)
Taxi 2000 used the travel demand forecast data to determine where the Skyweb Express network best fits the city and provides the maximum transit benefit. A ridership estimate was created using an iterative process projecting the number of Skyweb Express trips taken as a function of a specific route and set of assumptions (headway, demand, and walking distance to a Skyweb station). Based on the results, the route was moved or expanded and the assumptions were fine tuned. The number of trips was recalculated and the process iterated until the results converged on an optimum network of routes within the 981 traffic assignment zones. This iterative process yielded a 275Km network that covered a large section of the Municipality.
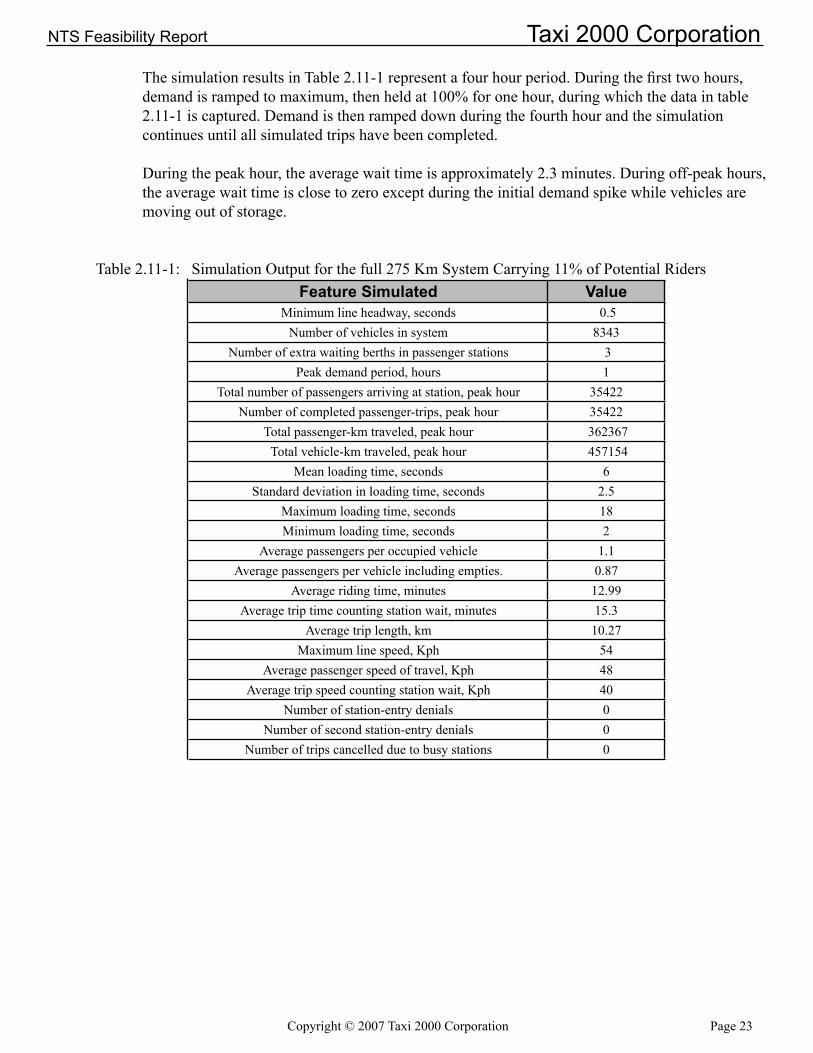
2.11 System Simulation(s)Simulations of the full route were performed and yielded the data shown in Table 2.11-1. Scenario 80111 in table 2.7-1 predicts approximately 76,000 people, representing 24% of the total, will want to take the Skyweb Express during the AM peak hour. For this simulation, the peak demand was modeled for 321,188 trips per hour, representing approximately 11% of the 2020 AM peak traffic.
Auto Skyweb Express24/7 availability 24/7 availabilityNon-stop travel Non-stop travel — all stations are off-line
Secure private ride Secure private rideComfortable seated position Comfortable seated position
Space for parcels and luggage Space for parcels and luggageEasily accessible Easily accessible
Climate controlled Climate controlledNo wait time for private auto, minimal wait for taxi — may become long depending on
triporiginMinimal wait time for Skyweb vehicles
Copyright©2007Taxi2000Corporation Page2�
NTS Feasibility Report Taxi 2000 Corporation
The simulation results in Table 2.11-1 represent a four hour period. During the first two hours, demand is ramped to maximum, then held at 100% for one hour, during which the data in table 2.11-1 is captured. Demand is then ramped down during the fourth hour and the simulation continues until all simulated trips have been completed.
During the peak hour, the average wait time is approximately 2.3 minutes. During off-peak hours, the average wait time is close to zero except during the initial demand spike while vehicles are moving out of storage.
Table 2.11-1: Simulation Output for the full 275 Km System Carrying 11% of Potential Riders
Feature Simulated ValueMinimum line headway, seconds 0.5
Number of vehicles in system 8343Number of extra waiting berths in passenger stations �
Peak demand period, hours 1Total number of passengers arriving at station, peak hour ���22
Number of completed passenger-trips, peak hour ���22Total passenger-km traveled, peak hour 362367
Total vehicle-km traveled, peak hour ��71��Mean loading time, seconds 6
Standard deviation in loading time, seconds 2.5Maximum loading time, seconds 18Minimum loading time, seconds 2
Average passengers per occupied vehicle 1.1Average passengers per vehicle including empties. 0.87
Average riding time, minutes 12.99Average trip time counting station wait, minutes 15.3
Average trip length, km 10.27Maximum line speed, Kph ��
Average passenger speed of travel, Kph 48Average trip speed counting station wait, Kph �0
Number of station-entry denials 0Number of second station-entry denials 0
Number of trips cancelled due to busy stations 0
Page2� Copyright©2007Taxi2000Corporation
Taxi 2000 Corporation NTS Feasibility Report
3. SKYWEB EXPRESS SYSTEM
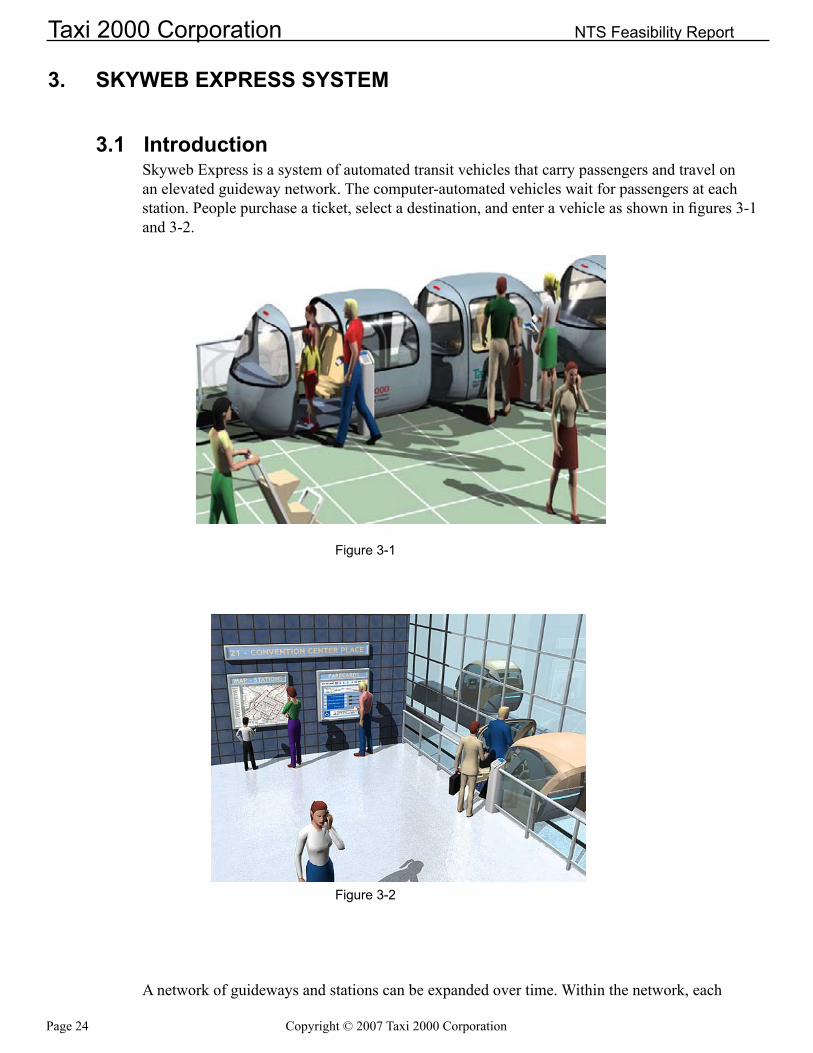
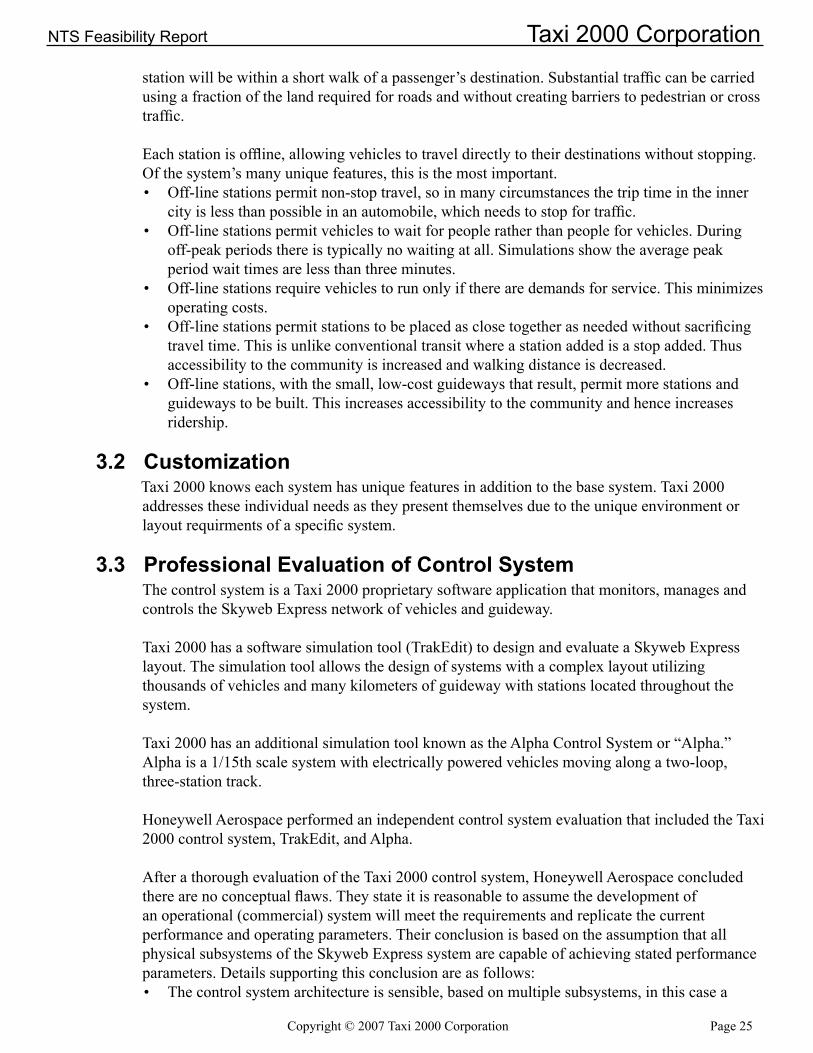
3.1 IntroductionSkyweb Express is a system of automated transit vehicles that carry passengers and travel on an elevated guideway network. The computer-automated vehicles wait for passengers at each station. People purchase a ticket, select a destination, and enter a vehicle as shown in figures 3-1 and 3-2.
Figure 3-1
Figure 3-2
A network of guideways and stations can be expanded over time. Within the network, each
Copyright©2007Taxi2000Corporation Page2�
NTS Feasibility Report Taxi 2000 Corporation
station will be within a short walk of a passenger’s destination. Substantial traffic can be carried using a fraction of the land required for roads and without creating barriers to pedestrian or cross traffic.
Each station is offline, allowing vehicles to travel directly to their destinations without stopping. Of the system’s many unique features, this is the most important.
Off-line stations permit non-stop travel, so in many circumstances the trip time in the inner city is less than possible in an automobile, which needs to stop for traffic. Off-line stations permit vehicles to wait for people rather than people for vehicles. During off-peak periods there is typically no waiting at all. Simulations show the average peak period wait times are less than three minutes. Off-line stations require vehicles to run only if there are demands for service. This minimizes operating costs. Off-line stations permit stations to be placed as close together as needed without sacrificing travel time. This is unlike conventional transit where a station added is a stop added. Thus accessibility to the community is increased and walking distance is decreased. Off-line stations, with the small, low-cost guideways that result, permit more stations and guideways to be built. This increases accessibility to the community and hence increases ridership.
3.2 Customization Taxi 2000 knows each system has unique features in addition to the base system. Taxi 2000 addresses these individual needs as they present themselves due to the unique environment or layout requirments of a specific system.
3.3 Professional Evaluation of Control SystemThe control system is a Taxi 2000 proprietary software application that monitors, manages and controls the Skyweb Express network of vehicles and guideway.
Taxi 2000 has a software simulation tool (TrakEdit) to design and evaluate a Skyweb Express layout. The simulation tool allows the design of systems with a complex layout utilizing thousands of vehicles and many kilometers of guideway with stations located throughout the system.
Taxi 2000 has an additional simulation tool known as the Alpha Control System or “Alpha.” Alpha is a 1/15th scale system with electrically powered vehicles moving along a two-loop, three-station track.
Honeywell Aerospace performed an independent control system evaluation that included the Taxi 2000 control system, TrakEdit, and Alpha.
After a thorough evaluation of the Taxi 2000 control system, Honeywell Aerospace concluded there are no conceptual flaws. They state it is reasonable to assume the development of an operational (commercial) system will meet the requirements and replicate the current performance and operating parameters. Their conclusion is based on the assumption that all physical subsystems of the Skyweb Express system are capable of achieving stated performance parameters. Details supporting this conclusion are as follows:
The control system architecture is sensible, based on multiple subsystems, in this case a
•
•
•
•
•
•
Page 26 Copyright©2007Taxi2000Corporation
Taxi 2000 Corporation NTS Feasibility Report
central controller, and multiple zone, station, and vehicle controllers. Movement commands for the individual vehicles are specified by correct kinematic relationships. Commands to accomplish the maneuvers are flexible enough, at this stage of development, to handle a variety of scenarios. The TrakEdit and Alpha simulations are viable feasibility demonstrations of some aspects of the concept. TrakEdit and Alpha demonstrate, at a very high level, that the control system concept is capable of handling large and fairly complicated traffic networks. The simulations do not reveal any unfixable traffic planning issues that could prohibit scaling to an operational (commercial) system.
Honeywell evaluated the ability of the Skyweb Express control system to maintain a safe headway in an actual system. Honeywell concluded “there are no inherent limitations in the control system architecture or algorithmic complexities that preclude the ability to achieve a headway as low as 0.5 seconds.”
3.4 Ride Comfort ParametersThe basic Skyweb Express System, including the vehicle, guideway and control system, was designed to meet or exceed industry standards for ride comfort which can be subjective to every passenger.
The specific requirements for a Skyweb Express system may necessitate design modifications that could impact ride comfort. The impact of any design change on ride comfort will be evaluated and tested before installing the actual system.
3.5 VehicleThe vehicle consists of a cabin, which runs above the guideway, and a chassis, which runs inside the guideway and supports the cabin. The passengers sit in the cabin. The chassis holds the linear induction motors (LIMs), wheels, and interfaces with guideway power and communications. It is the structural backbone for other necessary electrical and mechanical subassemblies. It has three forward facing seats in a row approximately the width of the back seat of a taxicab. The scope of this study included considering a five passenger vehicle as an alternative for the Municipality.
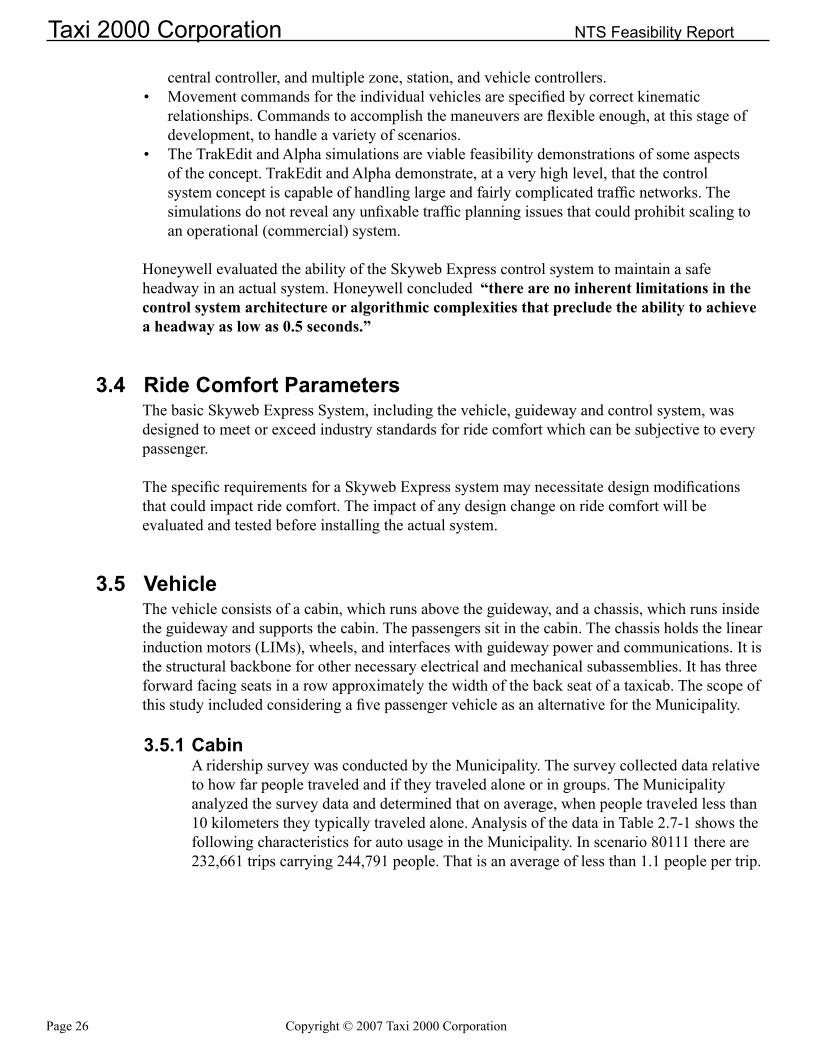
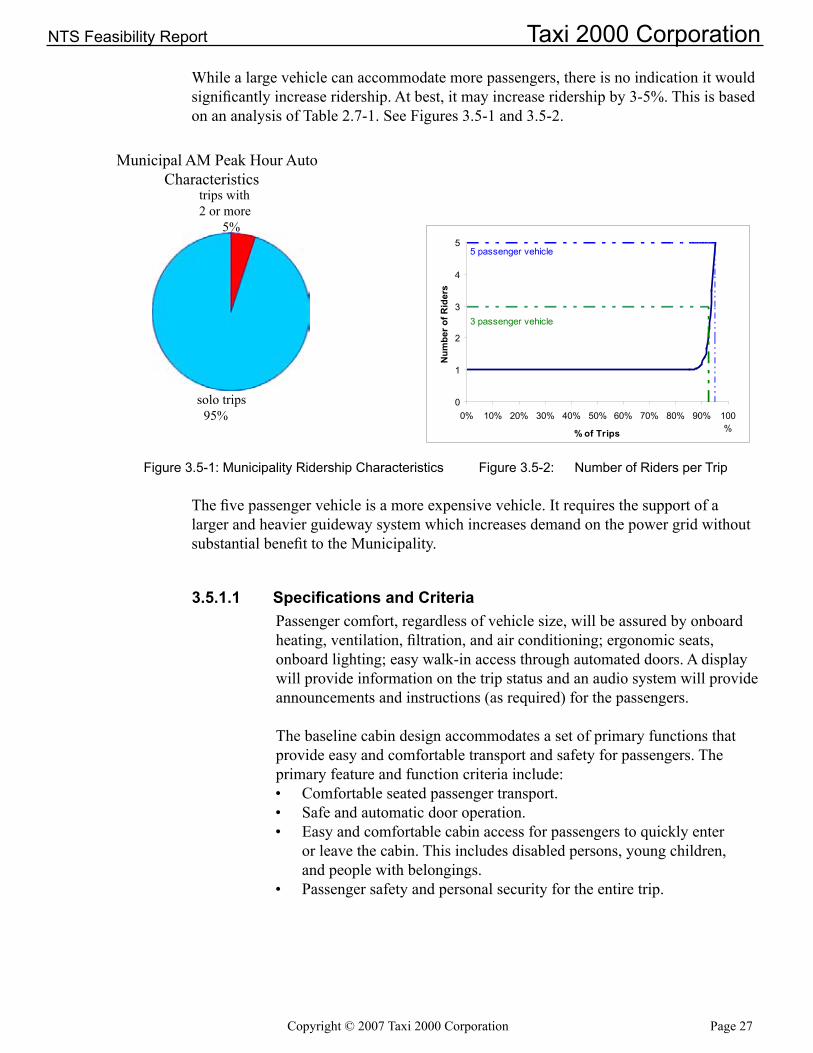
3.5.1 CabinA ridership survey was conducted by the Municipality. The survey collected data relative to how far people traveled and if they traveled alone or in groups. The Municipality analyzed the survey data and determined that on average, when people traveled less than 10 kilometers they typically traveled alone. Analysis of the data in Table 2.7-1 shows the following characteristics for auto usage in the Municipality. In scenario 80111 there are 232,661 trips carrying 244,791 people. That is an average of less than 1.1 people per trip.
•
•
Copyright©2007Taxi2000Corporation Page27
NTS Feasibility Report Taxi 2000 Corporation
While a large vehicle can accommodate more passengers, there is no indication it would significantly increase ridership. At best, it may increase ridership by 3-5%. This is based on an analysis of Table 2.7-1. See Figures 3.5-1 and 3.5-2.
Figure3.5-1:MunicipalityRidershipCharacteristics Figure3.5-2: NumberofRidersperTrip
The five passenger vehicle is a more expensive vehicle. It requires the support of a larger and heavier guideway system which increases demand on the power grid without substantial benefit to the Municipality.
3.5.1.1 SpecificationsandCriteriaPassenger comfort, regardless of vehicle size, will be assured by onboard heating, ventilation, filtration, and air conditioning; ergonomic seats, onboard lighting; easy walk-in access through automated doors. A display will provide information on the trip status and an audio system will provide announcements and instructions (as required) for the passengers.
The baseline cabin design accommodates a set of primary functions that provide easy and comfortable transport and safety for passengers. The primary feature and function criteria include:
Comfortable seated passenger transport.Safe and automatic door operation.Easy and comfortable cabin access for passengers to quickly enter or leave the cabin. This includes disabled persons, young children, and people with belongings.Passenger safety and personal security for the entire trip.
•••
•
Municipal AM Peak Hour Auto Characteristics
trips with 2ormore 5%
solo trips 95%
0
1
2
3
4
5
0% 10% 20% 30% 40% 50% 60% 70% 80% 90% 100%% of Trips
num
ber o
f Rid
ers
3 passenger vehicle
5 passenger vehicle
Page 28 Copyright©2007Taxi2000Corporation
Taxi 2000 Corporation NTS Feasibility Report
Simple and easy-to-use passenger control interface and status information. Automatic climate control and good protection from the weather and external environment.Passenger communications with Central Control. High reliability and maintainability Easily washed exterior surfaces and easily cleaned interior surfaces.Damage and vandal resistant surfaces.
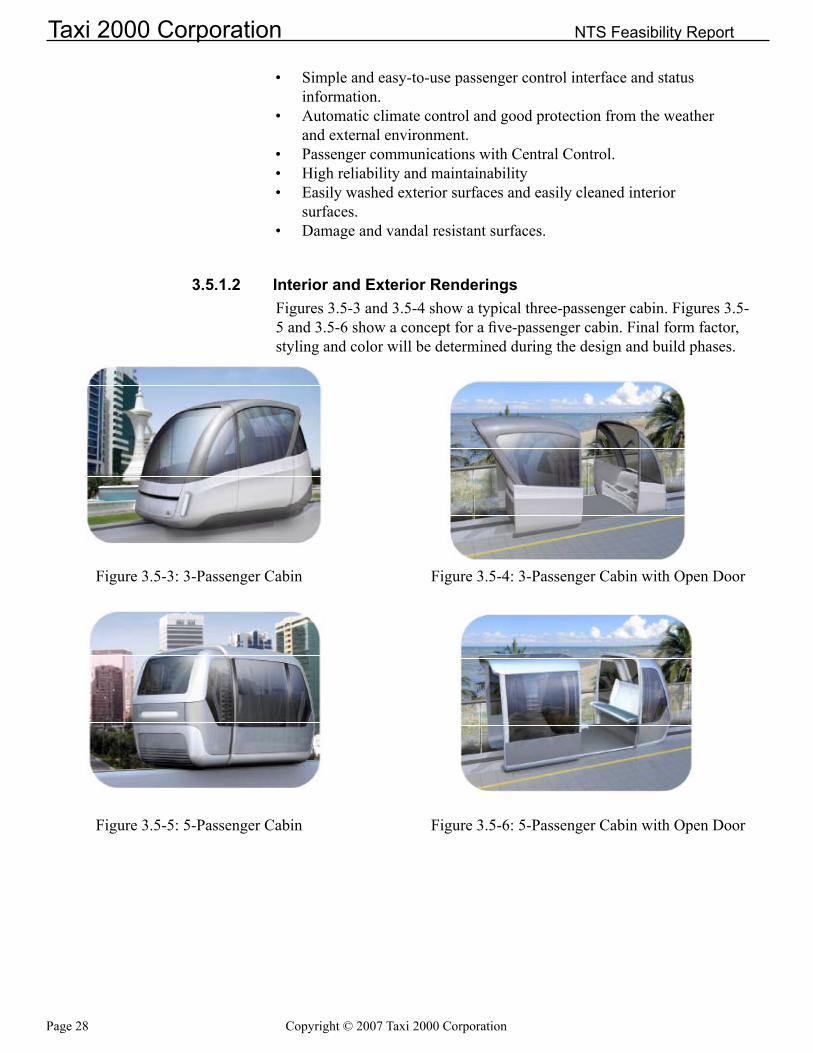
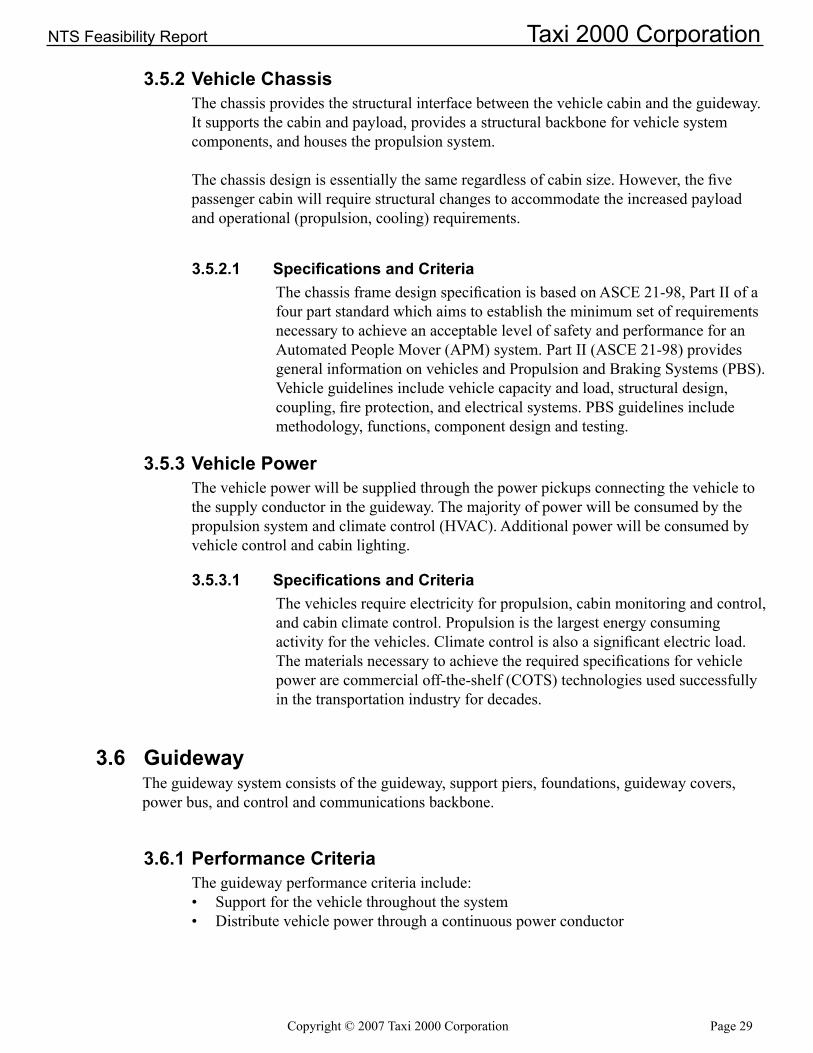
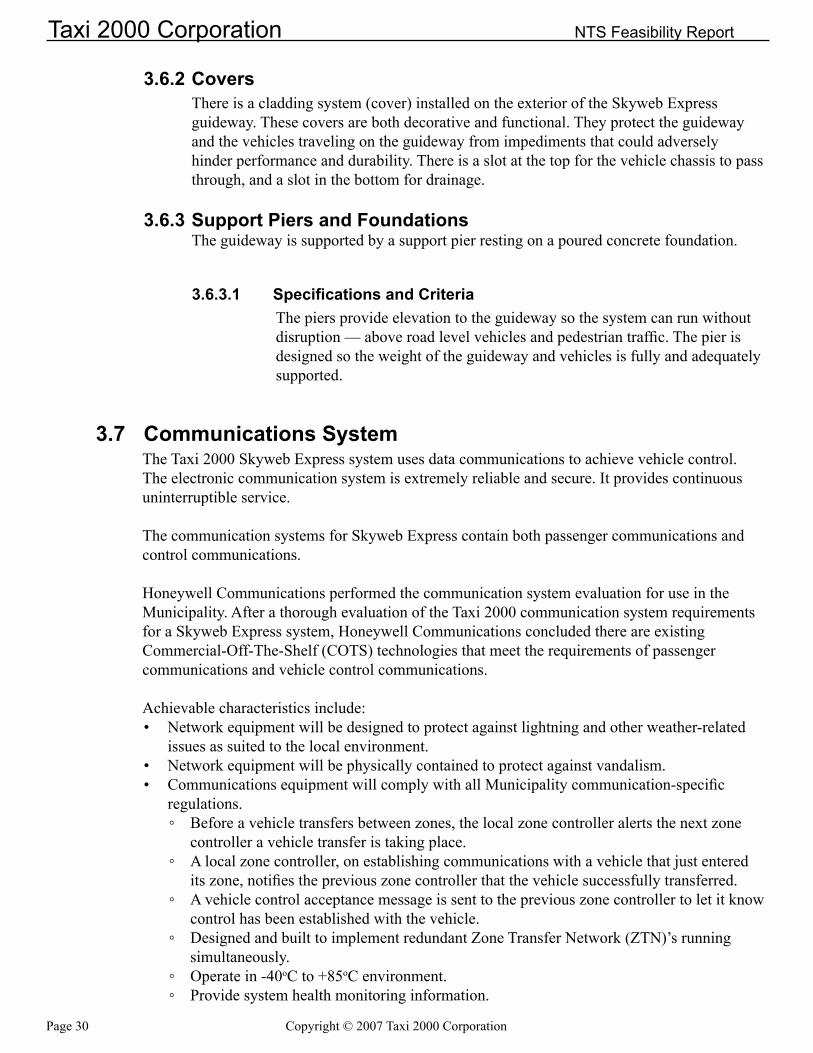
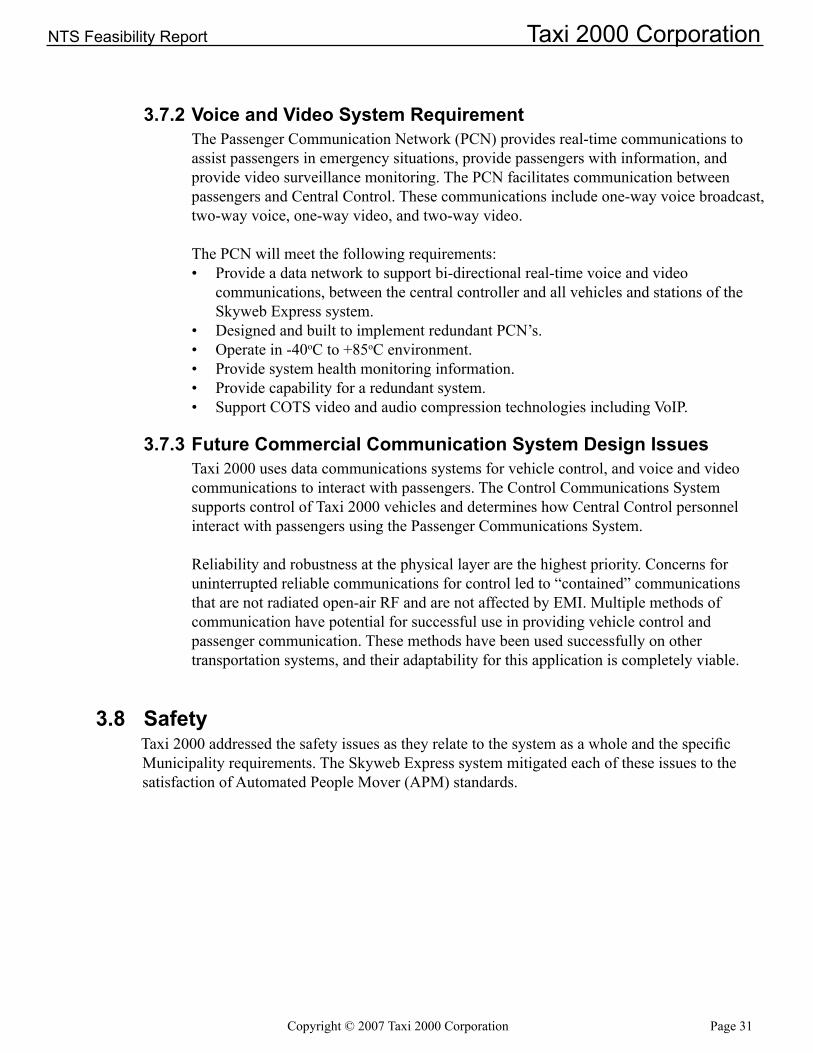
3.5.1.2 Interior and Exterior RenderingsFigures 3.5-3 and 3.5-4 show a typical three-passenger cabin. Figures 3.5-5 and 3.5-6 show a concept for a five-passenger cabin. Final form factor, styling and color will be determined during the design and build phases.
Figure 3.5-3: 3-Passenger Cabin Figure 3.5-4: 3-Passenger Cabin with Open Door
Figure 3.5-5: 5-Passenger Cabin Figure 3.5-6: 5-Passenger Cabin with Open Door
•
•
•••
•
Copyright © 2007 Taxi 2000 Corporation Page 29
NTS Feasibility Report Taxi 2000 Corporation
3.5.2 Vehicle ChassisThe chassis provides the structural interface between the vehicle cabin and the guideway. It supports the cabin and payload, provides a structural backbone for vehicle system components, and houses the propulsion system.
The chassis design is essentially the same regardless of cabin size. However, the five passenger cabin will require structural changes to accommodate the increased payload and operational (propulsion, cooling) requirements.
3.5.2.1 SpecificationsandCriteriaThe chassis frame design specification is based on ASCE 21-98, Part II of a four part standard which aims to establish the minimum set of requirements necessary to achieve an acceptable level of safety and performance for an Automated People Mover (APM) system. Part II (ASCE 21-98) provides general information on vehicles and Propulsion and Braking Systems (PBS). Vehicle guidelines include vehicle capacity and load, structural design, coupling, fire protection, and electrical systems. PBS guidelines include methodology, functions, component design and testing.
3.5.3 Vehicle PowerThe vehicle power will be supplied through the power pickups connecting the vehicle to the supply conductor in the guideway. The majority of power will be consumed by the propulsion system and climate control (HVAC). Additional power will be consumed by vehicle control and cabin lighting.
3.5.3.1 SpecificationsandCriteriaThe vehicles require electricity for propulsion, cabin monitoring and control, and cabin climate control. Propulsion is the largest energy consuming activity for the vehicles. Climate control is also a significant electric load. The materials necessary to achieve the required specifications for vehicle power are commercial off-the-shelf (COTS) technologies used successfully in the transportation industry for decades.
3.6 GuidewayThe guideway system consists of the guideway, support piers, foundations, guideway covers, power bus, and control and communications backbone.
3.6.1 Performance CriteriaThe guideway performance criteria include:
Support for the vehicle throughout the system Distribute vehicle power through a continuous power conductor
••
Page�0 Copyright©2007Taxi2000Corporation
Taxi 2000 Corporation NTS Feasibility Report
3.6.2 CoversThere is a cladding system (cover) installed on the exterior of the Skyweb Express guideway. These covers are both decorative and functional. They protect the guideway and the vehicles traveling on the guideway from impediments that could adversely hinder performance and durability. There is a slot at the top for the vehicle chassis to pass through, and a slot in the bottom for drainage.
3.6.3 Support Piers and FoundationsThe guideway is supported by a support pier resting on a poured concrete foundation.
3.6.3.1 SpecificationsandCriteriaThe piers provide elevation to the guideway so the system can run without disruption — above road level vehicles and pedestrian traffic. The pier is designed so the weight of the guideway and vehicles is fully and adequately supported.
3.7 Communications SystemThe Taxi 2000 Skyweb Express system uses data communications to achieve vehicle control. The electronic communication system is extremely reliable and secure. It provides continuous uninterruptible service.
The communication systems for Skyweb Express contain both passenger communications and control communications.
Honeywell Communications performed the communication system evaluation for use in the Municipality. After a thorough evaluation of the Taxi 2000 communication system requirements for a Skyweb Express system, Honeywell Communications concluded there are existing Commercial-Off-The-Shelf (COTS) technologies that meet the requirements of passenger communications and vehicle control communications.
Achievable characteristics include: Network equipment will be designed to protect against lightning and other weather-related issues as suited to the local environment.Network equipment will be physically contained to protect against vandalism.Communications equipment will comply with all Municipality communication-specific regulations.
Before a vehicle transfers between zones, the local zone controller alerts the next zone controller a vehicle transfer is taking place.A local zone controller, on establishing communications with a vehicle that just entered its zone, notifies the previous zone controller that the vehicle successfully transferred.A vehicle control acceptance message is sent to the previous zone controller to let it know control has been established with the vehicle.Designed and built to implement redundant Zone Transfer Network (ZTN)’s running simultaneously.Operate in -40oC to +85oC environment.Provide system health monitoring information.
•
••
◦
◦
◦
◦
◦◦
Copyright©2007Taxi2000Corporation Page�1
NTS Feasibility Report Taxi 2000 Corporation
3.7.2 Voice and Video System RequirementThe Passenger Communication Network (PCN) provides real-time communications to assist passengers in emergency situations, provide passengers with information, and provide video surveillance monitoring. The PCN facilitates communication between passengers and Central Control. These communications include one-way voice broadcast, two-way voice, one-way video, and two-way video.
The PCN will meet the following requirements:Provide a data network to support bi-directional real-time voice and video communications, between the central controller and all vehicles and stations of the Skyweb Express system.Designed and built to implement redundant PCN’s.Operate in -40oC to +85oC environment.Provide system health monitoring information.Provide capability for a redundant system.Support COTS video and audio compression technologies including VoIP.
3.7.3 Future Commercial Communication System Design IssuesTaxi 2000 uses data communications systems for vehicle control, and voice and video communications to interact with passengers. The Control Communications System supports control of Taxi 2000 vehicles and determines how Central Control personnel interact with passengers using the Passenger Communications System.
Reliability and robustness at the physical layer are the highest priority. Concerns for uninterrupted reliable communications for control led to “contained” communications that are not radiated open-air RF and are not affected by EMI. Multiple methods of communication have potential for successful use in providing vehicle control and passenger communication. These methods have been used successfully on other transportation systems, and their adaptability for this application is completely viable.
3.8 SafetyTaxi 2000 addressed the safety issues as they relate to the system as a whole and the specific Municipality requirements. The Skyweb Express system mitigated each of these issues to the satisfaction of Automated People Mover (APM) standards.
•
•••••
Page�2 Copyright©2007Taxi2000Corporation
Taxi 2000 Corporation NTS Feasibility Report
4. FIXED FACILITIES
4.1 IntroductionFixed facilities include the passenger stations, control center, maintenance facilities, storage facilities, and power distribution facilities. The function of each type of facility is a unique and integral part of the Skyweb Express system.
Section 4 is based on the following table of fixed facility assumptions, risks and required steps for implementation of a commercial Skyweb Express system in the Municipality.
Table 4.1-1: Fixed Facility Assumptions, Risks, and Required StepsAssumptions Risks Steps to Implement in The
Municipality1. The Municipality will determine
facility architecture, materials, and color.
2. Taxi 2000 and this study focused on functional and space requirements for the fixed facilities.
3. There are adequate and available building sites for all required stations, maintenance, operations, and storage facilities.
4. Utilites and other infrastructure will be handled by the Municipality.
1. Adequate and available building sites are not consistent with the preferred network routing.
2. The Municipality power grid cannot provide adequate power where the system needs it.
3. Integration with existing utility infrastructure could cause delays.
4. Risks are assumed by the Municipality
1. Choose building and station locations based on route and system needs.
2. Design all facilities.
3. Build
4. Handled by Municpality.
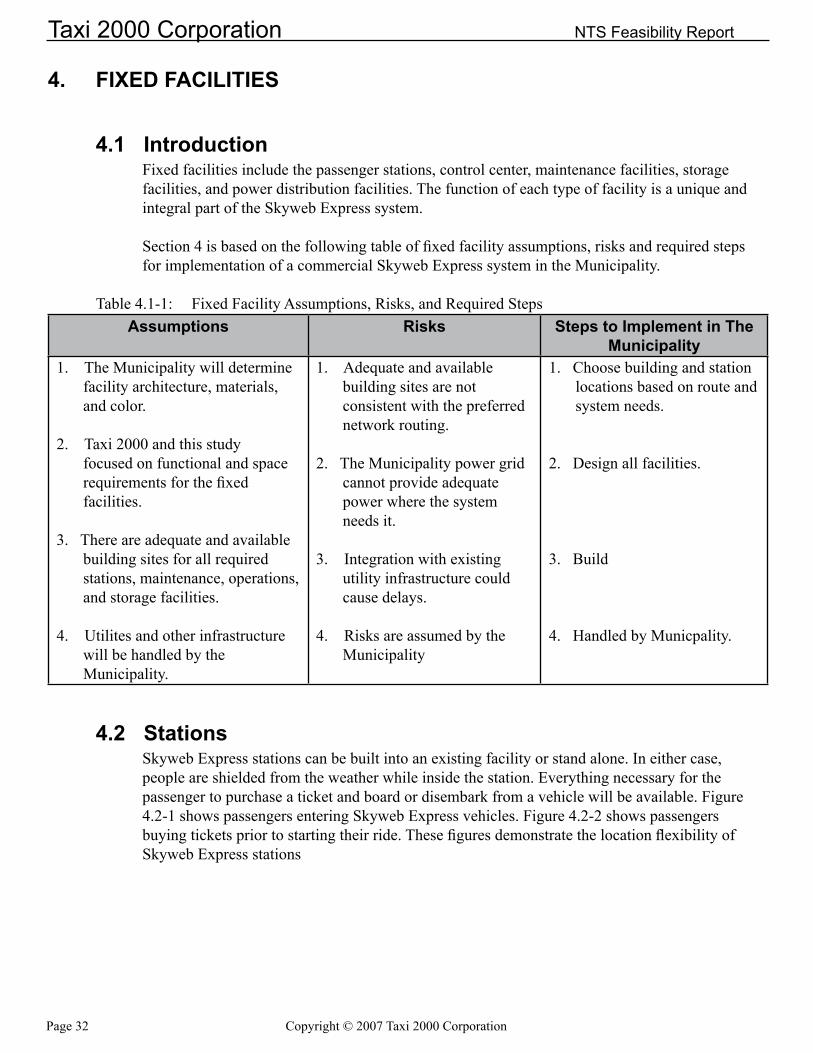
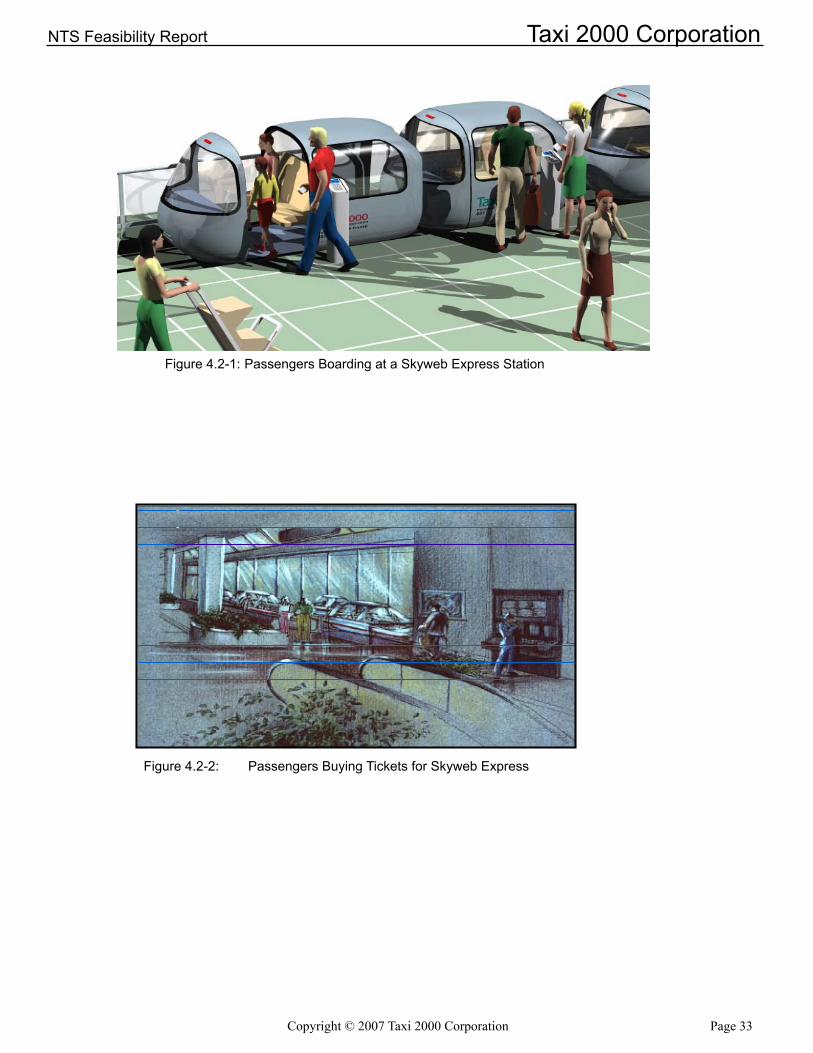
4.2 StationsSkyweb Express stations can be built into an existing facility or stand alone. In either case, people are shielded from the weather while inside the station. Everything necessary for the passenger to purchase a ticket and board or disembark from a vehicle will be available. Figure 4.2-1 shows passengers entering Skyweb Express vehicles. Figure 4.2-2 shows passengers buying tickets prior to starting their ride. These figures demonstrate the location flexibility of Skyweb Express stations
Copyright©2007Taxi2000Corporation Page��
NTS Feasibility Report Taxi 2000 Corporation
Figure4.2-1:PassengersBoardingataSkywebExpressStation
Figure4.2-2: PassengersBuyingTicketsforSkywebExpress
Page�� Copyright©2007Taxi2000Corporation
Taxi 2000 Corporation NTS Feasibility Report
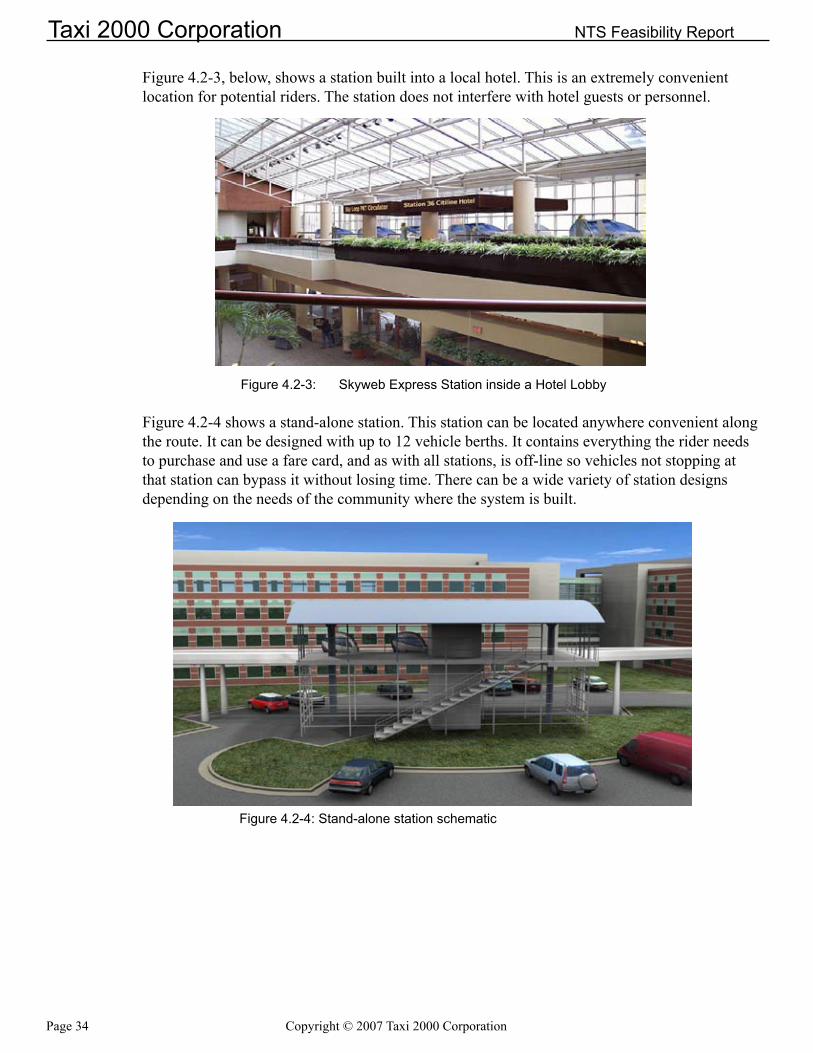
Figure 4.2-3, below, shows a station built into a local hotel. This is an extremely convenient location for potential riders. The station does not interfere with hotel guests or personnel.
Figure4.2-3: SkywebExpressStationinsideaHotelLobby
Figure 4.2-4 shows a stand-alone station. This station can be located anywhere convenient along the route. It can be designed with up to 12 vehicle berths. It contains everything the rider needs to purchase and use a fare card, and as with all stations, is off-line so vehicles not stopping at that station can bypass it without losing time. There can be a wide variety of station designs depending on the needs of the community where the system is built.
Figure4.2-4:Stand-alonestationschematic
Copyright©2007Taxi2000Corporation Page��
NTS Feasibility Report Taxi 2000 Corporation
4.2.1 Architectural ConsiderationsThere are a wide variety of systems, materials and designs that can be used for the Station Facilities. As a base design criterion, the materials must be durable and easy to maintain in the Municipality’s environment.
4.2.1.1 Vertical CirculationVehicles will be boarded at guideway level. This is typically five meters above ground level. Passenger can enter the station by stairs, escalator, or elevator.
4.2.1.2 TicketingConfigurationDestination selection and fare collection are features of the ticketing system. Its specifications differ from those required in a conventional rail system and must be specified and monitored by Taxi 2000.
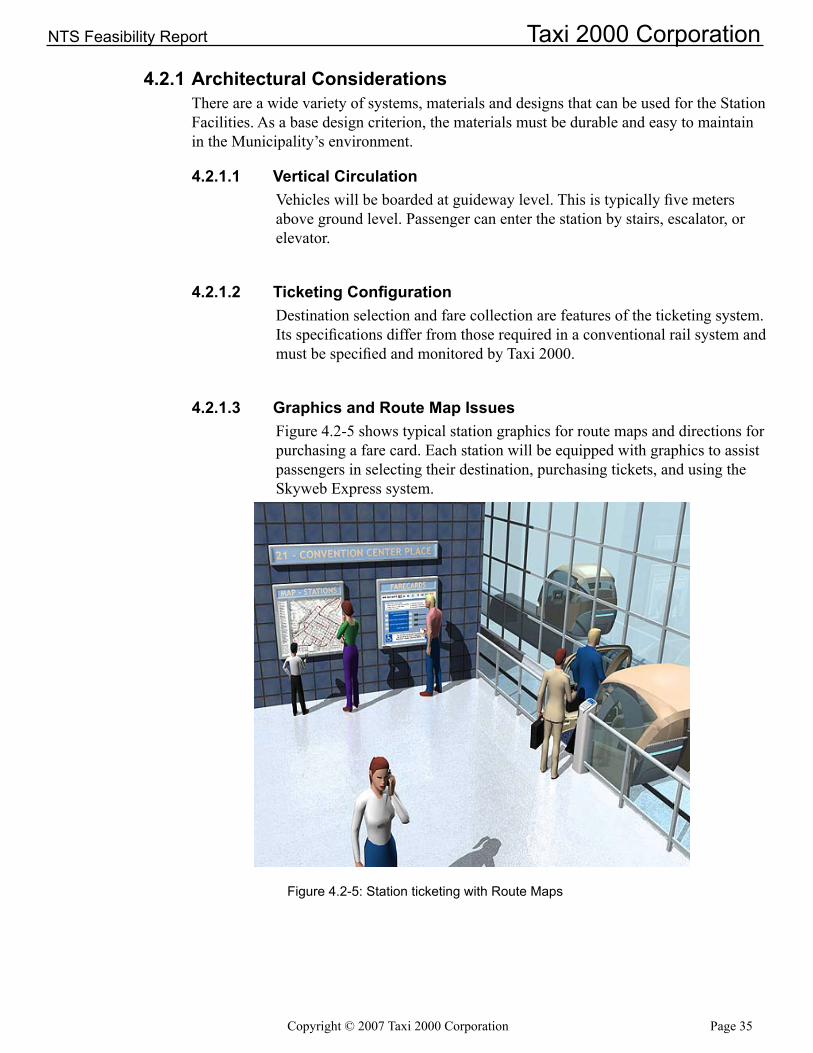
4.2.1.3 Graphics and Route Map IssuesFigure 4.2-5 shows typical station graphics for route maps and directions for purchasing a fare card. Each station will be equipped with graphics to assist passengers in selecting their destination, purchasing tickets, and using the Skyweb Express system.
Figure 4.2-5: Station ticketing with Route Maps
Page 36 Copyright©2007Taxi2000Corporation
Taxi 2000 Corporation NTS Feasibility Report
4.3 off-Line Vehicle StorageThe off-line vehicle storage facility is where vehicles will be inspected, washed, and stored. The number of off-line vehicle storage facilities is dependent upon the total number of vehicles in the system. The location of these facilities is sensitive to system needs and efficiency.
4.4 Maintenance FacilitiesAll vehicles require periodic maintenance for cleaning and general upkeep. This will be done at off-line maintenance facilities. These facilities will be equipped to provide both routine service and any necessary repairs for the vehicles.
Copyright©2007Taxi2000Corporation Page�7
NTS Feasibility Report Taxi 2000 Corporation
5. SYSTEM PoWERSkyweb Express uses electrical power rather than gasoline or other fossil fuels to operate its system. As part of the feasibility study, Taxi 2000 and its consultants determined the amount of electricity necessary to run the system during each phase of installation and expansion. Taxi 2000 then consulted with the Municipality to help determine what modifications (if any) were necessary to provide that electricity to the Skyweb Express PRT system.
Page 38 Copyright©2007Taxi2000Corporation
Taxi 2000 Corporation NTS Feasibility Report
6. FInAnCIAL MoDEL
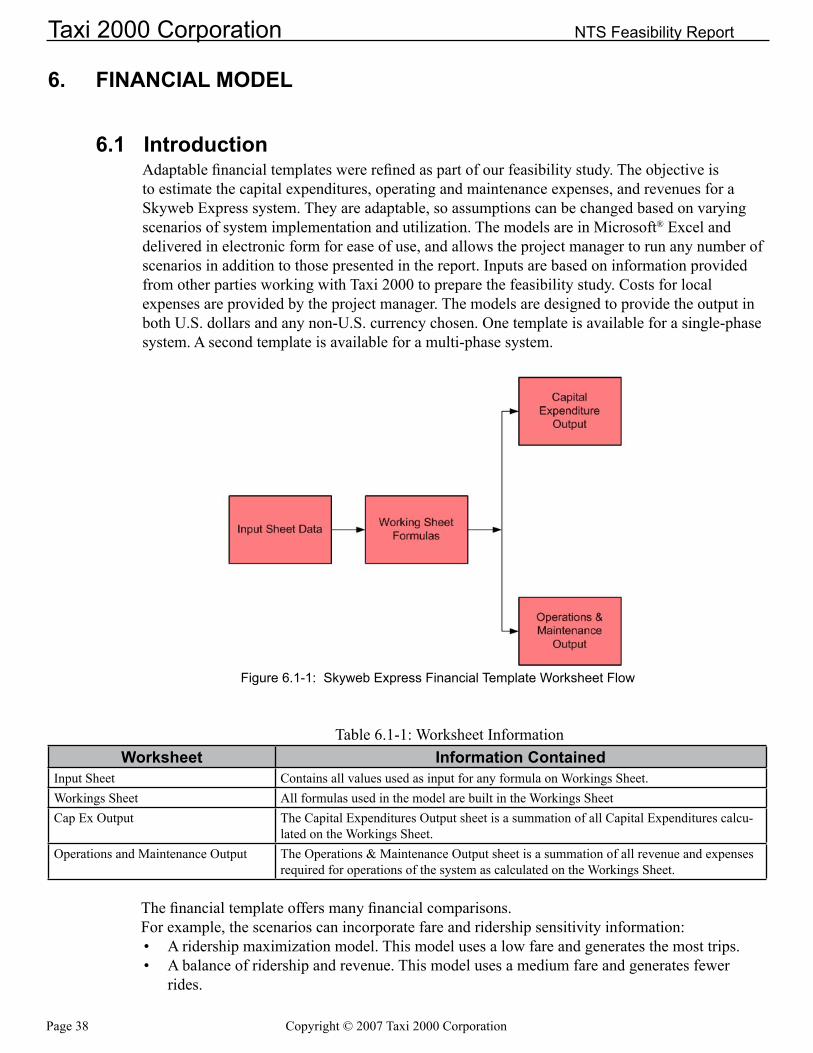
6.1 IntroductionAdaptable financial templates were refined as part of our feasibility study. The objective is to estimate the capital expenditures, operating and maintenance expenses, and revenues for a Skyweb Express system. They are adaptable, so assumptions can be changed based on varying scenarios of system implementation and utilization. The models are in Microsoft® Excel and delivered in electronic form for ease of use, and allows the project manager to run any number of scenarios in addition to those presented in the report. Inputs are based on information provided from other parties working with Taxi 2000 to prepare the feasibility study. Costs for local expenses are provided by the project manager. The models are designed to provide the output in both U.S. dollars and any non-U.S. currency chosen. One template is available for a single-phase system. A second template is available for a multi-phase system.
Figure6.1-1:SkywebExpressFinancialTemplateWorksheetFlow
Table 6.1-1: Worksheet InformationWorksheet Information Contained
Input Sheet Contains all values used as input for any formula on Workings Sheet.Workings Sheet All formulas used in the model are built in the Workings SheetCap Ex Output The Capital Expenditures Output sheet is a summation of all Capital Expenditures calcu-
lated on the Workings Sheet.Operations and Maintenance Output The Operations & Maintenance Output sheet is a summation of all revenue and expenses
required for operations of the system as calculated on the Workings Sheet.
The financial template offers many financial comparisons.For example, the scenarios can incorporate fare and ridership sensitivity information:
A ridership maximization model. This model uses a low fare and generates the most trips.A balance of ridership and revenue. This model uses a medium fare and generates fewer rides.
••
Copyright © 2007 Taxi 2000 Corporation Page 39
NTS Feasibility Report Taxi 2000 Corporation
An operating margin maximization model. This model uses a high fare and generates the least amount of rides. Of the three models, this one generates the highest contribution margin.
Model templates were created providing more detail for quarterly capital expenditure scenarios and these templates also accompany the report. The timing of these expenditures will be finalized as a result of contract negotiations at all levels and probably will vary from the estimates provided.
6.2 AssumptionsThe financial models are extremely comprehensive, providing hundreds of inputs. Detailed descriptions are provided to explain what the input line is requesting in terms of information, so an accurate model can be prepared.
6.3 Capital ExpendituresThe fee sensitivity models in the recent feasibility study revealed a current cost in the range of $15.3-$19.7 million per kilometer.
Unlike other forms of mass transit, it is relatively easy to add additional traffic carrying capacity, so a system designed for maximum net operating margin is at the low end of the per kilometer cost and a system designed for maximum ridership (estimated at 24% of all trips in the Municipality) is at the high end of the range
6.4 operating and Maintenance Expenditure ScenariosThe Operations & Maintenance output is a Skyweb Express profit and loss estimate showing revenues, operating costs, and maintenance (based on Input Sheet parameters). The forecast also projects cash flow requirements and operating metrics. Costs are shown in U.S. Dollars and the foreign currency of choice.
In the recently completed feasibility study, the fare sensitivity model showed operating and maintenance costs of $.70 to $.90 per passenger trip and costs including depreciation of $1.50 to $2.35 per passenger trip.
6.5 Scenarios for System ImplementationSkyweb Express systems are relatively easy to expand, so customers can choose to build the system in phases, with confidence the last phase will integrate seamlessly with every previous phase. There is only a minor cost to integrate. This is important because unlike other forms of mass transit that often require transfers to get the passenger to a destination, Skyweb Express takes its passengers non-stop from the beginning to the end of their journey.
•
Page�0 Copyright©2007Taxi2000Corporation
Taxi 2000 Corporation NTS Feasibility Report
7. RECoMMEnDATIonSTaxi 2000 made several recommendations in the feasibility study we completed for the Municipality. This chapter details those recommendations.
7.1 IntroductionSkyweb Express represents a new age of transportation using advanced and commercially available technology to address the growing needs of urban travel. This study established the technological viability and the commercial feasibility of PRT in the Municipality. It has the means to become the first metropolitan area in the world to not only embrace the idea of PRT, but to have the vision to implement it.
The following is a recommendation for how technology and leadership propel the Municipality to world transportation icon.
7.2 Pilot SchemeBuild the 18.3 Km pilot system downtown. Its advantages over the airport site include:
Identifies the Municipality as a world leader in transportationIt provides visibility to the public and to public officialsIt is a subset of the proposed 57 kilometer Phase 1 commercial build and has the potential to accelerate the completion of the first phase – 18.3 kilometers will already be built and operational.
The pilot system will be sized to handle the capacity requirements of the full system build-out with minimal retrofit. It will initially have up to 14 stations, 400 vehicles and one combination storage and maintenance facility that will also house the control center.
7.3 The Municipality Phase 1The first phase of the build-out will expand the 18.3 kilometer pilot system to 57 kilometers. Phase 1 will be built with up to 68 stations and 2200 vehicles and a commensurate number of storage and maintenance facilities consistent with the needs of the system and available facility building sites.
7.4 The Municipality Build-outThe complete build-out of the Skyweb Express system can be completed in three additional phases. The full system would include 275 Km of guideway, over 16,000 vehicles, and 200 to 300 stations. The completed system ridership is estimated to exceed 900,000 passengers per day.
•••
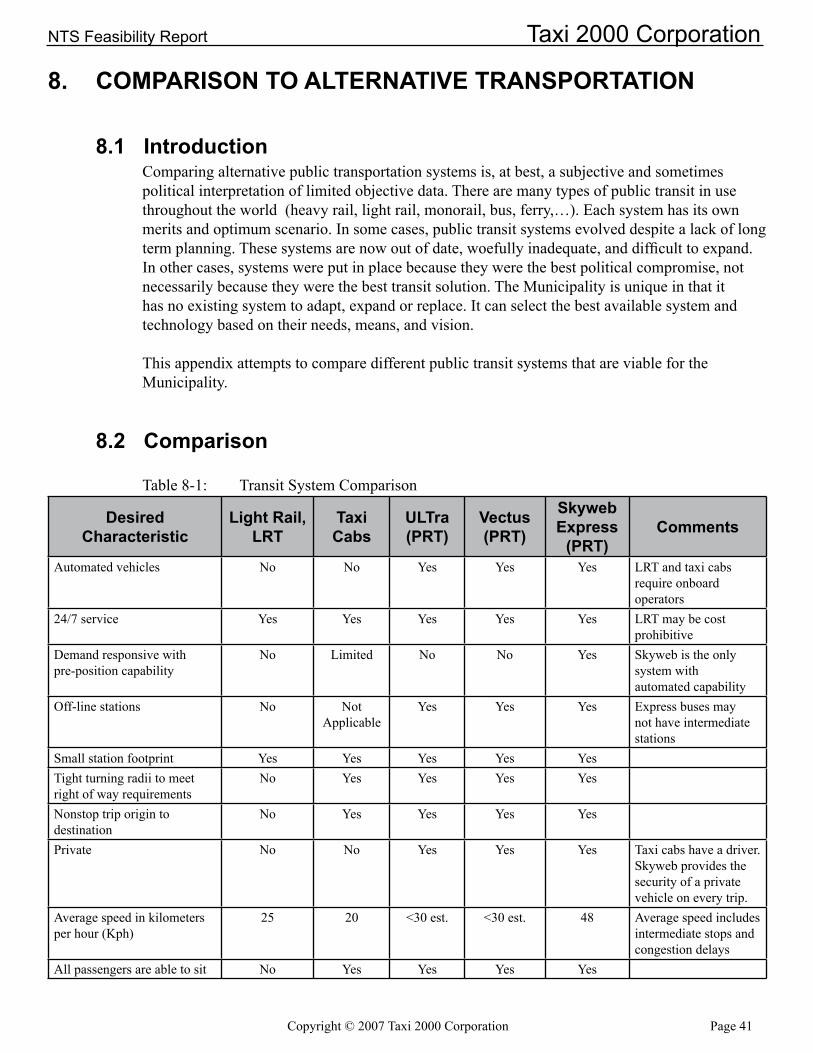
Copyright©2007Taxi2000Corporation Page�1
NTS Feasibility Report Taxi 2000 Corporation
8. CoMPARISon To ALTERnATIVE TRAnSPoRTATIon
8.1 IntroductionComparing alternative public transportation systems is, at best, a subjective and sometimes political interpretation of limited objective data. There are many types of public transit in use throughout the world (heavy rail, light rail, monorail, bus, ferry,…). Each system has its own merits and optimum scenario. In some cases, public transit systems evolved despite a lack of long term planning. These systems are now out of date, woefully inadequate, and difficult to expand. In other cases, systems were put in place because they were the best political compromise, not necessarily because they were the best transit solution. The Municipality is unique in that it has no existing system to adapt, expand or replace. It can select the best available system and technology based on their needs, means, and vision.
This appendix attempts to compare different public transit systems that are viable for the Municipality.
8.2 Comparison
Table 8-1: Transit System Comparison
Desired Characteristic
Light Rail, LRT
Taxi Cabs
ULTra (PRT)
Vectus (PRT)
Skyweb Express
(PRT)Comments
Automated vehicles No No Yes Yes Yes LRT and taxi cabs require onboard operators
24/7 service Yes Yes Yes Yes Yes LRT may be cost prohibitive
Demand responsive withpre-position capability
No Limited No No Yes Skyweb is the only system with automated capability
Off-line stations No NotApplicable
Yes Yes Yes Express buses may not have intermediate stations
Small station footprint Yes Yes Yes Yes YesTight turning radii to meet right of way requirements
No Yes Yes Yes Yes
Nonstop trip origin to destination
No Yes Yes Yes Yes
Private No No Yes Yes Yes Taxi cabs have a driver. Skyweb provides the security of a private vehicle on every trip.
Average speed in kilometers per hour (Kph)
2� 20 <30 est. <30 est. 48 Average speed includes intermediate stops and congestion delays
All passengers are able to sit No Yes Yes Yes Yes
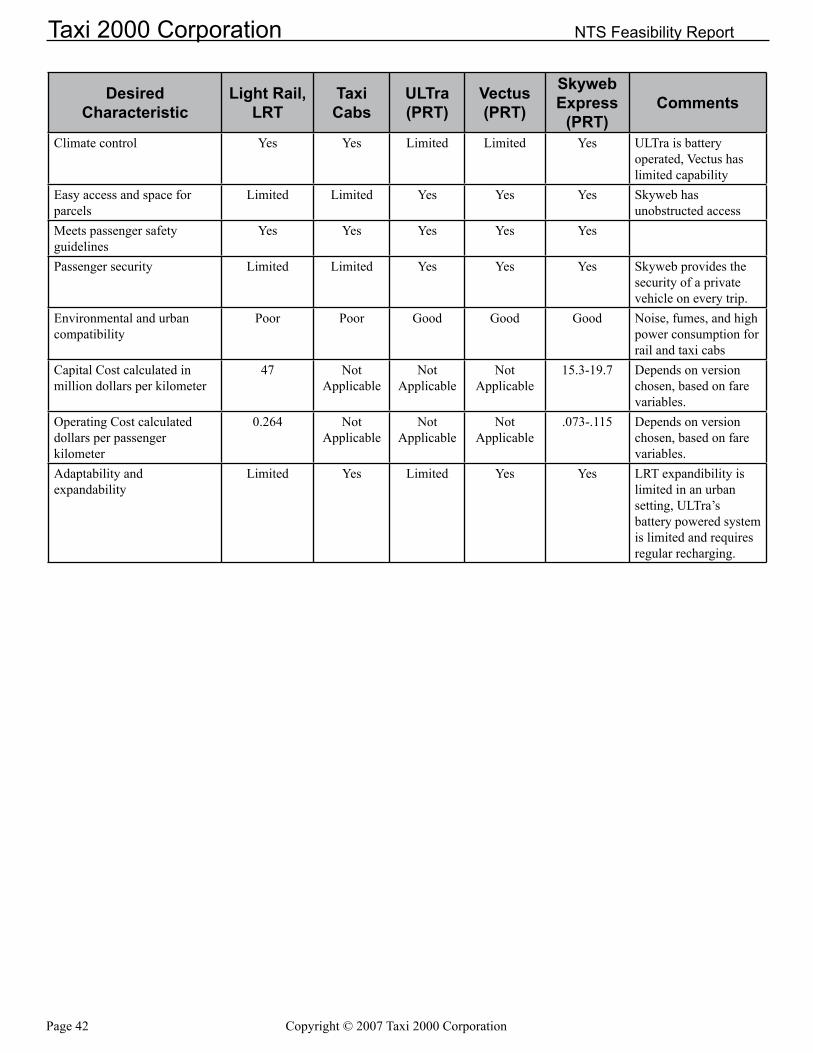
Page�2 Copyright©2007Taxi2000Corporation
Taxi 2000 Corporation NTS Feasibility Report
Desired Characteristic
Light Rail, LRT
Taxi Cabs
ULTra (PRT)
Vectus (PRT)
Skyweb Express
(PRT)Comments
Climate control Yes Yes Limited Limited Yes ULTra is battery operated, Vectus has limited capability
Easy access and space for parcels
Limited Limited Yes Yes Yes Skyweb has unobstructed access
Meets passenger safety guidelines
Yes Yes Yes Yes Yes
Passenger security Limited Limited Yes Yes Yes Skyweb provides the security of a private vehicle on every trip.
Environmental and urban compatibility
Poor Poor Good Good Good Noise, fumes, and high power consumption for rail and taxi cabs
Capital Cost calculated in million dollars per kilometer
�7 NotApplicable
NotApplicable
NotApplicable
15.3-19.7 Depends on version chosen, based on fare variables.
Operating Cost calculated dollars per passenger kilometer
0.264 NotApplicable
NotApplicable
NotApplicable
.073-.115 Depends on version chosen, based on fare variables.
Adaptability and expandability
Limited Yes Limited Yes Yes LRT expandibility is limited in an urban setting, ULTra’s battery powered system is limited and requires regular recharging.
Copyright©2007Taxi2000Corporation Page��
NTS Feasibility Report Taxi 2000 Corporation
For Additional Information:Taxi2000Corporation
8050 University Avenue NorthFridley, Minnesota 55432
Phone: (763) 717-4310 E-mail: [email protected]
Internet: www.skywebexpress.com