Embed Size (px)
Citation preview

SLAC-PUB-2120 May 1978 (El
PRODUCTION OF LEPTO:L'S A3-D LEPTON PAIRS LN v'p INTERACTIO:JS*
- K. F. Xozle:
Stanford Linear Accelerator Center Stanford University, Stanford, California 94305
INTRODUCTION
Two low sensitivity but excellent mass resolution lepton produc- tion experiments are reported on, both performed at SLAC. i
One is a study of e+ production in n interactions at 18 GeVic performed using the SLAC hybrid bubble ghamber. The other is a study of muon pair production in 15.5 GeV/c 7i interactions .
e PAIR EXPERIMENT
The e' experiment was performed by the following persons: (SLAC) J. Ballam, J. Bouchez, T. Carroll, G. Chadwick, V. Chaloupka, C. Field, D. Freytag, I?,. Lewis, K. Kofieit, and R. Stevens; (Duke University) H. Eand, L. Fortney, 'I'. Glanzman, J. S. Loos, and W. D. Walker; (Im- perial College) P. A. Baker, P. J. Dornan, D. J. Gibbs, G. iIal1, A. P. White, and T. S. Virdee. It utili-cd a large numbeK of tech- niques for identification of electrons, in particular the introduction of three one-radiation-length tantalum plates into the hydrogen bubble chamber. Figure 1 shows a photograph of an electron pair event in the
Fig. 1. Bubble chamber photograph
* Work supported by the Department of Energy. (Invited talk presented at the 3rd International Conference at Vanderbilt on New Results in High Energy Physics, Nashville, Tenn. March 6-8, 1978).

-2-
chamber. The following methods were used for electron identification; 1. Spiralling (for tracks down to 1 PleV/c). 2. Bremsstrahlung in hydrogen. 3. High energy dc!ta rays. 4. Ionization (useful to Q 200 XeV/c). 5. Lnteractions in the plates. Criteria for electron identification based on studies with an electron beam were:
a. Electrons interact visibly before third plate. b.. Transverse momentum of tracks in the electron shower does not
exceed 30 NeV/c. c. No track with momentum > 10 MeV/c at 0 > 90°. d. Total Evis in shower behind at least one plate > 7% of in-
coming. e. No hadron signature (i.e., heavy ionization, stub tracks,
etc.) The 4~ solid angle and selective criteria allowed a study of
single electron production with 10-4 discrimination from hadrons. An exposure of 250,000 np interactions was made and resulted in
the following number of events: A. Single e+ candidates with all other tracks identified as hadrons.
22 events. B. Candidates in pairs, from 55% of the data available so far.
2,000 pairs. C. Single ek candidates with at least one unidentifiable track of
opposite charge, from 55% of the data available so far. 400 pairs. The analysis of the apparent electrons produced without an oppo-
site charge partner made use of a study of the properties of pion in- duced showers in the plates. For this, pure beams of pions at 1.57 and 3.14 GeV/c were used, and a background level was established for pions to simulate electron showers (at about 1 in 2 x 10⁴ pions).
The 22 single electron candidates corresponded by themselves to an e/7r ratio of (4.3 + .9) x 10-5. All the properties of the events were consistent with the hypothesis of pion breakthrough, and sub- tracting the measured rate of breakthrough a limit on direct, unpaired, electron production was obtained: e/n < 2.4 x lo-5 at 90% C.L.
From this a limit on charmed particle production could be derived in terms of the semi-leptonic branching ratios. lising the recent measurement for the electron decays of the D mesons, the limit is u < 13 ub at 90% C.L. This indicates that virtually all of the re- ported electrons in hadronic interactions are from pair production.
A study of the production of postiron electron pairs was also performed. Here the small number of interactions made the-experiment sensitive only to very low mass pairs, mostly lower than the no mass. The results were again compared with the detailed ?lonte Carlo calcu- lation. Pair production from all known sources was introduced using the following production cross sections:
rl u = 1.3 mb w u = 3.4 mb P u = 4.0 mb (Ref. 1) 7rk u = 85 mb 710 u = 36 mb

-3-
The results are compared in Tables I and II.
Table I A Comparison of the p, Distribution of e+ and e-
Pt, @f;V/c) of e with higher
Pt
Pt of ek with lower
Tracks with That Expekted from n Xonte Carlo Calculation Encompassing All Known Sources
(A) 0.
(%L, (i.9) (A.4) -2 EVENTS (0.2) 02-33~~~~ EVENTS)
200
$.3) (i.8) (i.4) (i.7)
400
(1.8) (C,,
%a- 67 135 202 270 %
600
M e+e-
(MeV/c2>
(B)
EVENTS (EXPECTED mm~s)
M+- (MeV/c2> ee

-4-
Table II The Excess of Mea.- cured ck Tracks Over Those P'rcdicted by a Monte Carlo Calculation Encompassing all G-town Sources. Eoth e+ and e- arc Counted
P, (MeV/c) of e + - or e
0
1-73
I------ M ee ' 67 ---- M ee ' OBSEKVED -1IONTE CARLO
135 1 -.
Expected
7rr+ rate at x 10 -4
0 I I I I 35.0 25.. 7 13.4
218.0 ‘5.6 200 _
11.0 9.5 15.6 +6.1 ‘3.7
400 4.3 -0.4 14.2
f3.5 ‘1.5
A mass plot is shown in Fig. 2. This indicates the agreement between the Monte Carlo, including resolution, and the ~0 Dalitz pair dominated pair spectrum. 0nl.y above 135 MeV/c2 is the data strong enough to indicate a significant excess of pairs. The excess of elec- trons and positrons in this mass range tend to cluster at low pT (Table II).
p PAIR EXPERIMENT
Events with a Track IL / p,> 200 MsV/c
The p pair production experiment ‘u.~;is performed using 15.5 CcV/c 7% beams incident on a liquid hydro-
50 IO0 M ee (MeV/c2)
Fig. 2. Mass plot
3JPl.l
was the follwing : SLAC: I(. Bunnell, M. Duong-
van, E. Kogan, B. Haber, R. Mozley, A. Odian, F. Villa, L. Wang.

tiodosco:e awl Wire Ctiarrt;crs streamer chamber. The - .-~ chamber is mounted in a n- -~ 7” i;‘ bC
fi w vvj
c L. 13 Kgauss magnet and viewed from above in three cainera stereo. Directly
F downstrcnm of the chamber r- :-- i j 4
a hadron absorber of cop- ! / ,' + >..i I
: ;I per and lead is erected with a hole allowing pas- ..-;- -‘b, ;‘; saze of the non; nteractl n;: pi&s in the beam. A scin- til Lation counter hodo- -- --.*
I m&r 1:, 9, scope is interspersed in the wall with horizontal
Fig. 3. Plan viz,, of streamer chamber counters A, C, and I;: and vertical counters B and D. A trigger consisted
of an interaCt-ion in tile hydro- gen target (i.e., a particle- incident and non-emergent) and the firing of a pair oi appro- priately lined up A and C count- ers and two nonadjacent B count- ers. The system would trigger on particles of momenta greater
Fig. 4. Streamer chamber photo- than 2 &V/c. Hits on the D, E,
graph with muon candidates and F scintillation collnters
(tracks 1, 2, and 3.) were recorded as wel.1 as those in two wire chamber planes(W) .
Figure 4 sllows a photo- g,raph of a muon pair cnndidate i.n the streamer chamber. Hadron punch- through was reduced by the following procedure: Muon candi~date tracks such as I, 2, and 3 were measured in the streamer chamber and extra- polated !,OSitiGJ?!-; cnlclli-ated ;It the coljnter 2nd wire chamber locations. A mnasurcd 110 i,i 1 icon o~c’T t?lr;-:’ :rtandnrd deviatfons Prom the projected position was taken as evidence t';lat tile particle was in fact a hadron.
Figure 5a shows a plan v<,-w of three muon candidates visible in Fig. 4. All of cl1 e tracks s:Itisfy mui)n criteria in tt-,i s vj c\j. Fig. Sb sllows a side vie\> of ti?e same three t1:acks. Tliere is no al;propriate hit for track 2 in the first i)lanc of wire charbers, and as a result tracks 1 and 3 are identified as muons and track 2 as a hadron.

1. .
A C F (b)
x
2 ,,........( I: ~ .___..,,_..; . . . . . . . . . . . j.T . . . . . . . . . . . . . . . . .
( ,3-~....,~:,,,::~::::~:(::~i::::::::/j:::~:::::::::::::::::::::
I :v.t
-6-
To calculate the punchthrough expected with the use OF thcsc cri- teria, 3n exposure was made to events resulting from ilearn interactions and .- another cxposcre to cvctnts with a single muon trii::er. Th:: particles causing single muon triggers arc pri- marily hadrons 'L 30/l and hence can serve as an excellent model for hadron putichthrough.' As a result the muon candidate tracks from the single muon events were measured and subjected to the same scrutiny as that for the two muon trigger events. These were then treated as examples of hadron punchthrouqh and the hadron punchthrough probability calculated as a function of energy. The inter- action trigger events were measured and used as a sample of the hadrons incident on the lead wall. The meas- ured punchthrouc,h probability WRS applied to single muon events and tfie probability of their simulating di- muons was then calculated.
Fig. 5a. Plan view of arrnnge- ment of downstream scintillation counters and wire chambers. The location of counters hit is shown by lines with horizontal bars I while the predicted track location is shown by lines without horizontal bars which extend ? 1 a; wire cham- ber hits are shown by crosses. 5b. Side view of arrangement of downstream counters and wire chambers.
It was found th:it excessive punchthrough occurred if all events were used which penetrated through to the C counters (2 GeV/c particles), and as a result the events reported on here had muon candidates which registered as passing through enough lead to reach the D 2nd E counters. The minimum momentum required for this was 2.4 GeV/c. This resulted in a minimum XF of 0.3. Figure 6 shows the acceptance for XF (c of m momen- tum in beam direction/maxi;nuril possible c of m momentum) and dImuon mass.
Table III summarizes the data obtained while Fig. 7 shows the dimuon mass spectrum. A clear w sig- nal can be seen, plus a p signal and a considerable enhancement below the p. It was not possible to make a ciean fit to the p signal with- oat a better understanding of the nature of the background -under it. Allowing the background to vary.could give an e.ucellent fit for a very large range of p cross sections and hence none is determined here. The calculated punchthrough background is shown crosshatched.
Estimates of the maximum size of q -+ 2~ decay can be made because Of the good mass resolution. For this purpose the mass binning is ad- justed to allow a single bin to be centered on the m mass. An insig- nificant signal thus observed allows a cross section calculation to be made.

Tabl
e III
. D
ata
Sum
mar
y )
4-
IT
-. 7T
Com
bine
d
Inte
ract
ions
Sens
itivi
ty
(eve
nts/
ubar
n)
Cin
uons
fo
und
(bac
kgro
und)
v+u-
++
1-1 i-
l
l-l--
P--
Cra
ss
sect
ion
obse
rved
xF
-+
0.3
(n
anob
arn)
+-
‘iip
-f p
!J
x
U(T
-- p
-+ v
+p-X
)/o(n
+p
-f LI
+P-X
) =
1.28
*
0.23
45.3
x
lo6
51.1
x
lo6
96.3
x
lo6
1,88
0 1,
990
3,87
0
137
(17)
19
8 (4
4)
335
(61)
15
(8)
3 (9
) 18
(1
7)
1 (1
) 22
(1
9)
23
(20)
250
+ 70
(a)
320
f 90
28
0 f
70
30 -
+ 13
3*3
(3 (v+v
-) =
(3
f 1)
x
10 -5
u (a
+n-)
(a>
This
nu
mbe
r ca
n be
co
mpa
red
with
th
e va
lue
of
340
f 70
ob
tain
ed
at
150
GeV
/cP

-8-
01 ’ 0 0.2 0.4 0.6 0.8 1.0 1.2
-72 M (p+p-) (GeV) ,11,..
Fig. 6. Acceptance of the apparatus for dimuons.
30
5
0 200 400 600 800 IO00 1200 1400
Fig. 7. Measured dimuon mass spectrum. Estimates of the hadron punchthrough background 2nd contributions from rl and w Dalitz decay are indicated.
Figure 8 shows the mass spectrum with the back::rollnd subtracted. The possible contribution from Dalitz decays of the q and (L\ can be estimated in two ways. One way is to use our measured val- ues of q and w + 2~ cross sections and to calculate their Dalitz decay con- tribution from this (Ref. 2). This is shown as the dotted curve in Fig. 7 and the mass spec- trum with this and the background subtracted is shown in Fig. 9.
--
A more conservative way of estimating Dnlitz decay backgrounds is to make use of the excel- lent mass resolution to introduce the maximum signal F;hich clsuld be present. This involves only knowing the shape of the Daliti contribution, and here we use a shape with a very large w.con- tribution to eniphasize the width of the distri- bution. The maximum pos- sible contribution is shown in Fig. 7. If the contribution were larger than this it would cause the mass plot to peak at a higher value near threshold. The mass plot with the background and this maximum Dalitz contribution subtracted is shown in Fig. 10. Thus the good mass reso- lution allows this low statistics experiment to
show for the firct time model independent evidence for the existence of a dimuon mass continuum below the p which cannot be derived from Dalitz decay 01 l:nn~.:n incsons.
There are an zdcquatc nu::!ber of theorrtical papers predicting such behavior. A calculation by Ujol-ken and Keisbcrg (Rei. 3) produced a

-9-
200 600 1000 M + - (MeV)
,-7. PF 1)o.. J
Fig. 8. Dimuon mass spectrum after subtraction of the calculated hadron punchthrough.
200 600 M + - (MeV) s-78 PP ,,“..I
Fig. 9. Dimuon mass spectrum after \ subtraction of tile calculated hzdron
punchthrough and the most probable contribution from n and Q decays.
but those produced at large angles have
The decay angle of the muons with respect to the direction of the muon pair can be examined but unfortu- nately the acceptance of the trigger lessens the value of ' this. Fluons produced at al- most all c of m angles are incident on the lead absorber
insufficient energy to pene- trate the lead. The acceptance is shovn in Fig. 14. Figure 15 shows the resulting distribution. The results don't ClKX-ly d.iEfsrcr!tiatc between distributions although a sin20 dlstributjon is slightly pre- ferred over (1 + cos20). The same data is shown in Fi:-;. 16 broken up into different mass intervals. So statistically significant differ-- ences are observed.
qualitat- ive el-~h6~nctnlcnt- here by quark antiLl;-:;'rk nnnihila- tion si:;,ilar to that pre- dieted by thrl Drcll-Yzn model but enllanced by the annihi- lation with the additional quarks produced in pion pro- duction. Calculations by Blankenbecler and Duong-van (Ref. 4) of pion pion anni- hilation produced a phenom- enological more quantitative estimate. A similar en- hancement would occur from the pion bremss;rahlung pre- diction of Frautshi and Farrar (Ref. 5) but here we would expect a mass spectrum peaking more at threshold.
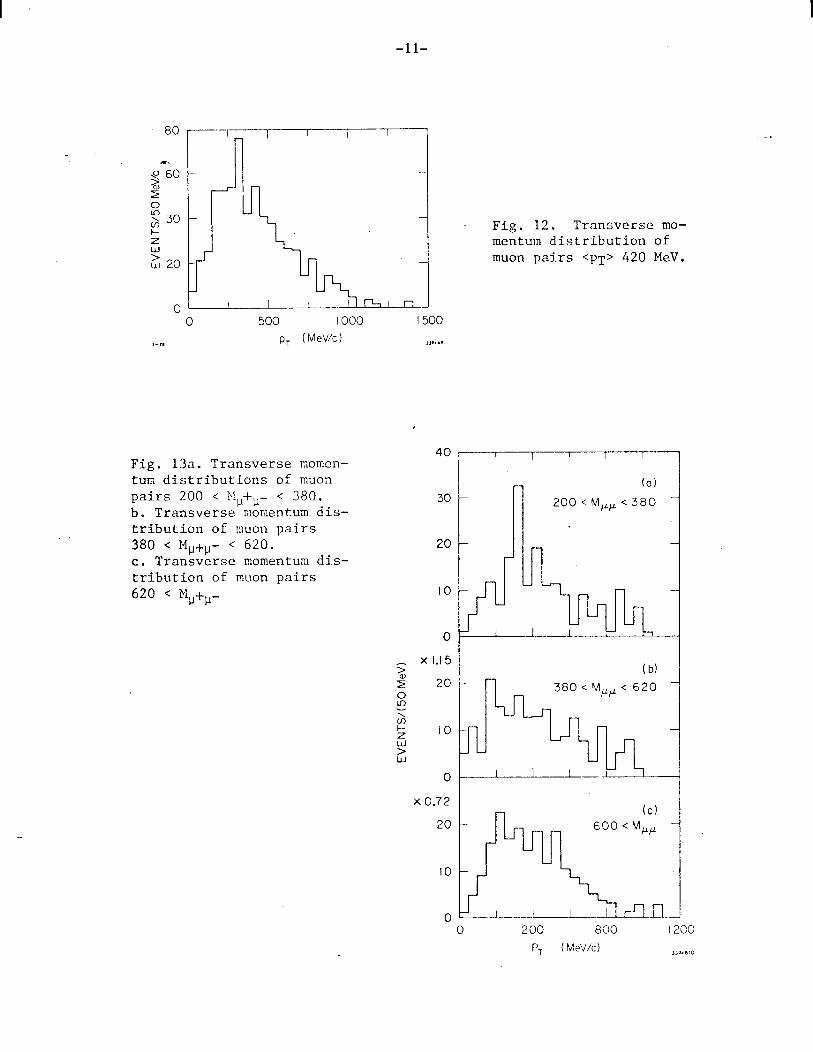
It is interesting to study the XF spectrum as a function of the mass region. The result is shown in Fig. 11. The region of the p shows a flatter spectrum as would be expected from ihe known enhancement of p pro- duction at high XF. The transverse momenta of the observed pairs is shobn ir Figs. 12 and 13. Differences between the mass regions are not statistically significant.
Since the entire final state can be observed in the streamer cham- ber, it is interesting to examine the hadrons in the events to see if their characteristics differ from those in nondimuon ev.;nts. To make

-lO-
-200 600 IO00 M + - (MeV) 5-n PLtL ,,Sl.?
Fin. lla. XT: distribution of muon pairs with aLmass between 200 MeV and 380 NeV. lib. XF distribution of muon pairs with a mass between 380 MeV and 600 IJeV. 1lC. XF distribution of muon pairs with a mass between 600 >:eV and 900 PleV.
Fig. 10. Dimuon mass spectrum after subtraction of the cal- culated hadron punchthrough and the largest possible contribution from rl and 0 Dalitz decays.
600 < M,, < 900 600 < M,, < 900
,,I-L-L-l-1 I I 0.4 0.6 0.8 I .o
1-n XF ,Pl<l
-ll-
80 - I I I r I I
-cI
y 60 r” 7--J-
5: ;i 30 - l- Fig. 12. Transverse mo- z mentum distribution of
muon pairs <pT> 420 MeV.
0 I 0 500 IO00 I 500
5-n pT (MeVk) ,,e<.s
Fig. 13a. Transverse momen- tum distributions of muon pairs 200 < Mli+li- < 380. b. Transverse momentum dis- tribution of muon pairs 380 < MU+P- < 620. c. Transverse momentum dis- tribution of muon pairs 620 < Mp+p-
40
30
20
IO
0
s x 1.15
r” 20
s: x 2 IO W
zl
0
x 0.72
20
I I / I I
(a) 200 < Mpp < 380
(b)
200 800 I200 PT (MeV/c) ,,P.B’C

-12-
Fig. 14. Acceptance for won pairsks a function of the de- cay angl.e of the u+ with re- spect to the pair direction in its c of m system.
0.6
0.2
0 -0.8 -0.4 0 0.4 0.8
I -,I case I,...”
’ ! i ’ ’ I ’ ’ ’ ’
I I I I 1 I I
Fig. 15. Decay Distribution of p+ with respect to pair direction in its c of m system.
X 2 for 4 Degrees of Freedom
Flat si.n20 (1 -t- cos+l)
7.1 4.6 10.3
-13-
40 r-T-l-7
t
210~Mp:p-~30C
(01 )
0 0.4 cose
~600 /
0 0.4 ,,P.A13
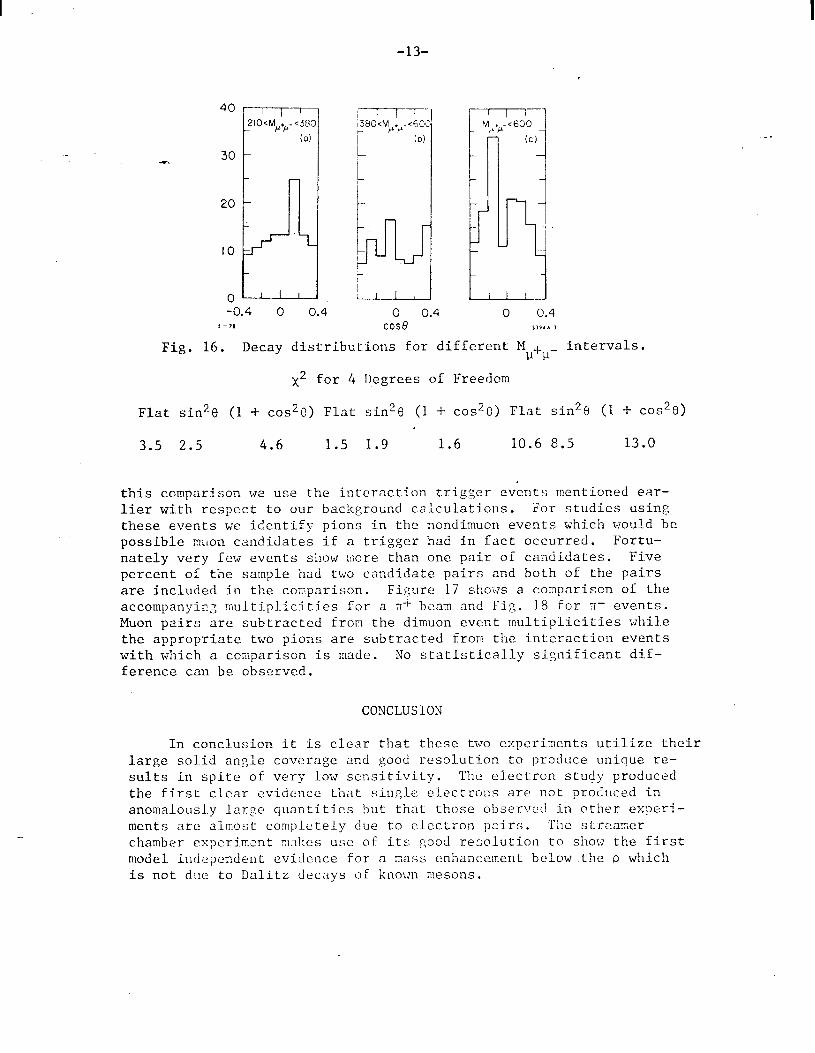
Fig. 16. Decay distributions for different M u+u-
intervals.
x2 for 4 Degrees of Freedom
Flat sin28 (1 + cos20) Flat sin28 (1 -i- COS’O) Flat sin28 (1 + Cos20)
3.5 2.5 4.6 1.5 1.9 1.6 10.6 8.5 13.0
this comparison we use the intcraction trigger events mentioned ear- lier with respect to our background calculations. r‘or studies using these events WC. identify pions in the nondimuon events which would be possible muon candidates if a trigger had in fact occurred. Fortu- nately very few events show more than one pair of candidates. Five percent of the sample had two candidate pairs and both of the pairs are included in the comparison. Figure 17 shows a comparison of the accompanying multiplicities for a T+ beam and Fig. 18 for 7~- events. Muon pairs are subtracted from the dimuon event multiplicities while the appropriate two pions are subtracted from the interaction events with which a comparison is made. No statistically significant dif- ference can be observed.
CONCLUSION
In conclusion it is clear that these two experiments utilize their large solid angle coverage and good resolution to produce unique re- sults in spite of very low sensitivity. The electron study produced the first clear evidence that single electro:ls are not produced in anomal.0usl.y large quantiti.es but that those observed in other experi- ments are almost completely clue to electron p3irS. Tile streamer chamber expcrimznt makes use of its good resolution to show t'ne first model independent evidence for ;I mass enhancemerlt below "the p which is not due to Dalitz decays of known mesons.

-14-
0 2 4 6
TT+ EECM 0 Muon l P:on
0 2 4 6 0 2 4 6 8 NUMBER OF PRONGS ,,‘..I.
Fig. 17. Accompanying multiplicity distributions for muon pair events and for pairs of pions which are incLdent on the hadron absorber in an interaction experiment.
<M > = 288 1-1u
<Mvp> = 470 <M > = 864 1J-P
<M > = 316 <M > = 512 4-l > = 852 lT7-r 7rTr mr <rl > = 2.71 + .2 <q > = 3.2 t .28
1-11-1 lJ!J <n > = 2.83 k .27
PlJ -I 71X> = 3.30 + .3 <q > = 3.27 i .26 - <n > = 3.31 Z!I .14
lJ?J 1.11-r
Fig. 18. Accompanying multiplicity distributions -for muon pair event:; and for pairs of pions T:,hi.ch aie incident on the hadron absorber in an interact-i.on experiment.
41 > = 309 41 > = 473 <M > = 788 lJlJ lJlJ UIJ <M > = 309 41 > = 494 <M > = 895
7171 7?7r TrTl <n > = 2.63 ~tl .2
1JU -CT-, > = 2.69 r!z .2 -CT-, > = 3.05 + .26
lJl! Ull <rl > = 2.88 -i .22 <I? > = 3.09 ? .18 <rj > = 3.12 + .lO ?T7T 7: ;;I Ti ir
-15-
REFERENCES
1. J. Bartke et al. Nucl. Phys., BllS, 360 (1377). ----- 2. C. H. Lai and C. Q"igg, FN-296 (1976); C. Quigg and J. D. Jackson,
(B.c.R.L.-18487 (1968). 3. J. D. Bjorkcn and 11. Weisberg, Phys. Rev. D13 1405 (1976). 4.
--) M. Duong-van and R. Blankenbecler, to be published.
5. 6.
G. R. Farrar and S. C. Frautschi, Phys, Rev. Lett. 36, 1017 (1976). K. J. Anderson et.al., Phys. Rev. Lett. 36, 799 (i976).