Embed Size (px)
Citation preview

SLEPTON MASS RECONSTRUCTION AND
DETECTOR RESOLUTION
Bruce Schumm
University of California at Santa Cruz
ALCPG Workshop, Snowmass Colorado
August 14-28, 2005
Special Recognition: Troy Lau, UCSC senior thesis student (now at University of Michigan)

Motivation for Study
• Is there information on Slepton masses in the forward region?
• Can we detect it above backgrounds?
• Are our detectors up to the task?
In doing the study, we also found that questions can be raised about the central region.

THE UCSC SUSY GROUP
Past
Sharon Gerbode (now at Cornell)Heath Holguin (now a UCSC grad student)
Troy Lau (Now at Michigan) Paul Mooser (Software engineer)
Adam Pearlstein (now at Colorado State)Joe Rose
Present
Ayelet LorberbaumEric Wallace
Matthew vegas
Work accomplished by exploiting UCSC’s senior thesis requirement…

Motivation
To explore the effects of limited detector resolution on our ability to measure SUSY parameters in the forward (|
cos()| > .8) region.

selectrons
LSP
SPS 1 Spectroscopy:
At Ecm = 1Tev, selectrons and neutralino are
light.
Beam/Brehm:√smin=1 √smax=1000 = .29sz = .11 (mm)

-0.9 -0.8 -0.7 -0.6 -0.5 -0.4 -0.3 -0.2 -0.1 0.0 0.1 0.2 0.3 0.4 0.5 0.6 0.7 0.8 0.91,000
2,000
3,000
4,000
5,000
6,000
7,000
8,000
9,000
10,000
11,000
12,000
13,000
14,000
15,000
16,000
SUSY: Particle cos(theta) (no cuts)
SPS1A at 1 TeVSelectrons vs. cos()
Electrons vs. cos()
Roughly ½ of statistics above |cos()| of 0.8,
but…

Energy Distribution
0
50
100
150
200
250
300
350
400
450
0 7 14
22
29
36
43
50
58
65
72
79
86
94
101
108
115
122
130
137
144
151
158
166
173
180
187
194
202
209
216
223
230
238
245
252
259
266
274
281
288
Energy GeV
Co
un
ts
• sample electron energy distribution Mselectron = 143.112 (SPS1A)
Lower Endpoint
Upper Endpoint
Electron energy distributionwith beam/bremm/ISR (.16%). No detector effects or beam energy spread.

The spectrum is weighted towards higher energy at high |cos()|, so there’s more information in the forward region than one might expect.
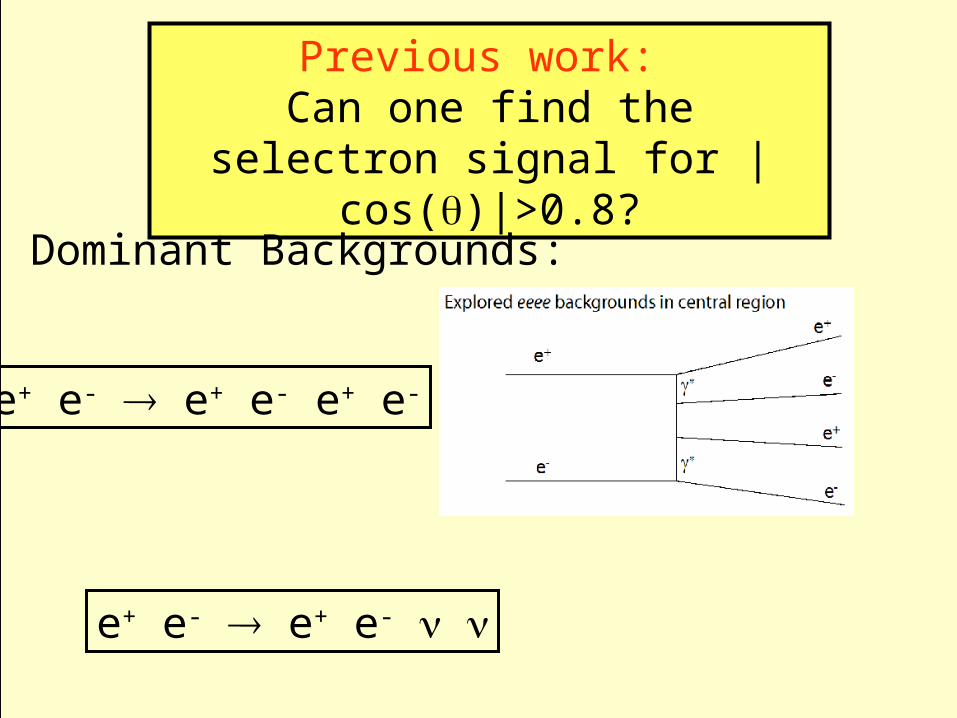
Previous work: Can one find the selectron signal for |
cos()|>0.8?
Dominant Backgrounds:
e+ e- e+ e- e+ e-
e+ e- e+ e-
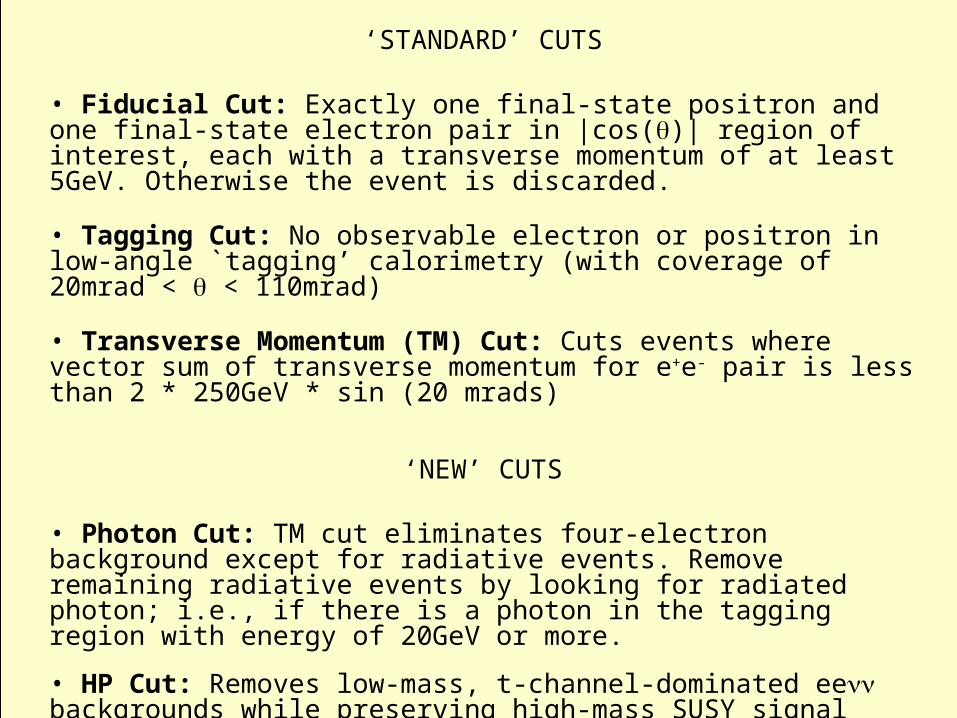
‘STANDARD’ CUTS
• Fiducial Cut: Exactly one final-state positron and one final-state electron pair in |cos()| region of interest, each with a transverse momentum of at least 5GeV. Otherwise the event is discarded.
• Tagging Cut: No observable electron or positron in low-angle `tagging’ calorimetry (with coverage of 20mrad < < 110mrad)
• Transverse Momentum (TM) Cut: Cuts events where vector sum of transverse momentum for e+e- pair is less than 2 * 250GeV * sin (20 mrads)
‘NEW’ CUTS
• Photon Cut: TM cut eliminates four-electron background except for radiative events. Remove remaining radiative events by looking for radiated photon; i.e., if there is a photon in the tagging region with energy of 20GeV or more.
• HP Cut: Removes low-mass, t-channel-dominated ee backgrounds while preserving high-mass SUSY signal

Before H-P
After H-P
After ‘photon cut’, which eliminates the four-electron back-ground, the dominant background is ee. Manipulation of the beam polarization, combined with application of the ‘HP Cut’ reduces background to minimal levels, even in forward region.
Ignore backgrounds in detector resolution studies.
Pe- = +80%Pe+ = -50%
Pe- = +80%Pe+ = 0%
|cos| < 0.994
Standard Model Backgrounds

Fitting the Endpoints for the Selectron Mass
For now, we have done one-dimensional fits (assume 0 mass known)
Vary SUSY parameters minutely around SPS1A point so that selectron mass changes while 0 mass remains fixed.
Generate ‘infinite’ (~1000 fb-1) at each point to compare to 115 fb-1 data sample; minimize 2 vs. mselectron to find best-fit selectron mass.
Repeat for 120 independent data samples; statistics from spread around mean rather than directly from 2 contour.
SPS1Amselectron

Selectron Mass Study Scenarios
12 scenarios were considered:
Detector Resolution
Perfect (no smearing) and SDMAR01
Detector Coverage
|cos| < 0.8 and |cos| < 0.994
Beam Spread
0%, 0.16%, and 1.0%

RMS Error / Error on Error COSTHETA 0-.8
0.0730.078
0.194
0.1060.111
0.200
0.000
0.050
0.100
0.150
0.200
0.250
-0.10% 0.10% 0.30% 0.50% 0.70% 0.90% 1.10%Beamspread
RM
S E
rro
r
PERFECT
SDMAR01
First, just look in the central region (|cos| < 0.8)
TESLA (0.13)

Error for COSTHETA Ranges
0.0380.046
0.086
0.0730.078
0.194
0.080
0.0900.097
0.1060.111
0.200
0.000
0.050
0.100
0.150
0.200
0.250
-0.01% 0.19% 0.39% 0.59% 0.79% 0.99% 1.19%Beamspread
Err
or
PERFECT 0-1
PERFECT 0-.8
SDMAR01 0-1
SDMAR01 0-.8
Now, include the full region (|cos| < 0.994)

0.046
0.104
0.064
0.076
0.000
0.020
0.040
0.060
0.080
0.100
0.120
0.140
0.160
-0.10% 0.40% 0.90%
Beamspread
RM
S E
rro
r
0.078
0.089
0.113
0.128
0.000
0.020
0.040
0.060
0.080
0.100
0.120
0.140
0.160
-0.10% 0.10% 0.30% 0.50% 0.70% 0.90% 1.10%
Beamspread
RM
S E
rro
r
SDMAR01
NO MATERIAL
PERFECT RES-OLUTION
PERFECT RES., NO MATERIAL
|cos| < 0.8 |cos| < 0.994
Is it the point resolution, or the material?

Tentative Conclusions to Draw
1. Due to the stiffening of the spectrum in the forward region, there is a surprising amount of information there. For this scenario, most of the information on slepton masses lies in the forward (|cos| > 0.8) region.
2. For cold-technology beamspread (0.14%), SDMAR01 resolution has not reached the point of diminishing returns. The physics seems to be limited by detector resolution. Point resolution is the dominant issue.
3. Any gains that can be made in p resolution in the forward region would reap large rewards for light sleptons.