Embed Size (px)
Citation preview

slide 1CHAPTER 6 Unemployment
In Chapter 6, you will learn…
…about the natural rate of unemployment:
what it means
what causes it
understanding its behavior in the real world
slide 2CHAPTER 6 Unemployment
Natural rate of unemployment
Natural rate of unemployment: The average rate of unemployment around which the economy fluctuates.
In a recession, the actual unemployment rate rises above the natural rate.
In a boom, the actual unemployment rate falls below the natural rate.
slide 3CHAPTER 6 Unemployment
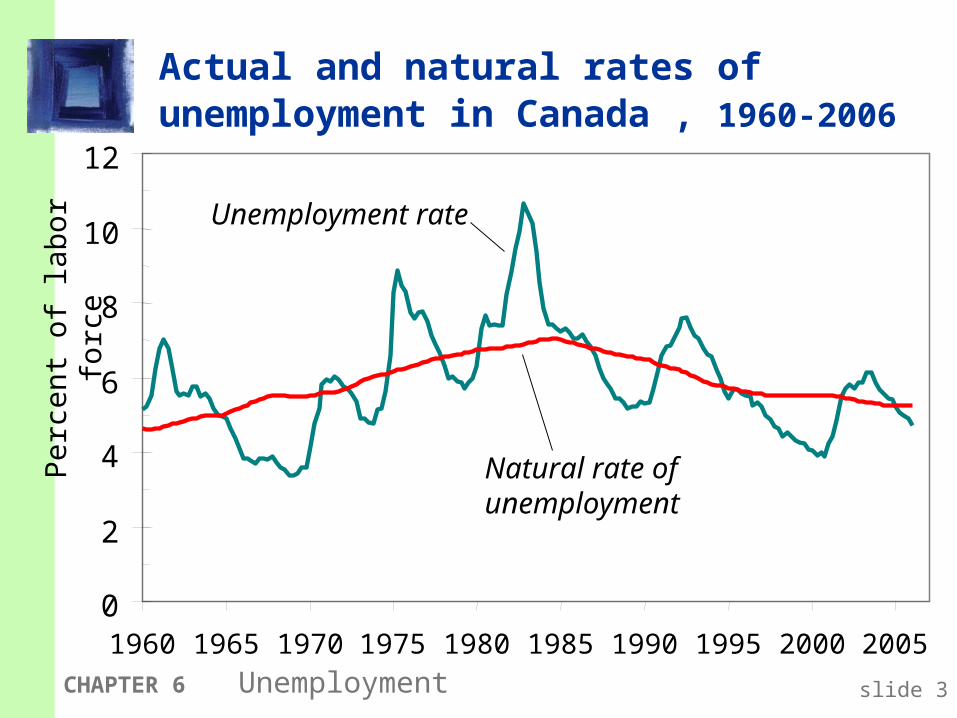
Actual and natural rates of unemployment in Canada , 1960-2006
Per
cent
of l
abor
forc
e
0
2
4
6
8
10
12
1960 1965 1970 1975 1980 1985 1990 1995 2000 2005
Unemployment rate
Natural rate of unemployment
slide 4CHAPTER 6 Unemployment
Why is there unemployment?
If job finding were instantaneous (f = 1), then all spells of unemployment would be brief, and the natural rate would be near zero.
There are two reasons why f < 1:
1. job search
2. wage rigidity
slide 5CHAPTER 6 Unemployment
Job search & frictional unemployment
frictional unemployment: caused by the time it takes workers to search for a job
occurs even when wages are flexible and there are enough jobs to go around
occurs because workers have different abilities, preferences jobs have different skill requirements geographic mobility of workers not instantaneous flow of information about vacancies and job
candidates is imperfect
slide 6CHAPTER 6 Unemployment
Sectoral shifts
def: Changes in the composition of demand among industries or regions.
example: Technological change more jobs repairing computers, fewer jobs repairing typewriters
example: A new international trade agreement labor demand increases in export sectors, decreases in import-competing sectors
Result: frictional unemployment
slide 7CHAPTER 6 Unemployment
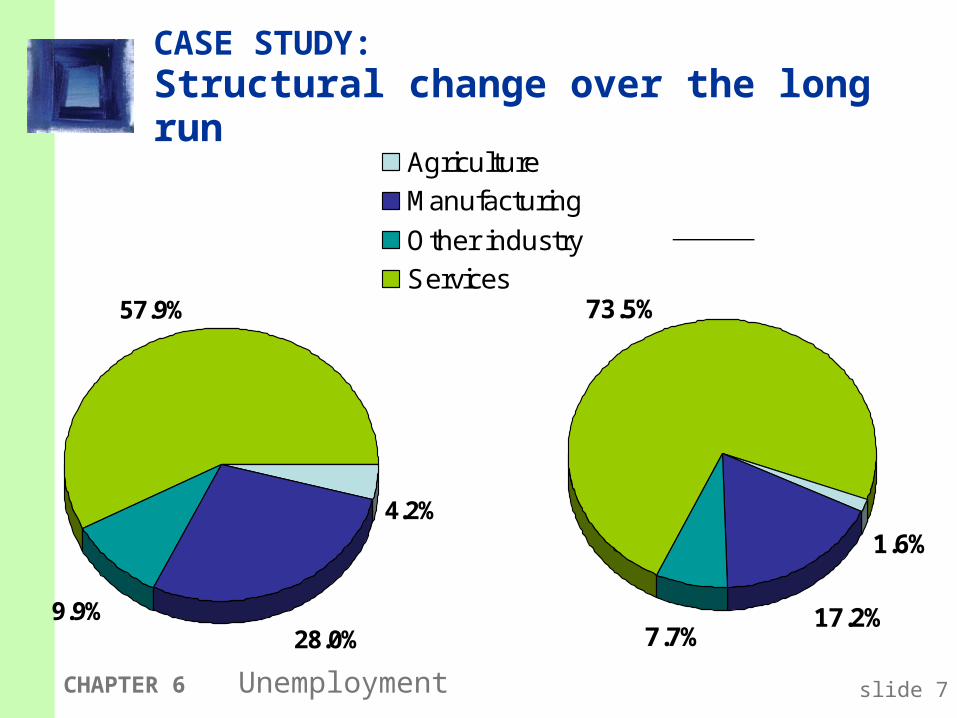
CASE STUDY: Structural change over the long run
4.2%
28.0%9.9%
57.9%
Agriculture
Manufacturing
Other industry
Services
1960
1.6%
17.2%7.7%
73.5%
2000
slide 8CHAPTER 6 Unemployment
More examples of sectoral shifts
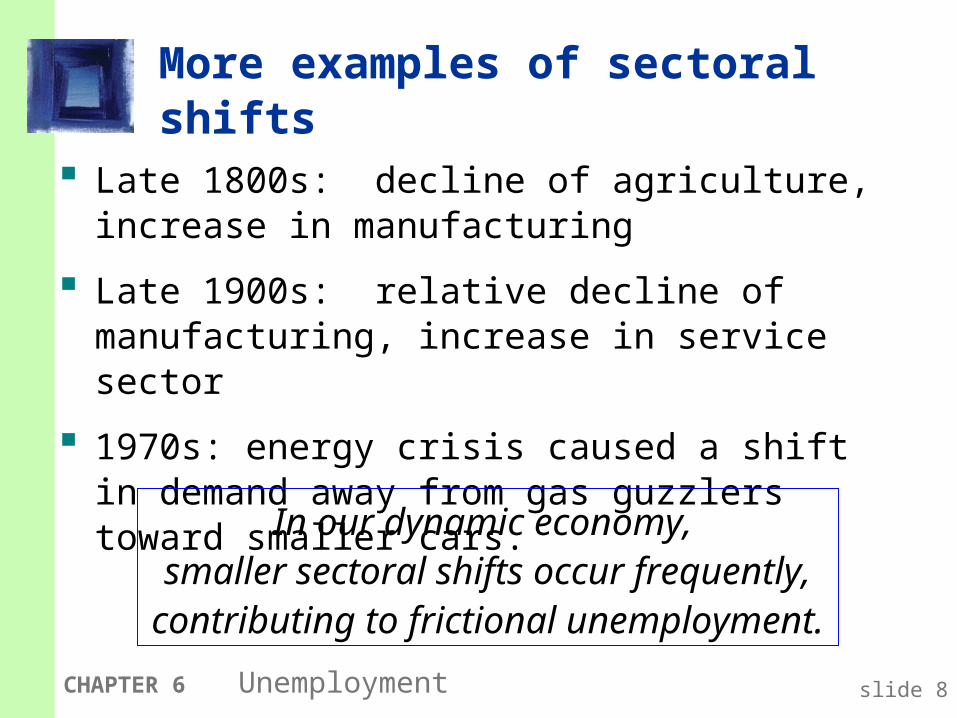
Late 1800s: decline of agriculture, increase in manufacturing
Late 1900s: relative decline of manufacturing, increase in service sector
1970s: energy crisis caused a shift in demand away from gas guzzlers toward smaller cars.
In our dynamic economy, smaller sectoral shifts occur frequently, contributing to frictional unemployment.

slide 9CHAPTER 6 Unemployment
Public policy and job search
Govt programs affecting unemployment
Govt employment agencies:disseminate info about job openings to better match workers & jobs.
Public job training programs:help workers displaced from declining industries get skills needed for jobs in growing industries.
slide 10CHAPTER 6 Unemployment
Unemployment insurance (UI)
UI pays part of a worker’s former wages for a limited time after losing his/her job.
UI increases search unemployment, because it reduces the opportunity cost of being unemployed the urgency of finding work f
Studies: The longer a worker is eligible for UI, the longer the duration of the average spell of unemployment.

slide 11CHAPTER 6 Unemployment
By allowing workers more time to search,
UI may lead to better matches between jobs and workers,
which would lead to greater productivity and higher incomes.
Benefits of UI
slide 12CHAPTER 6 Unemployment
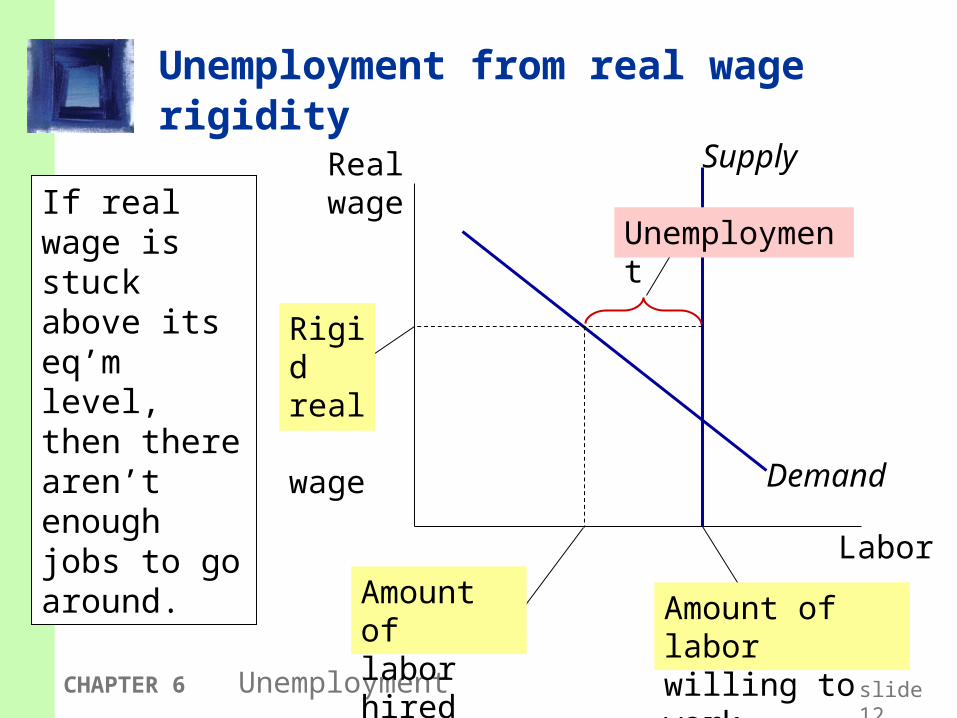
Unemployment from real wage rigidity
Labor
Real wage
Supply
Demand
Unemployment
Rigid
real wage
Amount of labor willing to work
Amount of labor hired
If real wage is stuck above its eq’m level, then there aren’t enough jobs to go around.
slide 13CHAPTER 6 Unemployment
Unemployment from real wage rigidity
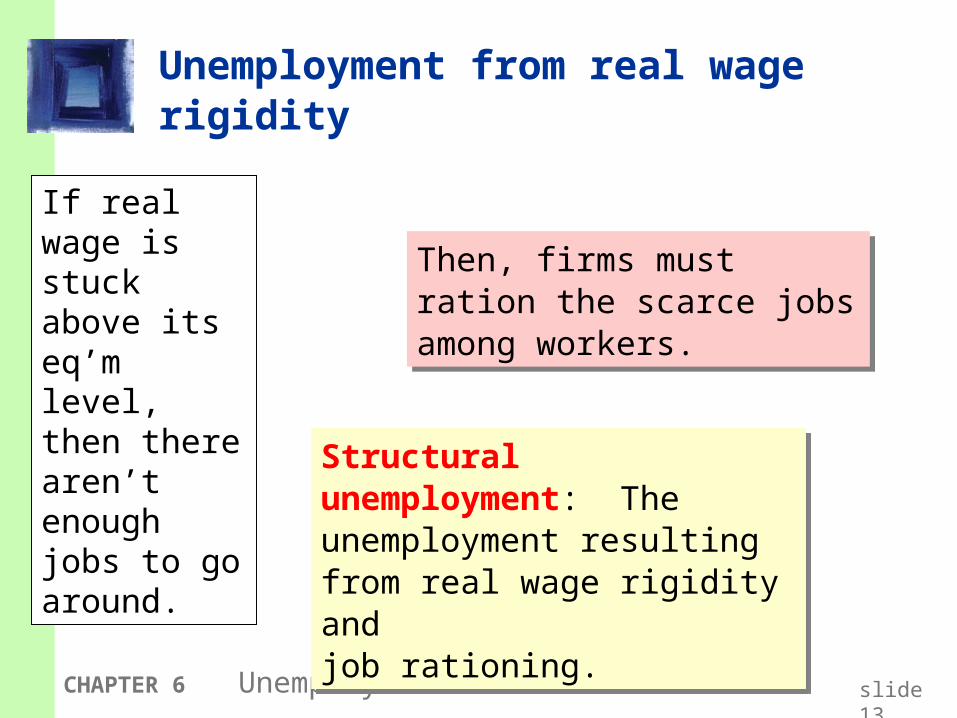
Then, firms must ration the scarce jobs among workers.
Then, firms must ration the scarce jobs among workers.
Structural unemployment: The unemployment resulting from real wage rigidity and job rationing.
Structural unemployment: The unemployment resulting from real wage rigidity and job rationing.
If real wage is stuck above its eq’m level, then there aren’t enough jobs to go around.
slide 14CHAPTER 6 Unemployment
Reasons for wage rigidity
1. Minimum wage laws
2. Labor unions
3. Efficiency wages
slide 15CHAPTER 6 Unemployment
1. The minimum wage
The min. wage may exceed the eq’m wage of unskilled workers, especially teenagers.
Studies: a 10% increase in min. wage reduces teen employment by 1-3%
But, the min. wage cannot explain the majority of the natural rate of unemployment, as most workers’ wages are well above the min. wage.
slide 16CHAPTER 6 Unemployment
2. Labor unions
Unions exercise monopoly power to secure higher wages for their members.
When the union wage exceeds the eq’m wage, unemployment results.
Insiders: Employed union workers whose interest is to keep wages high.
Outsiders: Unemployed non-union workers who prefer eq’m wages, so there would be enough jobs for them.
slide 17CHAPTER 6 Unemployment
3. Efficiency wage theory
Theories in which higher wages increase worker productivity by: attracting higher quality job applicants increasing worker effort, reducing “shirking” reducing turnover, which is costly to firms improving health of workers
(in developing countries)
Firms willingly pay above-equilibrium wages to raise productivity.
Result: structural unemployment.
slide 18CHAPTER 6 Unemployment
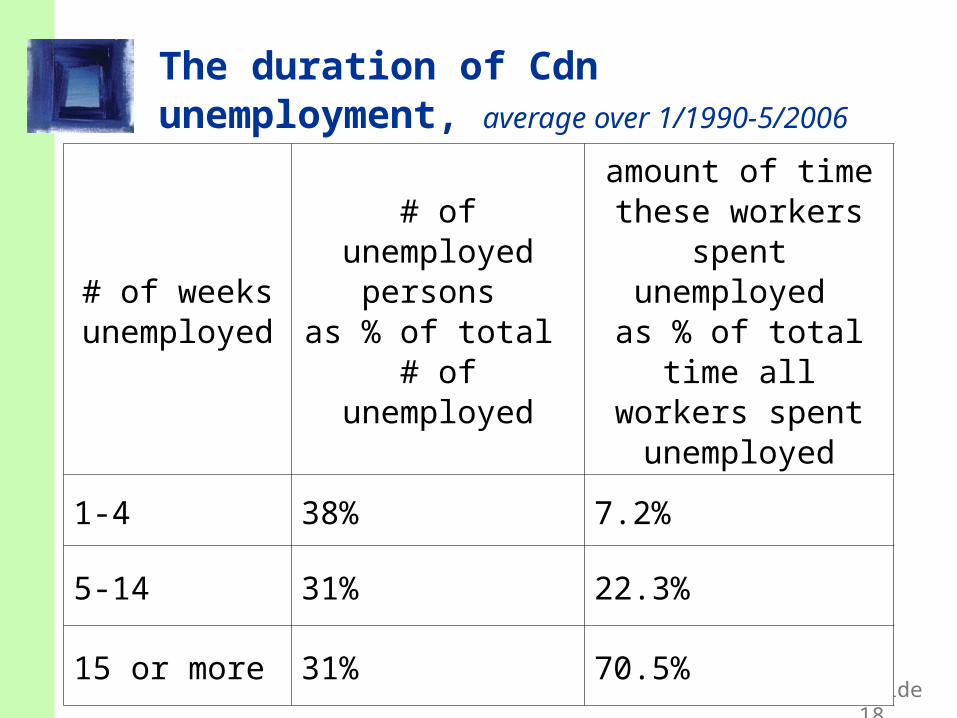
The duration of Cdn unemployment, average over 1/1990-5/2006
# of weeks unemployed
# of unemployed persons
as % of total # of unemployed
amount of time these workers spent
unemployed as % of total time all
workers spent unemployed
1-4 38% 7.2%
5-14 31% 22.3%
15 or more 31% 70.5%
slide 19CHAPTER 6 Unemployment
The duration of unemployment
The data: More spells of unemployment are short-term
than medium-term or long-term. Yet, most of the total time spent unemployed
is attributable to the long-term unemployed.
This long-term unemployment is probably structural and/or due to sectoral shifts among vastly different industries.
Knowing this is important because it can help us craft policies that are more likely to work.
slide 20CHAPTER 6 Unemployment
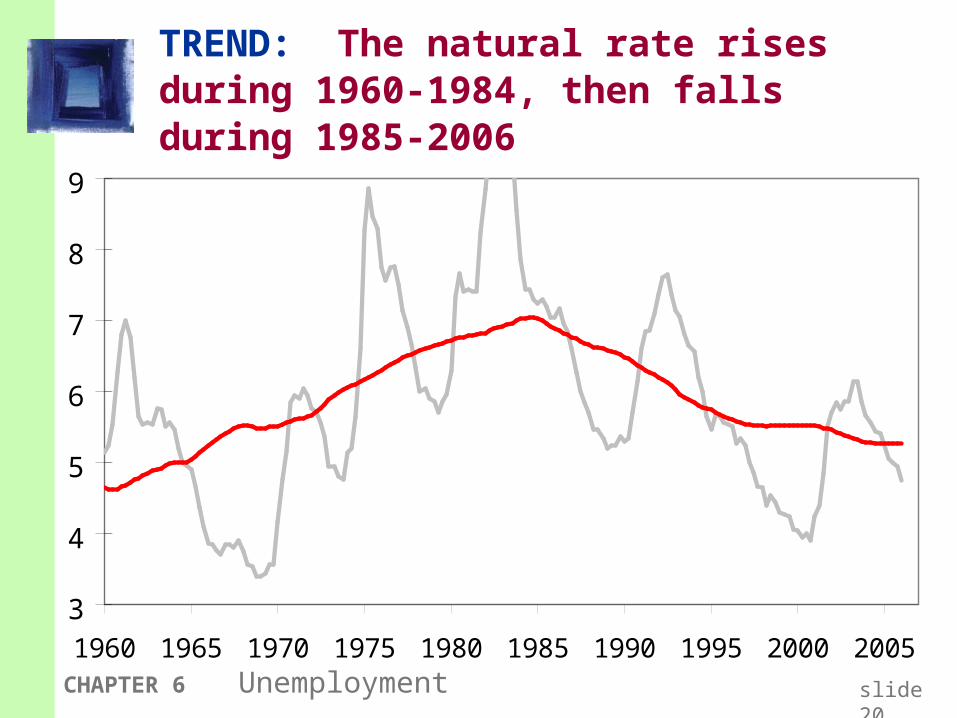
TREND: The natural rate rises during 1960-1984, then falls during 1985-2006
3
4
5
6
7
8
9
1960 1965 1970 1975 1980 1985 1990 1995 2000 2005
slide 21CHAPTER 6 Unemployment
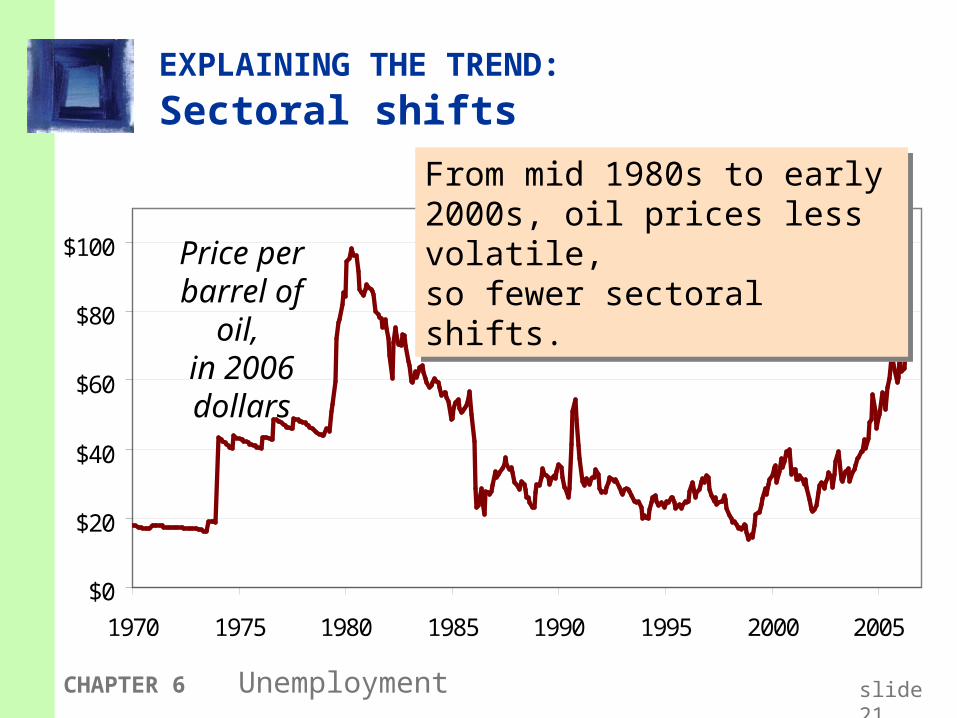
EXPLAINING THE TREND:
Sectoral shifts
$0
$20
$40
$60
$80
$100
1970 1975 1980 1985 1990 1995 2000 2005
Price per barrel of oil,
in 2006 dollars
From mid 1980s to early 2000s, oil prices less volatile, so fewer sectoral shifts.
From mid 1980s to early 2000s, oil prices less volatile, so fewer sectoral shifts.
slide 22CHAPTER 6 Unemployment
EXPLAINING THE TREND:Demographics
1970s: The Baby Boomers were young. Young workers change jobs more frequently (high value of s).
Late 1980s through today: Baby Boomers aged. Middle-aged workers change jobs less often (low s).
slide 23
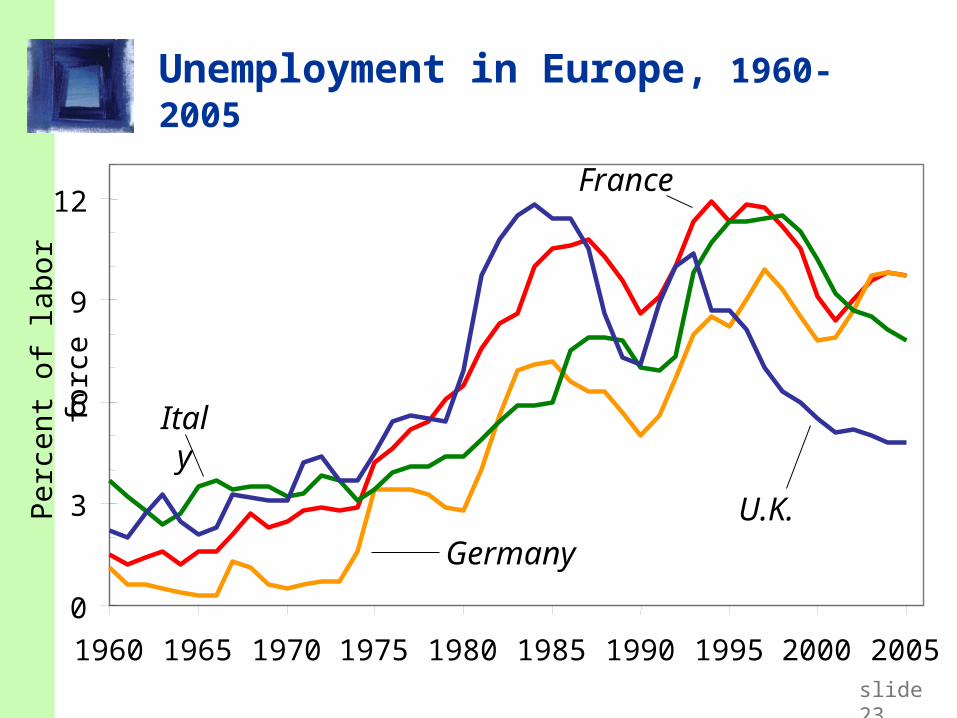
Unemployment in Europe, 1960-2005
Per
cent
of l
abor
forc
e
Italy
Germany
France
U.K.
0
3
6
9
12
1960 1965 1970 1975 1980 1985 1990 1995 2000 2005
slide 24CHAPTER 6 Unemployment
The rise in European unemployment
Shock Technological progress has shifted labor demand from unskilled to skilled workers in recent decades.
Effect in United StatesAn increase in the “skill premium” – the wage gap between skilled and unskilled workers.
Effect in EuropeHigher unemployment, due to generous govt benefits for unemployed workers and strong union presence.
slide 25CHAPTER 6 Unemployment
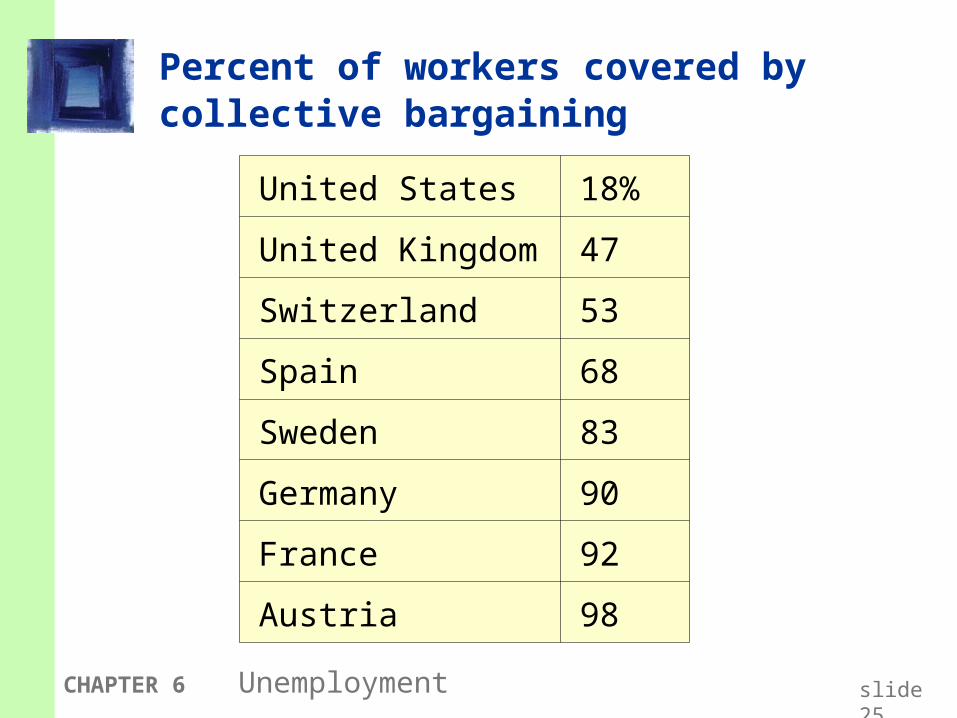
Percent of workers covered by collective bargaining
United States 18%
United Kingdom 47
Switzerland 53
Spain 68
Sweden 83
Germany 90
France 92
Austria 98
Chapter SummaryChapter Summary
1. The natural rate of unemployment the long-run average or “steady state” rate of
unemployment depends on the rates of job separation and job
finding
2. Frictional unemployment due to the time it takes to match workers with jobs may be increased by unemployment insurance
CHAPTER 6 Unemployment slide 26
Chapter SummaryChapter Summary
3. Structural unemployment results from wage rigidity: the real wage remains
above the equilibrium level caused by: minimum wage, unions, efficiency
wages
4. Duration of unemployment most spells are short term but most weeks of unemployment are attributable
to a small number of long-term unemployed persons
CHAPTER 6 Unemployment slide 27
Chapter SummaryChapter Summary
5. Behavior of the natural rate in Canada rose from 1960 to early 1980s, then fell possible explanations:
trends in real minimum wage, union membership, prevalence of sectoral shifts, and aging of the Baby Boomers
CHAPTER 6 Unemployment slide 28

Chapter SummaryChapter Summary
6. European unemployment has risen sharply since 1970 probably due to generous unemployment benefits,
strong union presence, and a technology-driven shift in demand away from unskilled workers
CHAPTER 6 Unemployment slide 29