Embed Size (px)
Citation preview
slide 1
The Data of Macroeconomics
slide 2
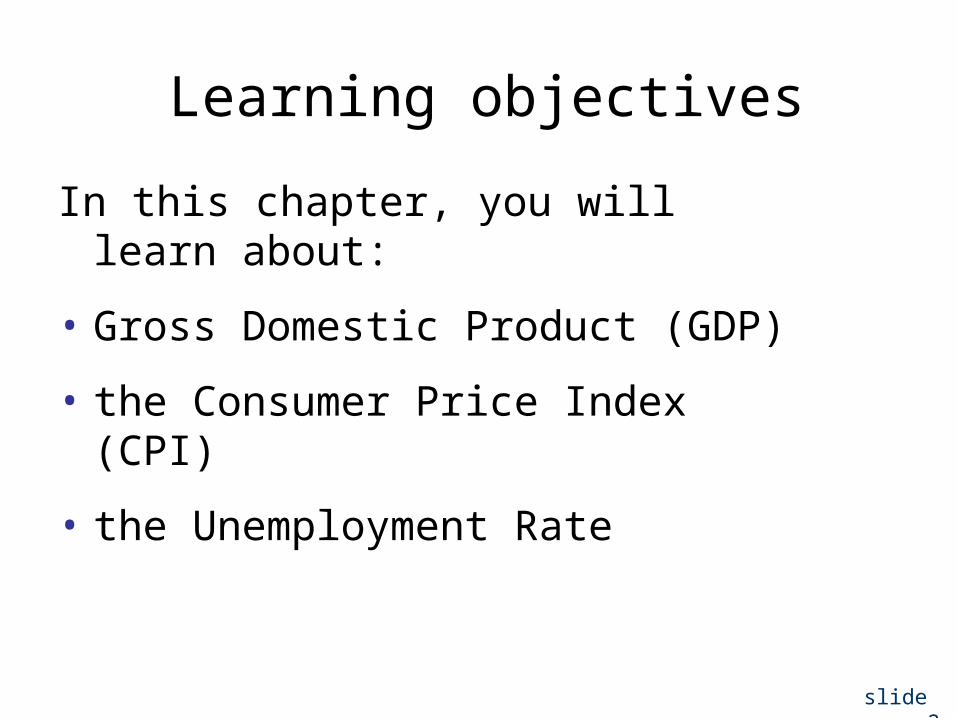
Learning objectives
In this chapter, you will learn about:
• Gross Domestic Product (GDP)
• the Consumer Price Index (CPI)
• the Unemployment Rate
slide 3
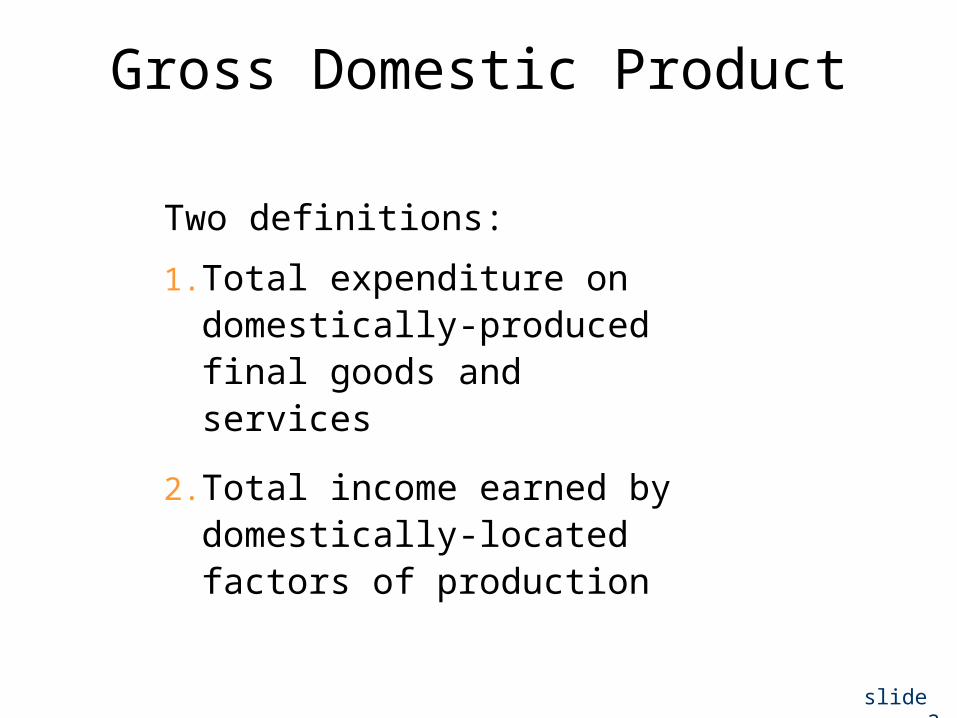
Gross Domestic Product
Two definitions:
1. Total expenditure on domestically-produced final goods and services
2. Total income earned by domestically-located factors of production
slide 4
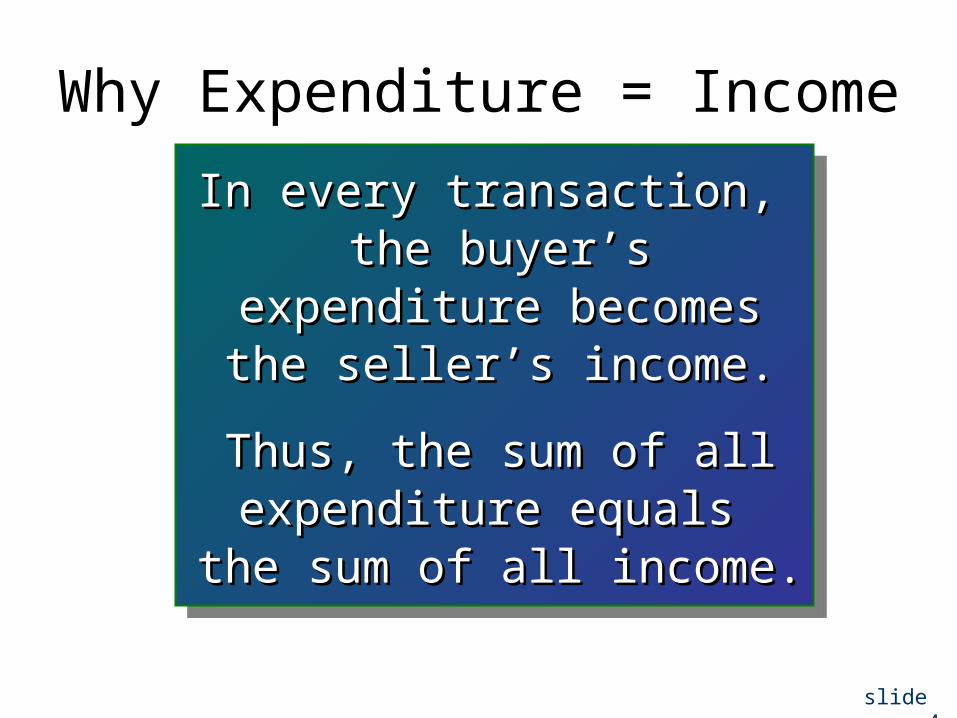
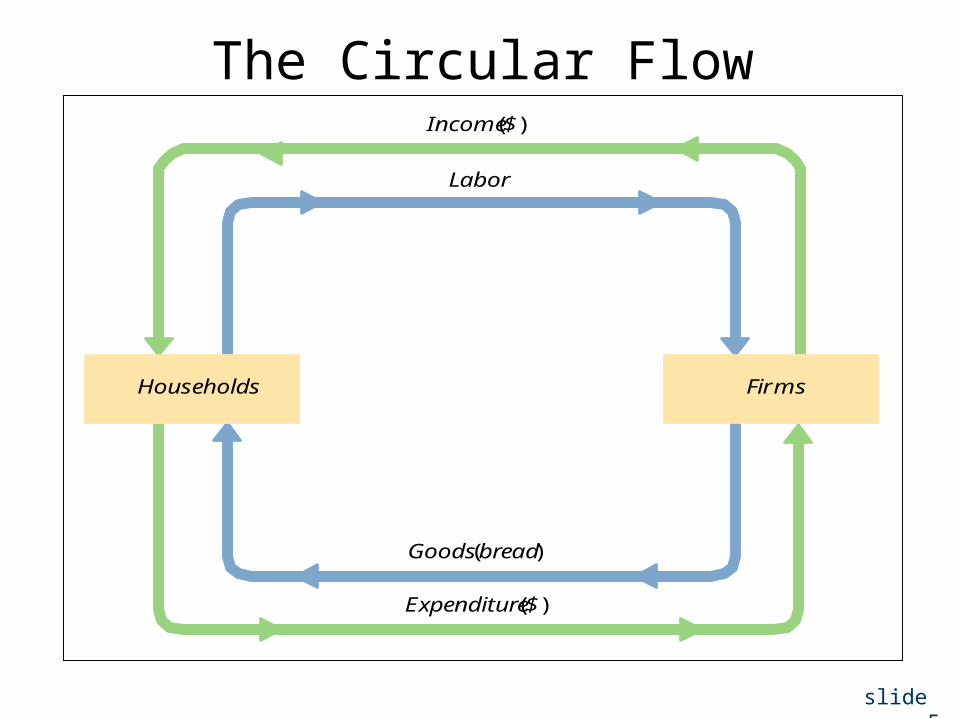
Why Expenditure = Income
In every transaction, In every transaction, the buyer’s expenditure the buyer’s expenditure
becomes the seller’s becomes the seller’s income.income.
Thus, the sum of all Thus, the sum of all expenditure equals expenditure equals
the sum of all income.the sum of all income.
In every transaction, In every transaction, the buyer’s expenditure the buyer’s expenditure
becomes the seller’s becomes the seller’s income.income.
Thus, the sum of all Thus, the sum of all expenditure equals expenditure equals
the sum of all income.the sum of all income.
slide 5
The Circular FlowIncome ($)
Labor
Goods (bread)
Expenditure ($)
Households Firms

slide 6
GDP as Income - Example
• A farmer grows a bushel of wheat and sells it to a miller for $1.00.
• The miller turns the wheat into flour and sells it to a baker for $3.00.
• The baker uses the flour to make a loaf of bread and sells it to an engineer for $6.00.
• The engineer eats the bread.
Compute– value added at each stage of production– GDP
slide 7
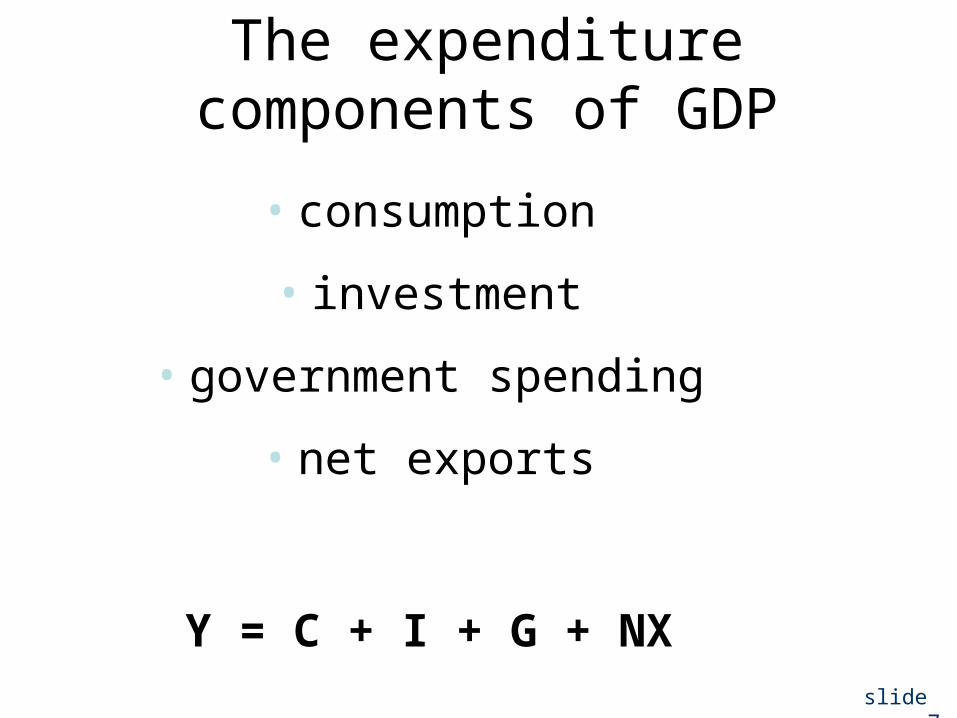
The expenditure components of GDP
• consumption
• investment
• government spending
• net exports
Y = C + I + G + NX
slide 8
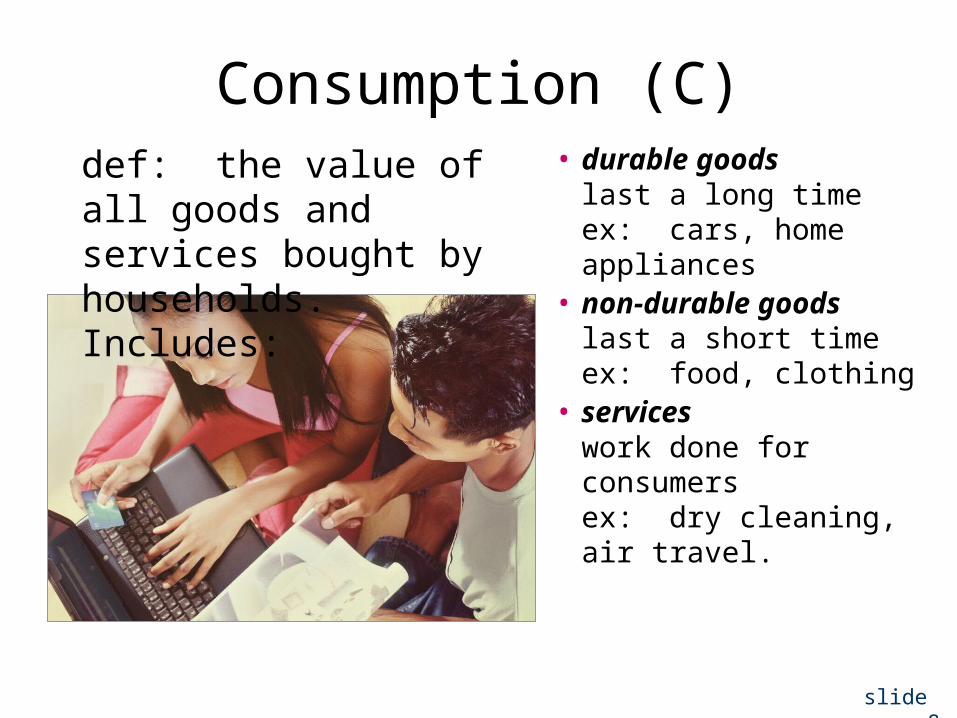
Consumption (C)• durable goods
last a long time ex: cars, home appliances
• non-durable goodslast a short time ex: food, clothing
• serviceswork done for consumers ex: dry cleaning, air travel.
def: the value of all goods and services bought by households. Includes:

slide 9
U.S. Consumption - 2003
$ billions
% of GDP
Consumption $7,757.4 70.6%
Durables 941.6 8.6
Nondurables 2,209.7 20.1
Services 4,606.2 41.9
$ billions
% of GDP
Consumption $7,757.4 70.6%
Durables 941.6 8.6
Nondurables 2,209.7 20.1
Services 4,606.2 41.9
slide 10
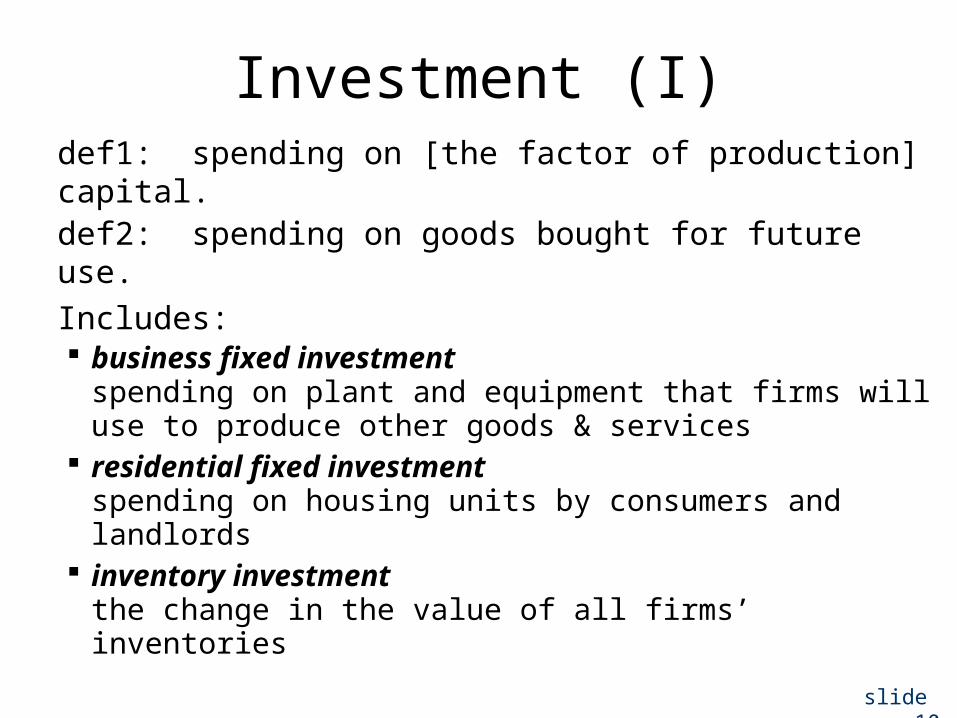
Investment (I)def1: spending on [the factor of production] capital.def2: spending on goods bought for future use.
Includes: business fixed investment
spending on plant and equipment that firms will use to produce other goods & services
residential fixed investmentspending on housing units by consumers and landlords
inventory investmentthe change in the value of all firms’ inventories

slide 11
U.S. Investment, 2003
$ billions
% of GDP
Investment $1,670.6 15.2%
Business fixed 1,110.6 10.1
Residential fixed 562.4 5.1
Inventory -2.4 -0.02
$ billions
% of GDP
Investment $1,670.6 15.2%
Business fixed 1,110.6 10.1
Residential fixed 562.4 5.1
Inventory -2.4 -0.02

slide 12
Investment vs. Capital
• Capital is one of the factors of production (a stock).
At any given moment, the economy has a certain overall stock of capital.
• Investment is spending on new capital (a flow).

slide 13
Investment vs. CapitalExample (assumes no depreciation):
1/1/2004: economy has $500b worth of capital
during 2004:investment = $37b
1/1/2005: economy will have $537b worth of capital

slide 14
You Try:
Stock or flow?
The balance on your credit card statement.
How much you study economics outside of class.
The size of your compact disc collection.
The inflation rate.
The unemployment rate.
slide 15
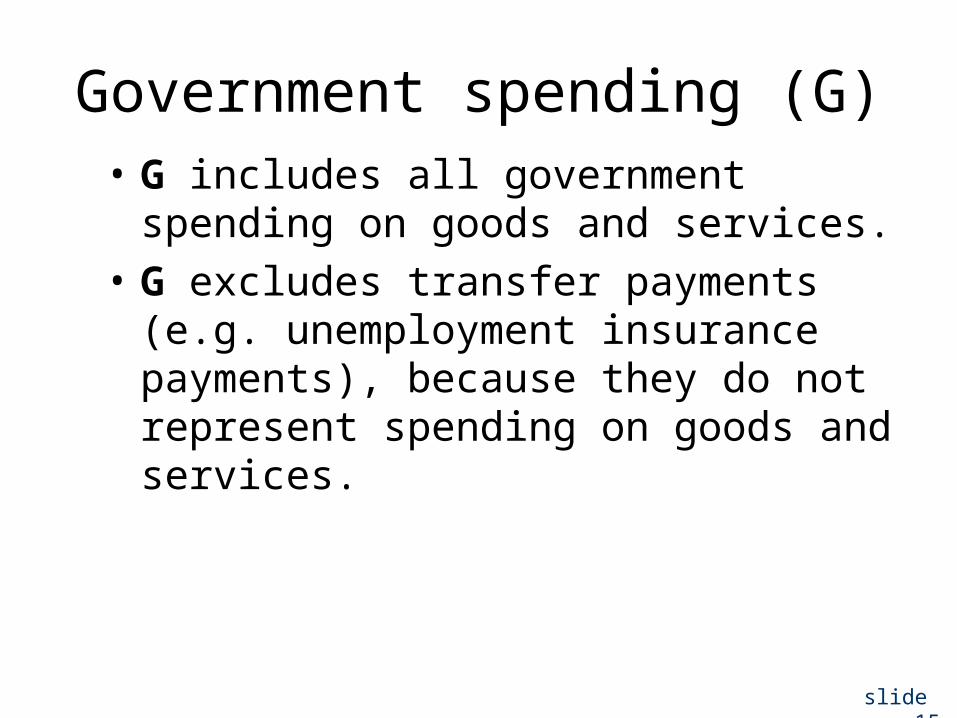
Government spending (G)• G includes all government spending on
goods and services.• G excludes transfer payments
(e.g. unemployment insurance payments), because they do not represent spending on goods and services.

slide 16
Government spending, 2003
$ billions
% of GDP
Gov spending $2,054.8 18.7%
Federal 757.2 6.9
Non-defense 259.9 2.4
Defense 497.3 4.5
State & local 1,297.6 11.8
$ billions
% of GDP
Gov spending $2,054.8 18.7%
Federal 757.2 6.9
Non-defense 259.9 2.4
Defense 497.3 4.5
State & local 1,297.6 11.8
slide 17
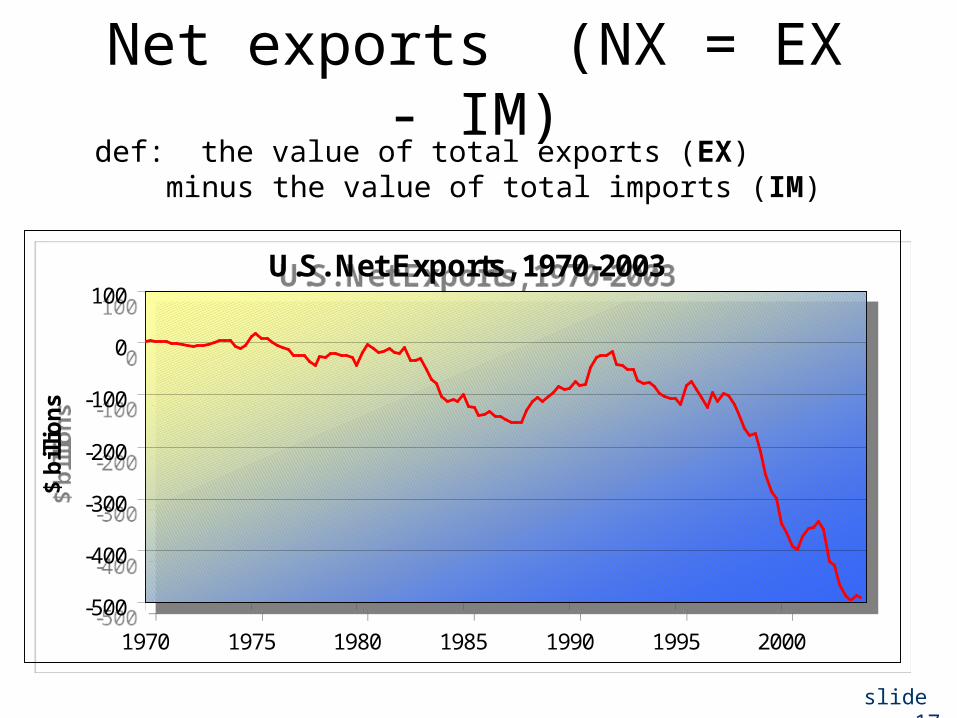
Net exports (NX = EX - IM)def: the value of total exports (EX)
minus the value of total imports (IM)
U.S. Net Exports, 1970-2003
-500
-400
-300
-200
-100
0
100
1970 1975 1980 1985 1990 1995 2000
$ b
illi
on
s
U.S. Net Exports, 1970-2003
-500
-400
-300
-200
-100
0
100
1970 1975 1980 1985 1990 1995 2000
$ b
illi
on
s
slide 18
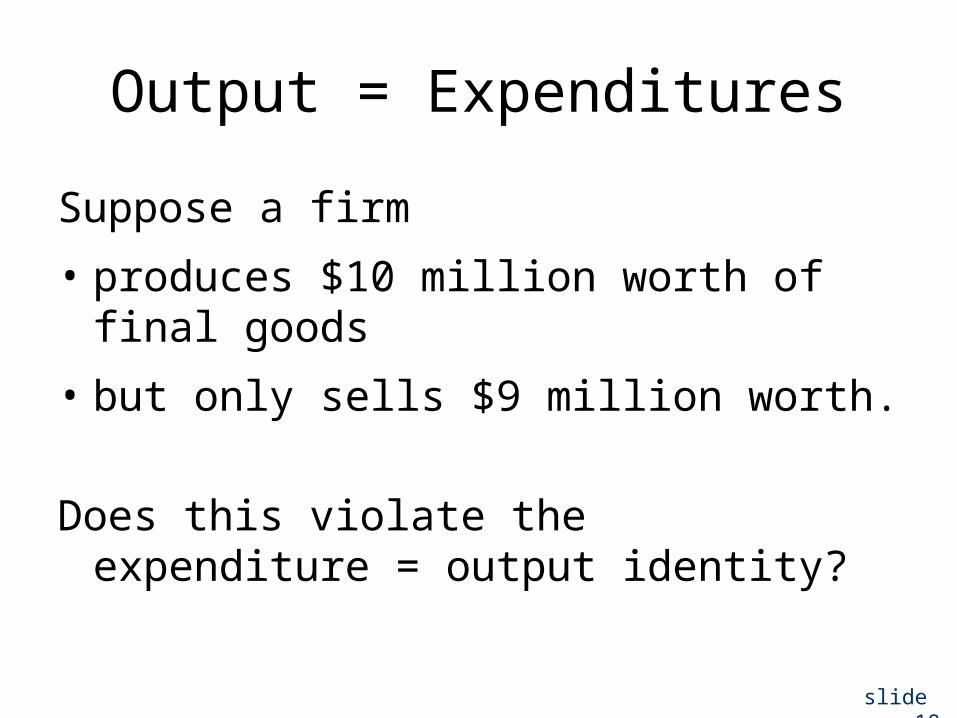
Output = Expenditures
Suppose a firm
• produces $10 million worth of final goods
• but only sells $9 million worth.
Does this violate the expenditure = output identity?

slide 19
GNP vs. GDP
• Gross National Product (GNP): total income earned by the nation’s factors of production, regardless of where located
• Gross Domestic Product (GDP):total income earned by domestically-located factors of production, regardless of nationality.
(GNP – GDP) = (factor payments from abroad) – (factor payments to abroad)

slide 20
Here’s a Question:
In your country, which would you want
to be bigger, GDP or GNP?
Why?
slide 21
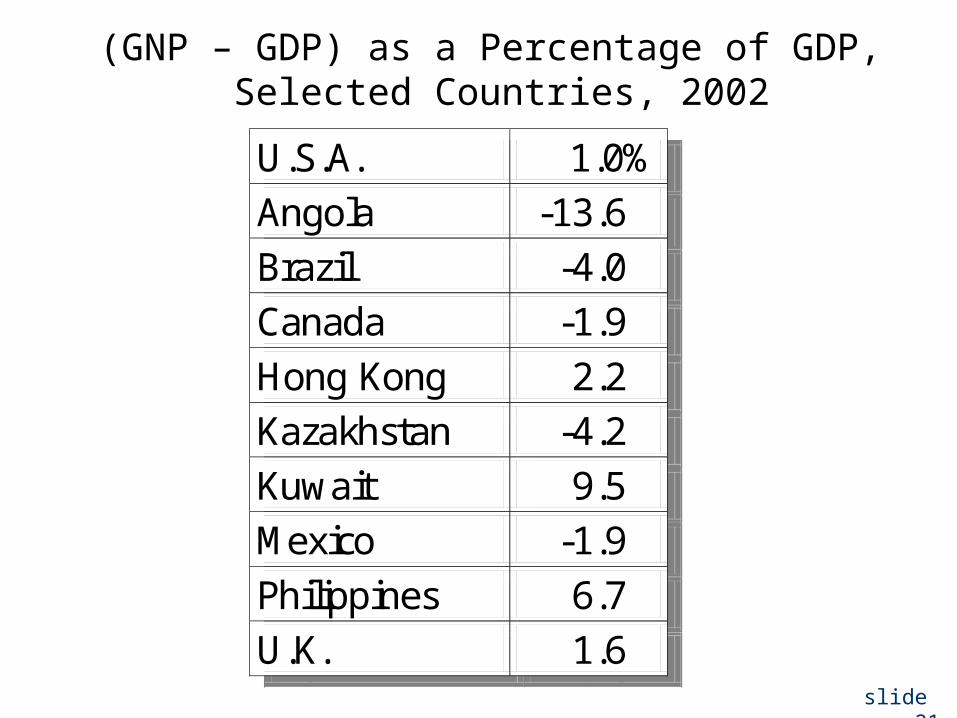
(GNP – GDP) as a Percentage of GDP, Selected Countries, 2002
U.S.A. 1.0% Angola -13.6 Brazil -4.0 Canada -1.9 Hong Kong 2.2 Kazakhstan -4.2 Kuwait 9.5 Mexico -1.9 Philippines 6.7 U.K. 1.6
U.S.A. 1.0% Angola -13.6 Brazil -4.0 Canada -1.9 Hong Kong 2.2 Kazakhstan -4.2 Kuwait 9.5 Mexico -1.9 Philippines 6.7 U.K. 1.6
slide 22
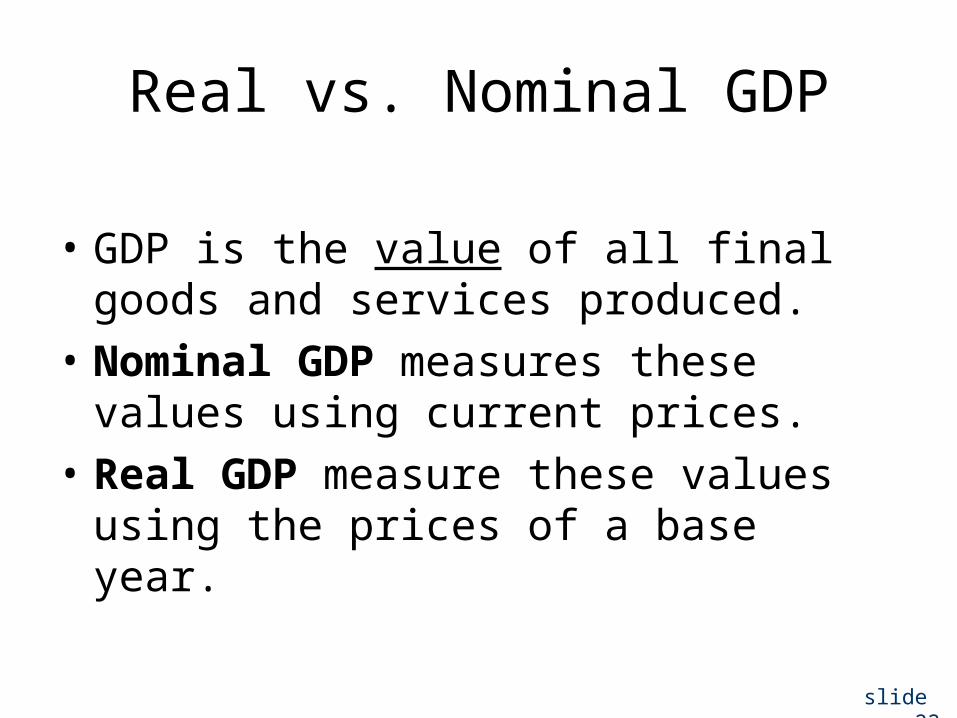
Real vs. Nominal GDP
• GDP is the value of all final goods and services produced.
• Nominal GDP measures these values using current prices.
• Real GDP measure these values using the prices of a base year.

slide 23
Real GDP controls for inflation
Changes in nominal GDP can be due to: changes in prices changes in quantities of output produced
Changes in real GDP can only be due to changes in quantities,
because real GDP is constructed using constant base-year prices.
slide 24
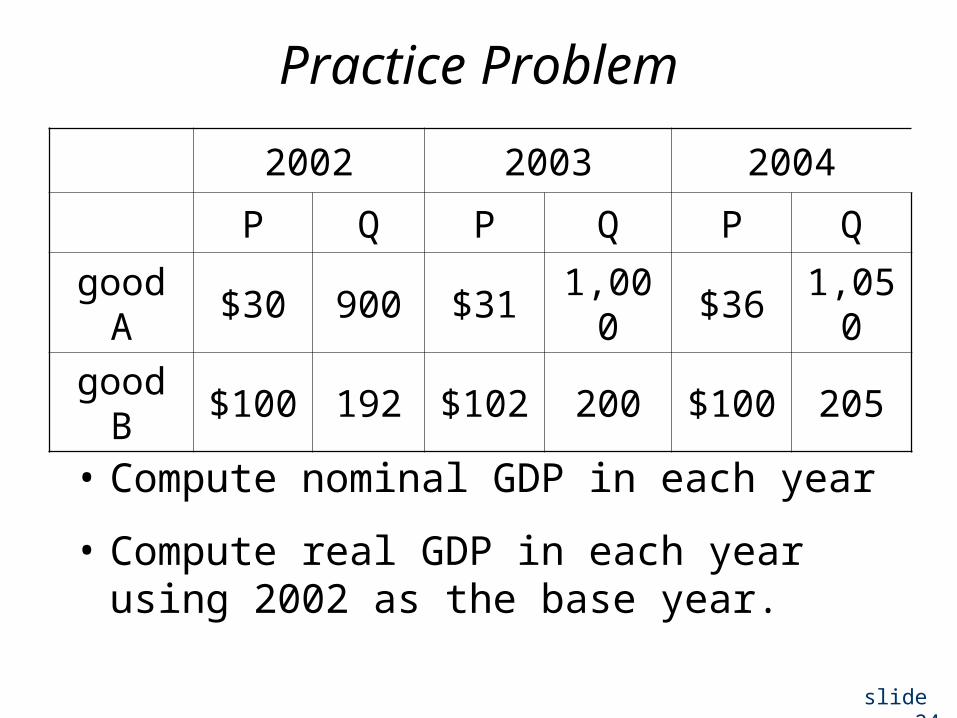
Practice Problem
• Compute nominal GDP in each year
• Compute real GDP in each year using 2002 as the base year.
2002 2003 2004
P Q P Q P Q
good A $30 900 $31 1,000 $36 1,050
good B $100 192 $102 200 $100 205

slide 25
Answers to 1Nominal GDP multiply Ps & Qs from same year
2002: $46,200 = $30 900 + $100 192
2003: $51,400 2004: $58,300
Real GDP multiply each year’s Qs by 2002 Ps
2002: $46,2002003: $50,000 2004: $52,000 = $30 1050 + $100 205

slide 26
U.S. Real & Nominal GDP, 1970-2004
0
2,000
4,000
6,000
8,000
10,000
12,000
1970 1975 1980 1985 1990 1995 2000
Nominal GDP (billions of dollars)
Real GDP (billions of chained 2000 dollars)

slide 27
GDP Deflator
• The inflation rate is the percentage increase in the overall level of prices.
• One measure of the price level is the GDP Deflator, defined as
Nominal GDPGDP deflator = 100
Real GDP

slide 28
ExampleNom. GDP
Real GDP
GDP deflator
inflationrate
2002 $46,200 $46,200 100.0 n.a.
2003 51,400 50,000 102.8 2.8%
2004 58,300 52,000 112.1 9.1%
slide 29
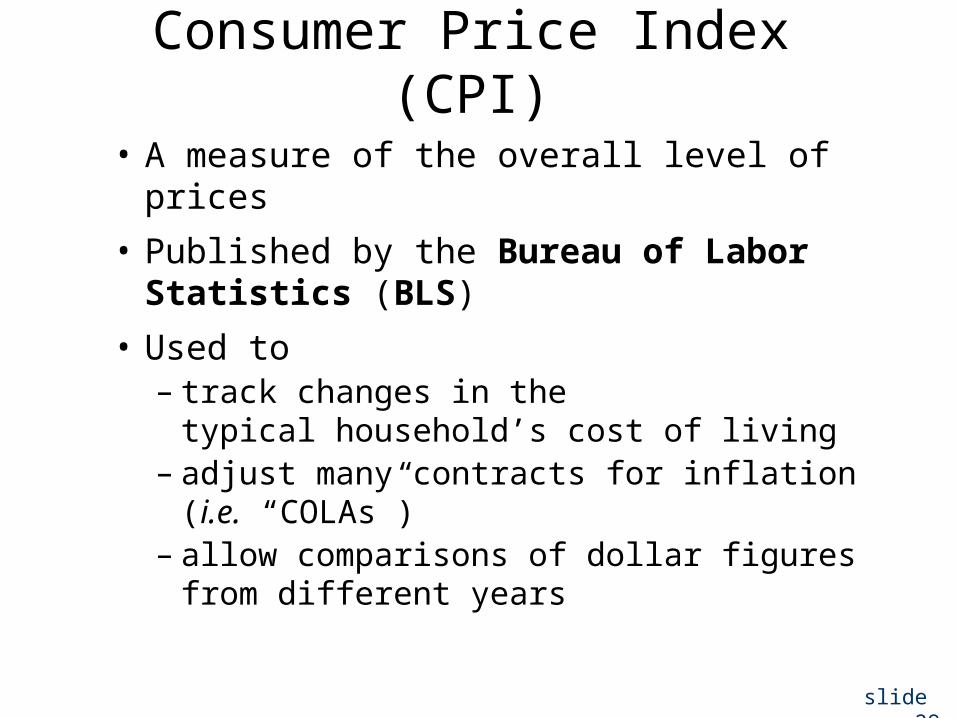
Consumer Price Index (CPI)
• A measure of the overall level of prices
• Published by the Bureau of Labor Statistics (BLS)
• Used to – track changes in the
typical household’s cost of living– adjust many contracts for inflation
(i.e. “COLAs”)– allow comparisons of dollar figures from
different years
slide 30
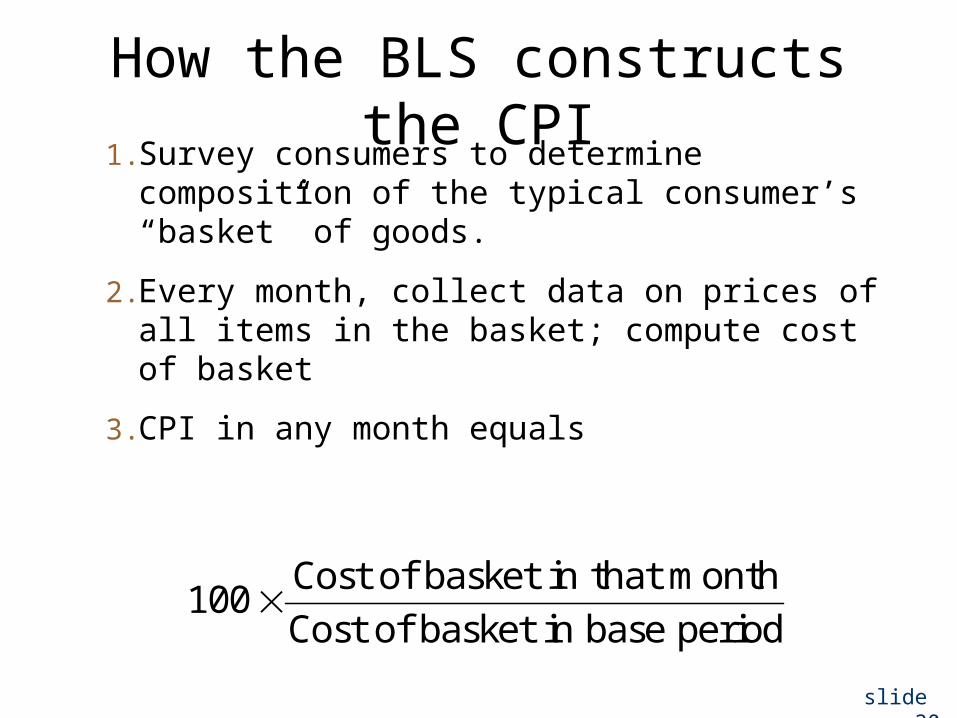
How the BLS constructs the CPI1. Survey consumers to determine composition
of the typical consumer’s “basket” of goods.
2. Every month, collect data on prices of all items in the basket; compute cost of basket
3. CPI in any month equals
Cost of basket in that month100
Cost of basket in base period
slide 31
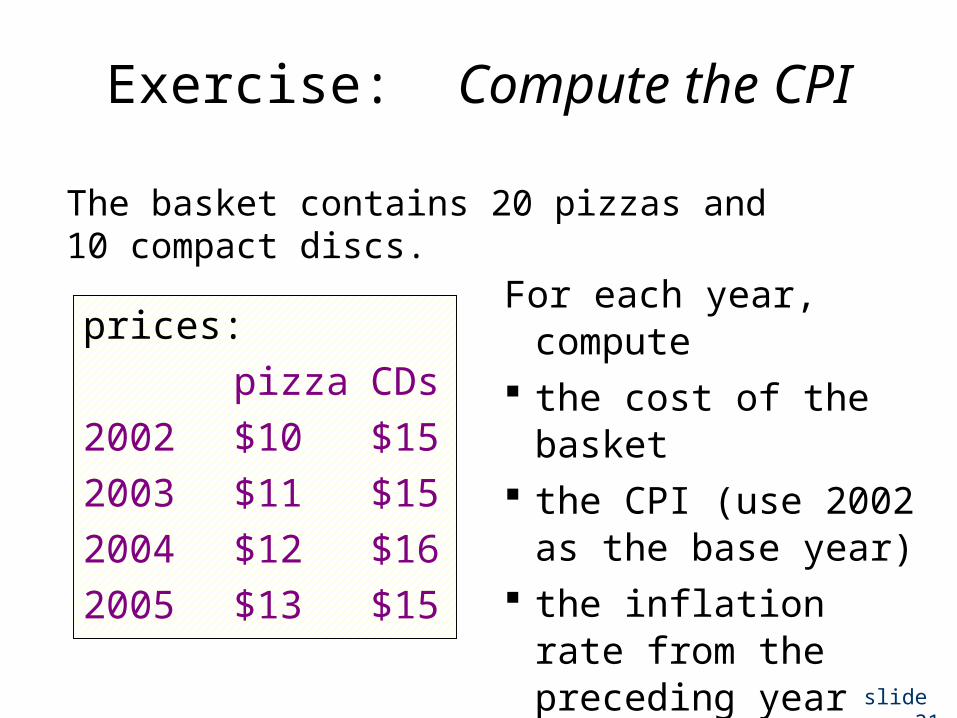
Exercise: Compute the CPI
The basket contains 20 pizzas and 10 compact discs.
prices:pizza CDs
2002 $10 $152003 $11 $152004 $12 $162005 $13 $15
For each year, compute
the cost of the basket
the CPI (use 2002 as the base year)
the inflation rate from the preceding year

slide 32
cost of inflationbasket CPI rate
2002 $350 100.0 n.a.
2003 370 105.7 5.7%
2004 400 114.3 8.1%
2005 410 117.1 2.5%
Example # 2
slide 33
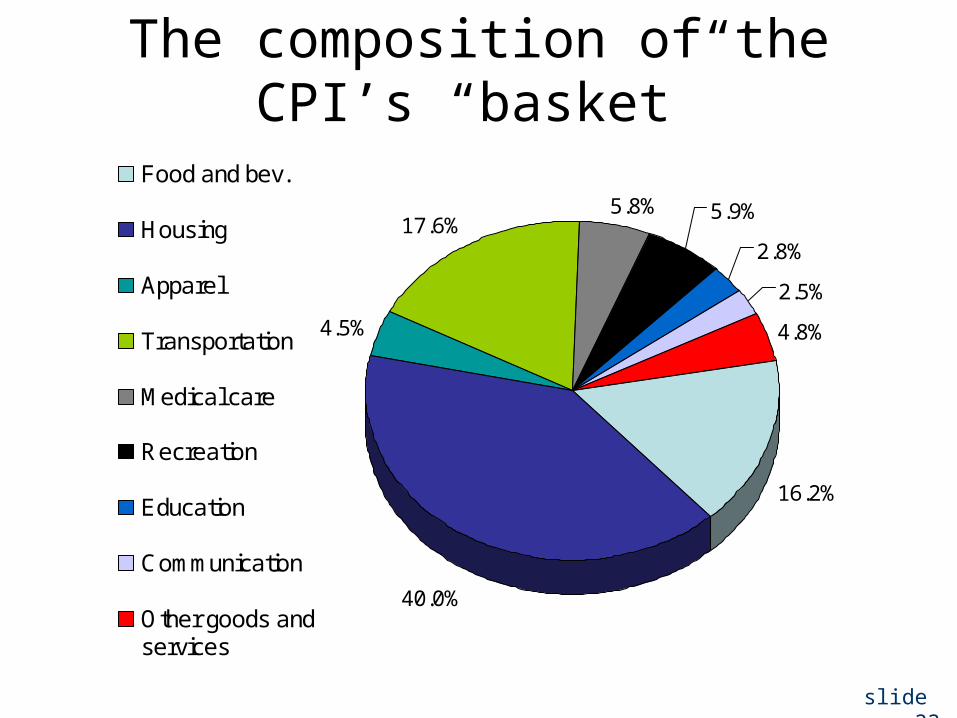
The composition of the CPI’s “basket”
16.2%
40.0%
4.5%
17.6%5.8% 5.9%
2.8%
2.5%
4.8%
Food and bev.
Housing
Apparel
Transportation
Medical care
Recreation
Education
Communication
Other goods andservices

slide 34
Reasons why the CPI may overstate inflation
• Substitution bias: The CPI uses fixed weights, so it cannot reflect consumers’ ability to substitute toward goods whose relative prices have fallen.
• Introduction of new goods: The introduction of new goods makes consumers better off and, in effect, increases the real value of the dollar. But it does not reduce the CPI, because the CPI uses fixed weights.
• Unmeasured changes in quality: Quality improvements increase the value of the dollar, but are often not fully measured.
slide 35
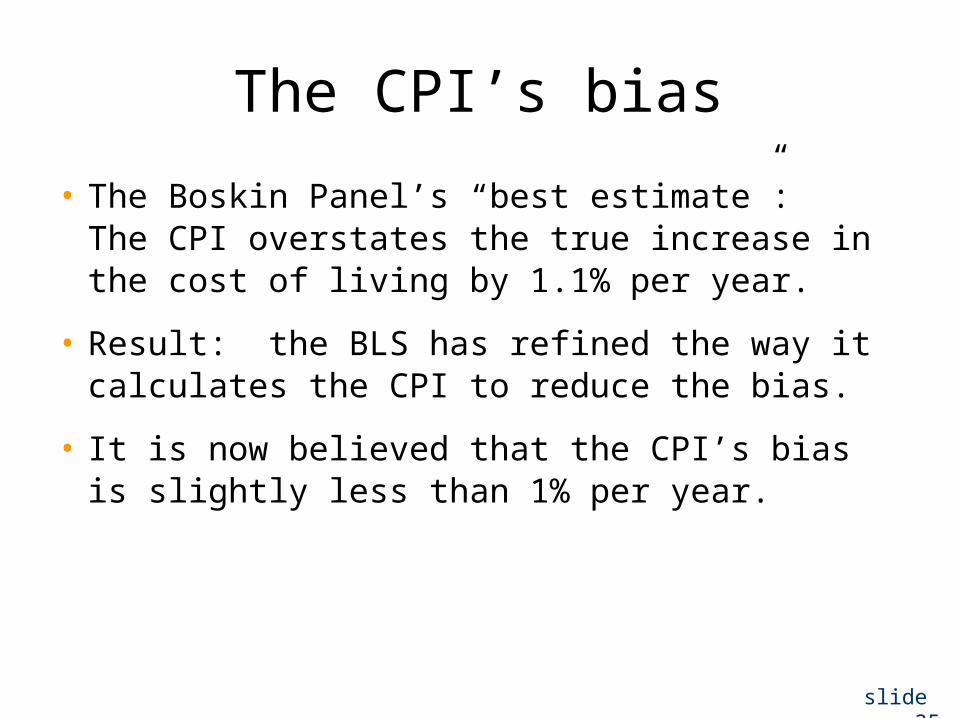
The CPI’s bias
• The Boskin Panel’s “best estimate”:The CPI overstates the true increase in the cost of living by 1.1% per year.
• Result: the BLS has refined the way it calculates the CPI to reduce the bias.
• It is now believed that the CPI’s bias is slightly less than 1% per year.

slide 36
CPI vs. GDP deflator
prices of capital goods• included in GDP deflator (if produced domestically)
• excluded from CPI
prices of imported consumer goods• included in CPI• excluded from GDP deflator
the basket of goods• CPI: fixed• GDP deflator: changes every year

slide 37
Two measures of inflation
-4
-2
0
2
4
6
8
10
12
14
16
1950 1955 1960 1965 1970 1975 1980 1985 1990 1995 2000
Percentage change
GDP deflator Consumer Price Index
slide 38
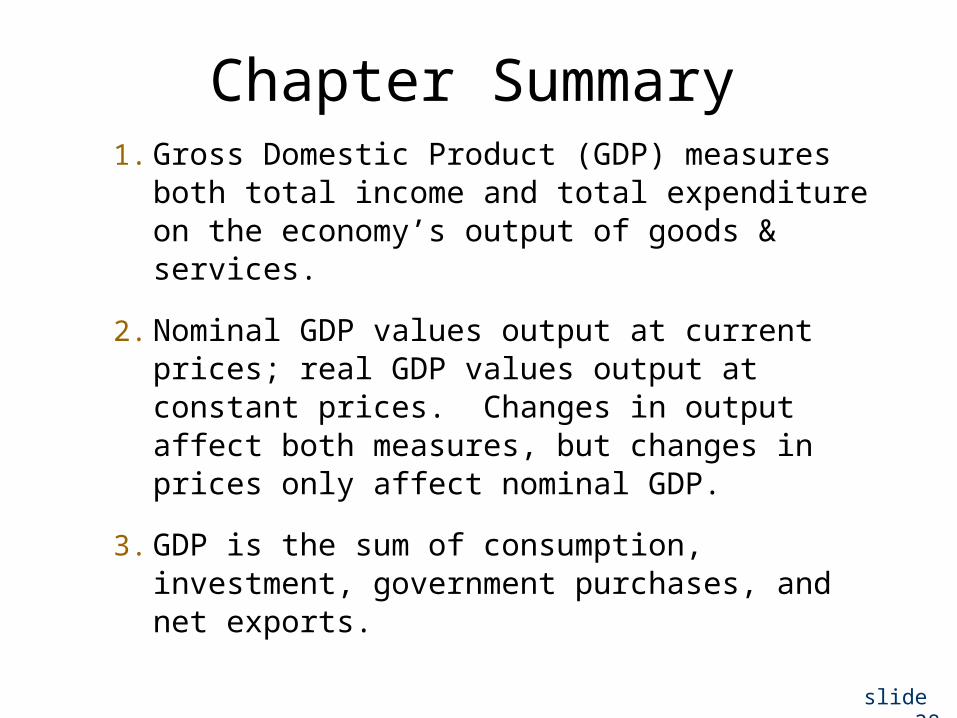
Chapter Summary1. Gross Domestic Product (GDP) measures
both total income and total expenditure on the economy’s output of goods & services.
2. Nominal GDP values output at current prices; real GDP values output at constant prices. Changes in output affect both measures, but changes in prices only affect nominal GDP.
3. GDP is the sum of consumption, investment, government purchases, and net exports.
slide 39
Chapter Summary
4. The overall level of prices can be measured by either the Consumer Price Index (CPI),
the price of a fixed basket of goods purchased by the typical consumer
the GDP deflator, the ratio of nominal to real GDP
5. The unemployment rate is the fraction of the labor force that is not employed. When unemployment rises, the growth rate of real GDP falls.