Embed Size (px)
Citation preview
Slide 1 Copyright QSMAssociates, Inc. All Rights Reserved
“Index Based Productivity Benchmarking”
“How ProductiveWere Our Teams on Our Most Recent Projects?”
Slide 2 Copyright QSMAssociates, Inc. All Rights Reserved
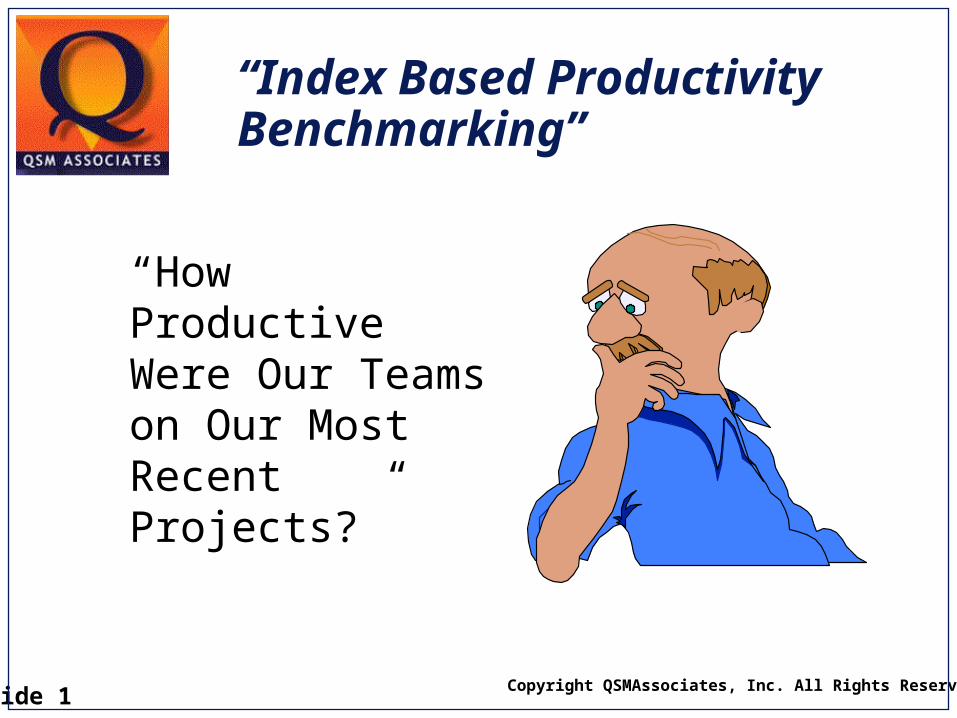
Software Production Equation
Conceptual Form
= x x
TIME EFFORTPROCESS
PRODUCTIVITYPRODUCT
SIZE
ESLOC
Function Points
Objects
Slide 3 Copyright QSMAssociates, Inc. All Rights Reserved
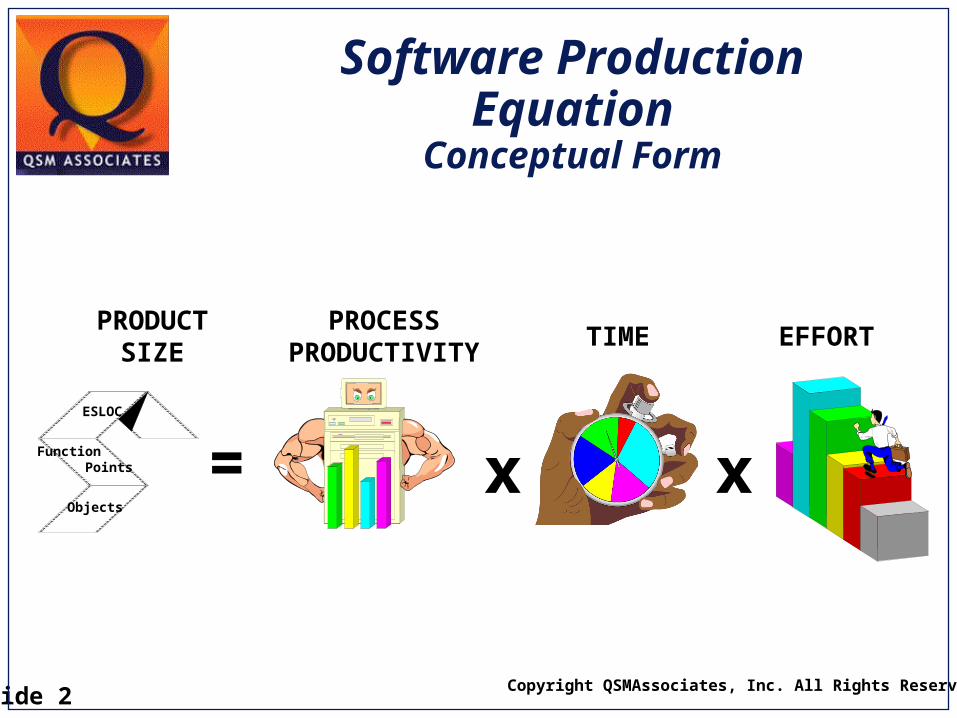
=
x
TIME EFFORT
PRODUCTSIZE
ESLOC
Function Points
Objects
PROCESSPRODUCTIVITY
Software Production Equation
Historical Form
Slide 4 Copyright QSMAssociates, Inc. All Rights Reserved
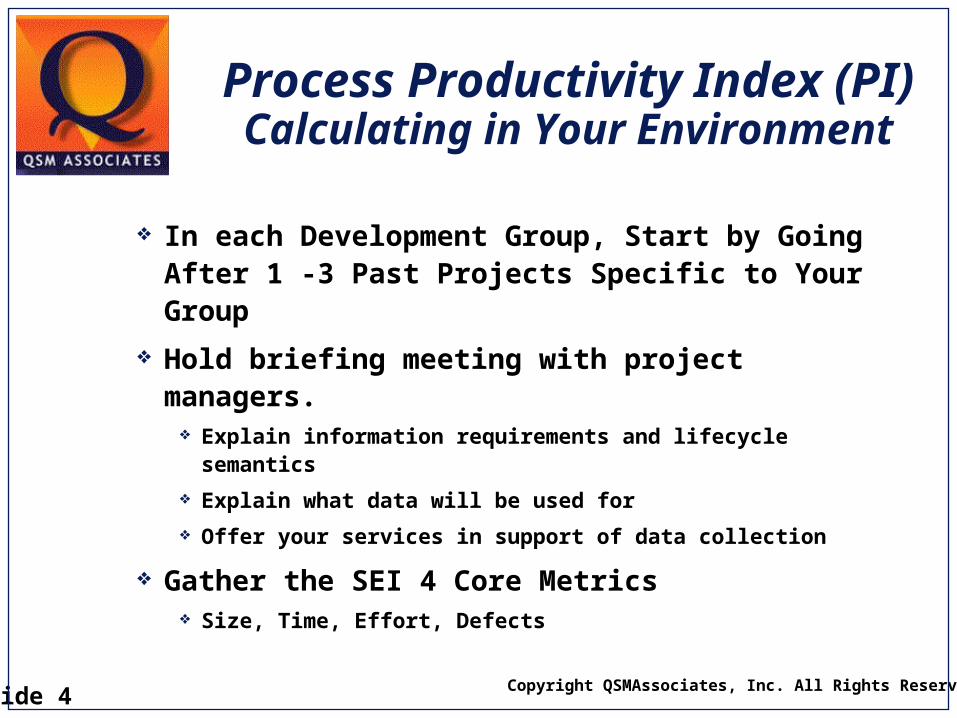
In each Development Group, Start by Going After 1 -3 Past Projects Specific to Your Group
Hold briefing meeting with project managers.
Explain information requirements and lifecycle semantics
Explain what data will be used for
Offer your services in support of data collection
Gather the SEI 4 Core Metrics Size, Time, Effort, Defects
Process Productivity Index (PI)
Calculating in Your Environment
Slide 5 Copyright QSMAssociates, Inc. All Rights Reserved
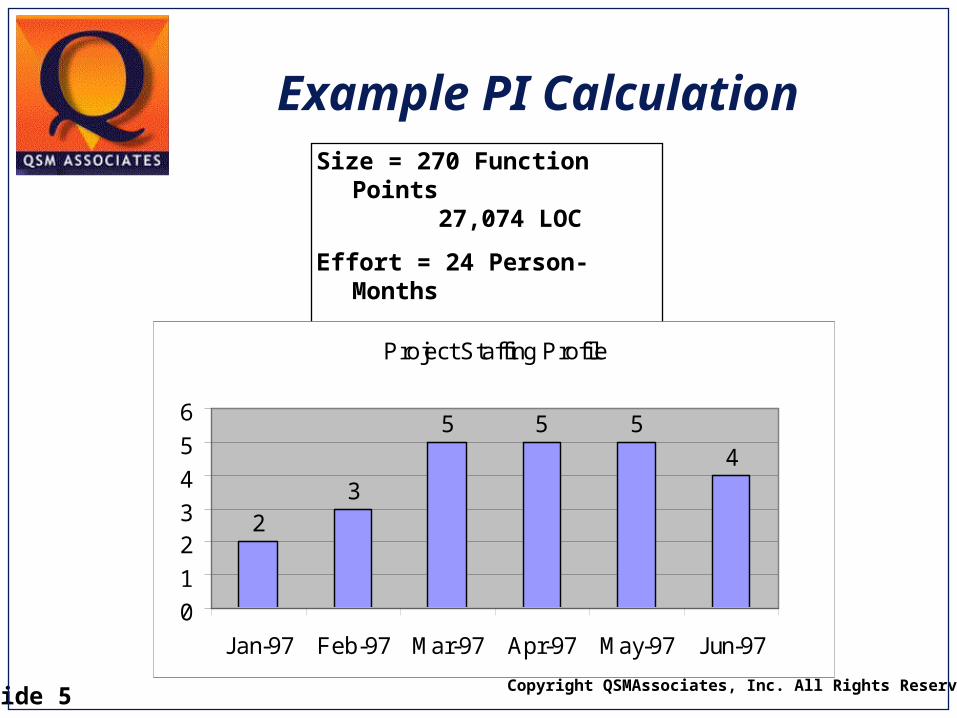
Example PI CalculationSize = 270 Function
Points 27,074 LOC
Effort = 24 Person-Months
Time = 6 MonthsProject Staffing Profile
23
5 5 5
4
0
1
23
4
5
6
Jan-97 Feb-97 Mar-97 Apr-97 May-97 Jun-97

Slide 6 Copyright QSMAssociates, Inc. All Rights Reserved
How the PIis Calculated
Step 1 - Note the time for the Main Build phase (Detailed Design thru Code, Unit Test, Integration, System Accepted for Deployment). In this case, 6 months.
Step 2 - Record the Full Time Equivalent (FTE) Effort. In this case, 24 Person-months. This includes design, code, test, QA, CM staff etc.
Step 3 - Identify the amount of New + Modified Source Code. In this case, 27,074 SLOC, comprising 270 Function Points (or about >100 LOC per FP).
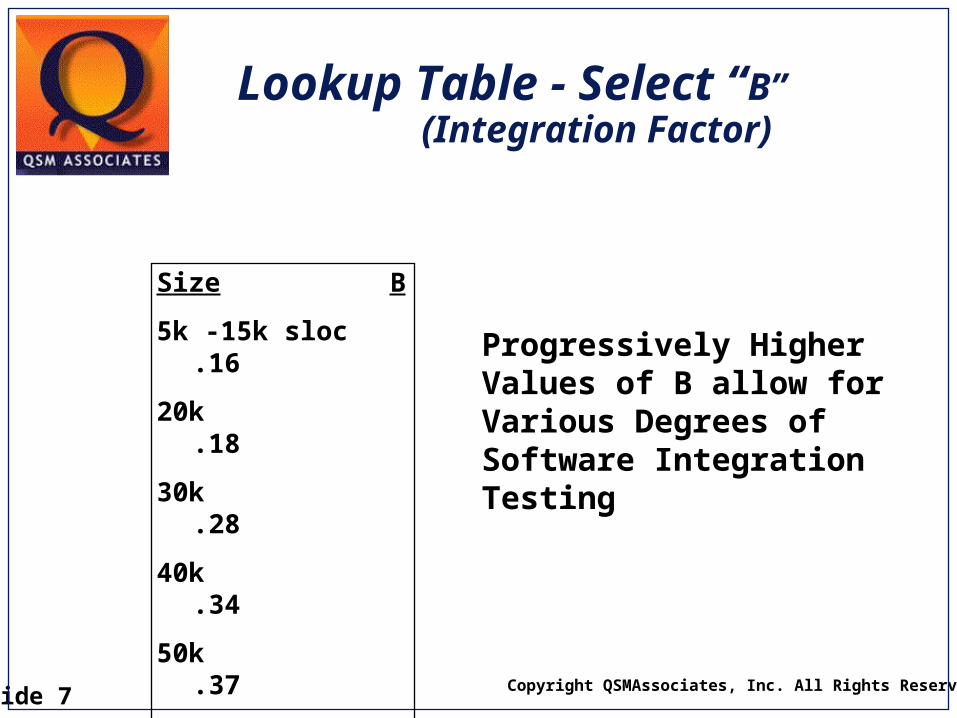
Step 4 - Identify B (Integration) Factor from lookup table.
Slide 7 Copyright QSMAssociates, Inc. All Rights Reserved
Size B
5k -15k sloc.16
20k.18
30k.28
40k.34
50k.37
>70k.39
Lookup Table - Select “B” (Integration Factor)
Progressively HigherValues of B allow forVarious Degrees ofSoftware IntegrationTesting

Slide 8 Copyright QSMAssociates, Inc. All Rights Reserved
How the PI is Calculated (con’t)
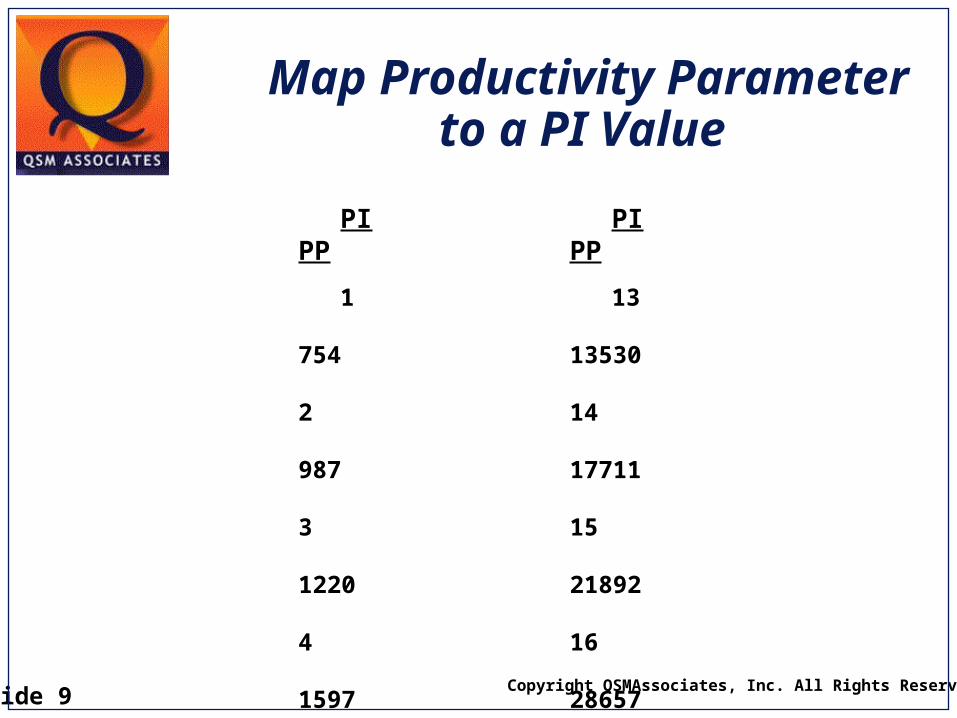
Plug Size, Time, Effort, B Factor into SW Equation. Determine Productivity Parameter (PP). Then Map to a Productivity Index (PI).
27,074 = (PP) x (6 mos/12) 1.33 x ((24 pm/12)/.28) .33
= (PP) x (.5) 1.33 x (7.14) .33 PP = 35,422
This Maps to a PI = 17 (See following Table)
Slide 9 Copyright QSMAssociates, Inc. All Rights Reserved
PI PP
1
754
2
987
3
1220
4
1597
5
1974
6
2584
7
3194
8
4181
9
5186
10
6765
11
8362
12
10946
Map Productivity Parameter
to a PI Value PI PP
13
13530
14
17711
15
21892
16
28657
17
35422
18
46368
19
57314
20
75025
21
92736
22
121393
23
150050
24
196418

Slide 10 Copyright QSMAssociates, Inc. All Rights Reserved
Productivity IndexIndustry Baselines - 1997/8
Category PI STD Dev
Business 17.3 +/- 4.1
System Software 13.7 +/- 4.9
Telecom 12.2 +/- 4.0
Scientific 12.1 +/- 3.5
Process Control 12.1 +/- 3.4
Command & Ctrl 11.3 +/- 4.3
Avionic 8.2 +/- 4.8 Real-time 7.8 +/-
3.8 Microcode 6.3 +/-
2.8
FinanceRetailInsuranceOthers
Slide 11 Copyright QSMAssociates, Inc. All Rights Reserved
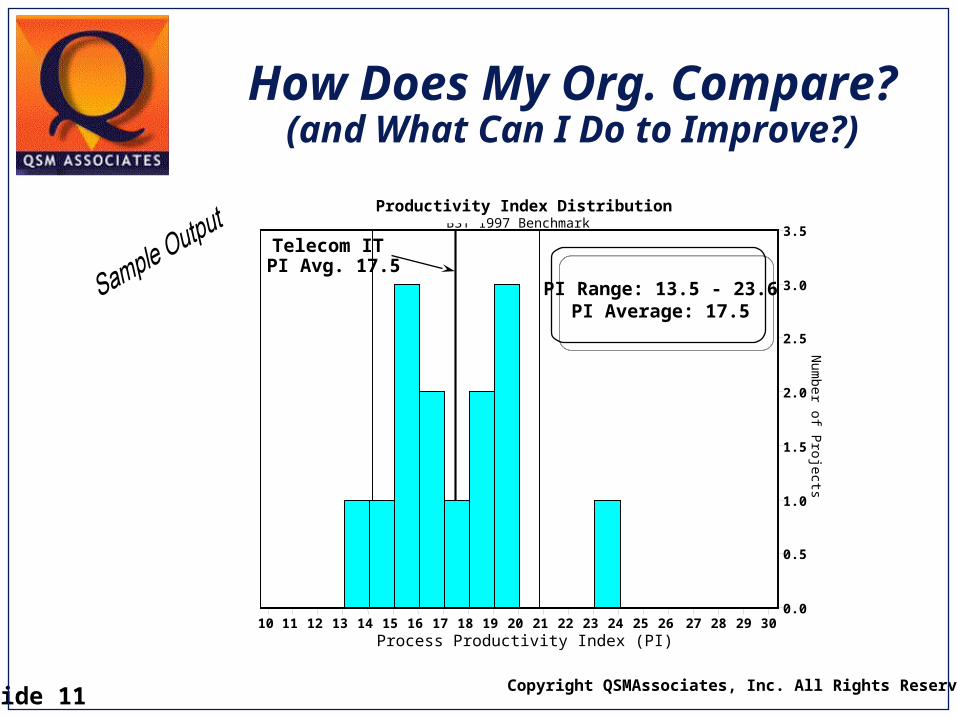
Productivity Index DistributionBST 1997 Benchmark
Process Productivity Index (PI)10 11 12 13 14 15 16 17 18 19 20 21 22 23 24 25 26 27 28 29 30
Num
ber of Projects
0.0
0.5
1.0
1.5
2.0
2.5
3.0
3.5
PI Range: 13.5 - 23.6PI Average: 17.5
Telecom IT PI Avg. 17.5
How Does My Org. Compare?
(and What Can I Do to Improve?)
Slide 12 Copyright QSMAssociates, Inc. All Rights Reserved
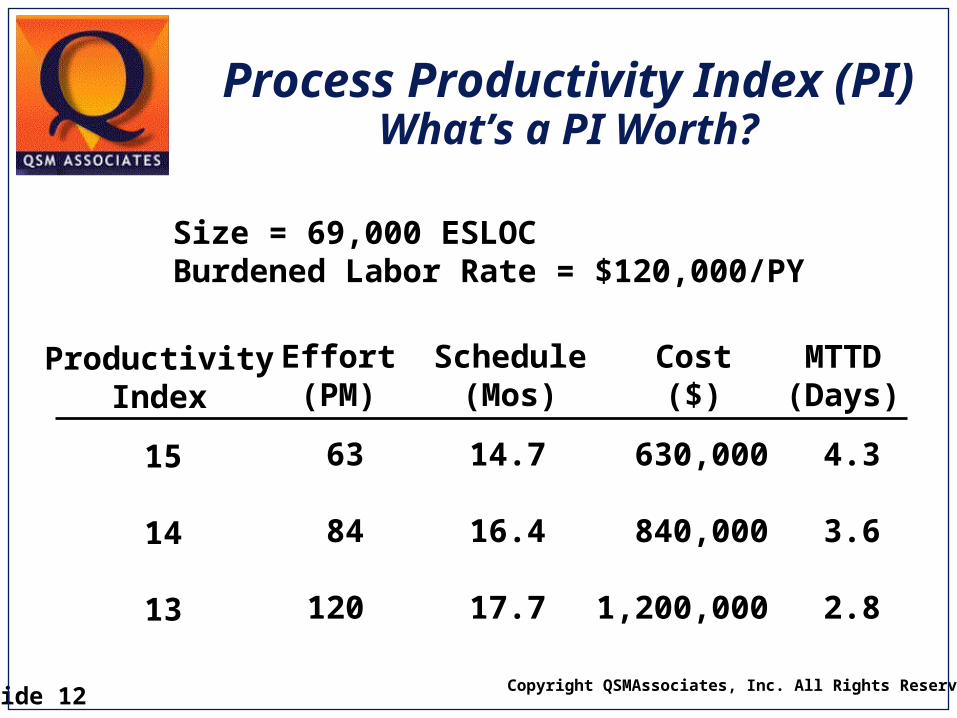
Size = 69,000 ESLOCBurdened Labor Rate = $120,000/PY
ProductivityIndex
Effort(PM)
Schedule(Mos)
Cost($)
15
14
13
63
84
120
14.7
16.4
17.7
630,000
840,000
1,200,000
MTTD(Days)
4.3
3.6
2.8
Process Productivity Index (PI)
What’s a PI Worth?

Slide 13 Copyright QSMAssociates, Inc. All Rights Reserved
Process Productivity Index (PI)
Quantifies Team Performance...

Slide 14 Copyright QSMAssociates, Inc. All Rights Reserved
Process Productivity Index (PI)
... In the Environment they areWorking in Day to Day
Management
Methods
Tools Training
Users
Requirements

Slide 15 Copyright QSMAssociates, Inc. All Rights Reserved
RecommendedReading
Mah, Michael C., “High-Definition SoftwareMeasurement” © May 1999 Software Magazine
Mah, Michael C., and Putnam, Lawrence H., “Softwareby the Numbers: An Aerial View of the SoftwareMetrics Landscape” © 1997 American Programmer.
Putnam, Lawrence H., and Myers, Ware, “IndustrialStrength Software” © 1997 IEEE Computer Society.
Tufte, Edward, “Visual Explanations, Images and Quantities,Evidence and Narrative” © 1997 Graphics Press.