Embed Size (px)
Citation preview
Slide 1
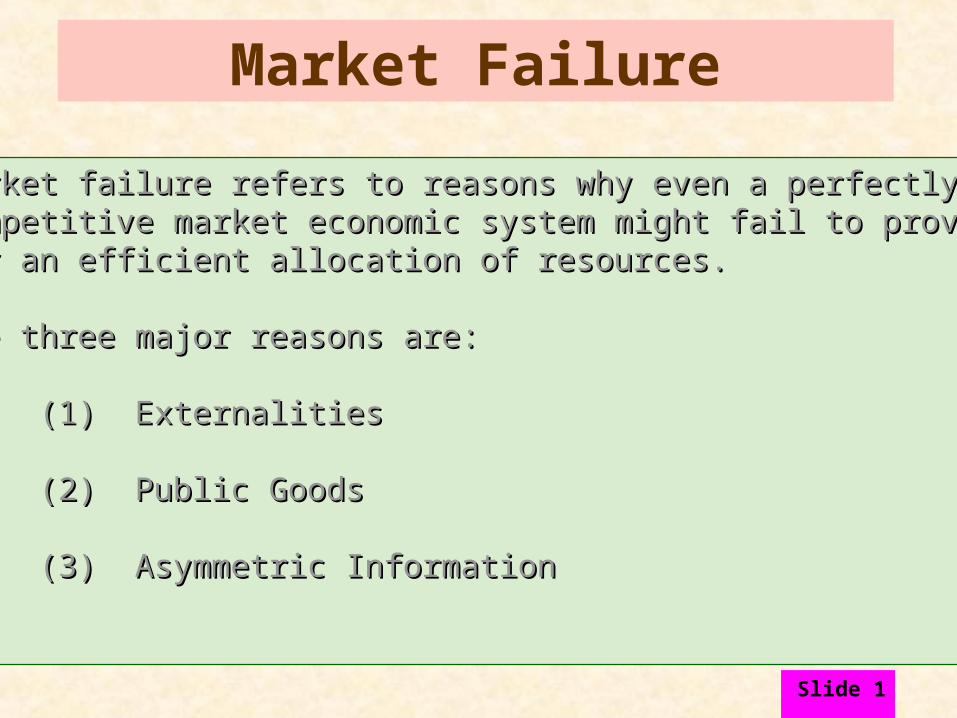
Market Failure
Market failure refers to reasons why even a perfectlyMarket failure refers to reasons why even a perfectlycompetitive market economic system might fail to providecompetitive market economic system might fail to providefor an efficient allocation of resources.for an efficient allocation of resources.
The three major reasons are:The three major reasons are:
(1)(1) ExternalitiesExternalities
(2)(2) Public GoodsPublic Goods
(3)(3) Asymmetric InformationAsymmetric Information
Slide 2
EXTERNALITIES
Externalities
Costs or benefits arising out of production or consumption that accrue to others in the community rather than the individual producer or consumer.
Slide 3
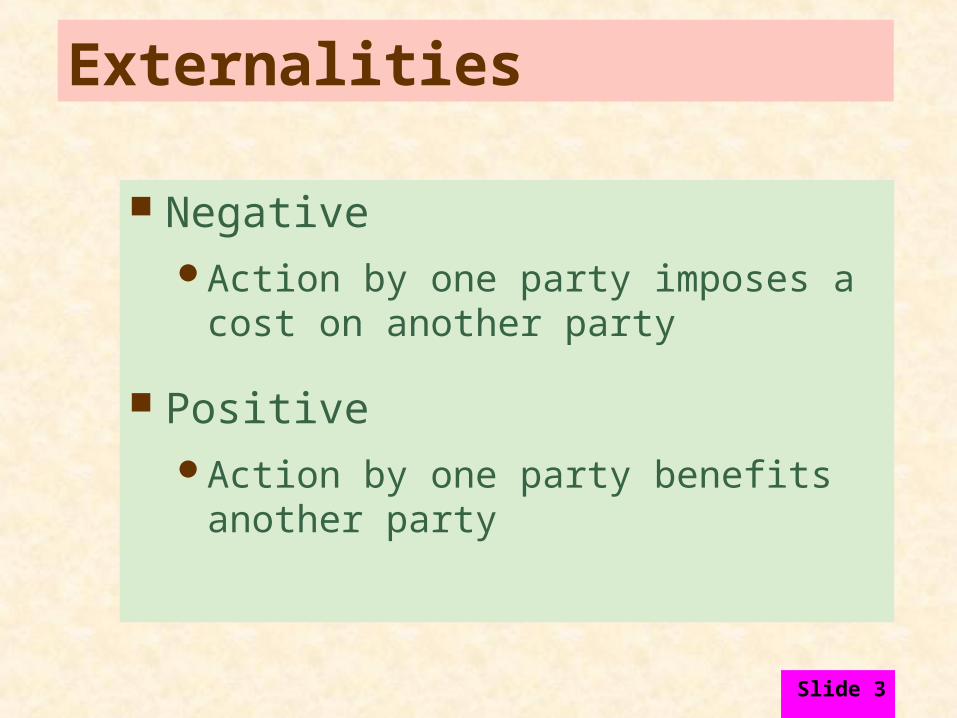
Externalities
NegativeAction by one party imposes a cost on
another party
PositiveAction by one party benefits another
party

Slide 4
EXTERNALITIES
Ways of Correcting Externalities
•Command and Control Policies
•Externalities and Property Rights

Slide 5
External Cost
ScenarioSteel plant dumping waste in a river
The entire steel market effluent can be reduced by lowering output (fixed proportions production function)

Slide 6
External Cost
ScenarioMarginal External Cost (MEC) is the cost
imposed on fishermen downstream for each level of production.
Marginal Social Cost (MSC) is MC plus MEC.
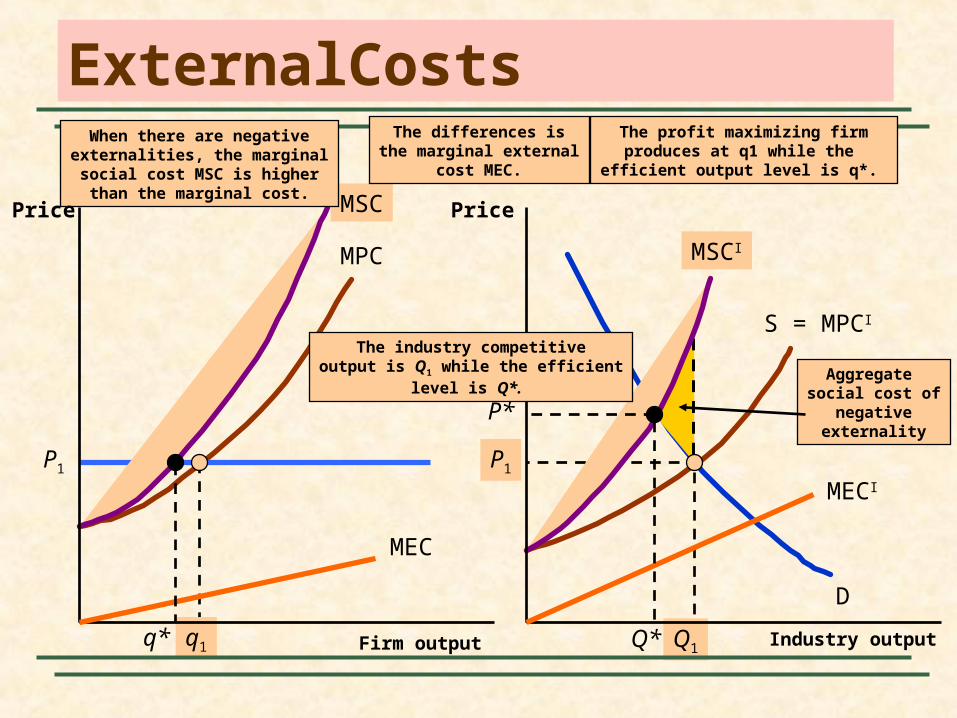
MPC
S = MPCI
D
P1
Aggregate social cost of
negativeexternality
P1
q1 Q1
MSC
MSCI
When there are negativeexternalities, the marginalsocial cost MSC is higher
than the marginal cost.
ExternalCosts
Firm output
Price
Industry output
Price
MEC
MECI
The differences isthe marginal external
cost MEC.
q*
P*
Q*
The industry competitiveoutput is Q1 while the efficient
level is Q*.
The profit maximizing firmproduces at q1 while the
efficient output level is q*.

Slide 8
External Costs
The Marginal External Cost curve(MEC), is drawn upwardThe Marginal External Cost curve(MEC), is drawn upwardsloping on the assumption that as output increases, and sloping on the assumption that as output increases, and therefore additional effluent is dumped,the additional harmtherefore additional effluent is dumped,the additional harmto the fishing industry increases.to the fishing industry increases.
This assumption explains the increasing gap between theThis assumption explains the increasing gap between theMarginal (Private)Cost Curve and the Marginal Social CostMarginal (Private)Cost Curve and the Marginal Social CostCurve(MSC), as output increases.Curve(MSC), as output increases.

Slide 9
External Cost
Negative Externalities encourage inefficient firms to remain in the industry and create excessive production in the long run.
Slide 10
Externalities
Positive Externalities and InefficiencyExternalities can also result in too little
production, as can be shown in an example of home repair and landscaping.
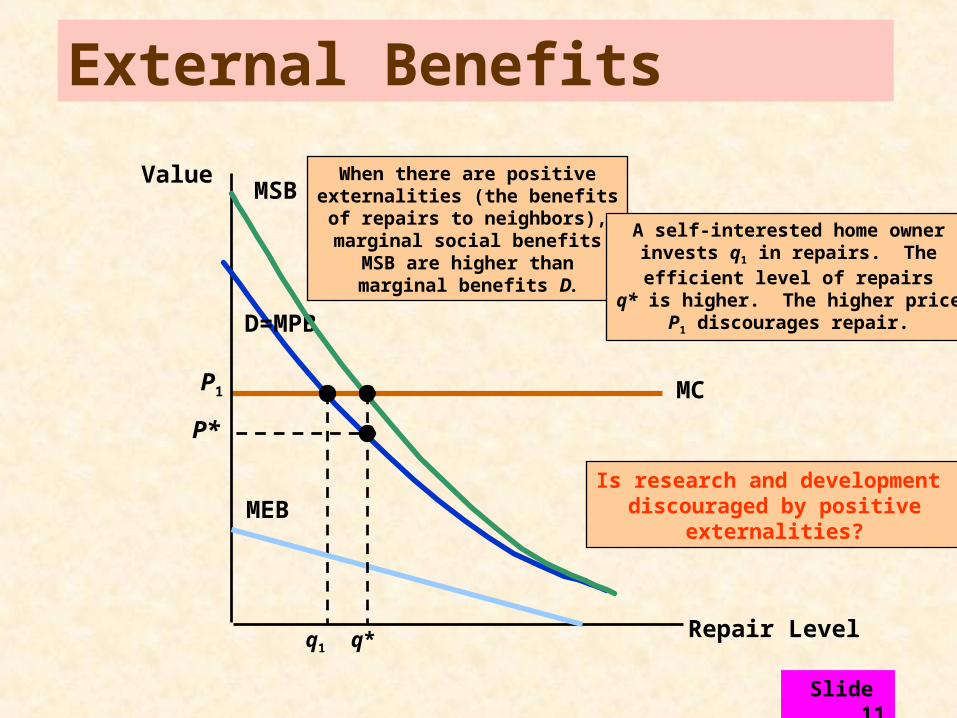
Slide 11
MCP1
External Benefits
Repair Level
Value
D=MPB
Is research and development discouraged by positive
externalities?
q1
MSB
MEB
When there are positiveexternalities (the benefitsof repairs to neighbors),marginal social benefits
MSB are higher thanmarginal benefits D.
q*
P*
A self-interested home ownerinvests q1 in repairs. Theefficient level of repairs
q* is higher. The higher priceP1 discourages repair.
Slide 12
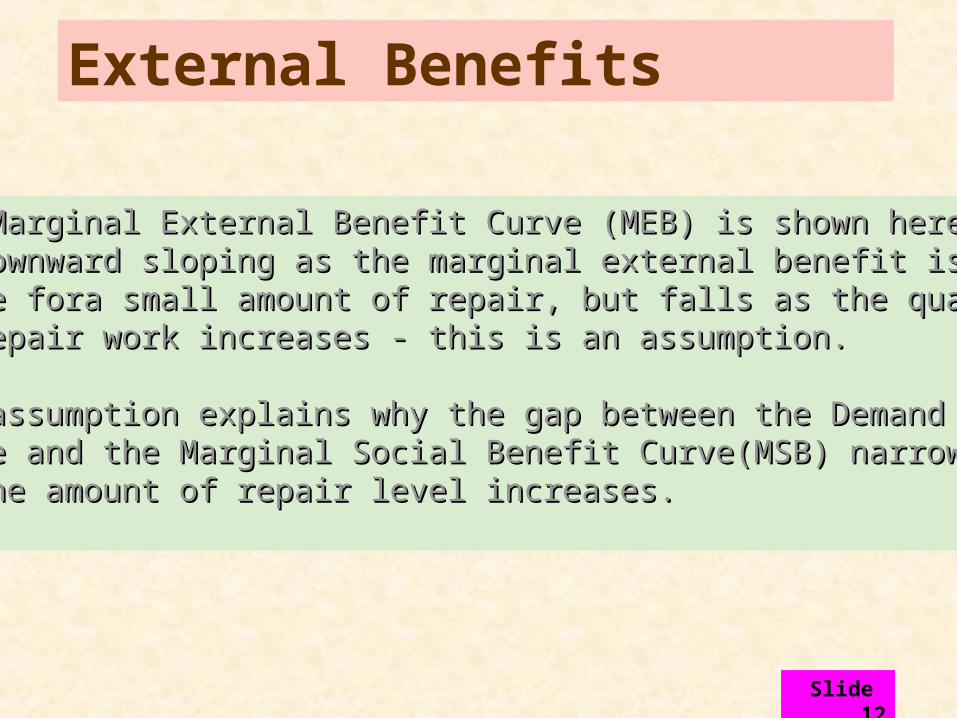
External Benefits
The Marginal External Benefit Curve (MEB) is shown here The Marginal External Benefit Curve (MEB) is shown here as downward sloping as the marginal external benefit is as downward sloping as the marginal external benefit is large fora small amount of repair, but falls as the quantity large fora small amount of repair, but falls as the quantity of repair work increases - this is an assumption.of repair work increases - this is an assumption.
The assumption explains why the gap between the DemandThe assumption explains why the gap between the Demandcurve and the Marginal Social Benefit Curve(MSB) narrowscurve and the Marginal Social Benefit Curve(MSB) narrowsas the amount of repair level increases. as the amount of repair level increases.
Slide 13
Ways of Correcting Market Failure
Assumption: The market failure is pollutionFixed-proportion production technology
Must reduce output to reduce emissions
Use an output tax to reduce outputInput substitution possible by altering
technology
Slide 14
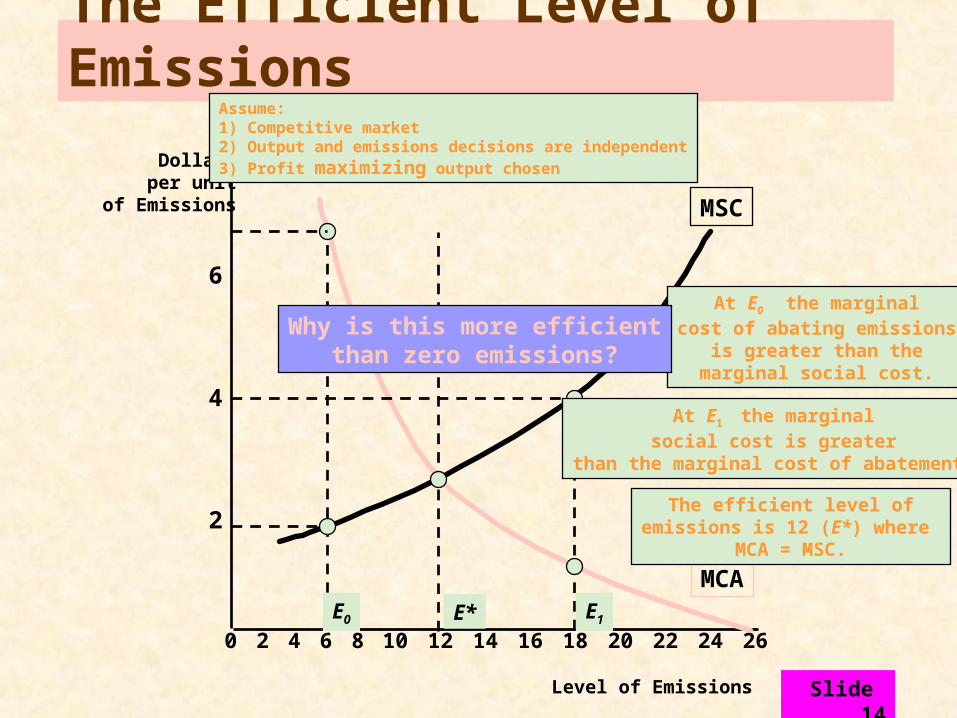
The Efficient Level of Emissions
Level of Emissions
2
4
6
Dollarsper unit
of Emissions
0 2 4 6 8 10 12 14 16 18 20 22 24 26
MSC
MCAE*
The efficient level ofemissions is 12 (E*) where
MCA = MSC.
Assume:1) Competitive market2) Output and emissions decisions are independent3) Profit maximizing output chosen
At E0 the marginalcost of abating emissions
is greater than themarginal social cost.
E0
At E1 the marginalsocial cost is greater
than the marginal cost of abatement.
E1
Why is this more efficientthan zero emissions?
Slide 15
The Efficient Level of Emissions
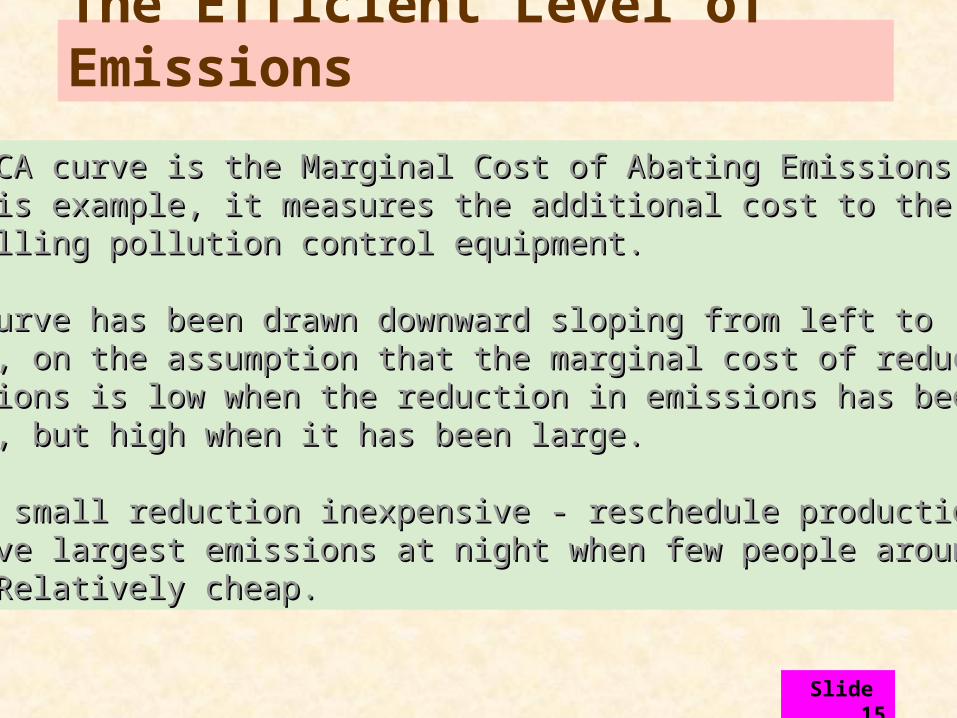
The MCA curve is the Marginal Cost of Abating Emissions.The MCA curve is the Marginal Cost of Abating Emissions.In this example, it measures the additional cost to the firm ofIn this example, it measures the additional cost to the firm ofinstalling pollution control equipment.installing pollution control equipment.
The curve has been drawn downward sloping from left to The curve has been drawn downward sloping from left to right, on the assumption that the marginal cost of reducingright, on the assumption that the marginal cost of reducingemissions is low when the reduction in emissions has been emissions is low when the reduction in emissions has been small, but high when it has been large.small, but high when it has been large.
Eg. A small reduction inexpensive - reschedule productionEg. A small reduction inexpensive - reschedule productionto have largest emissions at night when few people around.to have largest emissions at night when few people around.
Relatively cheap. Relatively cheap.
Slide 16
Ways of Correcting Market Failure
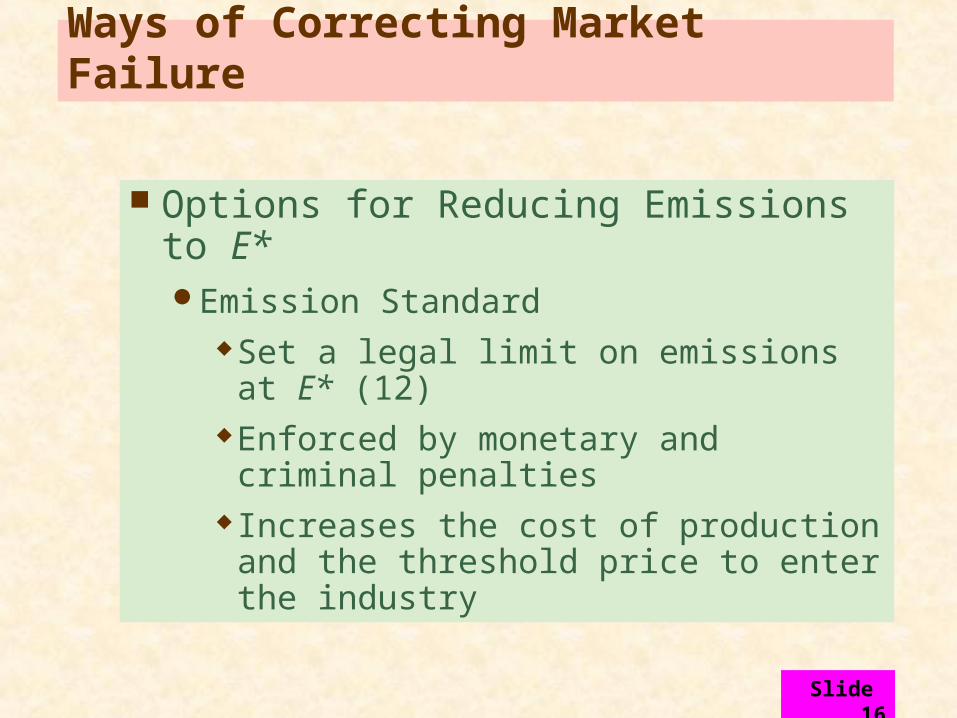
Options for Reducing Emissions to E*Emission Standard
Set a legal limit on emissions at E* (12)
Enforced by monetary and criminal penalties
Increases the cost of production and the threshold price to enter the industry
Slide 17
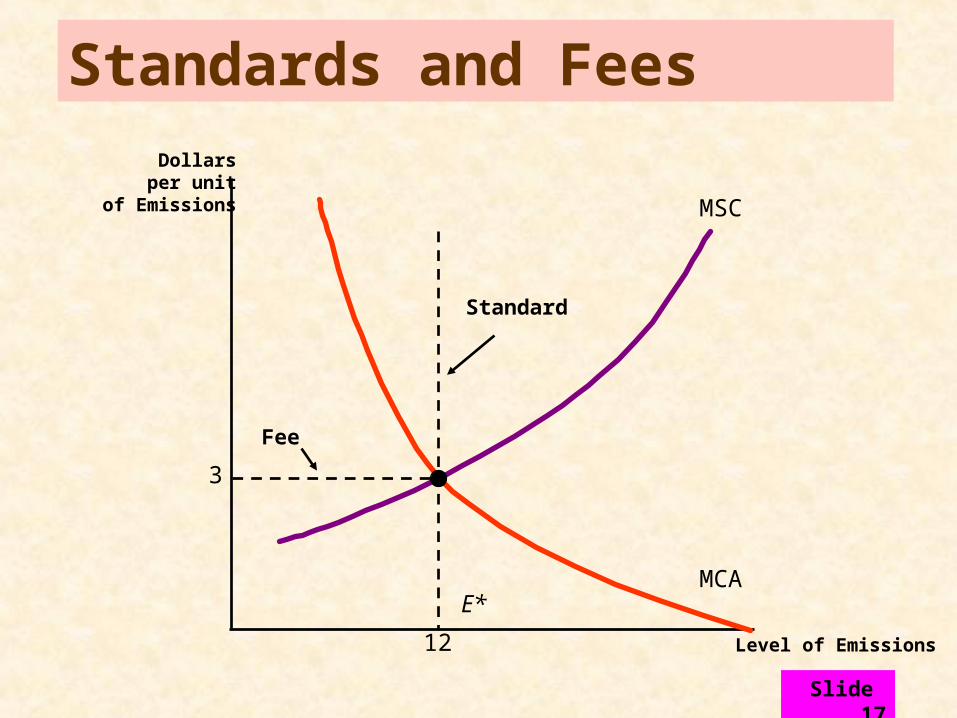
Standards and Fees
Level of Emissions
Dollarsper unit
of Emissions MSC
MCA
3
12
E*
Standard
Fee
Slide 18
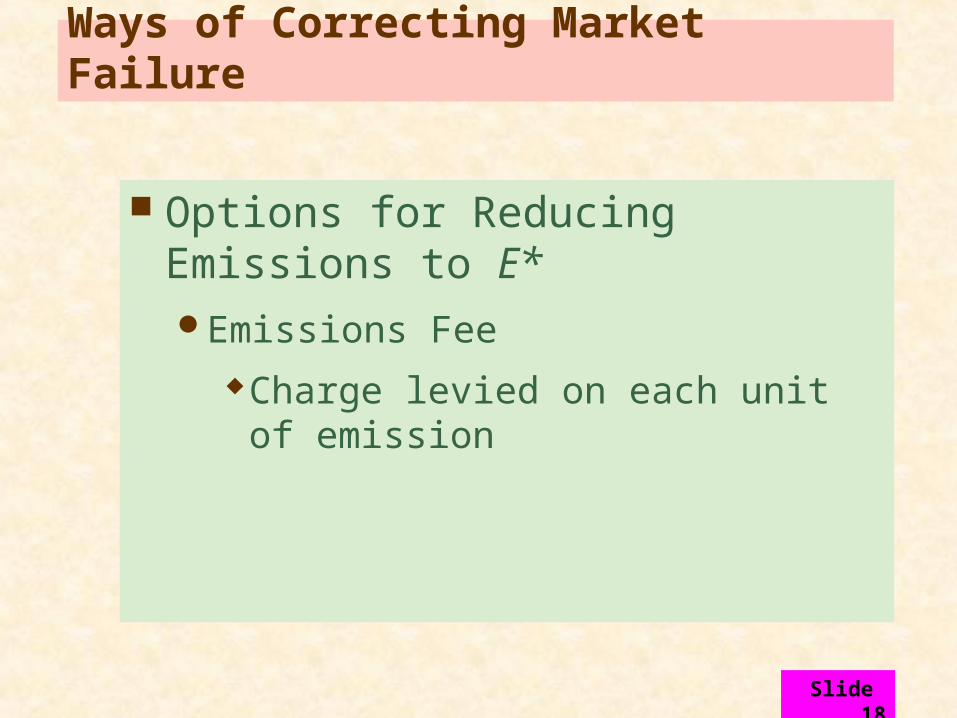
Options for Reducing Emissions to E*Emissions Fee
Charge levied on each unit of emission
Ways of Correcting Market Failure
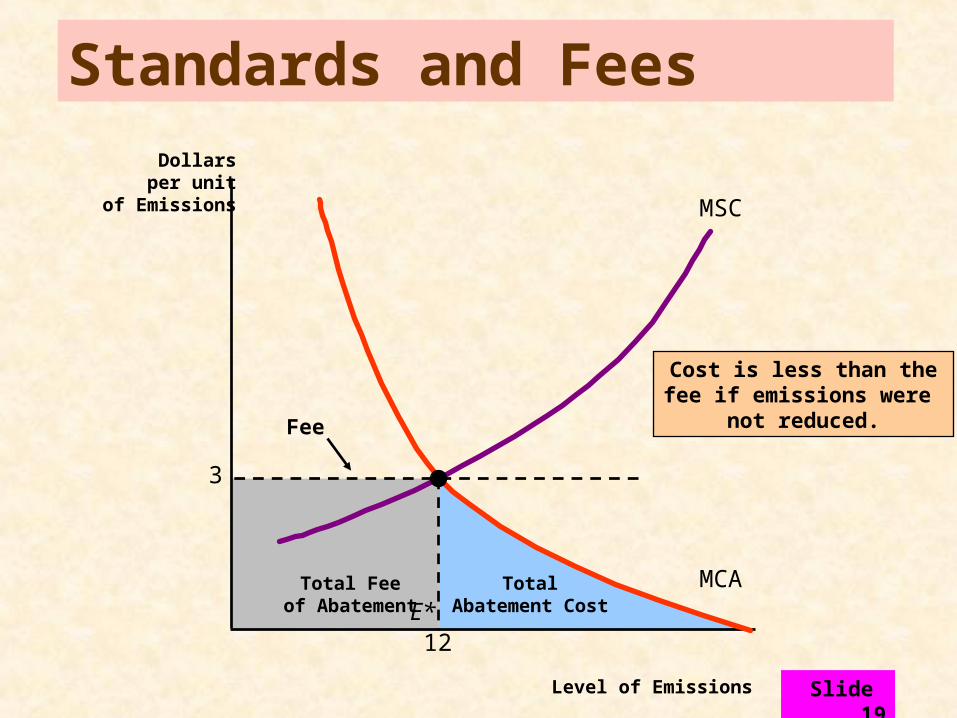
Slide 19
TotalAbatement Cost
Cost is less than thefee if emissions were
not reduced.
Total Feeof Abatement
Standards and Fees
Level of Emissions
Dollarsper unit
of Emissions MSC
MCA
3
12E*
Fee
Slide 20
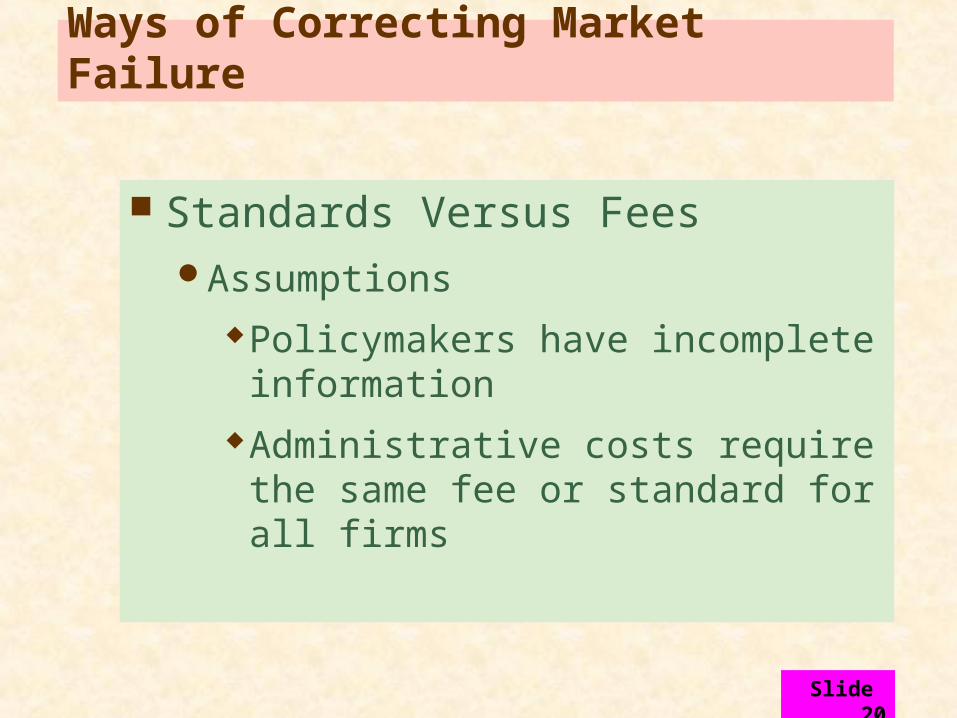
Standards Versus FeesAssumptions
Policymakers have incomplete information
Administrative costs require the same fee or standard for all firms
Ways of Correcting Market Failure
Slide 21
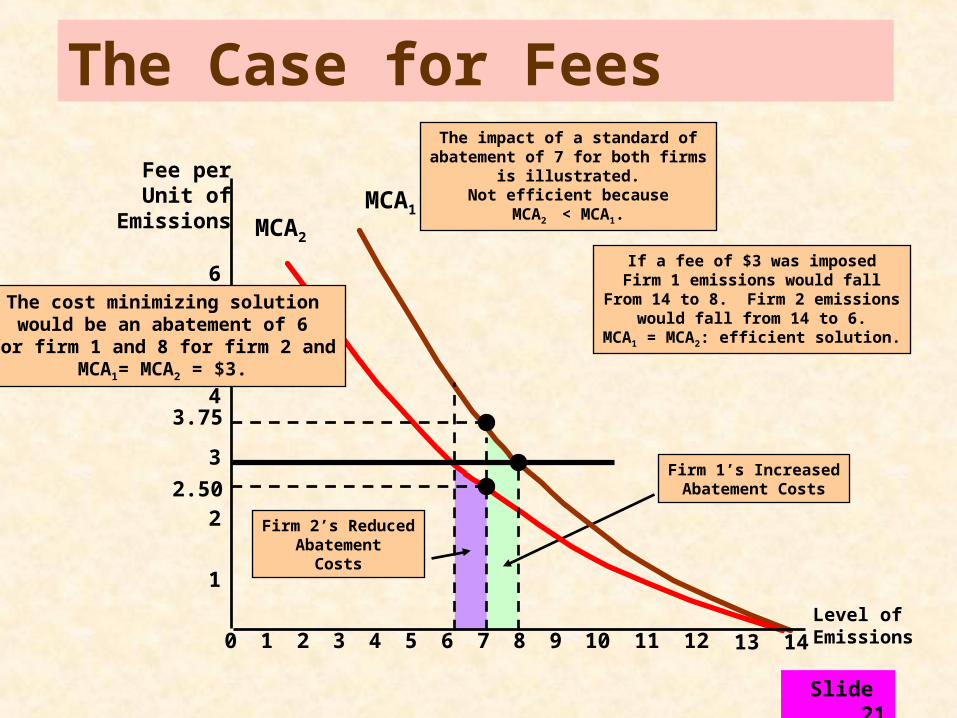
Firm 2’s ReducedAbatement
Costs
Firm 1’s IncreasedAbatement Costs
MCA1
MCA2
The Case for Fees
Level of Emissions
2
4
6
Fee perUnit of
Emissions
0 1 2 3 4 5 6 7 8 9 10 11 12 13
1
3
5
14
The cost minimizing solutionwould be an abatement of 6
for firm 1 and 8 for firm 2 andMCA1= MCA2 = $3.
3.75
2.50
The impact of a standard ofabatement of 7 for both firms
is illustrated.Not efficient because
MCA2 < MCA1.
If a fee of $3 was imposedFirm 1 emissions would fall
From 14 to 8. Firm 2 emissionswould fall from 14 to 6.
MCA1 = MCA2: efficient solution.
Slide 22
The Case for Fees
Assume two firms with the same marginal social cost ofAssume two firms with the same marginal social cost ofemissions but different marginal cost of abatement as emissions but different marginal cost of abatement as reflected in different MCA curves.reflected in different MCA curves.
As in the previous diagram,efficiency requires that total As in the previous diagram,efficiency requires that total emissions be reduced by 14 units to 12.emissions be reduced by 14 units to 12.
The cheapest way is to have Firm 1 reduce by 6 and The cheapest way is to have Firm 1 reduce by 6 and Firm 2 by 8. In this case both firms would have MCA ofFirm 2 by 8. In this case both firms would have MCA of$3, and the result would be achieved with a fee of $3.$3, and the result would be achieved with a fee of $3.
Slide 23
The Case for Fees
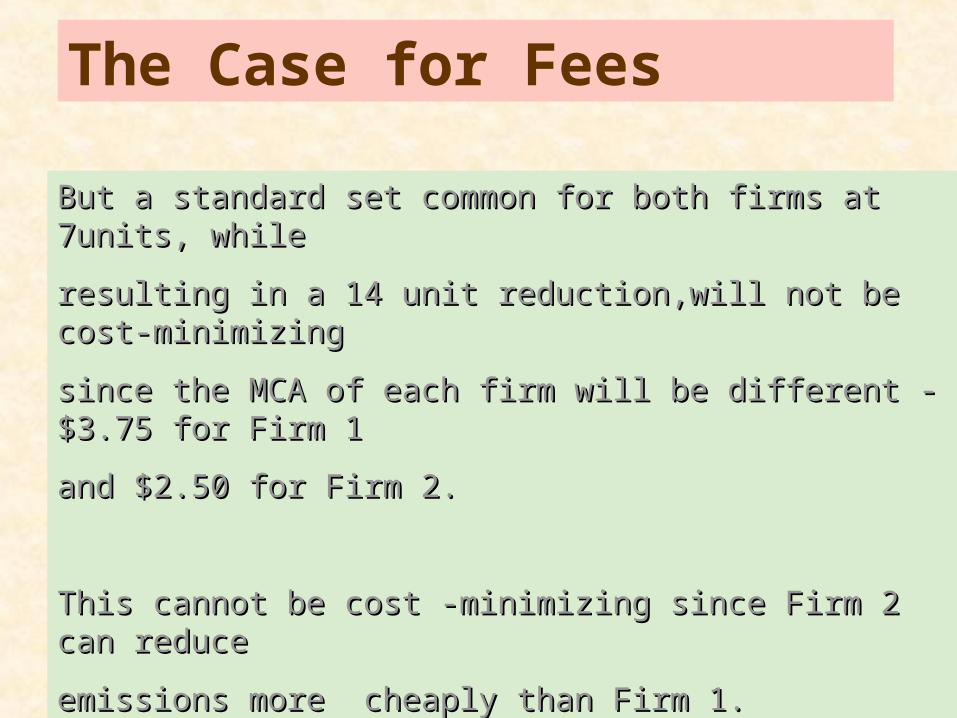
But a standard set common for both firms at 7units, while But a standard set common for both firms at 7units, while
resulting in a 14 unit reduction,will not be cost-minimizingresulting in a 14 unit reduction,will not be cost-minimizing
since the MCA of each firm will be different - $3.75 for Firm 1since the MCA of each firm will be different - $3.75 for Firm 1
and $2.50 for Firm 2.and $2.50 for Firm 2.
This cannot be cost -minimizing since Firm 2 can reduce This cannot be cost -minimizing since Firm 2 can reduce
emissions more cheaply than Firm 1.emissions more cheaply than Firm 1.
Slide 24
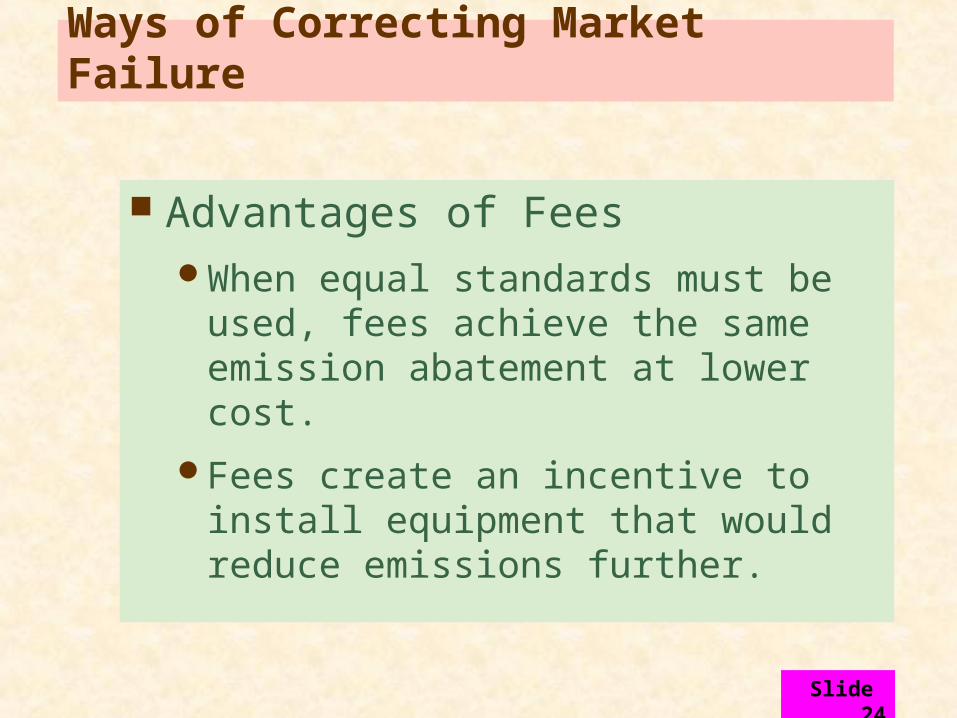
Advantages of FeesWhen equal standards must be used,
fees achieve the same emission abatement at lower cost.
Fees create an incentive to install equipment that would reduce emissions further.
Ways of Correcting Market Failure
Slide 25
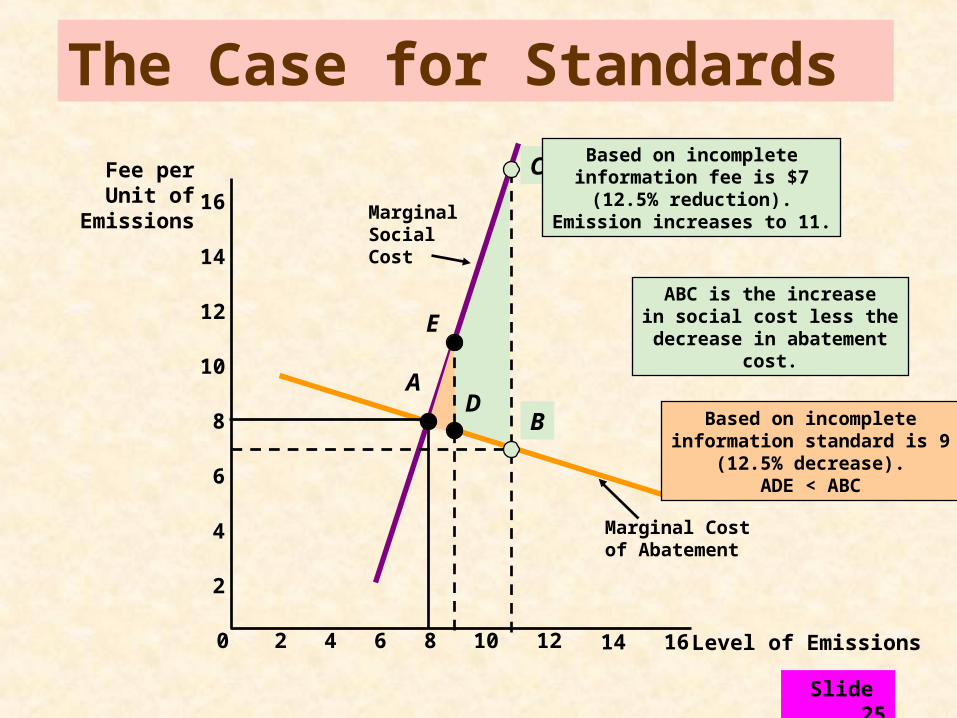
ABC is the increasein social cost less thedecrease in abatement
cost.
MarginalSocialCost
Marginal Costof Abatement
The Case for Standards
Level of Emissions
Fee perUnit of
Emissions
0 2 4 6 8 10 12 14 16
2
4
6
8
10
12
14
16
E
Based on incompleteinformation standard is 9
(12.5% decrease).ADE < ABC
DA
B
C Based on incompleteinformation fee is $7
(12.5% reduction).Emission increases to 11.
Slide 26
The Case for Standards
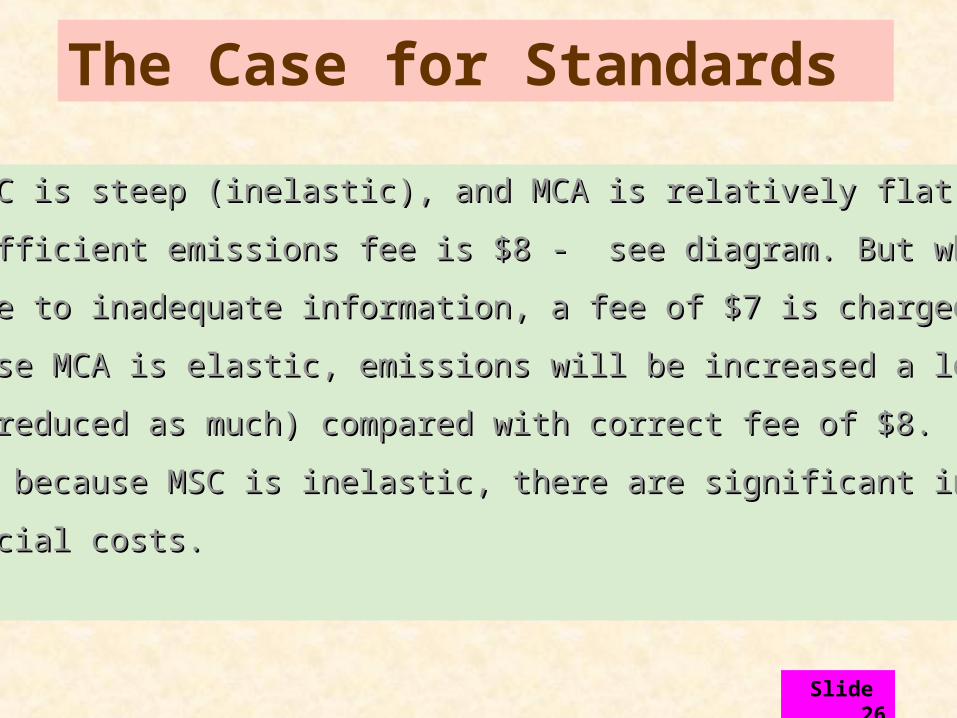
If MSC is steep (inelastic), and MCA is relatively flat(elastic)If MSC is steep (inelastic), and MCA is relatively flat(elastic)
The efficient emissions fee is $8 - see diagram. But what The efficient emissions fee is $8 - see diagram. But what
if due to inadequate information, a fee of $7 is charged.if due to inadequate information, a fee of $7 is charged.
Because MCA is elastic, emissions will be increased a lotBecause MCA is elastic, emissions will be increased a lot
(not reduced as much) compared with correct fee of $8.(not reduced as much) compared with correct fee of $8.
Also, because MSC is inelastic, there are significant increasesAlso, because MSC is inelastic, there are significant increases
in social costs.in social costs.

Slide 27
The Case for Standards
Compare the social loss - the increase in social costs less Compare the social loss - the increase in social costs less the increase in abatement costs(ACD), with the loss if a the increase in abatement costs(ACD), with the loss if a similar error were made in setting a standard - at say 9 units similar error were made in setting a standard - at say 9 units instead of 8. Now the loss is the smaller triangle AED.instead of 8. Now the loss is the smaller triangle AED.
Slide 28
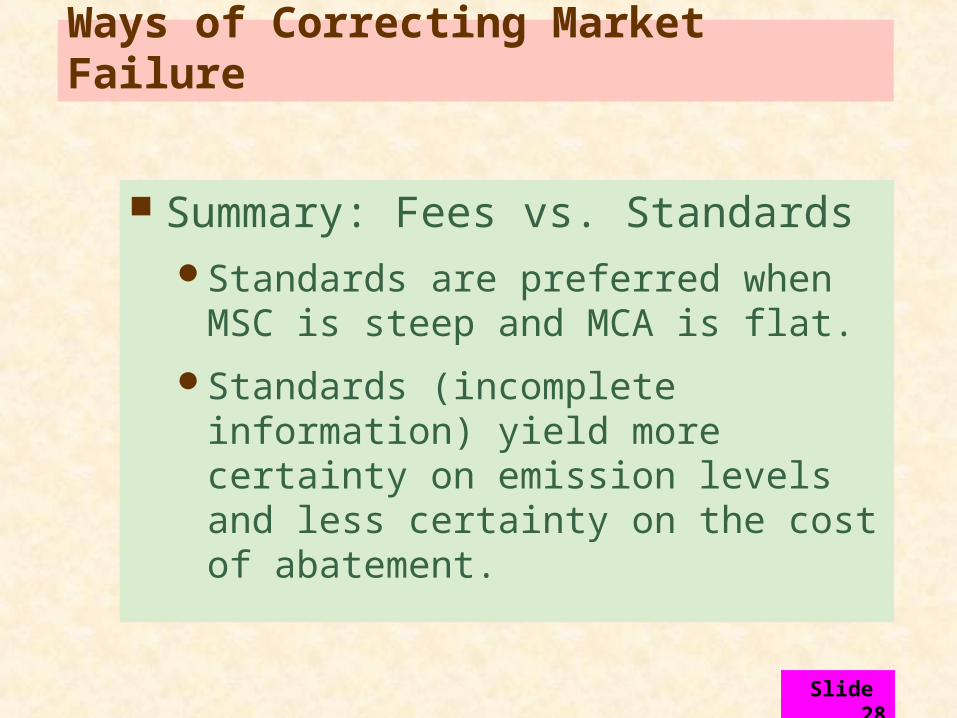
Summary: Fees vs. StandardsStandards are preferred when MSC is
steep and MCA is flat.
Standards (incomplete information) yield more certainty on emission levels and less certainty on the cost of abatement.
Ways of Correcting Market Failure
Slide 29
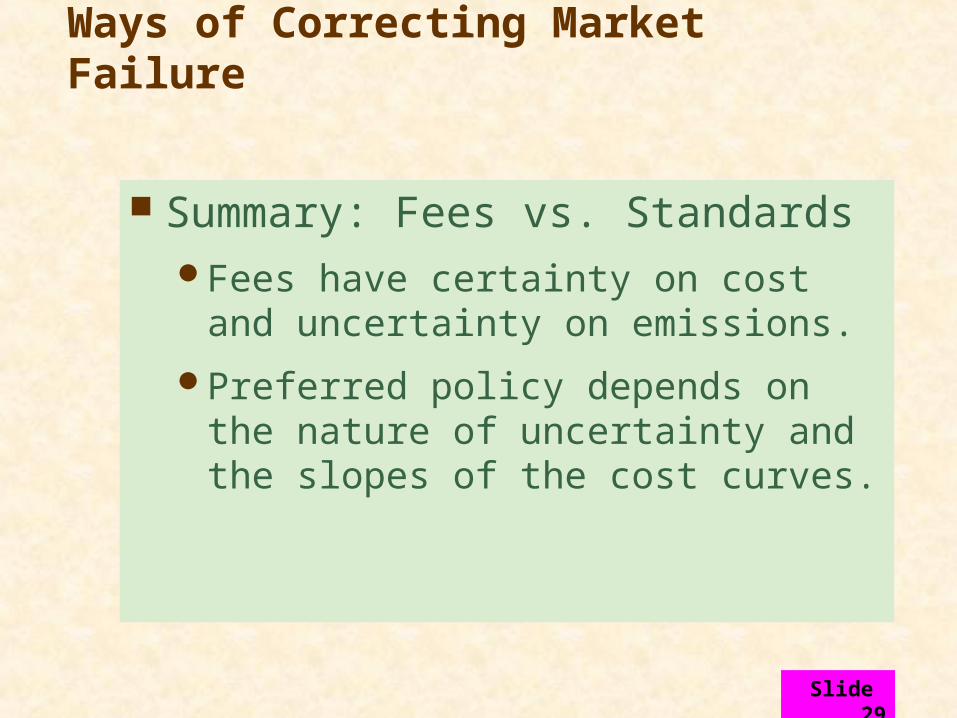
Summary: Fees vs. StandardsFees have certainty on cost and
uncertainty on emissions.
Preferred policy depends on the nature of uncertainty and the slopes of the cost curves.
Ways of Correcting Market Failure
Slide 30
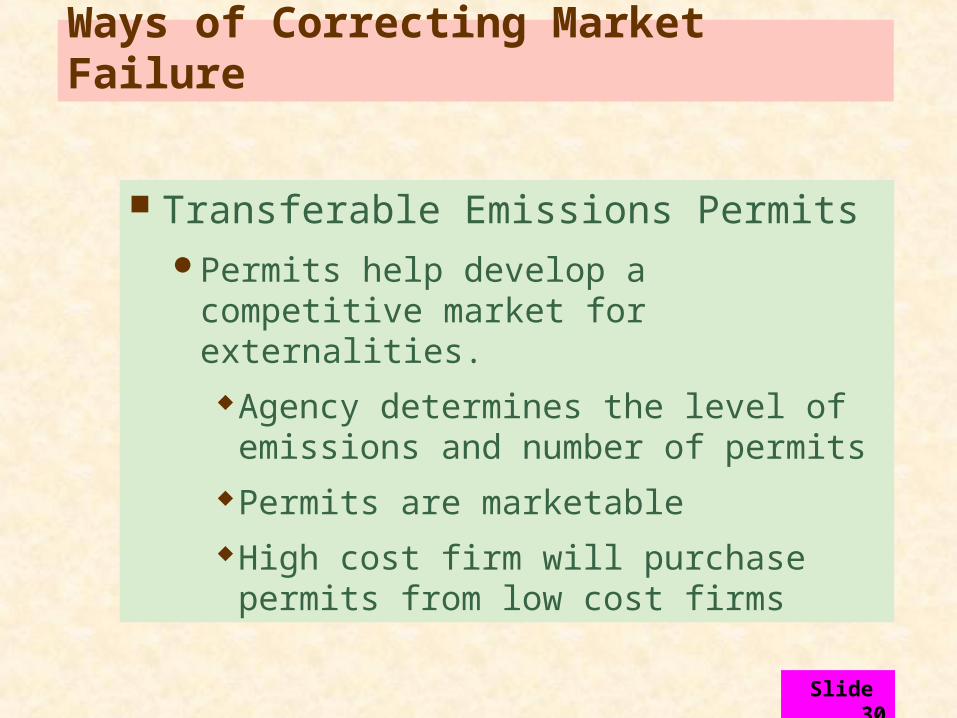
Transferable Emissions PermitsPermits help develop a competitive
market for externalities.Agency determines the level of
emissions and number of permitsPermits are marketableHigh cost firm will purchase permits
from low cost firms
Ways of Correcting Market Failure
Slide 31
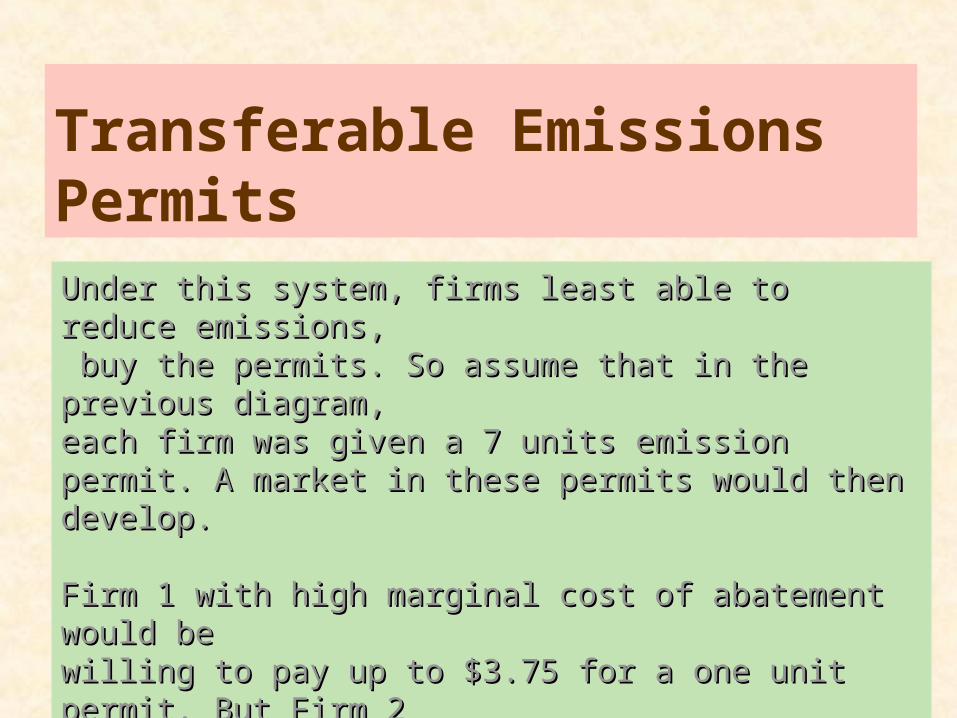
Transferable Emissions PermitsUnder this system, firms least able to reduce emissions,Under this system, firms least able to reduce emissions, buy the permits. So assume that in the previous diagram,buy the permits. So assume that in the previous diagram,each firm was given a 7 units emission permit. A market in each firm was given a 7 units emission permit. A market in these permits would then develop.these permits would then develop.
Firm 1 with high marginal cost of abatement would beFirm 1 with high marginal cost of abatement would bewilling to pay up to $3.75 for a one unit permit. But Firm 2willing to pay up to $3.75 for a one unit permit. But Firm 2has lower marginal cost of $2.50 so would be willing to sellhas lower marginal cost of $2.50 so would be willing to sellpermits to Firm 1 for between $2.50 and $3.75.permits to Firm 1 for between $2.50 and $3.75.

Slide 32
Transferable Emissions Permits
If there are enough firms and permits, a competitive market If there are enough firms and permits, a competitive market in permits will develop, and the equilibrium price will in permits will develop, and the equilibrium price will tend to equal the marginal cost of abatement for all firms.tend to equal the marginal cost of abatement for all firms.
Otherwise, a firm with a higher marginal cost will find it Otherwise, a firm with a higher marginal cost will find it profitable to purchase more permits, pushing up their price.profitable to purchase more permits, pushing up their price.
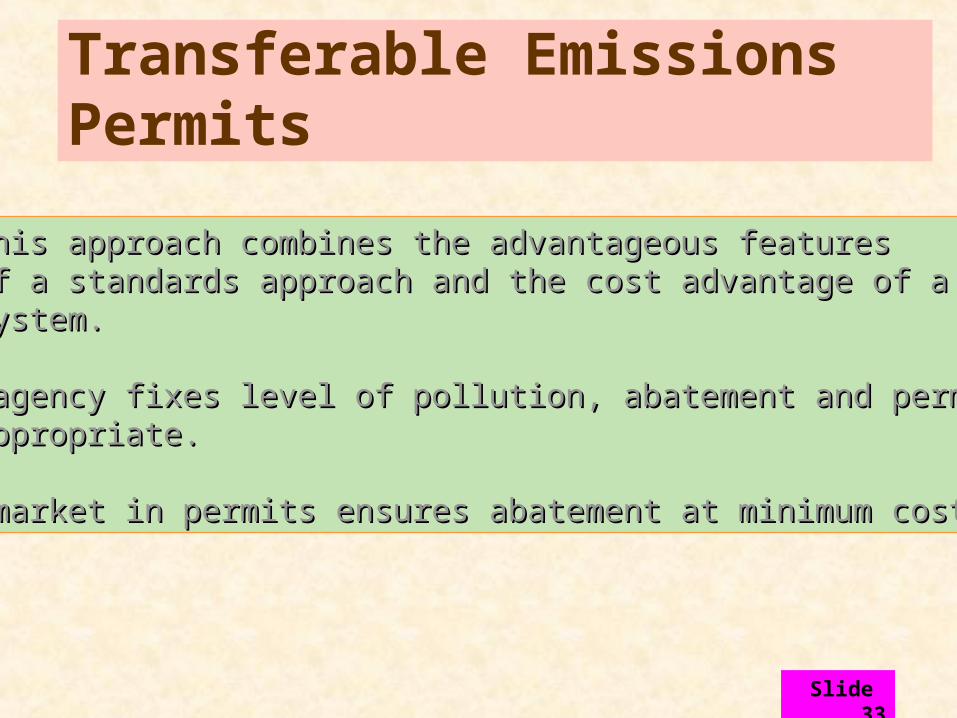
Slide 33
Transferable Emissions Permits
This approach combines the advantageous featuresThis approach combines the advantageous featuresof a standards approach and the cost advantage of a fee of a standards approach and the cost advantage of a fee system.system.
-agency fixes level of pollution, abatement and permits-agency fixes level of pollution, abatement and permitsappropriate.appropriate.
-market in permits ensures abatement at minimum cost.-market in permits ensures abatement at minimum cost.
Slide 34
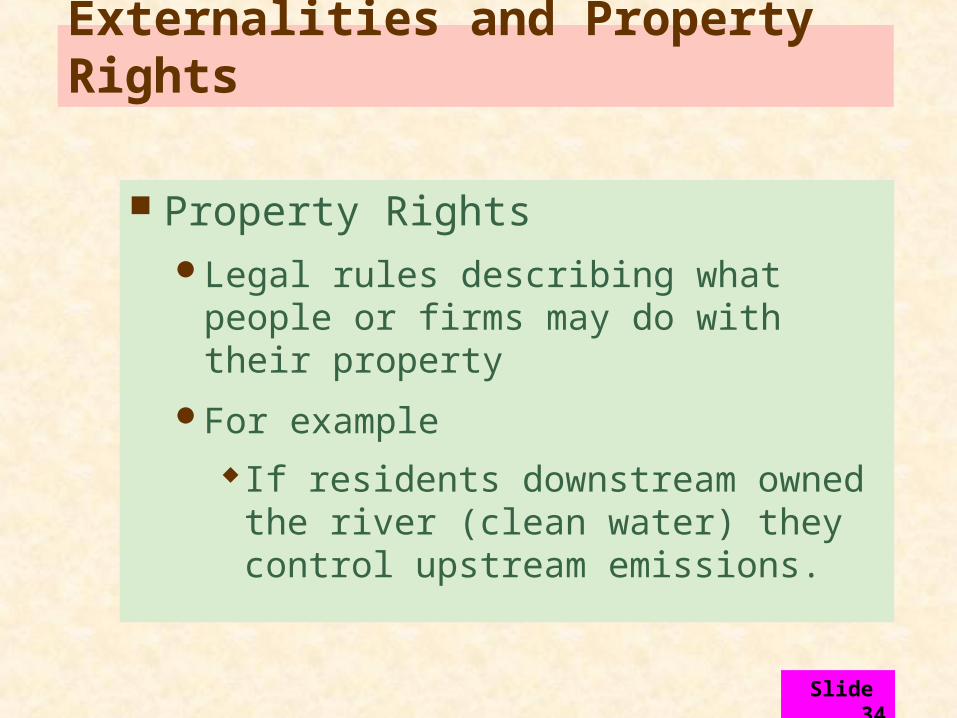
Externalities and Property Rights
Property RightsLegal rules describing what people or
firms may do with their property
For example If residents downstream owned the
river (clean water) they control upstream emissions.
Slide 35
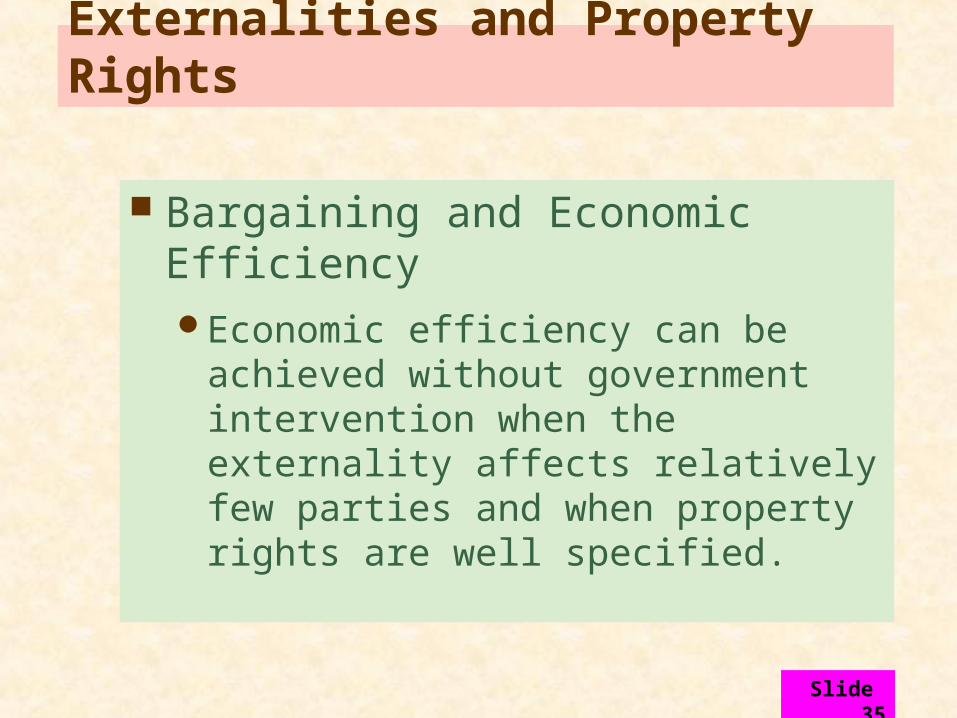
Bargaining and Economic EfficiencyEconomic efficiency can be achieved
without government intervention when the externality affects relatively few parties and when property rights are well specified.
Externalities and Property Rights
Slide 36
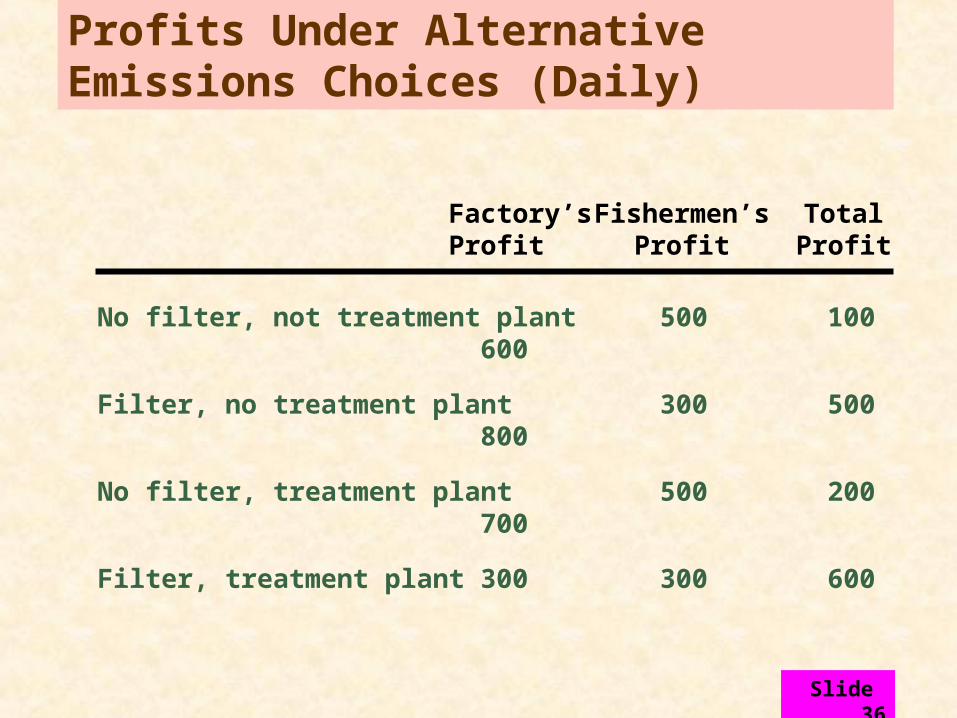
Profits Under AlternativeEmissions Choices (Daily)
No filter, not treatment plant 500 100 600
Filter, no treatment plant 300 500 800
No filter, treatment plant 500 200 700
Filter, treatment plant 300 300 600
Factory’s Fishermen’s TotalProfit Profit Profit
Slide 37
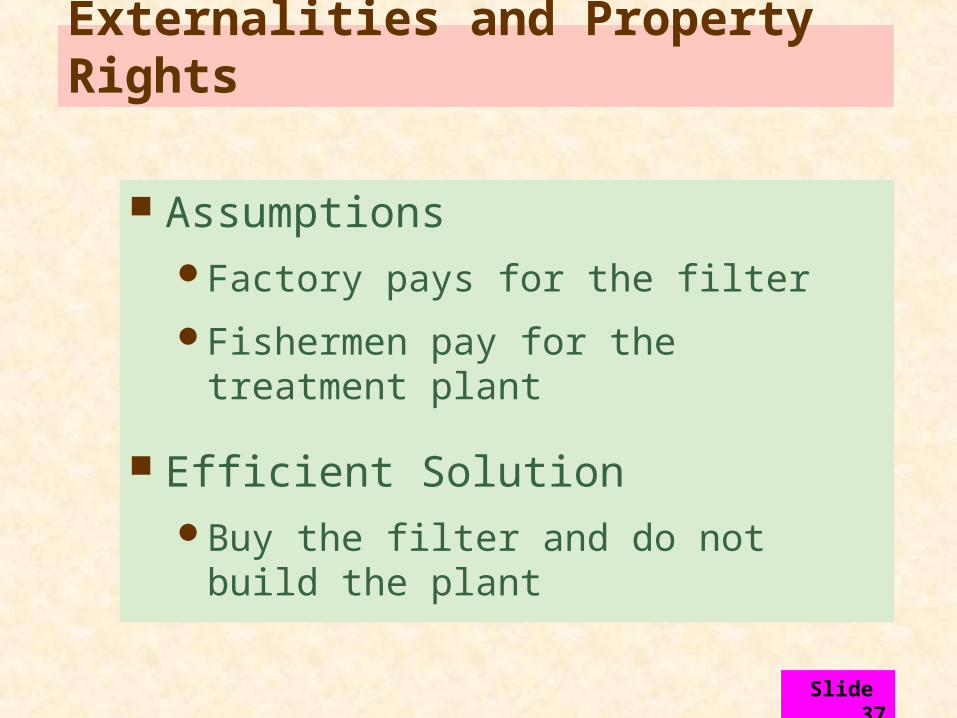
AssumptionsFactory pays for the filter
Fishermen pay for the treatment plant
Efficient SolutionBuy the filter and do not build the plant
Externalities and Property Rights
Slide 38
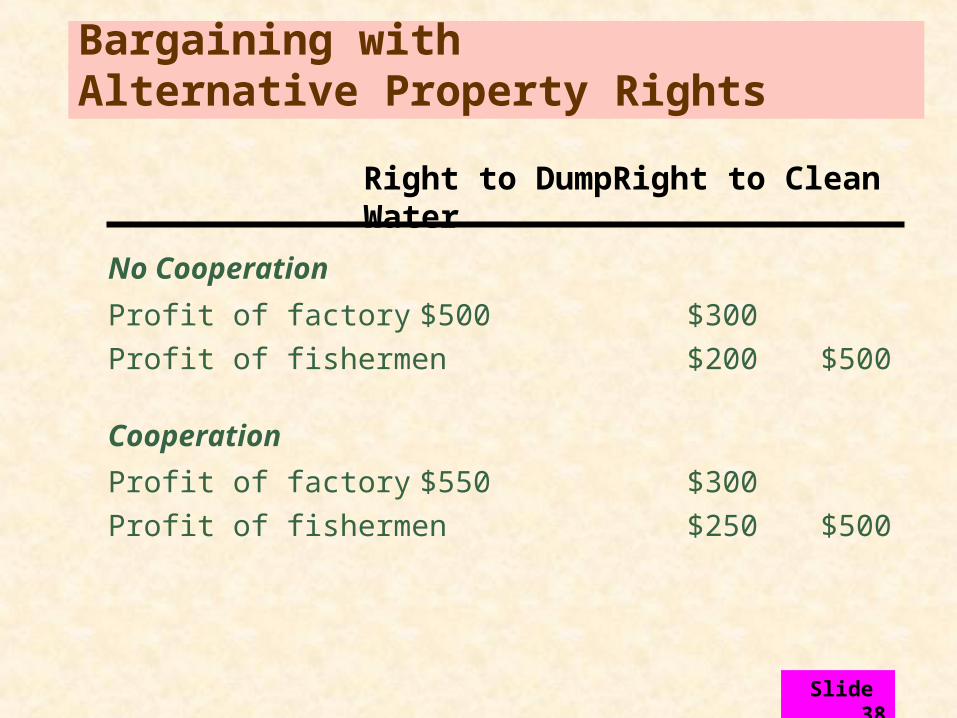
Bargaining with Alternative Property Rights
No Cooperation
Profit of factory $500 $300
Profit of fishermen $200 $500
Cooperation
Profit of factory $550 $300
Profit of fishermen $250 $500
Right to Dump Right to Clean Water
Slide 39
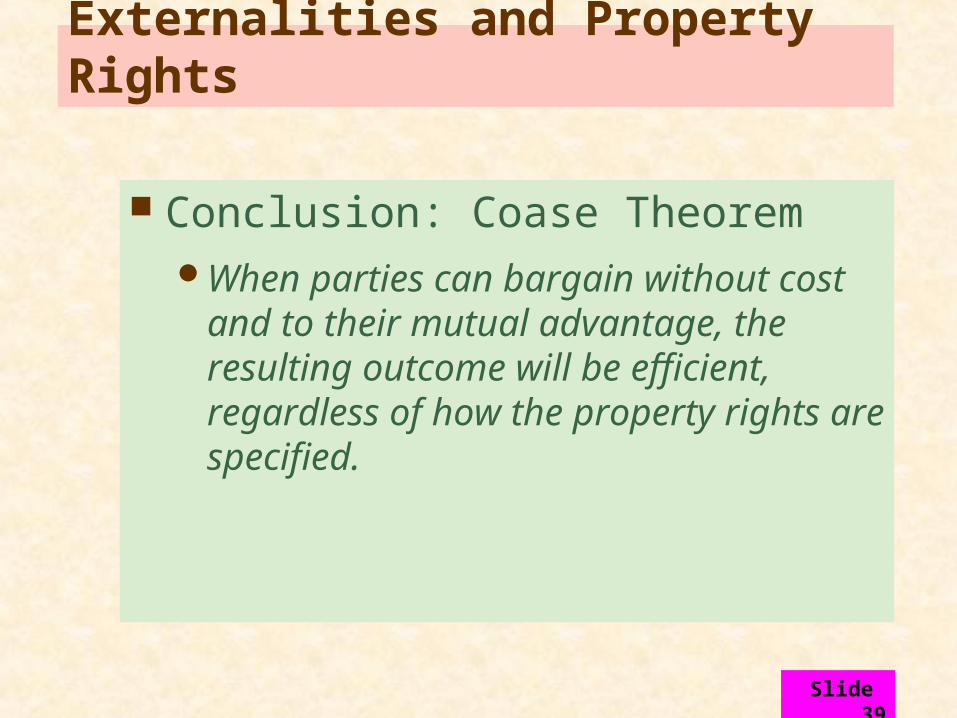
Conclusion: Coase TheoremWhen parties can bargain without cost
and to their mutual advantage, the resulting outcome will be efficient, regardless of how the property rights are specified.
Externalities and Property Rights
Slide 40
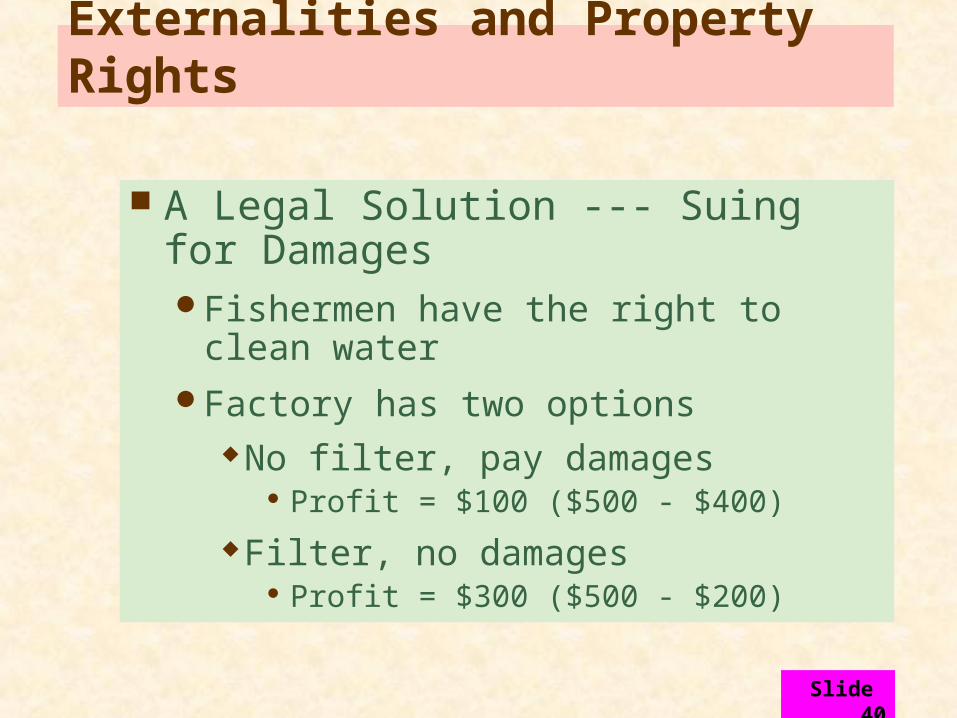
A Legal Solution --- Suing for DamagesFishermen have the right to clean waterFactory has two options
No filter, pay damages Profit = $100 ($500 - $400)
Filter, no damages Profit = $300 ($500 - $200)
Externalities and Property Rights
Slide 41
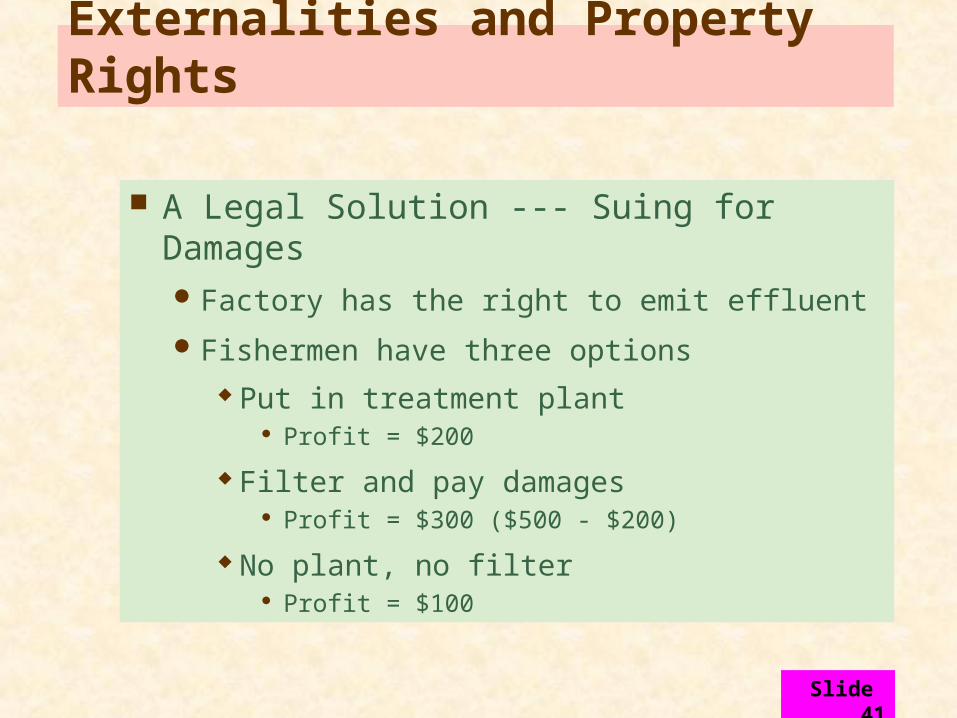
A Legal Solution --- Suing for DamagesFactory has the right to emit effluent
Fishermen have three options Put in treatment plant
Profit = $200
Filter and pay damages Profit = $300 ($500 - $200)
No plant, no filter Profit = $100
Externalities and Property Rights
Slide 42
Summary
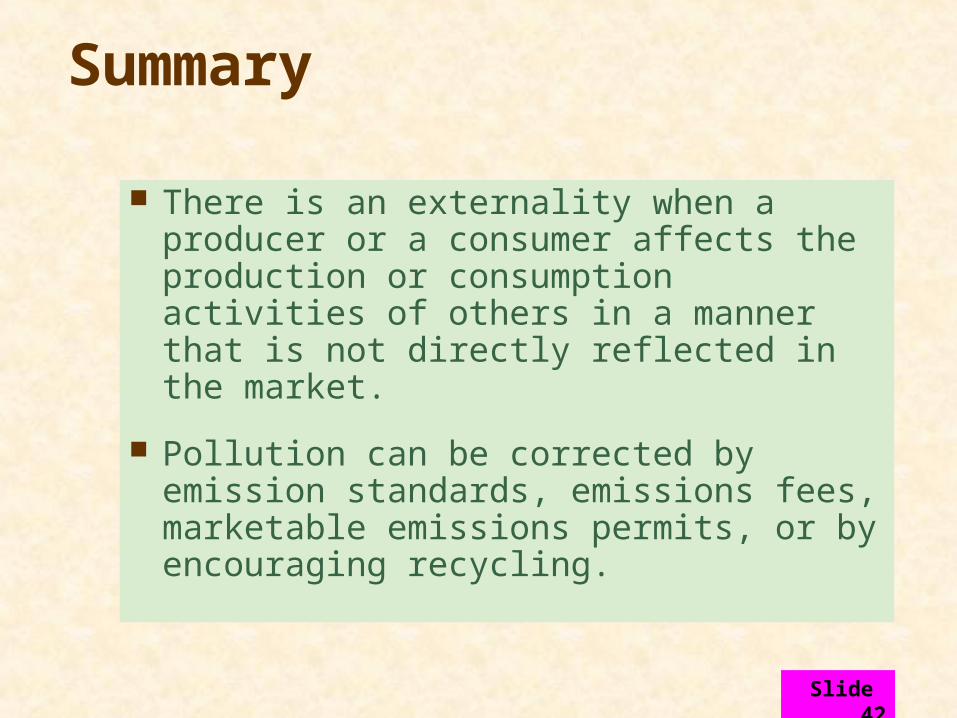
There is an externality when a producer or a consumer affects the production or consumption activities of others in a manner that is not directly reflected in the market.
Pollution can be corrected by emission standards, emissions fees, marketable emissions permits, or by encouraging recycling.
Slide 43
Summary
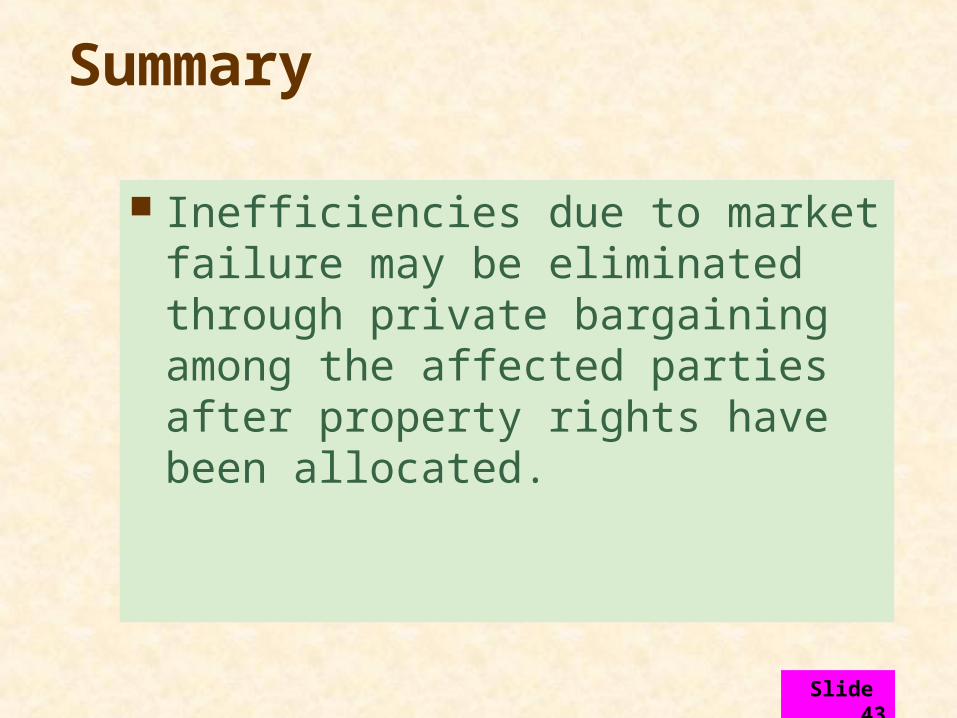
Inefficiencies due to market failure may be eliminated through private bargaining among the affected parties after property rights have been allocated.


![[Economics] Perfectly Competitive Market](https://img.pdfslide.net/doc/110x75/55847362d8b42a6b4d8b4d5a/economics-perfectly-competitive-market.jpg)