Embed Size (px)
Citation preview

Slide 1
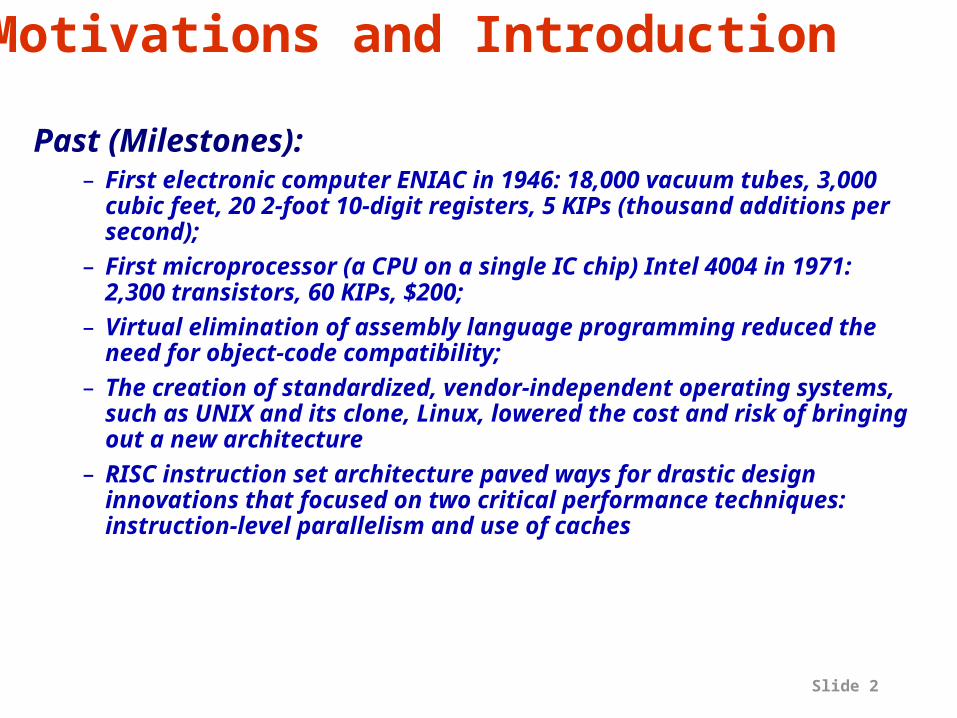
Motivations and Introduction
•Phenomenal growth in computer industry/technology:
X2/18mo in 20yr. multi-GFLOPs processors, largely due to–Micro-electronics technology–Computer Design innovations
•We have come a long way in a short time of 56 years since the 1st general purpose computer in 1946:
Slide 2
Motivations and Introduction
Past (Milestones):– First electronic computer ENIAC in 1946: 18,000 vacuum tubes, 3,000 cubic feet, 20 2-foot 10-digit registers, 5 KIPs (thousand additions per second);
– First microprocessor (a CPU on a single IC chip) Intel 4004 in 1971: 2,300 transistors, 60 KIPs, $200;
– Virtual elimination of assembly language programming reduced the need for object-code compatibility;
– The creation of standardized, vendor-independent operating systems, such as UNIX and its clone, Linux, lowered the cost and risk of bringing out a new architecture
– RISC instruction set architecture paved ways for drastic design innovations that focused on two critical performance techniques: instruction-level parallelism and use of caches

Slide 3
Motivations and Introduction
Present (State of the art): – Microprocessors approaching/surpassing 10 GFLOPS;– A high-end microprocessor (<$10K) today is easily more powerful than a supercomputer (>$10million) ten years ago;
– While technology advancement contributes a sustained annual growth of 35%, innovative computer design accounts for another 25% annual growth rate a factor of 15 in performance gains!

Slide 4
Motivations and Introduction
Present (State of the art): – Three different computing markets (fig. 1.3):
» Desktop Computing –- driven by price-performance (a few hundreds through over 10K);
» Servers – availability driven (distinguished from reliability), providing sustained high performance (fig. 1.2)
» Embedded Computers – fastest growing portion of the computer market, real-time performance driven, and need to minimize memory and power, as well as ASIC

Slide 5
Motivations and Introduction
Present (State of the art): – The Task of the Computer Designer (Fig. 1.4):
» Instruction Set Architecture (Traditional view of what Computer Architecture is), the boundary between software and hardware;
» Organization, high-level aspects of a computer’s design, such as the memory system, the bus structure, the internal design of CPU, based on a given instruction set architectrue;
» Hardware, the specifics of a machine, including the detailed logic design and the packaging technology of the machine.
Future (Technology Trends): – A truly successful instruction set architecture (ISA) should last for decades, however it takes an computer architect’s acute observation and knowledge of the rapidly changing technology, in order for the ISA to survive and cope with such changes:

Slide 6
Motivations and IntroductionFuture (Technology Trends):
» IC logic technology: transistor count on a chip grows at 55% annual rate (35% density growth rate + 10-20% die size growth) while device speed scales more slowly;
» Semiconductor DRAM: density grows at 60% annually while cycle time improves very slowly (decreasing one-third in ten years). Bandwidth per chip increases twice as fast as latency decreases;
» Magnetic dish technology: density increases at 100% annual rate since 1990 while access time improves at about a third every ten years; and
» Network technology: both latency and bandwidth have been improving, with more focus on bandwidth of late; the increasing importance of networking has led to faster improvement in performance than before—Internet bandwidth doubles every year in the U.S.
» Scaling of transistor performance: while transistor density increases quadratically with linear decrease in feature size, transistor performance increases roughly linearly with decrease in feature sizechallenge & opportunity for challenge & opportunity for computer designercomputer designer!
» Wires and power in IC: propagation delay and power needs?

Slide 7
Motivations and Introduction• Cost, Price and Their Trends:
– Understanding cost and pricing structure of the industry and market is key to cost-sensitive design of computers;
– The Learning Curve: manufacturing costs decrease over time (Fig.1.5&1.6), best measured by change in yield helps project costs over product’s life;

Slide 8
Motivations and Introduction
• Cost, Price and Their Trends:– Cost of an IC (Fig. 1.8):
yieldtestFinalCostCostCostCost testfinalpackagingdietestingdie
IC ______ _&_
yieldDiewaferperDieCost
Costwafer
die___
__

Slide 9
Motivations and Introduction
• Cost, Price and Their Trends:– Cost of an IC: die yield has been obtained empirically, where ά corresponds inversely to the number of masking levels (manufacturing complexity). For today’s metal CMOS processes, it’s estimated at 4.0
areaDiediameterWafer
areaDiediameterWafer
waferperDie_2
__
)2/_(__
2
)
____1(__
areaDieareaunitperDefectsyieldWaferyieldDie

Slide 10
Motivations and Introduction
• Distribution of Cost in a System• Cost vs. Price (Fig. 1.10)

Slide 11
Motivations and Introduction
• Cost vs. Price (Fig. 1.10)– Component cost(CC): original cost from a designer’s point of view;
– Direct cost (DC, 20% of CC): making a product (labor cost, scrap, warranty, etc), not including service and maintenance;
– Gross margin (GM, 33% of CC+DC): indirect cost overhead: R&D, marketing, sales, manufacturing equipment maintenance, building rental, cost of financing, pretax profits, and taxes;
Average selling price (ASP) = CC + DC + GM– Average discount (AD, 33% of ASP): volume discounts by manufacturers;
List price = ASP + AD

Slide 12
Performances & Quantitative Principles
• “X is n times faster than Y” • Performance (throughput) is inversely proportional to execution time:
• Definition of time:– wall-clock time: response time or elapsed time;– CPU time: the accumulated time during which CPU is computing:
»user CPU time»system CPU time
– An example from UNIX: 90.7u 12.9s 2:39 65%
»90.7u: user CPU time (seconds)»12.9s: system CPU time»2:39(159 sec): elapsed time»65%: percentage of CPU time
nimeExecutionT
imeExecutionT
X
Y
_
_
nePerformanc
ePerformanc
Y
X
_
_
Slide 13
Performances & Quantitative Principles
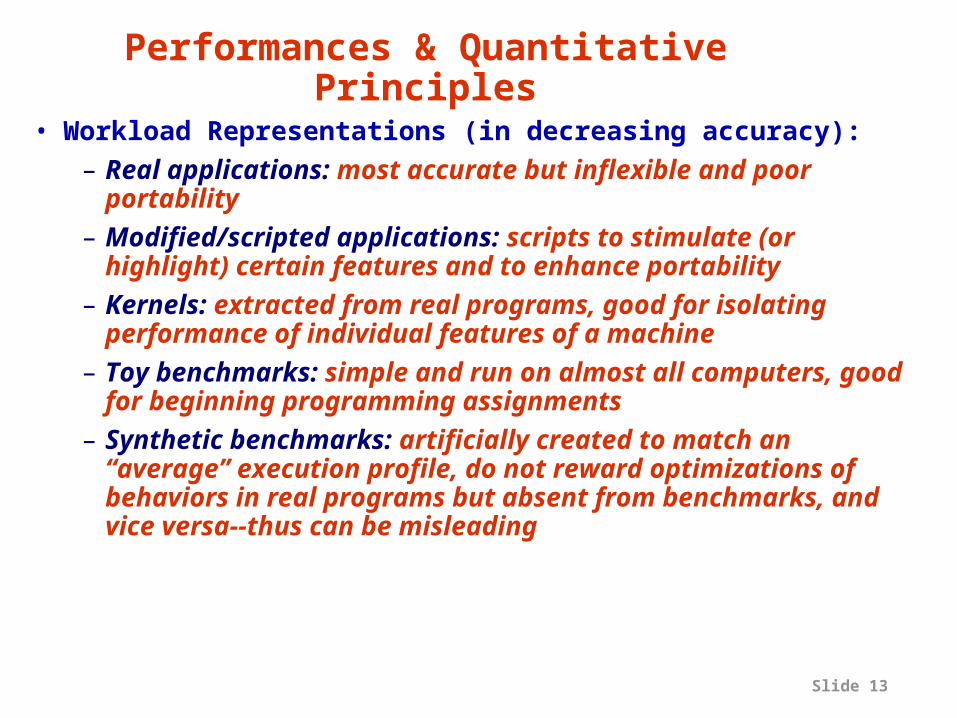
• Workload Representations (in decreasing accuracy):– Real applications: most accurate but inflexible and poor portability
– Modified/scripted applications: scripts to stimulate (or highlight) certain features and to enhance portability
– Kernels: extracted from real programs, good for isolating performance of individual features of a machine
– Toy benchmarks: simple and run on almost all computers, good for beginning programming assignments
– Synthetic benchmarks: artificially created to match an “average” execution profile, do not reward optimizations of behaviors in real programs but absent from benchmarks, and vice versa--thus can be misleading

Slide 14
Performances & Quantitative Principles
• Benchmark Suites: collection of kernels, real andbenchmark programs, lessening the weakness of any one
benchmark by the presence of others.(fig. 1.11)– Desktop Benchmark Suites:
» CPU-intensive benchmarks: SPECSPEC (Standard Performance Evaluation Corporation): SPEC89SPEC89 SPEC92SPEC92 SPEC95SPEC95 SPEC2000SPEC2000(11 int CINTCINT & 14 fp CFP2000CFP2000, fig. 1.12): real programs modified for portability and highlighting CPU
» Graphics-intensive benchmarks: SPECviewperfSPECviewperf for systems supporting the OpenGL graphics library, SPECapcSPECapc for applications with intensive use of graphics
– Server Benchmark Suites: » CPU-throughput benchmarks: SPEC CPU2000SPEC CPU2000 SPECrate» I/O-intensive benchmarks: SPECSFSSPECSFS for file server, SPECWebSPECWeb for web server
» Transaction-processing (TP) benchmarks: TPCTPC (Transaction Processing Council): TCP-A (85) TCP-C (complex query) TCP-H (ad-hoc decision support) TCP-R (business decision support) TCP-W (web-oriented)
– Embedded Benchmarks: EEMBC EEMBC (“embassy suites”, fig. 1.13)

Slide 15

Slide 16

Slide 17

Slide 18
Slide 19

Slide 20

Slide 21