Embed Size (px)
Citation preview

Slide 10.1
Veal, Research Methods for Leisure and Tourism, 3rd edition © Pearson Education Limited 2006
Chapter 10: Chapter 10: SamplingSampling

Slide 10.2
Veal, Research Methods for Leisure and Tourism, 3rd edition © Pearson Education Limited 2006
Contents
I. Samples and populationsII. Representativeness – random samplingIII. Sample sizeIV. WeightingV. Sampling for qualitative research.

Slide 10.3
Veal, Research Methods for Leisure and Tourism, 3rd edition © Pearson Education Limited 2006
A. Samples and populations Population:
Total category of subjects that is the focus of attention in a particular research project (can be non-human)
Sample: A number of subjects drawn from the population
Two key issues:1. What procedures must be followed to ensure that the
sample is representative of the population?2. How large should the sample be?

Slide 10.4
Veal, Research Methods for Leisure and Tourism, 3rd edition © Pearson Education Limited 2006
B. Representativeness Achieved by random sampling:
A selection process which ensures that all members of the population have an equal chance of inclusion in the sample
Systematic Designed to ensure representativeness
An unrepresentative sample is: biased How is random sampling achieved in
practice?

Slide 10.5
Veal, Research Methods for Leisure and Tourism, 3rd edition © Pearson Education Limited 2006
Random sampling in household surveys
Ideally For example, 10 million population – sample of 1000: all
10 m names put in a drum and 1000 drawn. In practice:
For national/regional surveys – multi-stage sampling used
1. Select states/regions2. Within state/region select local government areas
(LGA) or constituencies/electorates3. Within LGAs or constituencies/electorates, for
face-to-face interviews, select streets (telephone surveys select numbers at this point)
4. Select ‘clusters’ of 10–15 houses.

Slide 10.6
Veal, Research Methods for Leisure and Tourism, 3rd edition © Pearson Education Limited 2006
Random sampling in site/user/visitor surveys
Alternative 1: Stationary interviewer – mobile user: For example, interviewing at entrance/exit Sample by selecting: ‘next person to pass entrance/exit point’
Alternative 2: Stationary user – mobile interviewer For example, interviewing people on a beach Interviewers should have a set route/rules to follow – for
example, ‘interview every third person/group’ Alternative 3: Handouts
Handing out questionnaires to customers etc. for self-completion
Not generally recommended unless closely supervised – generally very poor response rates.

Slide 10.7
Veal, Research Methods for Leisure and Tourism, 3rd edition © Pearson Education Limited 2006
Sampling for street surveys – quota sampling
Can be used when data are available on key characteristics of population: Age structure/sex ratio of users – from membership
records Age/sex structure of a community – from census
Interviewing target numbers determined by population characteristics For example, if population census indicates 12% retired
and if overall sample size is 200 then interview 24 retired people.

Slide 10.8
Veal, Research Methods for Leisure and Tourism, 3rd edition © Pearson Education Limited 2006
Sampling for mail surveys Sample from mail-out list 100% sample often used.

Slide 10.9
Veal, Research Methods for Leisure and Tourism, 3rd edition © Pearson Education Limited 2006
C. Sample size Required sample size is not related to
population size (except for small populations – see slides 10.22 & 10.23)
See – political opinion polls.

Slide 10.10
Veal, Research Methods for Leisure and Tourism, 3rd edition © Pearson Education Limited 2006
Opinion polls and sample size
Error (Confidence intervals)
Voting intentions
+0.9%%2%Nader/Camejo
+3.1%3.1%45%Kerry/Edwards
+3.1%3.1%48%Bush/Cheney
USA – Sept ’04 – NBC/WSJ – voters 156 m – sample size 1006

Slide 10.11
Veal, Research Methods for Leisure and Tourism, 3rd edition © Pearson Education Limited 2006
Error(Confidence intervals)
Voting intentions
+1.4%%6%Greens
+3.0%3.0%42%Labour
+3.0%3.0%39%Liberal/National
Australia – Aug ’04 – Newspoll – voters 13 m – sample size 1047
+0.9%%2%Nader/Camejo
+3.1%3.1%45%Kerry/Edwards
+3.1%3.1%48%Bush/Cheney
USA – Sept ’04 – registered voters 156 m – sample size 1006
Sample sizes and margins of error are similar, despite great difference in population.
Opinion polls and sample size (contd.)

Slide 10.12
Veal, Research Methods for Leisure and Tourism, 3rd edition © Pearson Education Limited 2006
Determinants of sample size
1. The required level of precision in the results2. The level of detail in the proposed analysis3. The available budget.
Slide 10.13
Veal, Research Methods for Leisure and Tourism, 3rd edition © Pearson Education Limited 2006
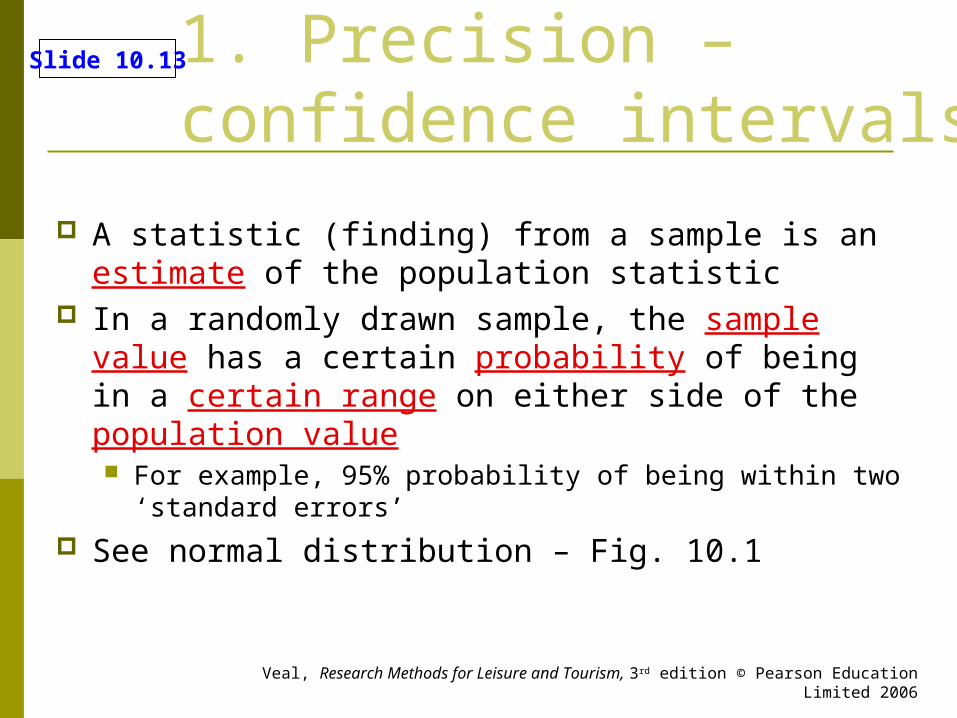
1. Precision – confidence intervals
A statistic (finding) from a sample is an estimate of the population statistic
In a randomly drawn sample, the sample value has a certain probability of being in a certain range on either side of the population value For example, 95% probability of being within two
‘standard errors’ See normal distribution – Fig. 10.1

Slide 10.14
Veal, Research Methods for Leisure and Tourism, 3rd edition © Pearson Education Limited 2006
Precision - confidence intervalsnormal curve(Fig. 10.1)

Slide 10.15
Veal, Research Methods for Leisure and Tourism, 3rd edition © Pearson Education Limited 2006
Confidence intervals and sample size – Table 10.1
So CI for 20% finding is 30% ± 4.0 = a range of 26.0% to 34.0%.CI is not related to population size.NB. CI for p = CI for 100−pCI for 50% is the largest in absolute termsThis table refers to 95% probability CIs – other probabilities can be calculated – for example, 99%.
Confidence intervals (CIs) (+ %)
+0.9+1.2+1.9+2.6+3.5+4.0+4.3+4.4500
1 or 99%
2 or 98%
5 or 95%
10 or 90%
20 or 80%
30 or 70%
40 or 60%
50%
Percentages found from sample (‘results’)Sample size (N)

Slide 10.16
Veal, Research Methods for Leisure and Tourism, 3rd edition © Pearson Education Limited 2006
Confidence intervals and sample size – Table 10.1 (contd.)
+0.9+1.2+1.9+2.6+3.5+4.0+4.3+4.4500
Confidence intervals (CIs) (+ %)
+0.4+0.6+1.0+1.3+1.7+2.0+2.1+ 2.22000
1 or 99%
2 or 98%
5 or 95%
10 or 90%
20 or 80%
30 or 70%
40 or 60%
50%
Percentages found from sample (‘results’)Sample size (N)
So, to halve the CI it is necessary to increase the sample fourfold.
Slide 10.17
Veal, Research Methods for Leisure and Tourism, 3rd edition © Pearson Education Limited 2006
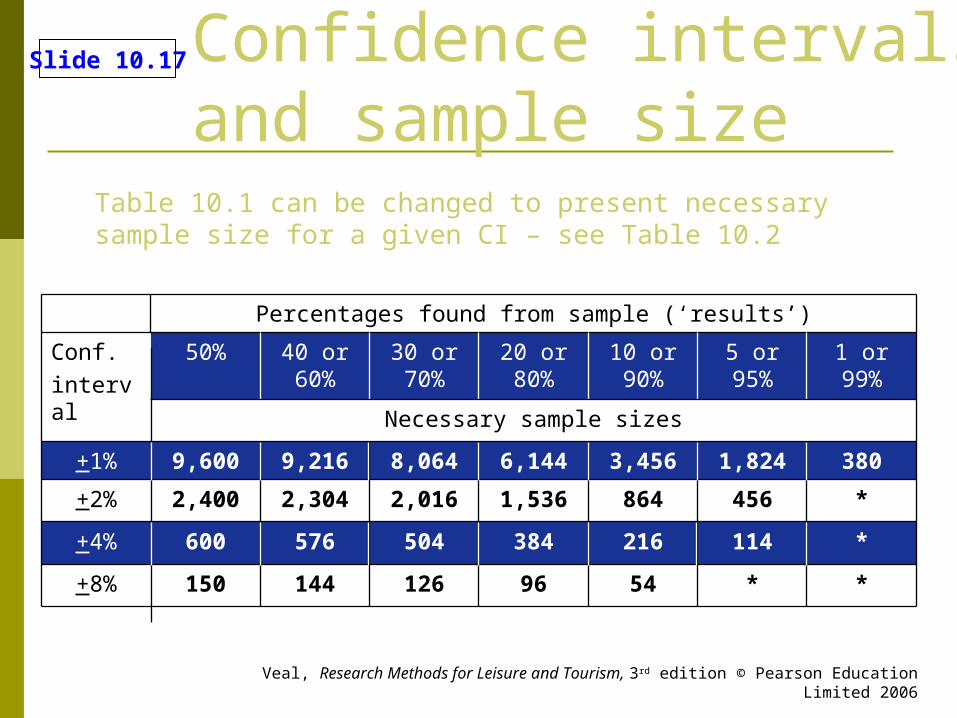
Confidence intervals and sample size
Table 10.1 can be changed to present necessary sample size for a given CI – see Table 10.2
**5496126144150+8%
*114216384504576600+4%
*4568641,5362,0162,3042,400+2%
3801,8243,4566,1448,0649,2169,600+1%
Necessary sample sizes
1 or 99%
5 or 95%
10 or 90%
20 or 80%
30 or 70%
40 or 60%
50%Conf.interval
Percentages found from sample (‘results’)

Slide 10.18
Veal, Research Methods for Leisure and Tourism, 3rd edition © Pearson Education Limited 2006
2. Sample size – level of detail of analysis
23.7 – 36.3
14.5 – 25.5
Range, %
Ranges overlap
Comment
+6.3
+5.5
CI
30Tennis
20Bowling200
%Sample size

Slide 10.19
Veal, Research Methods for Leisure and Tourism, 3rd edition © Pearson Education Limited 2006
2. Sample size – level of detail of analysis (contd.)
The larger sample allows greater precision.
26.0 – 34.0+4.030Tennis
16.5 – 23.5
23.7 – 36.3
14.5 – 25.5
Range, %
Ranges do not overlap
Ranges overlap
Comment
+3.5
+6.3
+5.5
CI
20Bowling500
30Tennis
20Bowling200
%Sample size

Slide 10.20
Veal, Research Methods for Leisure and Tourism, 3rd edition © Pearson Education Limited 2006
3. Sample size - budget Key issue: halving the CI requires fourfold
increase in sample size For example, N = 250 CI for 50% = +6.2
Survey cost = 200 x $20 = $4,000
N = 1,000 CI for 50% = +3.1
Survey cost = 1,000 x $20 = $20,000
If resources are not available for adequate sample size, consider: Pilot/exploratory study Qualitative study.

Slide 10.21
Veal, Research Methods for Leisure and Tourism, 3rd edition © Pearson Education Limited 2006
Sample size – reporting Readers of research reports should be alerted to
problems of confidence intervals – See Appendix 10.1 for suggested format
Researchers should take account of confidence intervals and indicate when differences are not statistically significant.

Slide 10.22
Veal, Research Methods for Leisure and Tourism, 3rd edition © Pearson Education Limited 2006
Sample size – small populations CIs are affected by population size if the
population is less than 50,000 See Table 10.3.

Slide 10.23
Veal, Research Methods for Leisure and Tourism, 3rd edition © Pearson Education Limited 2006
Sample size small populations – Table 10.3
+1%+5%
9980100
9062781000
3,2883575000
4,89937010,000
8,05638150,000
383
384
384
384
384
8,761100,000
9,422500,000
9,5111 million
9,5845 million
9,602Infinite
Minimum sample size to achieve CI of +5% or +1% on a sample finding of 50%
Population size

Slide 10.24
Veal, Research Methods for Leisure and Tourism, 3rd edition © Pearson Education Limited 2006
D. WeightingTable 10.4 Interview/usage data from a site/visitor survey

Slide 10.25
Veal, Research Methods for Leisure and Tourism, 3rd edition © Pearson Education Limited 2006
D. Weighting Table 10.5 (contd.)

Slide 10.26
Veal, Research Methods for Leisure and Tourism, 3rd edition © Pearson Education Limited 2006
E. Sampling and qualitative research
Statistical representativeness not claimed, but Sample is often claimed to represent wide range of
groups/situations Purposive sampling is often undertaken to ensure
wide range

Slide 10.27
Veal, Research Methods for Leisure and Tourism, 3rd edition © Pearson Education Limited 2006
Types of qualitative sampling– Table 10.6
Convenience Use of conveniently located persons or organisations – for example, friends, colleagues, students, organisations in the neighbourhood, tourists visiting a local popular attraction.
Criterion Individuals selected on the basis of a key criterion – for example, age-group, membership of an organisation, purchasers of souvenirs.
Homogeneous
Deliberately selecting a relatively homogeneous sub-set of the population – for example, university-educated male cyclists aged 20–30.
Opportunistic Similar to 'convenience' but involves taking advantages of opportunities as they arise – for example, studying major sporting event taking place locally, or a holiday resort the researcher is holidaying at.

Slide 10.28
Veal, Research Methods for Leisure and Tourism, 3rd edition © Pearson Education Limited 2006
Types of qualitative sampling – Table 10.6 (contd.)
Maximum variation
Deliberately studying contrasting cases. Opposite of 'homogeneous'.
Purposeful Similar to 'criterion' but may involve other considerations, such as 'maximum variation', typicality.
Stratified purposeful
Selection of a range of cases based on set criteria, for example, representatives of a range of age-groups or nationalities.

Slide 10.29
Veal, Research Methods for Leisure and Tourism, 3rd edition © Pearson Education Limited 2006
Summary A sample is selected from a population. A sample that is not representative of the population is biased. Random sampling seeks to provide a representative sample
and to minimise bias. Practical problems of achieving random sampling vary with the
type of survey. Three criteria for determining sample size: the level of precision
of results, the level of detail in the proposed analysis, and the budget.
The level of precision of results depends on the confidence intervals (CIs) which vary according to sample size.
Halving the CI requires a fourfold increase in sample size. When certain characteristics of the population are known (e.g.
the age/sex structure), weighting can be used to correct any lack of representativeness in the sample.
In qualitative research, samples are not statistically representative but may aim at a broad representativeness.