Embed Size (px)
Citation preview

Slide created by The Natural Edge Project for presentation to the Griffith Business School Sustainability Series, 06 November 2008
Charlie HargrovesExecutive Director,The Natural Edge ProjectResearch Fellow, Griffith University
“The cost of inaction: reducing greenhouse gas emissions.”

Slide created by The Natural Edge Project for presentation to the Griffith Business School Sustainability Series, 06 November 2008

Slide created by The Natural Edge Project for presentation to the Griffith Business School Sustainability Series, 06 November 2008
The 1971 Keeling Curve: Atmospheric CO2 as measured at Mauna Loa Observatory
Source: Study of Man's Impact on Climate (SMIC), Stockholm, edited by Carroll L. Wilson and William H. Matthews

Slide created by The Natural Edge Project for presentation to the Griffith Business School Sustainability Series, 06 November 2008
1999 Plot of CO2 Concentrations and Temperature from 400,000 years ago to 1950Petit, J, et al (1999) Climate and Atmospheric History of the Past 420,000 years from
the Vostok Ice Core, Antarctica, Nature 399, pp 429-436.

Slide created by The Natural Edge Project for presentation to the Griffith Business School Sustainability Series, 06 November 2008
Average Global Temperature Record (IPCC Climate Change 2007: The Physical Basis - Summary for Policy Makers).

Slide created by The Natural Edge Project for presentation to the Griffith Business School Sustainability Series, 06 November 2008
1999 Plot of CO2 Concentrations and Temperature from 400,000 years ago to 1950Source: Petit, J, et al (1999) Climate and Atmospheric History of the Past 420,000 years from
the Vostok Ice Core, Antarctica, Nature 399, pp 429-436.

Slide created by The Natural Edge Project for presentation to the Griffith Business School Sustainability Series, 06 November 2008
Global Warming Predictions from an average of 3 degree global averageSource: Modelled using the HadCM3 (Hadley Centre Coupled Model, Version 3)

Slide created by The Natural Edge Project for presentation to the Griffith Business School Sustainability Series, 06 November 2008
Stabilisation levels and probability ranges for temperature increasesSource: Stern, N et al. (2006) The Stern Review: The Economics of Climate Change,
Cambridge University Press, Cambridge. (Figure 13.4)

Slide created by The Natural Edge Project for presentation to the Griffith Business School Sustainability Series, 06 November 2008

Slide created by The Natural Edge Project for presentation to the Griffith Business School Sustainability Series, 06 November 2008
Projected Australian temperature change 2000-2100Source: CSIRO (http://www.climatechangeinaustralia.gov.au/resources.php)

Slide created by The Natural Edge Project for presentation to the Griffith Business School Sustainability Series, 06 November 2008
Projected Australian rainfall change 2000-2100Source: CSIRO (http://www.climatechangeinaustralia.gov.au/resources.php)

Slide created by The Natural Edge Project for presentation to the Griffith Business School Sustainability Series, 06 November 2008
Climate change impacts on AustraliaSource: Summary from Preston, B.L. and Jones R.N. (2006) Climate Change Impacts on Australia
and the Benefits of Early Action to Reduce Global Greenhouse Gas Emissions, CSIRO.

Slide created by The Natural Edge Project for presentation to the Griffith Business School Sustainability Series, 06 November 2008
What about the financial costs?

Slide created by The Natural Edge Project for presentation to the Griffith Business School Sustainability Series, 06 November 2008
Gross Domestic Product vs. Estimated Environmental Costs (billions) for the United States of America from 1950-2004.Source: Data sourced from Talberth, J et al (2006)

Slide created by The Natural Edge Project for presentation to the Griffith Business School Sustainability Series, 06 November 2008
Estimates of the costs of global warming in the United States Source: Stockholm Environment Institute (2008) The Cost of Climate Change What We’ll Pay if
Global Warming Continues Unchecked, Tuffs University.
Slide created by The Natural Edge Project for presentation to the Griffith Business School Sustainability Series, 06 November 2008

Slide created by The Natural Edge Project for presentation to the Griffith Business School Sustainability Series, 06 November 2008
“The costs of action to the global economy would be roughly 1 percent of GDP, while the costs of inaction
could be from 5-20 percent of GDP… The investment that
takes place in the next 10-20 years will have a profound effect on the climate in the
second half of this century and the next.”
The Stern Review, 2006

Slide created by The Natural Edge Project for presentation to the Griffith Business School Sustainability Series, 06 November 2008
Types of costs associated with climate changeSource: OECD (2008) Costs of Inaction on Key Environmental Challenges, OECD.

Slide created by The Natural Edge Project for presentation to the Griffith Business School Sustainability Series, 06 November 2008
Early Action on Climate Change Costs Less Than Delayed Action Source: Australian Business Roundtable on Climate Change (2006)

Slide created by The Natural Edge Project for presentation to the Griffith Business School Sustainability Series, 06 November 2008
Conceptual and stylised representation of risks and benefits of transition strategiesSource: TNEP (2008)

Slide created by The Natural Edge Project for presentation to the Griffith Business School Sustainability Series, 06 November 2008
How can we reduce costs?

Slide created by The Natural Edge Project for presentation to the Griffith Business School Sustainability Series, 06 November 2008
Conceptual and stylised representation of a decoupling graphSource: TNEP (2008)

Slide created by The Natural Edge Project for presentation to the Griffith Business School Sustainability Series, 06 November 2008
Decoupling Progress in the Netherlands 1990 – 2005Source: Netherlands Environmental Assessment Agency (2007)
Slide created by The Natural Edge Project for presentation to the Griffith Business School Sustainability Series, 06 November 2008
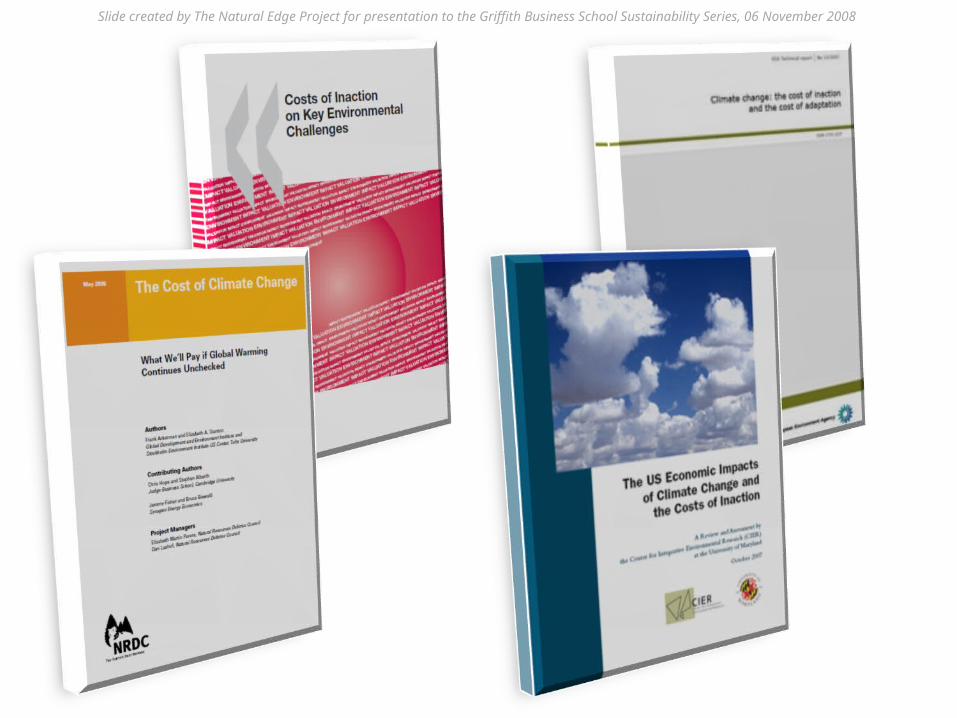
Conceptual and stylised representation of waves of innovationSource: TNEP (2005)

Slide created by The Natural Edge Project for presentation to the Griffith Business School Sustainability Series, 06 November 2008
McKinsey Carbon Abatement Cost Curve, 1991Source: Cited in MacNeill, J. (1991) Beyond Interdependence, Oxford University Press, New York.

Slide created by The Natural Edge Project for presentation to the Griffith Business School Sustainability Series, 06 November 2008
McKinsey Australian Carbon Abatement Cost Curve, 2007Source: McKinsey Consulting (2007) An Australian Cost Curve for Greenhouse Gas Reduction,
McKinsey Consulting.

Slide created by The Natural Edge Project for presentation to the Griffith Business School Sustainability Series, 06 November 2008
Queensland Energy Consumption comparisonsSource: ABARE Data (2003)

Slide created by The Natural Edge Project for presentation to the Griffith Business School Sustainability Series, 06 November 2008

Slide created by The Natural Edge Project for presentation to the Griffith Business School Sustainability Series, 06 November 2008
Marginal and total costs of inactionSource: OECD (2008) Costs of Inaction on Key Environmental Challenges, OECD.

Slide created by The Natural Edge Project for presentation to the Griffith Business School Sustainability Series, 06 November 2008
BAU emissions and stabilisation trajectories for 450 - 550ppm CO2eSource: Stern, N et al. (2006) The Stern Review: The Economics of Climate Change,
Cambridge University Press, Cambridge. (Figure 8.3)

Slide created by The Natural Edge Project for presentation to the Griffith Business School Sustainability Series, 06 November 2008
Illustrative Emissions Paths to StabilisationSource: Stern Review (2006), generated with the SiMCaP EQW model and averaged over multiple
scenarios (Meinshausen et al. 2006)

Slide created by The Natural Edge Project for presentation to the Griffith Business School Sustainability Series, 06 November 2008
Illustrative emissions paths to stabilise at 550ppm CO2e.
Source: Stern, N. (2006)

Slide created by The Natural Edge Project for presentation to the Griffith Business School Sustainability Series, 06 November 2008
Contraction and convergence for different countries with ‘head room’ for the rapidly developing economies: a stylised, illustrative scenario
Source: Garnaut Interim Report (2008)

Slide created by The Natural Edge Project for presentation to the Griffith Business School Sustainability Series, 06 November 2008
Credit: Jocke Berglund, Fotoflyget, Skandinavien

Slide created by The Natural Edge Project for presentation to the Griffith Business School Sustainability Series, 06 November 2008
What is TNEP doing?

Slide created by The Natural Edge Project for presentation to the Griffith Business School Sustainability Series, 06 November 2008

Slide created by The Natural Edge Project for presentation to the Griffith Business School Sustainability Series, 06 November 2008
“We have learned a lot of lessons since Natural Capitalism came out in
1999, that I think will make the next
explications of this subject even more
powerful and effective, so working with our
Natural Project Edge collaborators I think
shows great promise, these are very diligent
and well informed people that I think are
doing valuable work and we are looking
forward to cooperating with them in ways that will help us all to learn
faster and get more done better.” Amory Lovins
“The authors of this book [have] the energy, insight and commitment to begin the discussion of what I call ‘the ultimate integration’; that is, integration of the concepts of competitiveness and Natural Capitalism.” Michael Fairbanks
“Within these pages you will see that there is reason for robust hope, and as you read, we hope you will be inspired to contribute to this magnificent re-evolution of human enterprise” William McDonough
Slide created by The Natural Edge Project for presentation to the Griffith Business School Sustainability Series, 06 November 2008
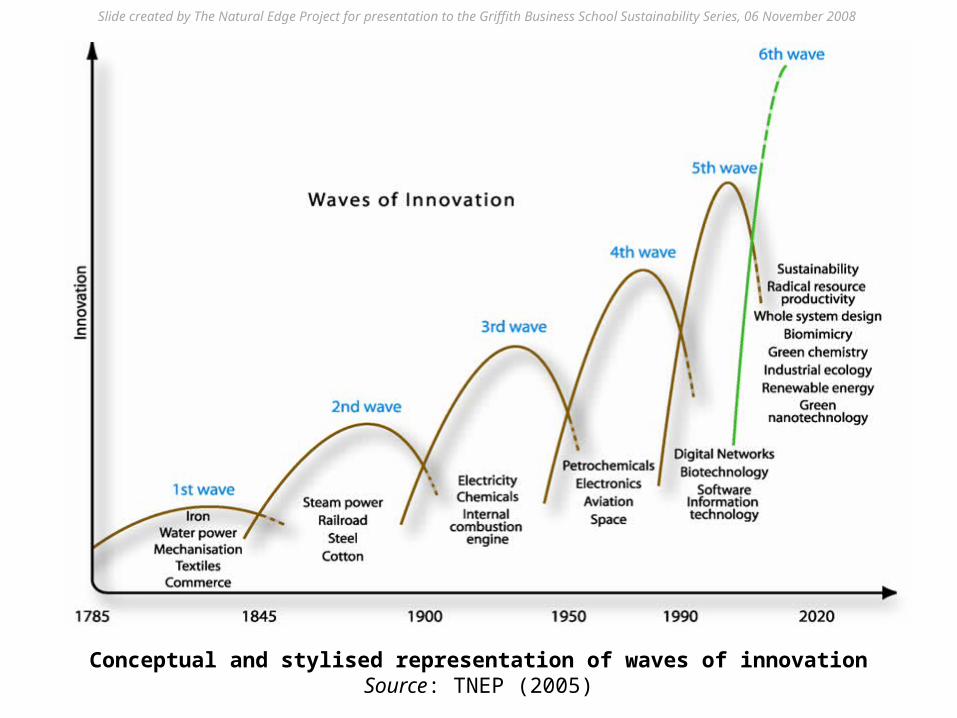
"I was thrilled and impressed reading this manual that features the integrated approach towards resource productivity and, ultimately, sustainability both at small and large scale.” Ernst Ulrich von Weizsäcker
“The authors, in producing this
introductory, technical, teaching material and
these important examples, have
provided a publication which can, and must, be
widely used in our university and technical
training institutions.”Barry J. Grear AO

Slide created by The Natural Edge Project for presentation to the Griffith Business School Sustainability Series, 06 November 2008
"This Sustainable Energy Solutions
Portfolio by The Natural Edge Project will help
ensure all engineers and built environment professionals can
rapidly update their skills and knowledge on
renewable energy and energy efficiency
practice.”Dr Mike Dennis
ANU Engineering Department
"The work of the Natural Edge project makes me feel optimistic. This team of four young engineers with an extraordinary set of global networks has produced a three-part bible on how to reduce your emissions. It's enormous, but don't be put off by the size. It's designed so that you only need to read the chapters that relate to your business."Alexandra De Blas, ABC Science Show

Slide created by The Natural Edge Project for presentation to the Griffith Business School Sustainability Series, 06 November 2008
"I commend the team from The Natural Edge
Project and their partners for
undertaking to develop a response to 'Our
Common Future' to mark its 20th anniversary."
Gro Harlem Brundtland
“The Natural Edge Project is to be commended for tackling this vitally important issue and highlighting where in the world already communities, regions and nations are creating solutions to this great challenge of our time.” R.K. Pachauri

Slide created by The Natural Edge Project for presentation to the Griffith Business School Sustainability Series, 06 November 2008

Slide created by The Natural Edge Project for presentation to the Griffith Business School Sustainability Series, 06 November 2008
Shanghai Century
Publishing